Embed Size (px)
Citation preview

Multimodal Analysis in the 2010 Highway Capacity Manual It’s not just cars anymore!
Jamie Parks, AICP HCAT Conference
May 9-10, 2011
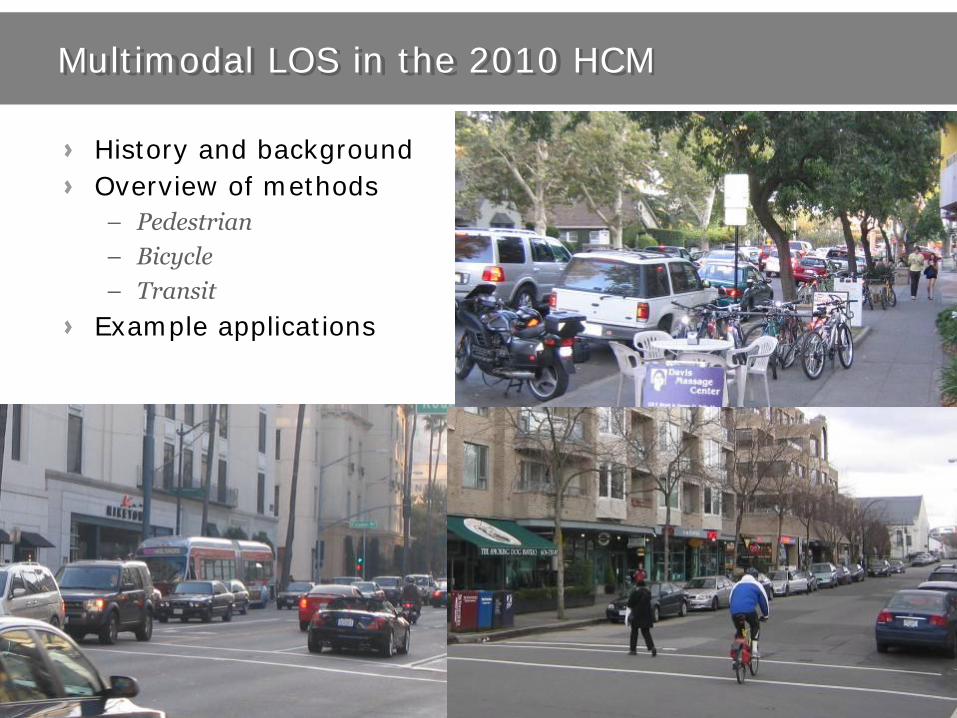
Multimodal LOS in the 2010 HCM
History and background
Overview of methods
– Pedestrian
– Bicycle
– Transit
Example applications

Multimodal LOS in the 2010 HCM
History and background
Overview of methods
– Pedestrian
– Bicycle
– Transit
Example applications

Level of Service
Describes user perceptions of transportation facilities
– A-F scale
Defined in the Highway Capacity Manual (HCM)
Many jurisdictions require LOS analysis for transportation studies
– What’s measured matters!

Why Measure Level of Service?
Provides a consistent, systematic evaluation of existing conditions
Puts results in terms that transportation professionals and the public can understand
Provides an objective way to identify needs and prioritize improvements
Provides a way to evaluate different improvement types and cross sections

Multimodal Analysis in the HCM: 1950 - 1985 Manuals
1950 HCM
– Streetcars and buses impact vehicle capacity at traffic signals
– Pedestrian impacts on vehicle capacity addressed indirectly
1965 HCM
– LOS concept introduced
– Short (11-page) chapter on bus transit, with little quantitative info
1985 HCM
– Pedestrian and bicycle chapters introduced

History of Multimodal Analysis in the HCM: HCM2000
Expanded pedestrian chapter
– Service measures: space per pedestrian, average delay, average travel speed
Expanded bicycle chapter
– Service measures: average travel speed, average delay, hindrance
Revised transit chapter
– Four passenger-oriented service measures: frequency, hours of service, passenger load, reliability

NCHRP 3-92 – Production of the 2010 HCM
HCM’s 5th Major Revision (1950, 1965, 1985, 2000)
Project began in October 2007
2010 HCM shipped in March 2011
Significant changes:
– Integrated Multimodal Approach
– Multi-volume re-organization
– Incorporates New Research
– Increased Emphasis of Alternative Tools

HCM Focus Group Findings
Many jurisdictions don’t require multimodal analyses
– Therefore, they are not performed
Jurisdictions that do want to perform bike/ped analyses don’t find the current HCM capacity-based measures useful
– Maryland & Florida use measures of user comfort
Most bike & ped facilities don’t have capacity issues
– No need to analyze them using HCM procedures

10
Multimodal LOS Measure Issues
Current HCM method focuses on speed, delay, and space
NCHRP 3-70 research (and intuition) suggest these aren’t the key factors
Auto volumes highly important to bike & ped service quality
HCM 2010 considers a broader range of factors for ped and bike analysis
HCM2000: Ped LOS A HCM2000: Ped LOS D

11
2010 HCM Approach
Focus on the traveler perspective
– Quality of Service: perception of how well a facility operates from traveler perspective
Allow evaluation of intermodal interactions and trade-offs
Mode Affected
Impacting Mode
Auto Ped Bike Transit
Auto
Auto & HV volumes Turning patterns
Lane configurations
Minimum green time Turn conflicts
Mid-block crossings
Turn conflicts
Passing delay
Heavy vehicle
Blocking delay
Signal priority
Ped
Auto & HV volumes Cycle length
Driver yielding Turn conflicts
Traffic separation
Sidewalk crowding Crosswalk crowding
Cross-flows
Shared-path conflicts
Bicyclist yielding
Heavy vehicle
Transit stop queues
Stop cross-flows Vehicle yielding
Bike
Auto & HV volumes
Auto & HV speed
On-street parking
Turn conflicts
Traffic separation
Shared-path conflicts
Min. green time
Turn conflicts Mid-block xings
Bike volumes
Heavy vehicle
Blocking delay Tracks
Transit Auto volumes
Signal timing
Ped. env. quality Minimum green time
Turn conflicts
Mid-block crossings
Bike env. quality
Bike volumes Bus volumes

Multimodal LOS in the 2010 HCM
History and background
Overview of methods
– Pedestrian
– Bicycle
– Transit
Example applications

Traveler-Perception Models
Recent research has quantified traveler perceptions of multimodal facilities to develop QOS indexes
– Indexes incorporate multiple factors (e.g., volumes, lane widths, etc.)
Models allow more service-quality factors to be considered than traditional HCM measures
Models set LOS thresholds based on survey responses to actual conditions
Anticipated that future research will develop similar indexes for other facilities (e.g. roundabouts)

Perception Models
LOS based on a weighted index
– Combination of multiple variables
– Example:
Ped Signal LOS = 0.00569 (RTOR+PermLefts) + 0.00013 (TrafVol x
TrafSpeed) + 0.0681 (# LanesCrossed 0.514) + 0.0401ln(PedDelay) –
RTCI (0.0027PerpTrafVol – 0.1946) + 1.7806
LOS Ped LOS Score
A ≤2.00
B >2.00–2.75
C >2.75–3.50
D >3.50–4.25
E >4.25–5.00
F >5.00

15
Service Measures in the 2010 HCM
System Element Service Measure Provided
Chapter Auto Ped Bike Transit
Freeway Facility 10
Basic Freeway Segment 11
Freeway Weaving Segment 12
Fwy. Merge/Diverge Seg. 13
Multilane Highway 14
Two-Lane Highway 15
Urban Street Facility 16
Urban Street Segment 17
Signalized Intersection 18
Two-Way Stop 19
All-Way Stop 20
Roundabout 21
Interchange Ramp Term. 22
Off-Street Ped-Bike Facility 23
- Based on traditional service measure
- Based on traveler perception index

Multimodal LOS Defined for Urban Streets
MMLOS measures the degree to which the urban street design and operations meets the needs of each mode’s users
Four level of service results for the street:
– Auto, Transit, Bicycle, Pedestrian
A combined LOS is not calculated
Conceptual MMLOS Results
Mode AM Peak PM Peak
Auto C E
Transit B C
Bicycle D C
Pedestrian C D

17
MMLOS Urban Street Applications
Segments
– All four modes
Signalized Intersections
– Auto, ped and bike mode
Facility
– All four modes
segment facility

Multimodal LOS in the 2010 HCM
History and background
Overview of methods
– Pedestrian
– Bicycle
– Transit
Example applications

LOS A LOS B LOS C
LOS D LOS E LOS F
Pedestrian LOS in the 2000 HCM

Pedestrian LOS in the 2000 HCM
What does it not include?
– Motor vehicle traffic volume
– Traffic speed
– Intersection delay
– Separation from traffic
– Adjacent land uses
– Driver yielding behavior
Pedestrian HCM 2000 material retained, but supplemented

LOS at Unsignalized Crossings
Estimates pedestrian delay
Allows consideration of different crossing treatments
Based on 4 factors – Traffic volume - # of lanes crossed
– Crossing distance - Motorist yield rate

LOS at Unsignalized Crossings
Example:
2-lane arterial with marked crosswalk, but nobody is yielding… Inputs: 1,000 peak-hour vehicles
2 lanes crossed 30 feet crossing distance 10% yield rate
Output: Average delay = 44 seconds
Ped LOS = E

LOS at Unsignalized Crossings
Example (cont.):
Install rapid-flash beacons to improve driver compliance…
Inputs: 1,000 peak-hour vehicles
2 lanes crossed
30 feet crossing distance
80% yield rate
Output: Average delay = 6 seconds
Ped LOS = B

24
Pedestrian LOS: Urban Street Segments
Factors include:
– Outside travel lane width (+)
– Bicycle lane/shoulder width (+)
– Buffer presence (e.g., on-street parking, street trees) (+)
– Sidewalk presence and width (+)
– Volume and speed of motor vehicle traffic in outside lane (-)
Pedestrian density considered separately
Worse of density LOS/ segment LOS used to determine LOS

25
Pedestrian LOS: Signalized Intersections
Factors include:
– Permitted left turn and right-turn-on-red volumes (-)
– Cross-street motor vehicle volumes and speeds (-)
– Crossing length (-)
– Average pedestrian delay (-)
– Right-turn channelizing island presence (+)

Multimodal LOS in the 2010 HCM
History and background
Overview of methods
– Pedestrian
– Bicycle
– Transit
Example applications

Common Factors Affecting Cyclists
Proximity of bicyclist to motor vehicles
Speed of traffic
Volume of motor vehicle traffic
Percent heavy vehicles
Pavement condition

28
Bicycle LOS: Urban Street Segments
Factors include:
– Volume and speed of traffic in outside travel lane (-)
– Heavy vehicle percentage (-)
– Pavement condition (+)
– Bicycle lane presence (+)
– Bicycle lane, shoulder, and outside lane widths (+)
– Number of driveways (-)
– On-street parking presence and utilization (+/-)

29
Bicycle LOS: Signalized Intersections
Factors included:
– Width of outside through lane and bicycle lane (+)
– Cross-street width (-)
– Motor vehicle traffic volume in the outside lane (-)

Bicycle LOS E
• No shoulder • 12.5 foot lane • 50 MPH • 2 lanes, undivided • 8,000 ADT • 7% trucks

Bicycle LOS B
• 9.5 foot shoulder • 12 foot lane • 45 MPH • 2 Lanes, undivided • 17,000 ADT • 8% Trucks

Bicycle LOS – Road Diet Example
ADT = 13,500 vpd
Lanes = 2
Pavement = 4 (good)
Wt = 12 ft
Wl = 0 ft
Speed = 30 mph
12' 12' 12' 12'
48'
BLOS Evaluation:
LOS score Category
3.58 D
48'
12'14'12'5' 5'
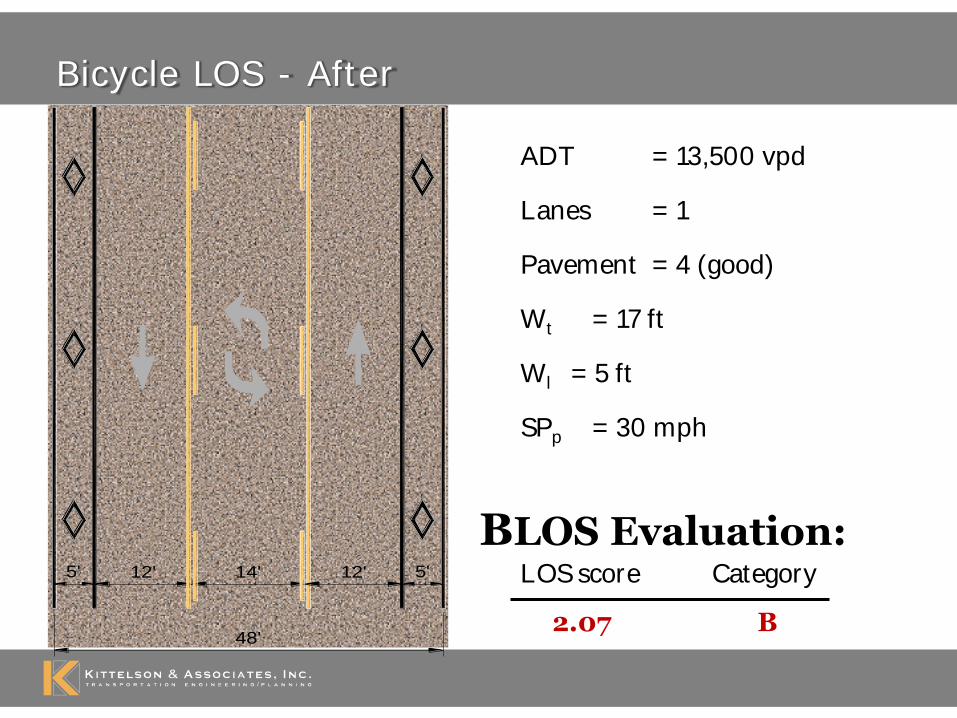
Bicycle LOS - After
ADT = 13,500 vpd
Lanes = 1
Pavement = 4 (good)
Wt = 17 ft
Wl = 5 ft
SPp = 30 mph
LOS score Category
2.07 B
BLOS Evaluation:

Bicycle LOS Model Notes
Heavily dependent on shoulder/bike lane width
Based on perceptions of typical bicyclist
– Cyclists are diverse
Represents typical conditions, not anomalies
Does not include slope
Does not capture emerging facility types
– Shared lane markings
– Colored pavement
– Bike boxes
– Cycle tracks

Shared-Use Path Bicycle LOS
Calibrated user perception index for bikes on shared-use paths
4 key variables:
– # of “meeting events” with other users
– # of delayed passing attempts
– Path width
– Presence of centerline

Shared-Use Path LOS
Uses volumes of user types to estimate meetings and passings
– Based on assumed speed distributions for each user type
– Procedure is complex, but Excel calculator is available

Multimodal LOS in the 2010 HCM
History and background
Overview of methods
– Pedestrian
– Bicycle
– Transit
Example applications

2010 HCM Transit Objectives
New transit LOS measure desired
– Single measure to facilitate comparisons with other modes and for compatibility with HCM
– LOS thresholds tied to user satisfaction
- LOS grades mean the same thing across modes
– Opportunity for comparing impacts of other modes, where impacts exist

Approach
Develop a model that relates LOS to factors that:
– Have been shown to be important to customer satisfaction
– Can be readily quantified
– Can be related to ridership, or changes in ridership
The more satisfying the service, the more likely people are to use it
– Based on on-board survey results showing important factors
Rank
Summary of On-Board Survey Factors
Virginia 2B Virginia 38B Portland 14 Portland 44 Florida 18
1 Frequency Frequency Frequency Frequency Frequency
2 Wait time Reliability Close to home Reliability Wait time
3 Reliability Wait time Reliability Close to home Close to home
4 Close to home Close to dest. Wait time Close to dest. Reliability
5 Service span Close to home Close to dest. Wait time Service span
6 Close to dest. Service span Service span
7 Friendly drivers
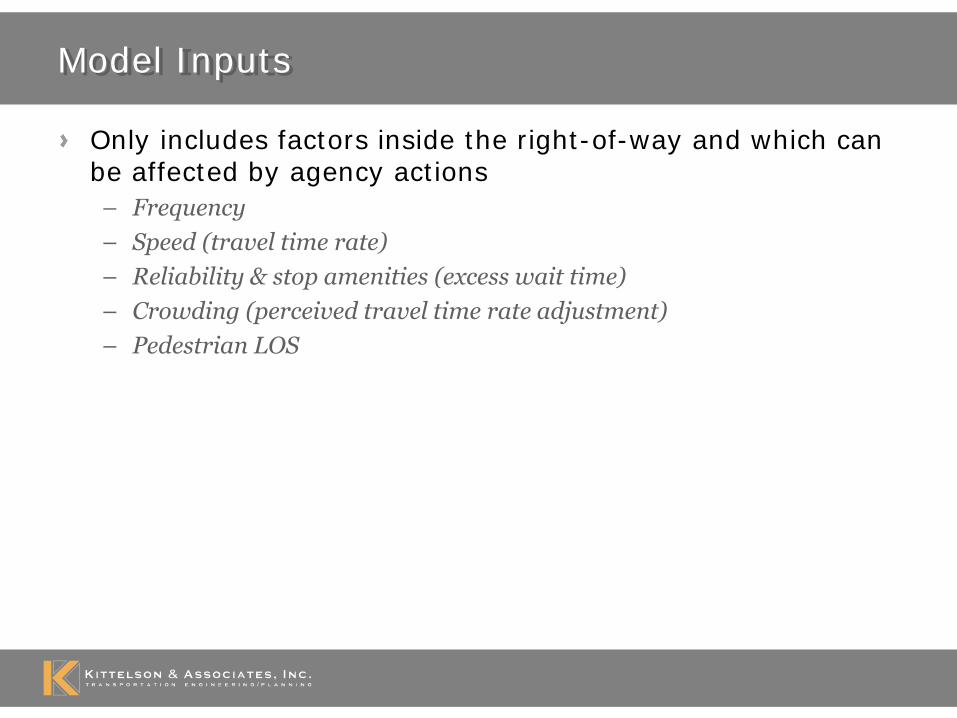
Model Inputs
Only includes factors inside the right-of-way and which can be affected by agency actions
– Frequency
– Speed (travel time rate)
– Reliability & stop amenities (excess wait time)
– Crowding (perceived travel time rate adjustment)
– Pedestrian LOS

Model Output
Transit LOS score
– A function of:
- Transit wait/ride score (weighted 89%)
- Pedestrian LOS (weighted 11%)
– Addresses all three trip components
– Weightings based on on-board survey results that found that walk-to-the-stop satisfaction accounted for 11% of overall satisfaction
Details in NCHRP Report 616

Example Application: Portland

Multimodal LOS in the 2010 HCM
History and background
Overview of methods
– Pedestrian
– Bicycle
– Transit
Example applications

Data Requirements
Typical Transportation Analysis Data Collection Efforts – Peak Hour Traffic Counts
- Passenger Vehicles
- Pedestrians
- Bicycles
- Heavy Vehicles
– Roadway Inventory - Sidewalks
- Bicycle Lanes
- Transit Stops/Amenities
- Transit Schedule
- Posted Roadway Speed
- Roadway Cross-Section
- Median Treatment
- Illumination
– Signalized Intersection Data - Signal Timing Sheets
- Signal Phasing
- Right-turn on Red
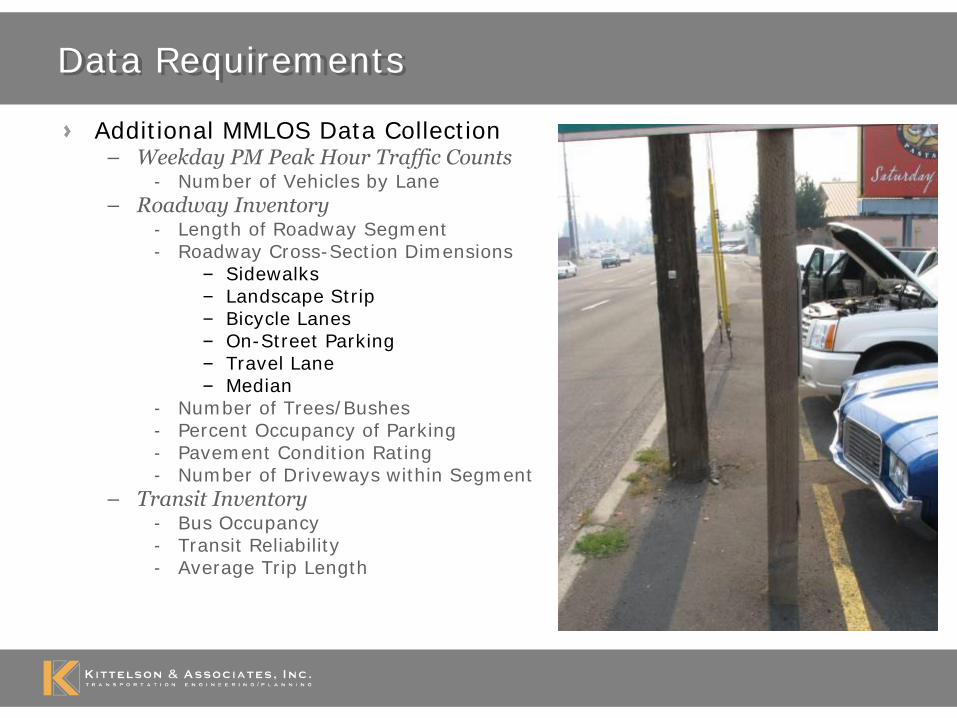
Data Requirements
Additional MMLOS Data Collection – Weekday PM Peak Hour Traffic Counts
- Number of Vehicles by Lane
– Roadway Inventory - Length of Roadway Segment - Roadway Cross-Section Dimensions
– Sidewalks – Landscape Strip – Bicycle Lanes – On-Street Parking – Travel Lane – Median
- Number of Trees/Bushes - Percent Occupancy of Parking - Pavement Condition Rating - Number of Driveways within Segment
– Transit Inventory - Bus Occupancy - Transit Reliability - Average Trip Length

Example – NoMa Transportation Plan
Rapidly developing neighborhood near downtown DC
Project for DDOT to proactively and strategically prepare for change
– Improve safety, comfort, and efficiency of all transportation modes

MMLOS in NoMa
Proposed modifications included:
– Lane reductions
– 2-way to 1-way couplets
– Bike lanes
– Sidepaths/cycle tracks
– Sidewalk widening

Analysis
Applied to 6 key corridors
– Analyze existing and no build conditions
– Assess the impacts of proposed cross-sections
– Demonstrate benefits to stakeholders
Used “research” quality spreadsheet
– Analysis will be easier with software

Example: K Street
No Build
– High traffic volumes
– No bike lane
– Peak-hour restricted parking
– Ped LOS = D
– Bike LOS = D

Build (One-way conversion)
– Dedicated bike facility
– No sidewalk widening
– Ped LOS = D
– Bike LOS = B
Example: K Street

Results
Do nothing and LOS gets worse
Proposed cross-sections have significant multi-modal benefits
Bicycle LOS Pedestrian LOS

Example 2: Russell Street, Missoula, Montana
1.5 Mile-long Study Area 1 of 5 Bridge Crossings 2/3 lane cross section with limited pedestrian/bicycle facilities 20,000 – 25,000 ADT Important bike commute route Commercial and residential uses
3rd St
14th St Mount Ave
5th St
Broadway St N
Ru
ss
ell
St

53
Alternative Analysis – Cross-section and Traffic Control

Bicycle, Pedestrian, and Transit LOS Summary
Overall LOS for Alternatives and Options
DEIS Alternatives
Alt 1 – No Build
Existing 3 Lane
Volumes 5 Lane
Volumes Alt 2 Alt 3 Alt 4 Alt 5-R Option 6
Bike LOS - Southbound F F F F F E E F
Bike LOS – Northbound F F F F F E E F
Ped LOS - Southbound D D E C C C C D
Ped LOS – Northbound D D D C C C C C
Transit LOS - Southbound D D D D D D D D
Transit LOS – Northbound D D D D D D D D
Legend
LOS = A, B, or C
LOS = D
LOS = E or F

Overall Analysis Summary
DEIS Alternatives
Alt 1 (No Build)
Performance Measure 3-Lanes 5-Lanes Alt 2 Alt 3 Alt 4 Alt 5-R Option 6
Intersection Operations (LOS) 6 7 3 3 1 2 5
Corridor Operations (Travel Time) 2 3 4 4 1 4 7
Safety (Predicted Average Crash Frequencies)
6 7 2* 1* 4 3 5
Pedestrian LOS 6 7 3 3 1 1 5
Bicycle LOS 5 7 3 3 1 2 6
Transit LOS 2 2 1 1 1 1 1
* Best ranking due in large part to lower traffic volume scenario (3 lane demand versus 5 lane demand).

MMLOS Sample: NE 3rd Street (Business 97)
Five-Lane Cross-Section
Posted Speed of 35 mph
Bicycle Lanes
Curb-tight Sidewalks
Multiple Driveways Throughout
Long Traffic Signal Cycle Lengths
ADT Approximately 20,500
– 5.4% Trucks (AM)
– 3.5% Trucks (PM)
85-Foot Cross-Section
BAT Route 1
– 40-Minute Headways
– No Shelters or Benches

Data Forms: Segment Data

Data Forms: Roadway Cross-Section

Data Forms: Traffic Data

Data Forms: Transit Data

Analysis Results: Existing 3rd Street Section

3rd Street Strategies and Goals
Freight Route?
Primary Regional Connection?
Primary Transit Route?
Pedestrian Corridor?
Bicycle Corridor?

Cross-Section Option 1: Increased ROW

Cross-Section Option 2: Removal Of Bicycle Lanes

Cross-Section Option 3: Removal of Travel Lane

Cross-Section Option 4: Transit Improvements

Cross-Section Option 5: Access Management

Summary of Options

Other – Effect of Lane Widths on Capacity
Saturation flow rate the same for10-foot and 12-foot lanes – No capacity-basis for denying 10-foot lanes
Lane Width
Sat. Flow Adj. Factor
9 0.90
10 0.93
11 0.97
12 1.00
13 1.03
14 1.07
Lane Width
Sat. Flow Adj. Factor
< 10 0.96
10 – 12.9 1.00
≥ 13 1.04
HCM 2000 HCM 2010

HCM 2010 Summary
Non-auto modes will be integrated into the 2010 HCM far better than before
Urban street LOS method will facilitate ”complete streets” evaluations – Relative service quality provided for each mode’s travelers
– Trade-offs of different improvement alternatives or future demand scenarios can be evaluated

HCM 2010 Summary (cont...)
Provides agencies a way to quantify the relative benefits and disadvantages of roadway cross-section standards and design modifications
Provides a methodology for multi-modal performance standards or alternative mobility standards
Some important policy considerations: – Vehicular/Pedestrian/Bicycle/Transit Hierarchy?
– Multi-modal LOS standards?

Future Considerations
Address additional facilities – Roundabouts
– Ramp terminals
– Others
Incorporate emerging treatments – Cycle tracks
– Sharrows
– Others
Connect to safety research
Learn from practical applications!


![Transport Engineering [Highway capacity and level of Web viewTransport Engineering [Highway capacity and level of service] Transport Engineering [Highway capacity and level of service]](https://img.pdfslide.us/doc/110x75/5a71dd367f8b9a9d538d33ba/transport-engineering-highway-capacity-and-level-of-nbspdoc-fileweb.jpg)