Embed Size (px)
Citation preview

Multimedia Features for Click Prediction of New Ads in
Display Advertising
Haibin Cheng, Roelof van Zwol, Javad Azimi+, Eren ManavogluRuofei Zhang, Yang Zhou, Vidhya Navalpakkam
Yahoo! Labs, Santa Clara, CAOregon State University, Corvallis, OR+
{hcheng,roelof,erenm,rzhang,yangzhou,nvidhya}@[email protected]+
ABSTRACTNon-guaranteed display advertising (NGD) is a multi-billiondollar business that has been growing rapidly in recent years.Advertisers in NGD sell a large portion of their ad cam-paigns using performance dependent pricing models such ascost-per-click (CPC) and cost-per-action (CPA). An accu-rate prediction of the probability that users click on ads isa crucial task in NGD advertising because this value is re-quired to compute the expected revenue. State-of-the-artprediction algorithms rely heavily on historical informationcollected for advertisers, users and publishers. Click predic-tion of new ads in the system is a challenging task due to thelack of such historical data. The objective of this paper isto mitigate this problem by integrating multimedia featuresextracted from display ads into the click prediction models.Multimedia features can help us capture the attractivenessof the ads with similar contents or aesthetics. In this paperwe evaluate the use of numerous multimedia features (inaddition to commonly used user, advertiser and publisherfeatures) for the purposes of improving click prediction inads with no history. We provide analytical results gener-ated over billions of samples and demonstrate that addingmultimedia features can significantly improve the accuracyof click prediction for new ads, compared to a state-of-the-art baseline model.
Categories and Subject DescriptorsH.4 [Information Systems Applications]: Miscellaneous;D.2.8 [Software Engineering]: Metrics—complexity mea-sures, performance measures
KeywordsMultimedia Features, Image, Flash, Click Prediction, NewAds, Display Advertising, GMM
1. INTRODUCTION
Permission to make digital or hard copies of all or part of this work for
personal or classroom use is granted without fee provided that copies are
not made or distributed for profit or commercial advantage and that copies
bear this notice and the full citation on the first page. To copy otherwise, to
republish, to post on servers or to redistribute to lists, requires prior specific
permission and/or a fee.
KDD ’12 Beijing, China
Copyright 20XX ACM X-XXXXX-XX-X/XX/XX ...$10.00.
Display advertising generates revenue by showing graphi-cal ads on web pages. It is traditionally sold as a guaranteeddelivery (GD) contract, which constitutes a deal between apublisher and an advertiser to deliver a pre-specified num-ber of impressions over a certain period of time at a fixedprice per impression (CPM). An alternative mechanism fordelivery that has been growing in the recent years is spotmarkets, where the impressions are sold one at a time. Spotmarkets, such as Right Media Exchange (Yahoo), lets theadvertisers bid di↵erently for each impression, allowing themto use highly granular targeting methods. Most spot mar-kets also provide advertisers with a wider range of pricingmodels. Similar to GD, advertisers can choose to pay perimpression (CPM). However many advertisers would pre-fer to pay only if the ad attracted the user’s attention. Toaddress this concern, many NGD exchanges provide perfor-mance based pricing models such as pay-per click (CPC) andpay-per-conversion (CPA), which can be further categorizedas post-view or post-click, depending on there being a clickbefore the conversion event. In a marketplace where adswith di↵erent payment models are competing for the sameopportunity, the auction mechanism needs to convert thebids to a common currency. This is often done by comput-ing expected revenue (eCPM). For a CPM ad the expectedrevenue is obviously going to be the same as the bid. Fora CPC ad, however, the expected revenue depends on theprobability that the user will click on that ad. Similarly,the expected revenue of a post-view CPA ad depends on theprobability of conversion after the user views the ad; andfor post-click CPA the expected revenue calculation needsto take into account both the click and the conversion prob-ability. As a result, accurate prediction of click probabilityplays an important role in NGD advertising.
A state-of-the-art NGD system typically relies on machinelearning models to estimate the click probability of eligibleCPC/CPA ads. These models are trained using data col-lected from live systems. The identity of the users, publish-ers and ads are typically used as features in such models,together with some high level category information. For adsthat have been in the system for a long period of time, the es-timation of click probability using identifier based features isgenerally reliable, however it becomes a challenging problemfor new ads. Besides, identifier based features for advertis-ers fail to provide any information about the aesthetics orthe content of the ads, which is the key factor that the userresponds to.

This cold-start problem is often addressed by the use ofcontent based features. However, most literature in this areafocuses on textual representation of content. What makesthis a unique problem for display advertising is the fact thatthe ads are not represented as text; display ads are graphicalads. In this paper we propose the use of multimedia featuresto represent the content (and aesthetics) of such ads. Thecontributions of our paper are as follows: We develop fea-tures that can be extracted from both static images as wellas animated flash ads. We explore the use of global featuresto capture the visual characteristics of the entire image, localfeatures to describe the sub sections in an image, and highlevel features to capture the user’s perception. For flash ads,we develop an additional set of features that are extractedfrom the meta data. We also propose a clustering modelbased approach to capture the shared visual content of theseimages, and investigate the use of the group id as features. Afeature selection algorithm is also developed to remove fea-tures with low click relevancy and high redundancy. Finally,we show experimental results on data sets collected from acommercial NGD exchange demonstrating multimedia fea-tures significantly improve the click prediction for new ads,compared to a state-of-the-art baseline model.
The paper is organized as follows. In Section 2, we de-scribe the baseline NGD click prediction model. The multi-media features used in our work are introduced in Section 3followed by the introduction of our feature selection methodin Section 4. We present the feature analysis and modelingresults in Section 5. Related work is discussed in Section 6.
2. NGD CLICK PREDICTIONIn NGD advertising a spot auction is run for every ad
slot on the publisher’s page, in which all advertisers withmatching target profiles participate. The ads are rankedbased on their expected revenue and the winning ad is dis-played. Estimating the expected revenue for pay-per clickand post-click conversion payment models requires knowingthe probability that the user will click on the candidate adif shown in that ad slot on the publisher’s page.
2.1 ModelThe click prediction problem in NGD can be formulated
as a classification problem, where each data point representsa publisher-ad pair presented to the user. Assume thereis a set of n training samples, D = {(f(p
j
, aj
, uj
), cj
)}nj=1,
where f(pj
, aj
, uj
) 2 <d represents the d-dimensional featurespace for publisher-ad-user tuple j and c
j
2 {�1,+1} is thecorresponding class label (+1 : click or �1 : no-click). Givena publisher p, ad a and user u, the problem is to calculate theprobability of click p(c|p, a, u). We use a maximum entropyalgorithm for this supervised learning task because of itssimplicity and strength in combining diverse features andlarge scale learning [3]. The maximum-entropy model, alsoknown as logistic regression, has the following form:
p(c|p, a, u) = 1
1 + exp(P
d
i=1 wi
fi
(p, a, u))(1)
where fi
(p, a, u) is the i-th feature derived from the publisher-ad-user tuple (p, a, u) and w
i
2 w is the weight associatedwith it. Given the training set D, the model learns theweight vector w by minimizing the total losses in the dataformulated as:
LOSS(w) =nX
i
L(w; fi
(pi
, ai
, ui
), ci
) +�2kwk2 (2)
where L() is a logistic loss function used in this paper and� controls the degree of L2 regularization to smooth theobjective function. L-BFGS [5] is well suited to solve thiskind of large scale convex optimization problem.
2.2 FeaturesDesigning informative features is very important for su-
pervised learning algorithms. Many features are derivedfrom the publisher-ad-user tuple. On the user side, demo-graphic information such as age and gender are commonfeatures used for click prediction. On the publisher and ad-vertiser side there are hierarchies of entities. The entityidentifiers are typically used as features in click models tocapture the click behavior at di↵erent levels of abstraction.Publishers use site id to label their sites and section id totag di↵erent parts of their pages. The url and host of thepage are also informative features. An advertiser can setup multiple campaigns and creatives and the same creativecan be used in multiple campaigns. And finally, publishersand advertisers connect to ad exchanges via networks, whichconstitute the root of the hierarchies.
The identifier features are all binary indicators that takethe value 1 when present and 0 otherwise. Other ad featuresthat are useful include the size of the ad, the topical categoryand the format (e.g. pop-up, floating or static banner ads).
Conjunctions are used to capture the interaction betweendi↵erent feature groups, such as user and publisher, pub-lisher and ad, and user and ad conjunctions The number offeatures will grow exponentially after feature conjunction.Given a large set of identifiers, the final number of param-eters in the model will be very large. Feature hashing [29]is a simple and e↵ective dimension reduction technique tolimit the feature space as well as maintaining the model per-formance by hashing the feature to a predefined number ofbins.
3. MULTIMEDIA FEATURESDisplay ads are mainly created in two formats, image and
flash, from which we derive four sets of features. The firstset is composed of features generated from images and im-age elements in flash ads. They are designed to capture thevisual aspects of the images that may strongly a↵ect users’response to the ads. The second set of features consistsof meta information extracted from flash ads. In addition,we extract the latent mixture components from the imagesto capture their shared visual content as a separate set offeatures for click prediction. Finally, the image and flashfeatures extracted from the ads are conjoined with user andpublisher side features. For instance, the user age and adcolor can be used as an additional feature to capture thevariations in di↵erent age groups’ responses to di↵erent col-ors.
3.1 Image FeaturesA digital image with resolution X⇥Y is typically treated
as a grid of pixels with X rows and Y columns. The in-tensity of each pixel at location (x, y) can be representedin various color spaces including but not limited to RGB,

Grayscale, HSV, HSL and YUV. RGB stores individual val-ues for red (R), green (G) and blue (B) for each pixel at(x, y). RGB can be easily converted to grayscale and con-sequently to binary, black or white, by setting a thresholdvalue on grayscale value. HSV (hue, saturation, value) isanother color space that takes human perception into ac-count in the color encoding. In HSV, the brightness of apure color is equal to the brightness of white. HSL (hue,saturation, lightness/luminance) is similar to HSV, exceptthat the lightness of a pure color is equal to the lightnessof a medium gray. The YUV model defines a color spacein terms of one luma (Y) and two chrominance (UV) com-ponents. Di↵erent color spaces characterize an image fromdi↵erent perspective, based on which we can extract variousfeatures to describe the content of the image.
The features extracted from the image are divided intothree categories, global features, local features and high levelfeatures. Global features are utilized to describe the contentof the entire image using a small number of values while lo-cal features represent the characteristics of the local regionsof the image. Both global and local features are computeddirectly from the image. The high-level features attempt tocapture the human visual perception of the image. They in-volve more complex processing of the underling image data,that typically requires applying a model trained on an ad-ditional image corpus. A subset of these high-level visualfeatures has been used in the context of predicting a user’sphoto preferences in social media sharing sites [28].
3.1.1 Global FeaturesGlobal features capture the visual e↵ect of the entire im-
age as a whole and are generally easy to calculate. Theglobal features used in our work are introduced as following:
• Brightness of an image can be derived directly fromtwo color spaces, the YUV color space [23] where “Y”stands for the luma component (the brightness) andHSL color space [18] where “L” measures the light-ness of the image. The average, standard deviation,maximum and minimum of the luminance and light-ness values of all the pixels in the image are derived asbrightness features.
• Saturationmeasures the vividness of an image, whosevalue can be established directly from the HSV or HSLcolor space. Similar to brightness, we calculate theaverage, standard deviation, maximum and minimumof the saturation of all the pixels in the image.
• Colorfulness of an image is a measure of its di↵erenceagainst gray, which is calculated in RGB [12] as:
CF =q
�2rg
+ �2yb
+ 0.3q
µ2rg
+ µ2yb
(3)
rg = R�G
yb =R+G
2�B
• Naturalness is the degree of correspondence betweenimages and human perception of reality. Huang etal. [15] proposed an approach to obtain a quantita-tive description of Naturalness by grouping the pix-els with 20 L 80 and S > 0.1 in HSL colorspace according to their hue (H coordinate) value intothree sets: Skin, Grass and Sky. The naturalness score
NSskin
, NSgrass
, NSsky
as well as the proportional ofpixels NP
skin
, NPgrass
, NPsky
are derived from theimage. The final naturalness score feature is calcu-lated as:
NS =X
i
NSi
⇥NPi
, i 2 {Skin, Grass, Sky} (4)
• Contrastmeasures relative variation of luminance acrossthe image in HSL color space. The simplest definitionof contrast is the standard deviation of the luminanceL(x, y) of all image pixels. An extended version isto calculate the standard deviation of the normalizedluminance L(x,y)�L
min
L
max
�L
min
of all image pixels as the con-trast.
• Sharpness measures the clarity level of detail of animage. Sharpness can be determined as a function ofits Laplacian, normalized by the local average lumi-nance in the surroundings of each pixel:
SH =X
x,y
LP (x, y)µxy
, LP (x, y) =@2L@x2
+@2L@y2
(5)
where µxy
denotes the average luminance around pixel(x,y).
• Texture features correspond to human visual percep-tion by capturing the spatial arrangement of color orintensities in an image. One of the most widely usedtexture feature set is developed by Tamura et al. [27],which achieved correspondences with psychological mea-surements successfully. Three out of the six Tamuratextual features are utilized in our work, which de-scribe the coarseness, contrast and directionality of theimage.
• Grayscale simplicity features are extracted to rep-resent the properties of the gray level image. Threefeatures are extracted from the gray level histogramof the image consisting of 255 bins [2]. The first onecalculates the contrast of the image by measuring thewidth of the gray level histogram which consists of 95%of the pixels in the image. The second feature countsthe number of gray bins which contains the significantnumber of pixels. This feature measures the simplicityof the image in grayscale. The third feature simply cal-culates the standard deviation of the gray level valuesof all the pixels in the image. Javad et.al in [2] showthat the proposed gray level features are very e↵ectivein predicting the CTR of ads.
• RGB simplicity features can represent the simplic-ity of a color image [22]. Similar to [2], we quantizethe RGB space into 512 bins by dividing each channelinto 8 equal intervals. The number of RGB bins whosenumber of pixels are above a certain threshold is cal-culated as the simplicity feature in RGB space. Wealso take out the RGB bin with the maximum numberof pixels as the dominant color and calculate its ratiowith regard to the total number of pixels in the imageas another features. Two similar features can also becalculated in the HSV color space.
• Color harmony property of an image are assumedto be correlated with the appeal of an image to a ran-dom user [8]. Two features are extracted from the

image based on the 7 color harmonic distribution tem-plates[16, 17] created from the hue value of HSV colorspace. From the HSV color space of an image, we cal-culate the average deviation from each color harmonytemplate and the deviation from the best two fittedmodels are reported as two color harmony features [2].
• Hue histogram features are based on the hue valueof all the pixels in image. Each Hue value in HSL orHSV color space represents a color by itself. Similarto [2], three features are extracted based on hue his-togram of an image consisting of 20 bins. The firstfeature counts the number of bins including number ofpixels more than a threshold value, indicated as num-ber of significant hues. The second feature calculatesthe contrast of the hue histogram as the maximum arclength distance between any two significant bins. Thethird feature calculates the standard deviation of thehue arc length of all the pixels in the image, whichshows the distribution of the hue color in the images.
3.1.2 Local FeaturesUsers often pay more attention to certain regions in an
image. Features that are generated from local regions cantherefore be useful. To generate local features, we first dividethe image into many segments using a connected componentalgorithm [25]. Let S = S1, S2, ...Sg
be the final g set of seg-ments created from the image (note that segments smallerthan 5% of the image are dropped). Some of the global fea-tures introduced in Section 3.1.1 can be extended to localfeatures by calculating them in local segments similar to [2].The local features used in our work are described as follows:
• Basic segment statistics features are extracted fromthe basic statistics of the segments. The first feature issimply the number of segments g in the image, whichmay indicate how busy an image is. Another featureis the contrast of segment sizes, which is calculatedas the di↵erence between the size of the largest andthe smallest component. The third feature calculatesthe ratio of the largest connected color component tothe whole image in terms of number of pixels. Thisfeature will have a larger value for a smooth image.The fourth feature is defined as the rank of the hue bin,considering the bin size in descending order, associatedwith the largest connected component in the image.The last two features are calculated in the same wayas the third and fourth feature except that they arebased on the second largest connected component.
• Segment hue histogram is generated for each seg-ment in the image. Similar to the global hue histogramfeatures, six local hue features are extracted: 1) thenumber of significant hues in the image falling in thelargest segment, 2) the number of significant hues inthe largest segment, 3) the largest number of signifi-cant hues among all the segments, 4) the contrast ofthe number of significant hues among all segments, 5)the contrast of the hues in the largest segment, and 6)the standard deviation of all segment’s hue contrasts.
• Segment color harmony features are similar to theglobal color harmony features except that they arecomputed on the largest segment. Two features are
generated, the minimum deviation from the best fit-ted color harmony model and the average deviation ofthe best two fitted color harmony models.
• Segment brightness features are based on the light-ness of each segments calculated in HSL color space.Three features are calculated, 1) the average lightnessof all the pixels in the largest segment, 2)the standarddeviation of average lightness among all the segments,and 3) the contrast of average lightness among all thesegments.
3.1.3 High Level FeaturesMost of the global and local features introduced above
describe the content of the image at low level of visual per-ception. In this section, we introduce a set of more advancedfeatures that is able to capture high level perception or con-ception information of an image.
• Interest points are the pixels in the image that con-stitute the edges, e.g. high-contrast regions, of objectsin an image. Lowe et al. [21] developed the SIFT al-gorithm (Scale-invariant feature transform) to identifythe interesting points for object detection. We sim-ply use the number of interesting points as a featurefor our task, which may indicate the complexity of animage in terms of the number of objects it contains.
• Saliency map is a binary map detected from the im-age using saliency detection algorithms such as [14]to distinguish the objects from the background whosesaliency value is less than a predefined threshold. Sim-ilar to [2], based on the saliency map, many featuresare extracted such as: 1) the ratio of background tothe whole image, 2) the number of connected compo-nents of background, 3)the ratio of the largest con-nected component of background to the whole image,4) the number of connect components in the saliencymap, 5) the ratio of the largest connected saliency areato the whole image, 6) the average weight of the largestconnected components of saliency map, 7) the distor-tion of the connected saliency areas calculated as theoverall distance among all the components centroids,and 8) overall distance of all component centroids fromthe center of image.
• Text in an image can be extracted using standardOCR (Optical Character Recognition) algorithms [26].Simple features such as the number of characters andnumber of words can be easily created afterward as twopossible features. Note that, these two features are in-dependent from the content of the text and thereforeit does not need a very accurate OCR toolbox.
• Human faces in an image can be extracted by face de-tection algorithms [4]. For our ad click prediction task,we created four features using the recognized faces inthe image: the number of profile faces, the proportionof profile faces in terms of pixels, the number of frontalfaces, the proportion of frontal faces in terms of pixels.
3.2 Flash FeaturesFlash is commonly used in display advertising, because
it enriches the user experience by supporting streamliningof video, audio, animation of text, drawings and images.
Compared with static image ads, flash ads are more attrac-tive and therefore more likely to be clicked by users. Hencefeatures extracted from flash ads can provide additional in-formation to click models. In our work, a flash ad is de-composed into many elements including image, sound, font,text, button, shape, frame, and action. Obviously the imagefeatures introduced in Section 3.1 can be extracted from theimage element of a flash ad. A list of flash specific featuresare introduced as following:
• Basic flash features are derived by counting the num-ber of movie clips, shapes, fonts and frames in the flash.
• Audio feature is a binary feature indicating whethera flash ad contains audio. A flash ad with audio maybe more attractive to users than soundless ads.
• Text features such as number of characters, number ofwords and a number of pre-determined keywords (e.g.,“click”, “free”) are derived from the text elements inthe flash.
3.3 Mixture Component FeaturesWhen users look at a display ad they do not perceive it
as a matrix of pixels, but rather they process the contentof the ad. Images with similar content may receive similarresponses from users. One way to capture this is to clus-ter images based on content similarity and use the clustermembership as a feature. We use a Gaussian Mixture Com-ponent (GMM) model for this purpose, instead of more ad-vanced models such as Probabilistic Latent Semantic Anal-ysis (PLSA) [13], because of its scalability. The weight ofmixtures as well as the mean vectors and covariance matricesfor each mixture are learned through a maximum likelihoodprocess from the images in the training set, which are de-scribed as vectors of image features introduced in Section3.1. For every image in the test data we estimate the prob-ability of component membership from the learned model.The component id with the maximum posterior probabilityis then used as the mixture component feature in the clickmodel.
3.4 User and Publisher Conjunction FeaturesThe “attractiveness” of a rich media ad to di↵erent users
will vary since users may have di↵erent interests and taste.For example, male and female users will certainly react dif-ferently when seeing an ad with a beautiful human face;young users may be more attracted to ads with cartoonsthan older users. The ad performance on di↵erent publish-ers also varies. As an example, ads with cars in the imageare more likely to be clicked when shown on a automobilerelated site than when shown on a fashion site. These fac-tors are not taken into account by the multimedia featuresintroduced above since they are extracted from the ad con-tent only. Conjunction features solve this problem by takingthe cross product of the user features (such as age, genderetc.) or publisher features (such as publisher id, url, etc.)with the multimedia features.
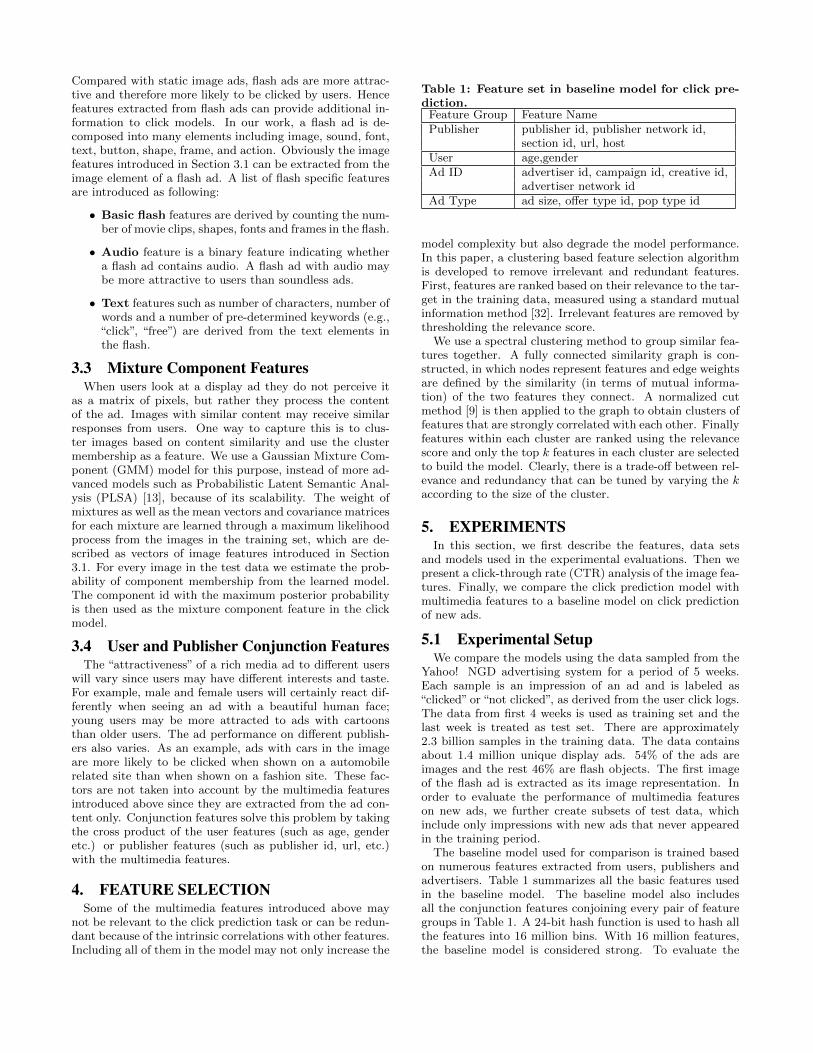
4. FEATURE SELECTIONSome of the multimedia features introduced above may
not be relevant to the click prediction task or can be redun-dant because of the intrinsic correlations with other features.Including all of them in the model may not only increase the
Table 1: Feature set in baseline model for click pre-diction.Feature Group Feature NamePublisher publisher id, publisher network id,
section id, url, hostUser age,genderAd ID advertiser id, campaign id, creative id,
advertiser network idAd Type ad size, o↵er type id, pop type id
model complexity but also degrade the model performance.In this paper, a clustering based feature selection algorithmis developed to remove irrelevant and redundant features.First, features are ranked based on their relevance to the tar-get in the training data, measured using a standard mutualinformation method [32]. Irrelevant features are removed bythresholding the relevance score.
We use a spectral clustering method to group similar fea-tures together. A fully connected similarity graph is con-structed, in which nodes represent features and edge weightsare defined by the similarity (in terms of mutual informa-tion) of the two features they connect. A normalized cutmethod [9] is then applied to the graph to obtain clusters offeatures that are strongly correlated with each other. Finallyfeatures within each cluster are ranked using the relevancescore and only the top k features in each cluster are selectedto build the model. Clearly, there is a trade-o↵ between rel-evance and redundancy that can be tuned by varying the kaccording to the size of the cluster.
5. EXPERIMENTSIn this section, we first describe the features, data sets
and models used in the experimental evaluations. Then wepresent a click-through rate (CTR) analysis of the image fea-tures. Finally, we compare the click prediction model withmultimedia features to a baseline model on click predictionof new ads.
5.1 Experimental SetupWe compare the models using the data sampled from the
Yahoo! NGD advertising system for a period of 5 weeks.Each sample is an impression of an ad and is labeled as“clicked” or “not clicked”, as derived from the user click logs.The data from first 4 weeks is used as training set and thelast week is treated as test set. There are approximately2.3 billion samples in the training data. The data containsabout 1.4 million unique display ads. 54% of the ads areimages and the rest 46% are flash objects. The first imageof the flash ad is extracted as its image representation. Inorder to evaluate the performance of multimedia featureson new ads, we further create subsets of test data, whichinclude only impressions with new ads that never appearedin the training period.
The baseline model used for comparison is trained basedon numerous features extracted from users, publishers andadvertisers. Table 1 summarizes all the basic features usedin the baseline model. The baseline model also includesall the conjunction features conjoining every pair of featuregroups in Table 1. A 24-bit hash function is used to hash allthe features into 16 million bins. With 16 million features,the baseline model is considered strong. To evaluate the
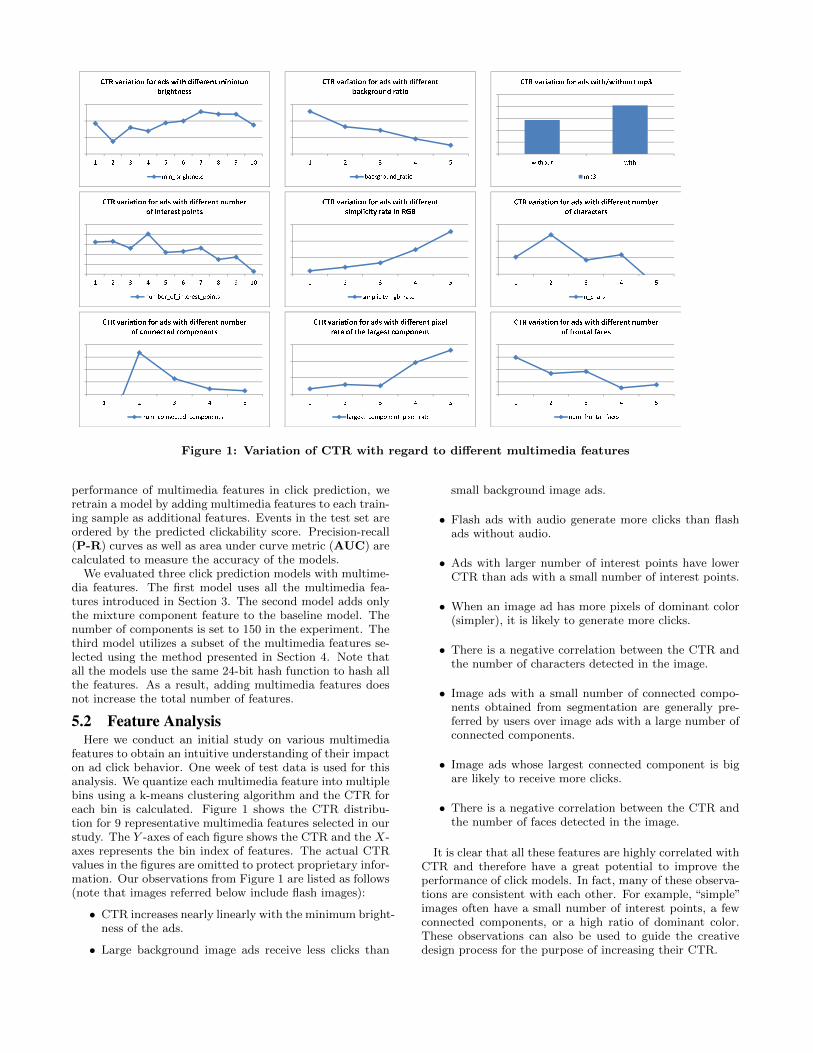
Figure 1: Variation of CTR with regard to di↵erent multimedia features
performance of multimedia features in click prediction, weretrain a model by adding multimedia features to each train-ing sample as additional features. Events in the test set areordered by the predicted clickability score. Precision-recall(P-R) curves as well as area under curve metric (AUC) arecalculated to measure the accuracy of the models.
We evaluated three click prediction models with multime-dia features. The first model uses all the multimedia fea-tures introduced in Section 3. The second model adds onlythe mixture component feature to the baseline model. Thenumber of components is set to 150 in the experiment. Thethird model utilizes a subset of the multimedia features se-lected using the method presented in Section 4. Note thatall the models use the same 24-bit hash function to hash allthe features. As a result, adding multimedia features doesnot increase the total number of features.
5.2 Feature AnalysisHere we conduct an initial study on various multimedia
features to obtain an intuitive understanding of their impacton ad click behavior. One week of test data is used for thisanalysis. We quantize each multimedia feature into multiplebins using a k-means clustering algorithm and the CTR foreach bin is calculated. Figure 1 shows the CTR distribu-tion for 9 representative multimedia features selected in ourstudy. The Y -axes of each figure shows the CTR and the X-axes represents the bin index of features. The actual CTRvalues in the figures are omitted to protect proprietary infor-mation. Our observations from Figure 1 are listed as follows(note that images referred below include flash images):
• CTR increases nearly linearly with the minimum bright-ness of the ads.
• Large background image ads receive less clicks than
small background image ads.
• Flash ads with audio generate more clicks than flashads without audio.
• Ads with larger number of interest points have lowerCTR than ads with a small number of interest points.
• When an image ad has more pixels of dominant color(simpler), it is likely to generate more clicks.
• There is a negative correlation between the CTR andthe number of characters detected in the image.
• Image ads with a small number of connected compo-nents obtained from segmentation are generally pre-ferred by users over image ads with a large number ofconnected components.
• Image ads whose largest connected component is bigare likely to receive more clicks.
• There is a negative correlation between the CTR andthe number of faces detected in the image.
It is clear that all these features are highly correlated withCTR and therefore have a great potential to improve theperformance of click models. In fact, many of these observa-tions are consistent with each other. For example, “simple”images often have a small number of interest points, a fewconnected components, or a high ratio of dominant color.These observations can also be used to guide the creativedesign process for the purpose of increasing their CTR.

Figure 2: Percentage of new unique advertiser iden-tifiers, creatives and campaigns emerging for eachday in one month (relative to those existing in thetraining period).
5.3 Click Prediction for New AdsModeling multimedia features allows us to improve the
click prediction for new ads by enabling the use of histori-cal performance of pre-existing ads with similar content. Inorder to evaluate the scope of the problem we first mea-sure the burst rate of new ads in the data. For this anal-ysis we treat the first 4 weeks of data as the reference set,and calculate the ratio of new ads per day for the follow-ing 2 weeks. Advertiser campaigns often have an inherentstructure: one advertiser can have multiple campaigns, andone campaign might have multiple creatives. In the caseof Yahoo’s exchange the same creative can actually appearin multiple campaigns. To understand the problem spacebetter we measure the burst rate at each of these levels sep-arately. As shown in Figure 2, it is clear that the burst rateis increasing steadily day by day for all three levels, howevercreative has the most significant change. 31.7% of uniqueads are new creatives after a period of 13 days. The burstrate of campaigns is slower, with 23.0% of new unique adsafter a period of 13 days. The advertiser is the most stableof the three levels, which still has 11.9% new unique ads.This underlines the impact of our work on the performanceof the NGD advertising system.
Table 2: Performance improvement in terms of AUCof click prediction model with multimedia featureson new ads with di↵erent level of newness.
Newness Level AUC GainNew Advertiser ID (newest) 6.50%
New Creative ID 2.15%New Campaign ID 1.27%
New Campaign+Creative ID 3.31%
Then we evaluate the performance of the three click mod-els with multimedia features as introduced in Section 5.1 onnew ads. Specifically we create multiple slices of test datawhich contain new ads represented at four di↵erent levels:advertiser, creative, campaign and campaign⇥creative. Thecampaign⇥creative slice includes ads with either new cam-paigns or new creatives. The P-R curve and correspondingAUC for each slice of test data are shown in Figure 3. Look-ing at the test data with new advertiser id, we observe asignificant improvement by adding the multimedia features.The model with all multimedia features gains 6.03% in termsof AUC. Using feature selection method introduced in Sec-
tion 4 improves the performance even more, with a 6.50%gain over baseline. This is not surprising since a lot of fea-tures introduced in Section 3 seem strongly correlated witheach other. It is also worth mentioning that the mixturecomponent feature is so informative that adding it alonebrings 1.5% gain over the baseline. We also observe notableimprovements by adding multimedia features on the othernew ad slices. The improvements are relatively smaller com-pared to the result on the new advertiser slice. This is ex-pected because advertisers use the same advertiser identifierfor new creatives and new campaigns thus providing somehistorical information even for new ads. Table 2 summarizesthe AUC gains compared to the baseline for the model withselected multimedia features using the method introduced inSection 4. All the improvements are statistically significant(p < 0.01) based on a simple paired t�test on the predic-tion results generated by thresholding the prediction scoreof the compared models using the equal error point (EER).In general, multimedia features play a important role onadvertisers with limited historical information. Note thatall these improvements are achieved without adding modelcomplexity in terms of the total number of features due tothe feature hashing strategy.
6. RELATED WORKClick prediction in on-line advertising has received in-
creasing attention from the research community in recentyears. Most of the work in the literature can be categorizedbroadly as either new feature or new model development.In terms of feature development, Liu et al. [20] propose touse syntactic features for sponsored search to model the rel-evance between query and ad by treating the ad’s text as ashort document and building a language model as in classicinformation retrieval; Chakrabarti et al. [6] developed clickfeedback features [6] based on aggregated historical clickdata, which has proven to be very e↵ective in click predic-tion; Cheng et al. [7] developed a personalized click modelby including user specific features and demographic featureswhich dramatically improve the performance of click predic-tion. In terms of model development, maximum entropy [7,3] or decision trees [10] are common models used for clickprediction in on-line advertising. Specifically for sponsoredsearch we see the use of generative graphical models [30]that focus on identifying the factors that a↵ect the user’sresponse to ads on a search page; Graepel et al. [11] pro-pose a Bayesian on-line learning algorithm used for CTRprediction in Bing’s sponsored search product.
Most published work in the area of click prediction fornew ads is focused on identifying new ads either by usingcategories [6] or identifying a set of similar ads by usingthe textual content of the ads [10], which cannot be ap-plied to display advertising directly. In our case, some levelof ad and page category was already being utilized by thebaseline models. An alternative approach was proposed byAgarwal et al. [1] that utilizes the hierarchy in the advertis-ers campaigns to improve the prediction for new ads. Whilewe did not use the exact same model, we did use featuresthat capture part of this information in our baseline mod-els. Therefore the improvements we present in this paperare complementary to their work.
Image features have been widely researched for the task ofcontent based image retrieval (CBIR)[31, 24] including bothglobal features and local features. Global features charac-

0.1
0.2
0.3
0.4
0.5
0.6
0.7
0.8
0.9
1
0 0.1 0.2 0.3 0.4 0.5 0.6 0.7 0.8 0.9 1
Pre
cisi
on
Recall
Precision-Recall Graph for New Advertiser ID
click model without multimedia feature 0.49341click model with multimedia feature after feature selection 0.52550
click model with all multimedia feature 0.52315click model with gmm feature 0.50108
0.2
0.3
0.4
0.5
0.6
0.7
0.8
0.9
1
0 0.1 0.2 0.3 0.4 0.5 0.6 0.7 0.8 0.9 1
Pre
cisi
on
Recall
Precision-Recall Graph for New Campaign ID
click model without multimedia feature 0.71661click model with multimedia feature after feature selection 0.72573
click model with all multimedia feature 0.72556click model with gmm feature 0.71747
0.2
0.3
0.4
0.5
0.6
0.7
0.8
0.9
1
0 0.1 0.2 0.3 0.4 0.5 0.6 0.7 0.8 0.9 1
Pre
cisi
on
Recall
Precision-Recall Graph for New Creative ID
click model without multimedia feature 0.65601click model with multimedia feature after feature selection 0.67011
click model with all multimedia feature 0.67145click model with gmm feature 0.65805
0.2
0.3
0.4
0.5
0.6
0.7
0.8
0.9
1
0 0.1 0.2 0.3 0.4 0.5 0.6 0.7 0.8 0.9 1
Pre
cisi
on
Recall
Precision-Recall Graph for New Campaign ID_New Creative ID
click model without multimedia feature 0.63645click model with multimedia feature after feature selection 0.65752
click model with all multimedia feature 0.65840click model with gmm feature 0.63836
Figure 3: Variation of CTR with regard to di↵erent multimedia features
terize images using global characteristics such as color his-togram, texture values, shape parameters. For example, Yooet al. [31] developed a set of global visual features for thetask of large scale image searching. Global features fail towork when the retrieval task is targeted to specific local ob-jects, e.g. human face recognition. Local features are typi-cally used [24] in such tasks. CBIR mainly focuses on findingsimilar images in a database, whereas our task requires mea-suring the ”attractiveness”of the image particularly in termsof CTR. There is some work in literature developing featuresto estimate the beauty of an image using many features [33,19], however little work is found on exploring their corre-lation with CTR. In addition to the features being studiedin this paper, there are other derivatives from the computervision domain that could have a strong impact on user’s re-sponse to the ads, such as company logos. We would like toextend our analysis to include these features.
To the best of our knowledge Azimi et al.’s [2] proposal isthe first use of multimedia features for the purposes of esti-mating click probability of display ads. Some of the imagefeatures described in Section 3.1 were introduced in theirwork. However their proposal was limited to static imageads only and the experimental results provided in their workcompared to a simple weighted sampling based CTR estima-tion on a small set of samples.
7. CONCLUSIONSIn this paper, we propose to use multimedia features to
improve the accuracy of click prediction for new ads in aNGD advertising system. Specifically, we developed image
and flash features that describe the visual perception of thecontent of display ads. We analyzed the click distributionsfor the di↵erent multimedia features and observed a strongcorrelation between the CTR and features defined. We fur-ther tested the models with multimedia features on largescale data collected from real tra�c. Compared to a state-of-the-art baseline model without multimedia features, weobserved significant improvement in terms of prediction ac-curacy on test data with new ads. We also developed a fea-ture selection algorithm to remove the redundant and highlycorrelated features, which was shown to improve the accu-racy of the final prediction task.
8. ACKNOWLEDGMENTSWe thank our colleagues Kannan Achan, Lihong Li, Olivier
Chapelle and Romer Rosales for their assistance with datacollection and model discussions.
9. REFERENCES[1] D. Agarwal, R. Agrawal, R. Khanna, and N. Kota.
Estimating rates of rare events with multiplehierarchies through scalable log-linear models. InProceedings of the 16th ACM SIGKDD internationalconference on Knowledge discovery and data mining,KDD ’10, pages 213–222, New York, NY, USA, 2010.ACM.
[2] J. Azimi, R. Zhang, Y. Zhou, V. Navalpakkam,J. Mao, and X. Fern. The impact of visual appearanceon user response in online display advertising. CoRR,2012.

[3] A. L. Berger and V. J. D. Pietra. A maximum entropyapproach to natural language processing.Computational Linguistics, 22:39–71, 1996.
[4] G. Bradski and A. Kaehler. Learning OpenCV:Computer Vision with the OpenCV Library. O’ReillyMedia, 2008.
[5] R. H. Byrd, J. Nocedal, R. B. Schnabel, R. H. B. J.Nocedal, and R. B. Representations of quasi-newtonmatrices and their use in limited memory methods.Mathematical Programming, 63:129–156, 1994.
[6] D. Chakrabarti, D. Agarwal, and V. Josifovski.Contextual advertising by combining relevance withclick feedback. In Proceeding of the 17th internationalconference on World Wide Web, pages 417–426, NewYork, NY, USA, 2008. ACM.
[7] H. Cheng and E. Cantu-Paz. Personalized clickprediction in sponsored search. In Proceedings of thethird ACM international conference on Web searchand data mining, WSDM ’10, pages 351–360, NewYork, NY, USA, 2010. ACM.
[8] D. Cohen-Or, O. Sorkine, R. Gal, T. Leyvand, andY.-Q. Xu. Color harmonization. In ACM Transactionson Graphics, pages 624–630.
[9] T. Cour, F. Benezit, and J. Shi. Spectral segmentationwith multiscale graph decomposition. In IEEEInternational Conference on Computer Vision andPattern Recognition, pages 1124–1131, 2005.
[10] K. S. Dave and V. Varma. Learning the click-throughrate for rare/new ads from similar ads. In Proceedingsof the 33rd international ACM SIGIR conference onResearch and development in information retrieval,SIGIR ’10, pages 897–898, New York, NY, USA, 2010.ACM.
[11] T. Graepel, J. Q. Candel, T. Borchert, andR. Herbrich. Web-scale bayesian click-through rateprediction for sponsored search advertising inmicrosoft’s bing search engine. In Proceedings of the27th International Conference on Machine Learning,2010.
[12] D. Hasler and S. E. Suesstrunk. Measuringcolorfulness in natural images. Human Vision andElectronic Imaging VIII, Proceedings of the SPIE,5007:87–95, 2003.
[13] E. Horster, R. Lienhart, and M. Slaney. Continuousvisual vocabulary models for plsa-based scenerecognition. In ACM International Conference onImage and Video Retrieval, pages 319–382, 2008.
[14] X. Hou and L. Zhang. Saliency detection: A spectralresidual approach. In In IEEE Conference onComputer Vision and Pattern Recognition, pages 1–8,2007.
[15] K.-Q. Huang, Q. Wang, and Z.-Y. Wu. Natural colorimage enhancement and evaluation algorithm basedon human visual system. Computer Vision and ImageUnderstanding, 103:52–63, 2006.
[16] J. Itten. The art of color. New York: Van NostrandReinhold Company, 1960.
[17] J. Itten. Color design. Asakura Shoten, 1995.[18] G. H. Joblove and D. Greenberg. Color spaces for
computer graphics. Computer Graphics (SIGGRAPH’78 Proceedings), 12(3):20–25, Aug. 1978.
[19] N. Kalidindi, A. Le, J. Picone, H. Y. L. Zheng, andV. A. Rudis. Scenic beauty estimate of forestryimages. In Proceedings of the IEEE Southeastcon,pages 337–339, 1997.
[20] C. Liu, H. Wang, S. Mcclean, J. Liu, and S. Wu.Syntactic information retrieval. In Proceedings of the2007 IEEE International Conference on GranularComputing, page 703, Washington, DC, USA, 2007.IEEE Computer Society.
[21] D. G. Lowe. Object recognition from localscale-invariant features. Proceedings of theInternational Conference on Computer Vision,2:1150–1157, 1999.
[22] Y. Luo and X. Tang. Photo and video qualityevaluation: Focusing on the subject. Proceedings of the10th European Conference on Computer Vision: PartIII, pages 386–399, 2008.
[23] C. Poynton. Yuv and luminance considered harmful:A plea for precise terminology in video. Engineering,pages 1–4, 2008.
[24] Z. R. Srihari and A. Rao. Image background search:Combining object detection techniques with contentbased image retrieval(cbir) systems. In Proceedings ofthe IEEE workshop on Content Based Access of Imageand video Libraries, pages 97–101, 1999.
[25] L. G. Shapiro and G. C. Stockman. Computer Vision.Prentice Hall, 2002.
[26] C. Y. Suen, M. Berthod, and S. Mori. Automaticrecognition of handprinted characters — the state ofthe art. Proceedings of the IEEE, 68:469–487, 1980.
[27] H. Tamura, S. Mori, and T. Yamawaki. Texturalfeatures corresponding to visual perception. IEEETransactions on Systems, Man and Cybernetics,8:460–473, 1978.
[28] R. van Zwol, A. Rae, and L. G. Pueyo. Prediction offavourite photos using social, visual, and textualsignals. In ACM Multimedia, pages 1015–1018, 2010.
[29] K. Weinberger, A. Dasgupta, J. Langford, A. Smola,and J. Attenberg. Feature hashing for large scalemultitask learning. In Proceedings of the 26th AnnualInternational Conference on Machine Learning, pages1113–1120, 2007.
[30] W. Xu, E. Manavoglu, and E. Cantu-Paz. Temporalclick model for sponsored search. SIGIR ’10, pages106–113, New York, NY, USA, 2010. ACM.
[31] H.-W. Yoo, D.-S. Jang, S.-H. Jung, J.-H. Park, andK.-S. Song. Visual information retrieval system viacontent-based approach. Pattern Recognition,35(3):749–769, 2002.
[32] M. Za↵alon and M. Hutter. Robust feature selectionby mutual information distributions. In 18thInternational Conference on Uncertainty in ArtificialIntelligence, pages 577–584, 2002.
[33] X. Zhang, V. Ramani, Z. Long, Y. Zeng,A. Ganapathiraju, , and J. Picone. Scenic beautyestimation using independent component analysis andsupport vector machines. In Proceedings of IEEESoutheastcon, pages 97–101, 1999.


![Tricks to Get the Click: Actionable Tips for Creating Better PPC Text Ads [Webinar]](https://img.pdfslide.us/doc/110x75/554cec86b4c905a5138b4800/tricks-to-get-the-click-actionable-tips-for-creating-better-ppc-text-ads-webinar.jpg)


![Intel inside History - At a glance [Most images are links to videos and ads, click them]](https://img.pdfslide.us/doc/110x75/55390d704a7959c36e8b48c1/intel-inside-history-at-a-glance-most-images-are-links-to-videos-and-ads-click-them.jpg)