Embed Size (px)
Citation preview
MULTILANE DIGITAL SAMPLING
OSCILLOSCOPE
FEATURES & SPECS
JULY 2016
ML-DSO | Features & Specs
2 / 25
CO
MM
UN
ICA
TIO
N T
EST
& M
EASU
REM
ENT
SOLU
TIO
NS
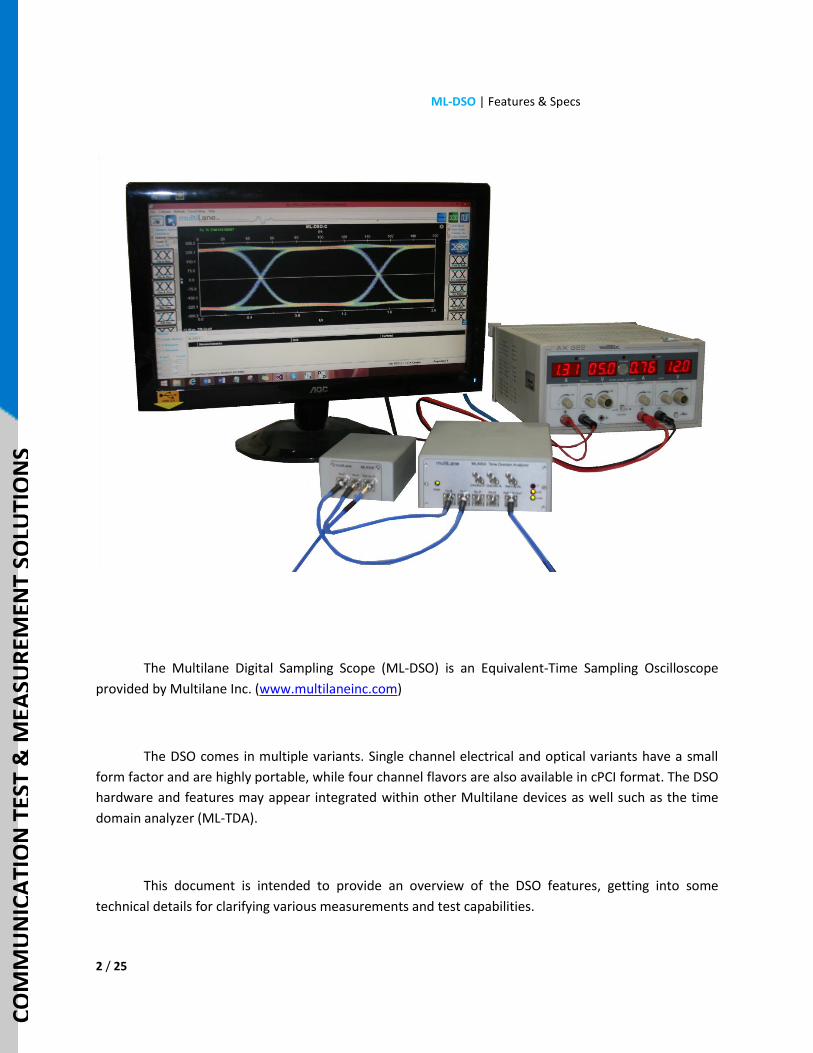
The Multilane Digital Sampling Scope (ML-DSO) is an Equivalent-Time Sampling Oscilloscope
provided by Multilane Inc. (www.multilaneinc.com)
The DSO comes in multiple variants. Single channel electrical and optical variants have a small
form factor and are highly portable, while four channel flavors are also available in cPCI format. The DSO
hardware and features may appear integrated within other Multilane devices as well such as the time
domain analyzer (ML-TDA).
This document is intended to provide an overview of the DSO features, getting into some
technical details for clarifying various measurements and test capabilities.
ML-DSO | Features & Specs
3 / 25
CO
MM
UN
ICA
TIO
N T
EST
& M
EASU
REM
ENT
SOLU
TIO
NS
TABLE OF CONTENTS
OVERVIEW ...................................................................................................................................................... 4
SUPPORTED MEASUREMENTS ........................................................................................................................ 5
NRZ EYE AMPLITUDE MEASUREMENTS ................................................................................................................... 5
NRZ EYE TIME MEASUREMENTS ............................................................................................................................ 6
NRZ EYE MASK MEASUREMENTS ........................................................................................................................... 7
PATTERN AMPLITUDE MEASUREMENTS ................................................................................................................... 7
PATTERN TIME MEASUREMENTS ............................................................................................................................ 8
NRZ JITTER DECOMPOSITION / EYE WIDTH BY BER ................................................................................................... 8
NRZ NOISE DECOMPOSITION / EYE HEIGHT BY BER .................................................................................................. 9
OPTICAL MEASUREMENTS ................................................................................................................................... 11
PAM 4 MEASUREMENTS .................................................................................................................................... 14
FREQUENCY DOMAIN MEASUREMENTS .................................................................................................................. 15
DSO ARCHITECTURE ...................................................................................................................................... 17
SOFTWARE FILTERING .................................................................................................................................. 19
APPENDIX A: DSO PRODUCT FAMILY ............................................................................................................ 21
APPENDIX B: CORRELATION REPORT – TIME DOMAIN MEASUREMENTS .................................................... 22
APPENDIX C: CORRELATION REPORT – S21 MEASUREMENT ....................................................................... 23
ML-DSO | Features & Specs
4 / 25
CO
MM
UN
ICA
TIO
N T
EST
& M
EASU
REM
ENT
SOLU
TIO
NS
OVERVIEW
The Multilane Digital Sampling Oscilloscope is a fully-integrated instrument that automatically
performs accurate eye-diagram analysis to characterize the quality of transmitters and receivers.The
“DSO” implements a statistical under- sampling technique with comprehensive software libraries for eye
measurements, jitter analysis and processing of NRZ data. The DSO is offered in four lane and single lane
form factors for optical and/or electrical inputs.
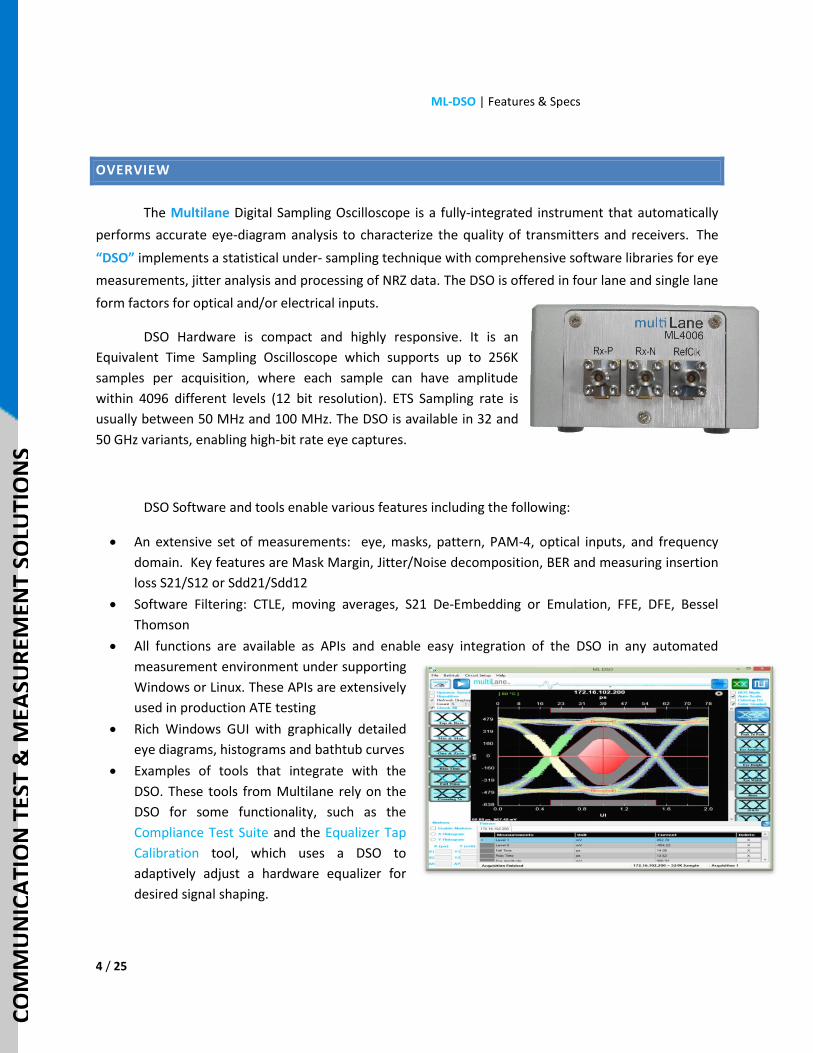
DSO Hardware is compact and highly responsive. It is an
Equivalent Time Sampling Oscilloscope which supports up to 256K
samples per acquisition, where each sample can have amplitude
within 4096 different levels (12 bit resolution). ETS Sampling rate is
usually between 50 MHz and 100 MHz. The DSO is available in 32 and
50 GHz variants, enabling high-bit rate eye captures.
DSO Software and tools enable various features including the following:
An extensive set of measurements: eye, masks, pattern, PAM-4, optical inputs, and frequency
domain. Key features are Mask Margin, Jitter/Noise decomposition, BER and measuring insertion
loss S21/S12 or Sdd21/Sdd12
Software Filtering: CTLE, moving averages, S21 De-Embedding or Emulation, FFE, DFE, Bessel
Thomson
All functions are available as APIs and enable easy integration of the DSO in any automated
measurement environment under supporting
Windows or Linux. These APIs are extensively
used in production ATE testing
Rich Windows GUI with graphically detailed
eye diagrams, histograms and bathtub curves
Examples of tools that integrate with the
DSO. These tools from Multilane rely on the
DSO for some functionality, such as the
Compliance Test Suite and the Equalizer Tap
Calibration tool, which uses a DSO to
adaptively adjust a hardware equalizer for
desired signal shaping.
ML-DSO | Features & Specs
5 / 25
CO
MM
UN
ICA
TIO
N T
EST
& M
EASU
REM
ENT
SOLU
TIO
NS
SUPPORTED MEASUREMENTS
The DSO measurements can be divided into various groups, some related to eye diagrams,
others to patterns, some related to NRZ coding, and others to PAM4, in addition to advanced
measurements like Jitter/Noise decomposition and S21 insertion loss measurement.
NRZ EYE AMPLITUDE MEASUREMENTS
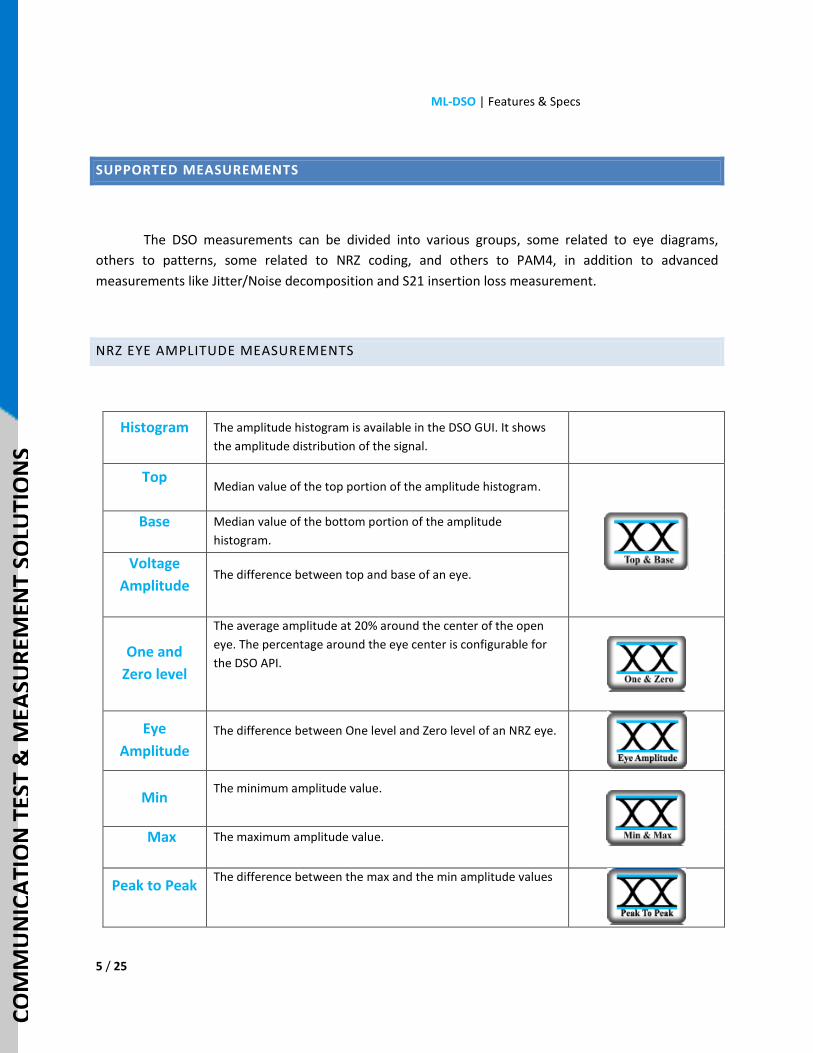
Histogram
The amplitude histogram is available in the DSO GUI. It shows
the amplitude distribution of the signal.
Top
Median value of the top portion of the amplitude histogram.
Base
Median value of the bottom portion of the amplitude
histogram.
Voltage
Amplitude
The difference between top and base of an eye.
One and
Zero level
The average amplitude at 20% around the center of the open
eye. The percentage around the eye center is configurable for
the DSO API.
Eye
Amplitude
The difference between One level and Zero level of an NRZ eye.
Min The minimum amplitude value.
Max
The maximum amplitude value.
Peak to Peak
The difference between the max and the min amplitude values
ML-DSO | Features & Specs
6 / 25
CO
MM
UN
ICA
TIO
N T
EST
& M
EASU
REM
ENT
SOLU
TIO
NS
Eye Height
Eye Height is the vertical opening of the eye measured.
Crossing
percentage
The amplitude of the crossing level where we transition from
zero to one or vice versa.
SNR
The signal to noise ratio is a ratio of the difference between one
level and zero level relative to the noise present at both levels.
VEC
VEC = Vertical Eye Closure in dB.
NRZ EYE TIME MEASUREMENTS
Fall Time
The mean transition time of the data on the downward slope of an
eye diagram between 2 defined thresholds e.g. 80% and 20%.
Rise Time
The mean transition time of the data on the upward slope of an eye
diagram between 2 defined thresholds e.g. 20% and 80%.
Eye Width
The time between the latest possible occurrences of one eye Crossing
to the earliest possible occurrence of the next crossing
Jitter
Jitter is defined as a measure of the short-term variations of the
significant instances of a digital signal from its ideal position on the
time axis. In other words, ideally, an edge should always land at the
same position on the time axis. In the real world, the edge is
sometimes a little early, sometimes a little late. This is jitter,
summarized as the width at the eye crossing. The jitter peak to peak
and rms values are measured and displayed in picoseconds.
ML-DSO | Features & Specs
7 / 25
CO
MM
UN
ICA
TIO
N T
EST
& M
EASU
REM
ENT
SOLU
TIO
NS
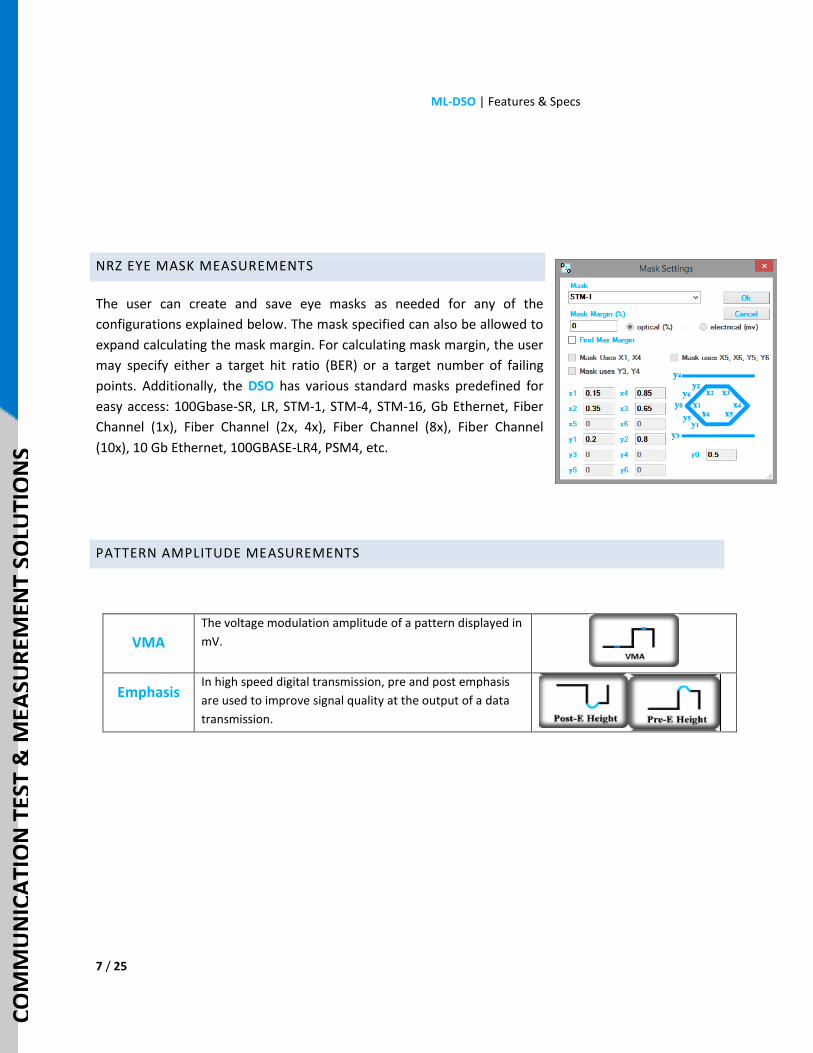
NRZ EYE MASK MEASUREMENTS
The user can create and save eye masks as needed for any of the
configurations explained below. The mask specified can also be allowed to
expand calculating the mask margin. For calculating mask margin, the user
may specify either a target hit ratio (BER) or a target number of failing
points. Additionally, the DSO has various standard masks predefined for
easy access: 100Gbase-SR, LR, STM-1, STM-4, STM-16, Gb Ethernet, Fiber
Channel (1x), Fiber Channel (2x, 4x), Fiber Channel (8x), Fiber Channel
(10x), 10 Gb Ethernet, 100GBASE-LR4, PSM4, etc.
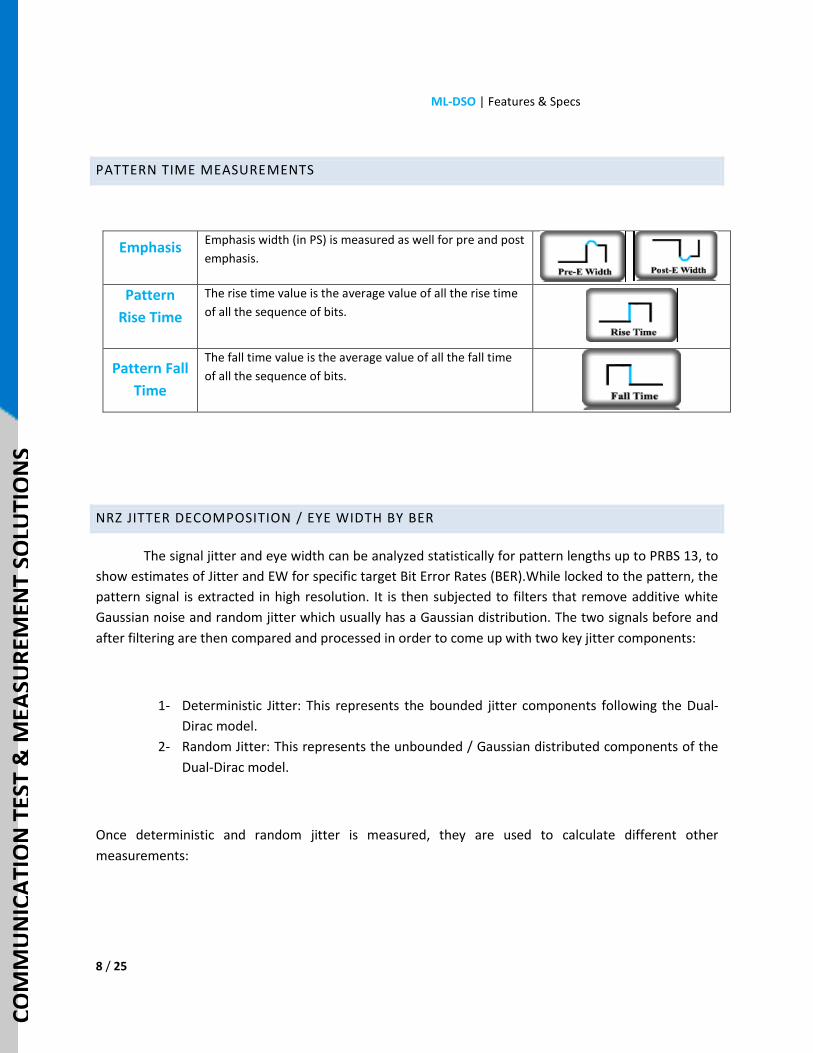
PATTERN AMPLITUDE MEASUREMENTS
VMA
The voltage modulation amplitude of a pattern displayed in
mV.
Emphasis
In high speed digital transmission, pre and post emphasis
are used to improve signal quality at the output of a data
transmission.
ML-DSO | Features & Specs
8 / 25
CO
MM
UN
ICA
TIO
N T
EST
& M
EASU
REM
ENT
SOLU
TIO
NS
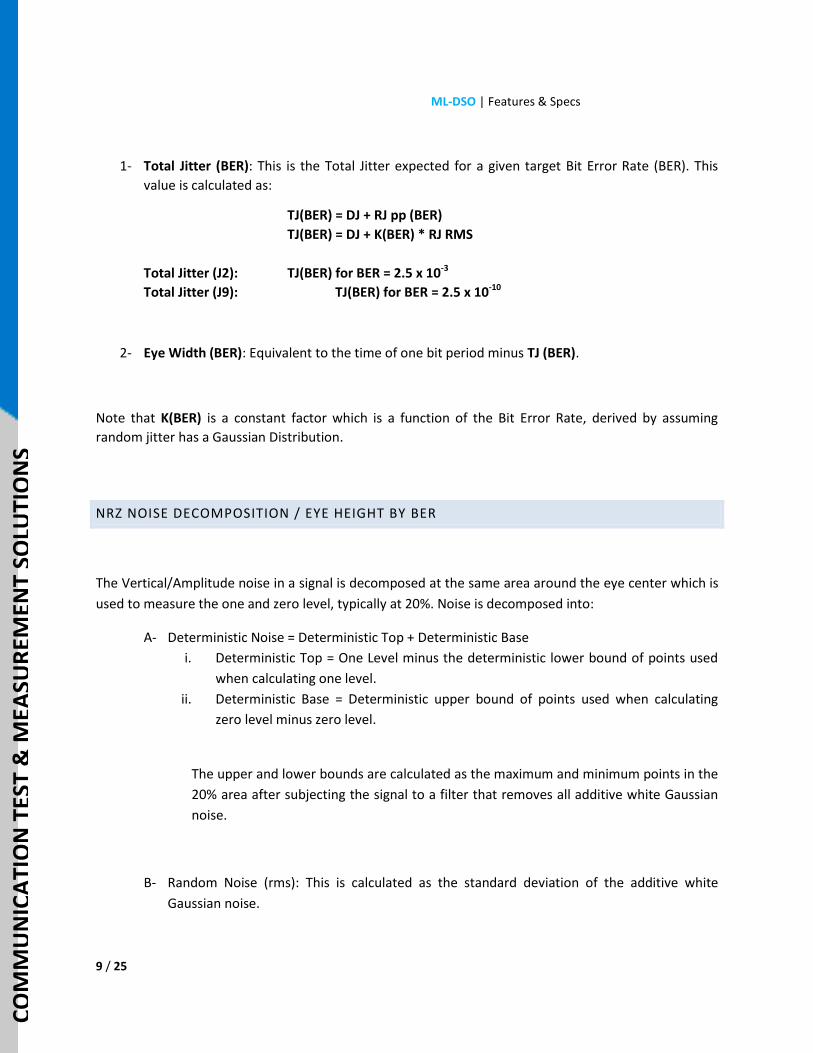
PATTERN TIME MEASUREMENTS
Emphasis
Emphasis width (in PS) is measured as well for pre and post
emphasis.
Pattern
Rise Time
The rise time value is the average value of all the rise time
of all the sequence of bits.
Pattern Fall
Time
The fall time value is the average value of all the fall time
of all the sequence of bits.
NRZ JITTER DECOMPOSITION / EYE WIDTH BY BER
The signal jitter and eye width can be analyzed statistically for pattern lengths up to PRBS 13, to
show estimates of Jitter and EW for specific target Bit Error Rates (BER).While locked to the pattern, the
pattern signal is extracted in high resolution. It is then subjected to filters that remove additive white
Gaussian noise and random jitter which usually has a Gaussian distribution. The two signals before and
after filtering are then compared and processed in order to come up with two key jitter components:
1- Deterministic Jitter: This represents the bounded jitter components following the Dual-
Dirac model.
2- Random Jitter: This represents the unbounded / Gaussian distributed components of the
Dual-Dirac model.
Once deterministic and random jitter is measured, they are used to calculate different other
measurements:
ML-DSO | Features & Specs
9 / 25
CO
MM
UN
ICA
TIO
N T
EST
& M
EASU
REM
ENT
SOLU
TIO
NS
1- Total Jitter (BER): This is the Total Jitter expected for a given target Bit Error Rate (BER). This
value is calculated as:
TJ(BER) = DJ + RJ pp (BER)
TJ(BER) = DJ + K(BER) * RJ RMS
Total Jitter (J2): TJ(BER) for BER = 2.5 x 10⁻³
Total Jitter (J9): TJ(BER) for BER = 2.5 x 10⁻¹⁰
2- Eye Width (BER): Equivalent to the time of one bit period minus TJ (BER).
Note that K(BER) is a constant factor which is a function of the Bit Error Rate, derived by assuming
random jitter has a Gaussian Distribution.
NRZ NOISE DECOMPOSITION / EYE HEIGHT BY BER
The Vertical/Amplitude noise in a signal is decomposed at the same area around the eye center which is
used to measure the one and zero level, typically at 20%. Noise is decomposed into:
A- Deterministic Noise = Deterministic Top + Deterministic Base
i. Deterministic Top = One Level minus the deterministic lower bound of points used
when calculating one level.
ii. Deterministic Base = Deterministic upper bound of points used when calculating
zero level minus zero level.
The upper and lower bounds are calculated as the maximum and minimum points in the
20% area after subjecting the signal to a filter that removes all additive white Gaussian
noise.
B- Random Noise (rms): This is calculated as the standard deviation of the additive white
Gaussian noise.
ML-DSO | Features & Specs
10 / 25
CO
MM
UN
ICA
TIO
N T
EST
& M
EASU
REM
ENT
SOLU
TIO
NS
Once Deterministic and random noise are measured, they are used to calculate other measurements:
1- Total Noise (BER): This is the Total Noise expected for a given target Bit Error Rate (BER). This
value is calculated as:
TN(BER) = DN + RN pp (BER)
TN(BER) = DN + K(BER) * RN rms
2- Eye Height (BER): Equivalent to the time of one bit period minus TN (BER).
Note that K(BER) is a constant factor which is a function of the Bit Error Rate, derived by assuming
random noise has a Gaussian Distribution.
ML-DSO | Features & Specs
11 / 25
CO
MM
UN
ICA
TIO
N T
EST
& M
EASU
REM
ENT
SOLU
TIO
NS
OPTICAL MEASUREMENTS
AOP – Average Optical Power
Measured as 𝑂𝑛𝑒 𝐿𝑒𝑣𝑒𝑙 +𝑍𝑒𝑟𝑜 𝐿𝑒𝑣𝑒𝑙
2
OMA – Optical Modulation Amplitude
The equivalent of Eye Amplitude for electrical, measured as (One Level – Zero Level)
Extinction Ratio
Measured as 10 𝐿𝑜𝑔10 𝑂𝑛𝑒 𝐿𝑒𝑣𝑒𝑙
𝑍𝑒𝑟𝑜 𝐿𝑒𝑣𝑒𝑙
Mask Margin
Mask Margin calculation is available for optical measurements and it is very similar to Electrical mask
margin calculation.
SPECTRAL COMPENSATION TO COMPARE OPTICAL PLUG-INS
The above optical measurements are key metrics for characterizing the TX outputs of E-O
transceivers. Different Optical receivers or optical sampling scope plug-ins will return different Mask
Margin test results for the same input signal. The channel response of the Optical receiver (Insertion
Loss variation, and Group Delay variation) are the main reason that cause varying mask margin results
from the same signal.
DSO Software Filters can be used to spectrally compensate for the channel response variation of
different O/E, rendering signals from different O/E testable and comparable. In manufacturing test
application, measurement repeatability and accuracy are extremely critical. Historically, different optical
plug-ins from the same vendor yielded different results for measurements performed on the same input
signals.
Spectral compensation using DSP yields uniform measurements, as well as a wider dynamic
range of the optical measurements. Spectral shaping has limits however, of the maximum pattern it can
capture, in relation to the memory capture of the scope, and the test time.
Example follows on next page.
ML-DSO | Features & Specs
12 / 25
CO
MM
UN
ICA
TIO
N T
EST
& M
EASU
REM
ENT
SOLU
TIO
NS
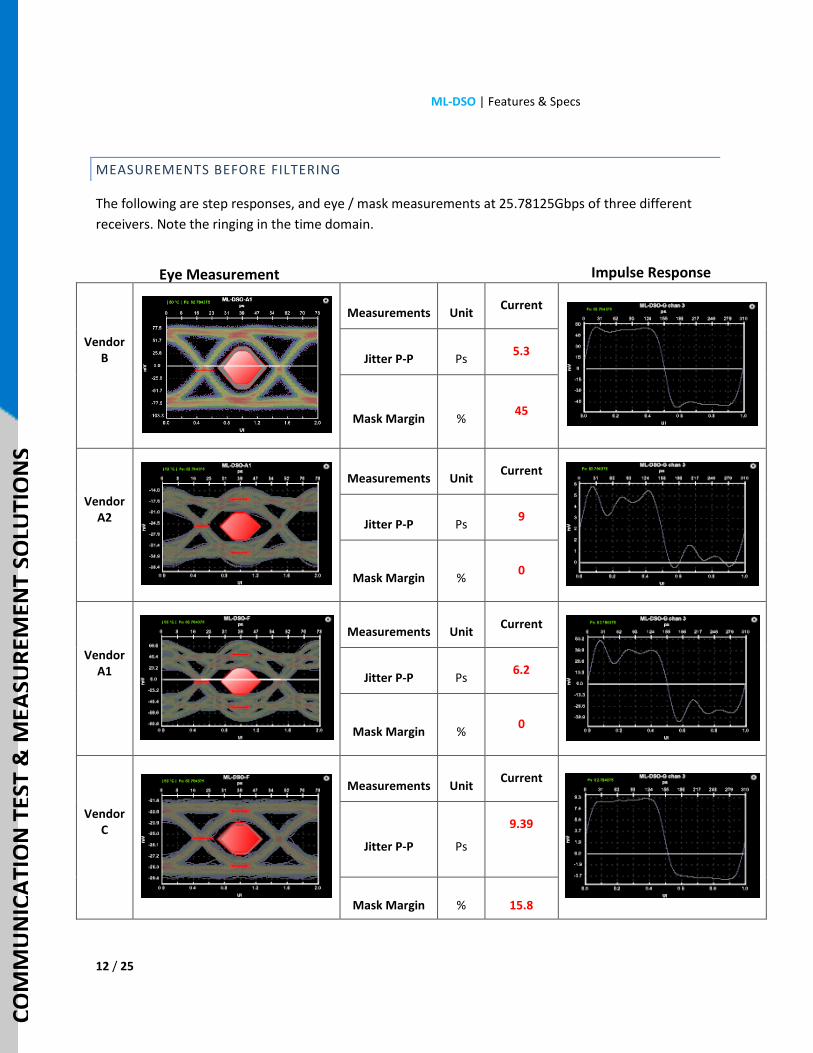
MEASUREMENTS BEFORE FILTERING
The following are step responses, and eye / mask measurements at 25.78125Gbps of three different
receivers. Note the ringing in the time domain.
Vendor B
Measurements Unit Current
Jitter P-P Ps 5.3
Mask Margin % 45
Vendor A2
Measurements Unit Current
Jitter P-P Ps 9
Mask Margin % 0
Vendor A1
Measurements Unit Current
Jitter P-P Ps 6.2
Mask Margin % 0
Vendor C
Measurements Unit Current
Jitter P-P Ps
9.39
Mask Margin % 15.8
Eye Measurement Impulse Response
ML-DSO | Features & Specs
13 / 25
CO
MM
UN
ICA
TIO
N T
EST
& M
EASU
REM
ENT
SOLU
TIO
NS
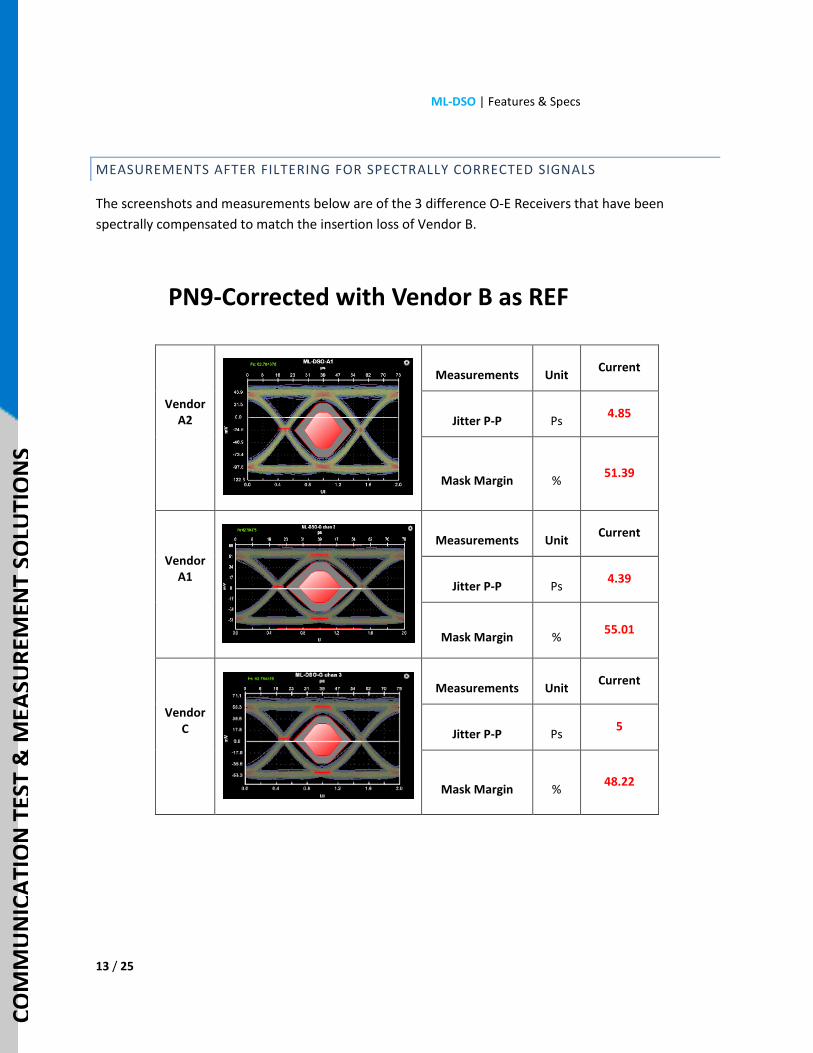
MEASUREMENTS AFTER FILTERING FOR SPECTRALLY CORRECTED SIGNALS
The screenshots and measurements below are of the 3 difference O-E Receivers that have been
spectrally compensated to match the insertion loss of Vendor B.
Vendor A2
Measurements Unit Current
Jitter P-P Ps 4.85
Mask Margin % 51.39
Vendor A1
Measurements Unit Current
Jitter P-P Ps 4.39
Mask Margin % 55.01
Vendor C
Measurements Unit Current
Jitter P-P Ps 5
Mask Margin % 48.22
PN9-Corrected with Vendor B as REF
ML-DSO | Features & Specs
14 / 25
CO
MM
UN
ICA
TIO
N T
EST
& M
EASU
REM
ENT
SOLU
TIO
NS
PAM 4 MEASUREMENTS
PAM 4 measurements implemented in the DSO software follow the Optical Internetwork
Forum’s (OIF) requirements. Multilane is an active member of the Optical Internetworking Forum and is
updating these measurements as new rules/requirements are being decided.
Measurements can be split in two categories:
A- Measurements that analyze PAM 4 eyes in eye mode and can work up to PRBS 31
B- Measurements that depend on the pattern signal and can work up to PRBS 13. Note that
applying any software filters on the signal would require pattern lock as well and is therefore
also limited to PRBS13
PAM 4 EYE MEASUREMENTS (UNRESTRICTED PATTERN LENGTH)
a. AVupp, AVmid, AVlow: Vertical Amplitudes
b. Vupp, Vmid, Vlow: Vertical Eye Openings
c. Hupp, Hmid, Hlow: Horizontal Eye Openings
d. VEC: Vertical Eye Closure
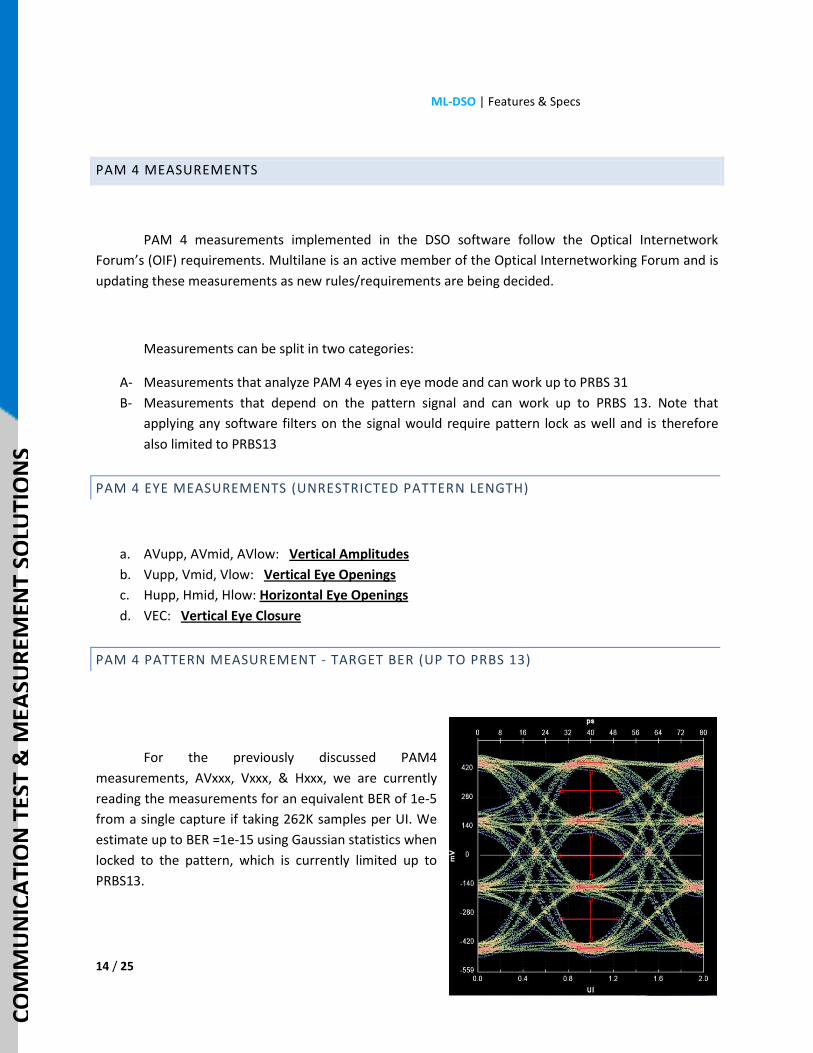
PAM 4 PATTERN MEASUREMENT - TARGET BER (UP TO PRBS 13)
For the previously discussed PAM4
measurements, AVxxx, Vxxx, & Hxxx, we are currently
reading the measurements for an equivalent BER of 1e-5
from a single capture if taking 262K samples per UI. We
estimate up to BER =1e-15 using Gaussian statistics when
locked to the pattern, which is currently limited up to
PRBS13.
ML-DSO | Features & Specs
15 / 25
CO
MM
UN
ICA
TIO
N T
EST
& M
EASU
REM
ENT
SOLU
TIO
NS
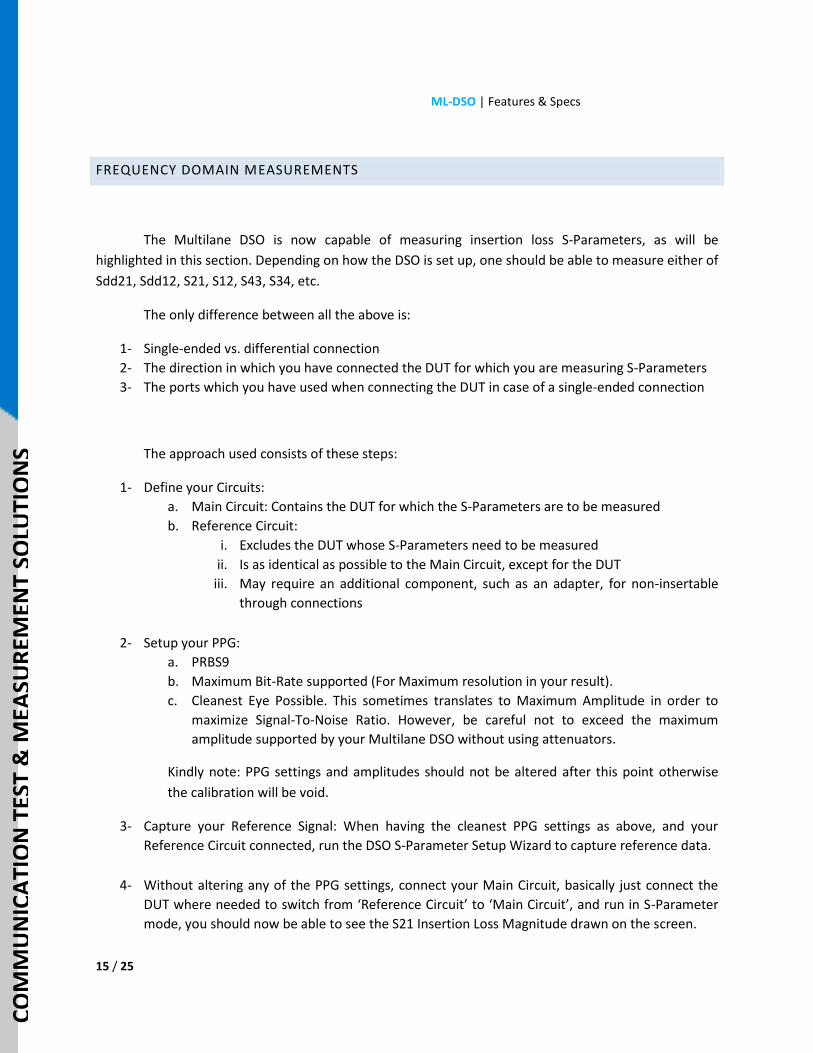
FREQUENCY DOMAIN MEASUREMENTS
The Multilane DSO is now capable of measuring insertion loss S-Parameters, as will be
highlighted in this section. Depending on how the DSO is set up, one should be able to measure either of
Sdd21, Sdd12, S21, S12, S43, S34, etc.
The only difference between all the above is:
1- Single-ended vs. differential connection
2- The direction in which you have connected the DUT for which you are measuring S-Parameters
3- The ports which you have used when connecting the DUT in case of a single-ended connection
The approach used consists of these steps:
1- Define your Circuits:
a. Main Circuit: Contains the DUT for which the S-Parameters are to be measured
b. Reference Circuit:
i. Excludes the DUT whose S-Parameters need to be measured
ii. Is as identical as possible to the Main Circuit, except for the DUT
iii. May require an additional component, such as an adapter, for non-insertable
through connections
2- Setup your PPG:
a. PRBS9
b. Maximum Bit-Rate supported (For Maximum resolution in your result).
c. Cleanest Eye Possible. This sometimes translates to Maximum Amplitude in order to
maximize Signal-To-Noise Ratio. However, be careful not to exceed the maximum
amplitude supported by your Multilane DSO without using attenuators.
Kindly note: PPG settings and amplitudes should not be altered after this point otherwise
the calibration will be void.
3- Capture your Reference Signal: When having the cleanest PPG settings as above, and your
Reference Circuit connected, run the DSO S-Parameter Setup Wizard to capture reference data.
4- Without altering any of the PPG settings, connect your Main Circuit, basically just connect the
DUT where needed to switch from ‘Reference Circuit’ to ‘Main Circuit’, and run in S-Parameter
mode, you should now be able to see the S21 Insertion Loss Magnitude drawn on the screen.
ML-DSO | Features & Specs
16 / 25
CO
MM
UN
ICA
TIO
N T
EST
& M
EASU
REM
ENT
SOLU
TIO
NS
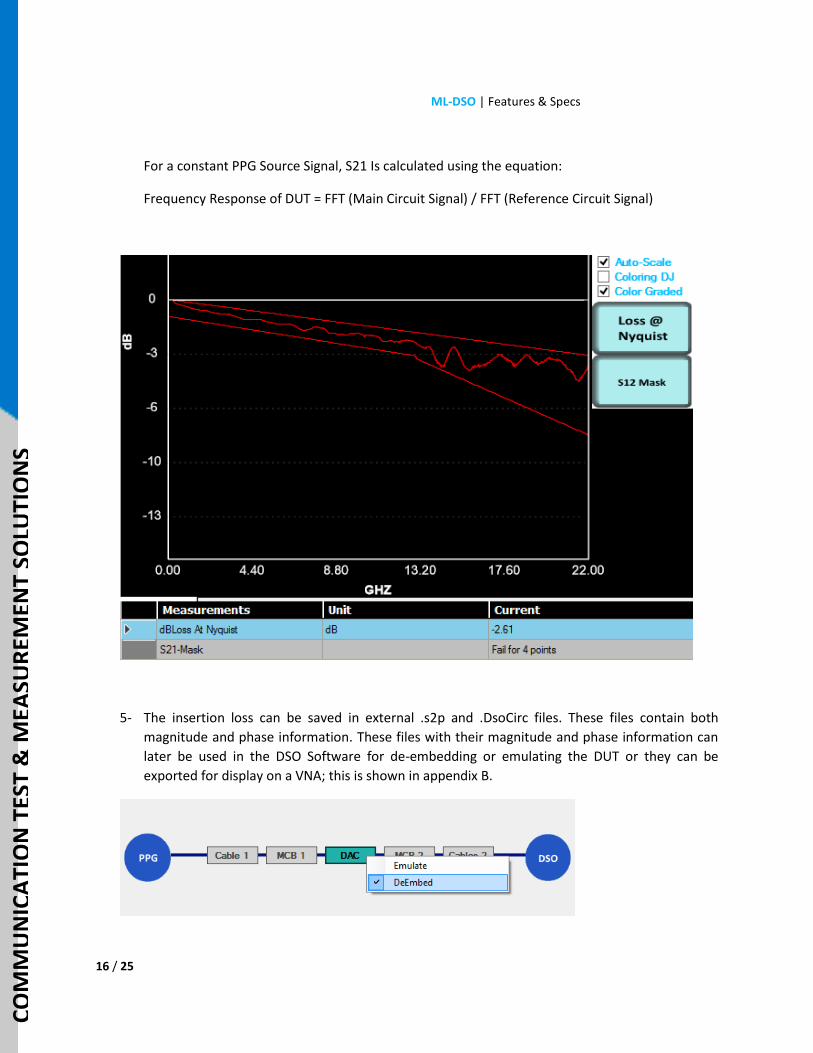
For a constant PPG Source Signal, S21 Is calculated using the equation:
Frequency Response of DUT = FFT (Main Circuit Signal) / FFT (Reference Circuit Signal)
5- The insertion loss can be saved in external .s2p and .DsoCirc files. These files contain both
magnitude and phase information. These files with their magnitude and phase information can
later be used in the DSO Software for de-embedding or emulating the DUT or they can be
exported for display on a VNA; this is shown in appendix B.
ML-DSO | Features & Specs
17 / 25
CO
MM
UN
ICA
TIO
N T
EST
& M
EASU
REM
ENT
SOLU
TIO
NS
Loss at Nyquist
Loss at Nyquist frequency, half the baud rate, is measured and displayed.
Frequency Response Masks
Masks are available for checking the validity of the frequency response, supporting custom and
predefined masks.
DSO ARCHITECTURE
This section describes the different layers of the DSO and how they interact with each other to
make the functioning product.
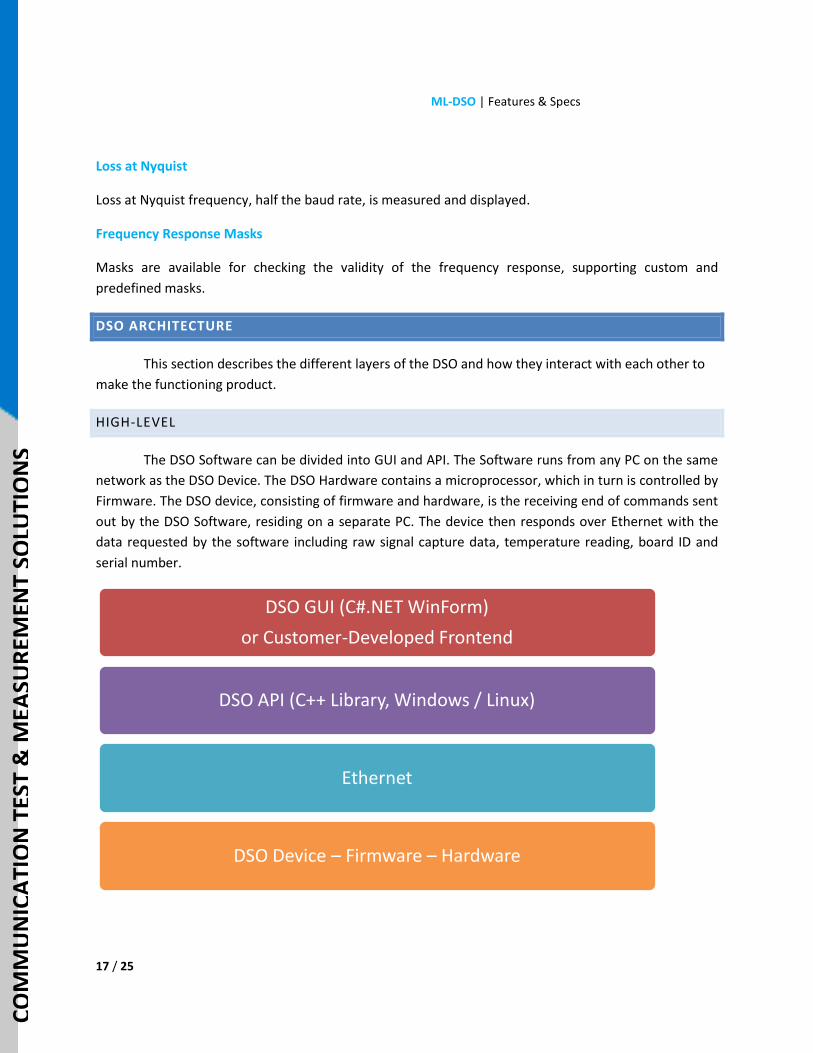
HIGH-LEVEL
The DSO Software can be divided into GUI and API. The Software runs from any PC on the same
network as the DSO Device. The DSO Hardware contains a microprocessor, which in turn is controlled by
Firmware. The DSO device, consisting of firmware and hardware, is the receiving end of commands sent
out by the DSO Software, residing on a separate PC. The device then responds over Ethernet with the
data requested by the software including raw signal capture data, temperature reading, board ID and
serial number.
DSO GUI (C#.NET WinForm)
or Customer-Developed Frontend
DSO API (C++ Library, Windows / Linux)
Ethernet
DSO Device – Firmware – Hardware

ML-DSO | Features & Specs
18 / 25
CO
MM
UN
ICA
TIO
N T
EST
& M
EASU
REM
ENT
SOLU
TIO
NS
SOFTWARE ARCHITECTURE
The DSO Software consists of a front end and a C++ API. The C++ API is provided for both
Windows and Linux with sample front-end code that executes the API.
The front end code can typically be developed using any programming language. This is the
interface or application that the user interacts with. We support our customers getting started with the
API and provide sample code when available, depending on the language used by the customer. We
have partners/customers using the DSO API with front-ends written in .NET Framework, C++, Python,
Labview, Verigy 93K SmarTest Environment and even Matlab.
In addition to the API, Multilane provides a full-featured GUI for use with the DSO. The DSO GUI
is a full featured front end developed by Multilane for Windows using C#.NET. In addition to
demonstrating API features, the DSO GUI also contains additional features not present in the API, such
as:
Detailed graphs and a user friendly interface, includes graph markers for manual validation of
measurements, and UI features such as easy ability to remember and switch between different
configurations, etc.
Experimental features and measurements and newly released features appear in GUI before the
API
Various graphical wizards necessary for generating configurations re-usable by the API, such as
software filters and simulation data
FIRMWARE
The firmware of the DSO exposes various functionalities including:
1- Retrieving sampled data from the DSO
2- Reading temperature
3- Reading diagnostic information:
a. Board ID
b. Serial Number
c. Firmware Revision
4- Reading/writing DSO Calibrations
5- Controlling the required PLL dividers to achieve a desired sampling frequency
6- Controlling features such as Clock Data Recovery in hardware flavors where CDR is available
7- Providing access to on-board EE-PROM memory used to saving board-specific details such as
the latest settings used when connecting to the board
ML-DSO | Features & Specs
19 / 25
CO
MM
UN
ICA
TIO
N T
EST
& M
EASU
REM
ENT
SOLU
TIO
NS
HARDWARE ARCHITECTURE
In summary, the DSO hardware consists of:
A Sampling Clock, connected to a Track and Hold (T/H), and an Analog to Digital converter (A-
to-D)
At the desired ETS sampling rate, the T/H will read an analogue voltage amplitude level,
convert it to digital using the A-to-D, which would end up as integer from 0 to 4095. This
integer is loaded into a FIFO.
A microprocessor is controlling/listening to the Ethernet, and when it receives specific
commands it dumps back over Ethernet the content of the FIFO, which are converted to
voltage amplitude levels by the DSO Software based on DSO Calibrations saved on the device
itself.
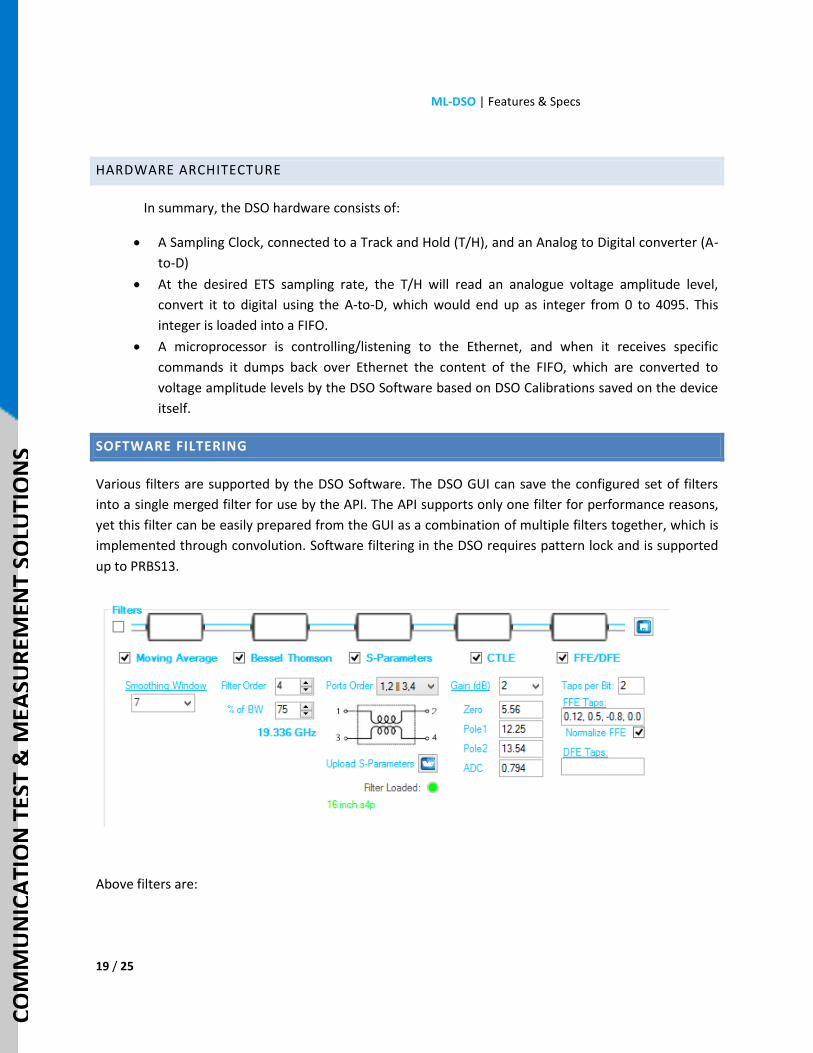
SOFTWARE FILTERING
Various filters are supported by the DSO Software. The DSO GUI can save the configured set of filters
into a single merged filter for use by the API. The API supports only one filter for performance reasons,
yet this filter can be easily prepared from the GUI as a combination of multiple filters together, which is
implemented through convolution. Software filtering in the DSO requires pattern lock and is supported
up to PRBS13.
Above filters are:
ML-DSO | Features & Specs
20 / 25
CO
MM
UN
ICA
TIO
N T
EST
& M
EASU
REM
ENT
SOLU
TIO
NS
1- Moving Average: This time-domain filter replaces each sample with the average of the nearest N
samples, N being the number of samples specified as the moving average window. This filter is
equivalent to a convolution with a square signal, which would be a sinc function in the
frequency domain.
2- Bessel Thomson: The Bessel Thomson low pass filter can be enabled for any desired filter order
and bandwidth relative to the connected signal bit rate.
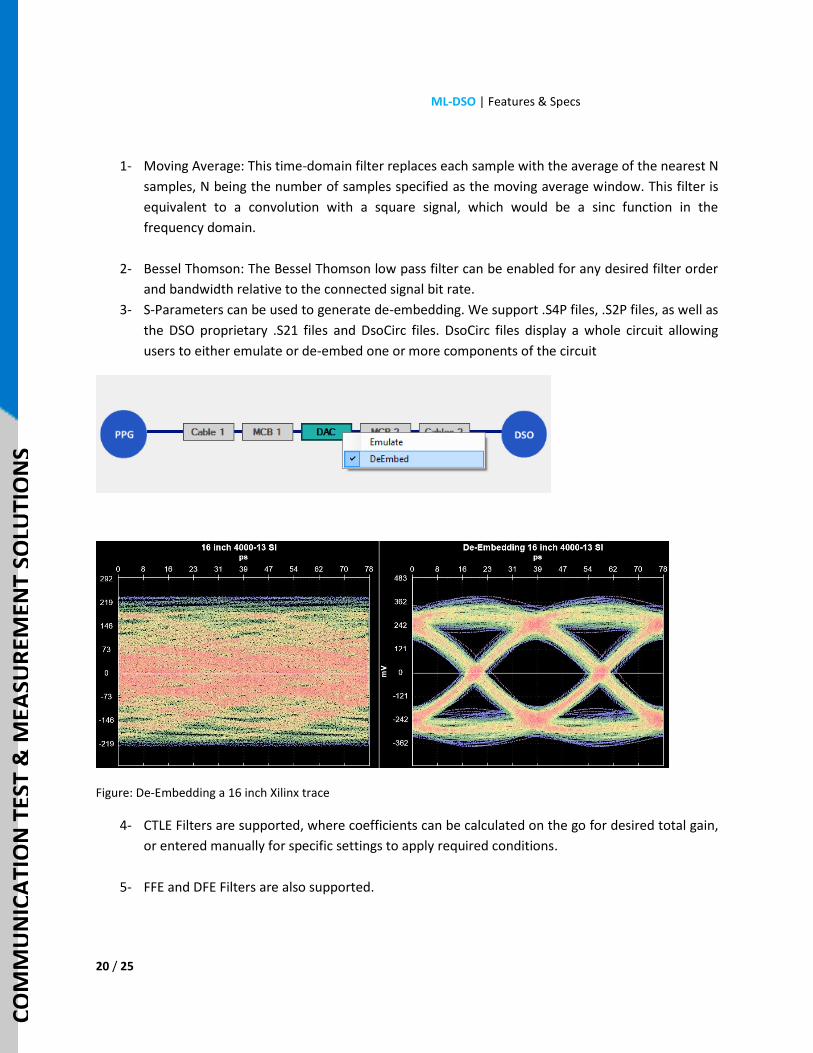
3- S-Parameters can be used to generate de-embedding. We support .S4P files, .S2P files, as well as
the DSO proprietary .S21 files and DsoCirc files. DsoCirc files display a whole circuit allowing
users to either emulate or de-embed one or more components of the circuit
Figure: De-Embedding a 16 inch Xilinx trace
4- CTLE Filters are supported, where coefficients can be calculated on the go for desired total gain,
or entered manually for specific settings to apply required conditions.
5- FFE and DFE Filters are also supported.
ML-DSO | Features & Specs
21 / 25
CO
MM
UN
ICA
TIO
N T
EST
& M
EASU
REM
ENT
SOLU
TIO
NS
APPENDIX A: DSO PRODUCT FAMILY
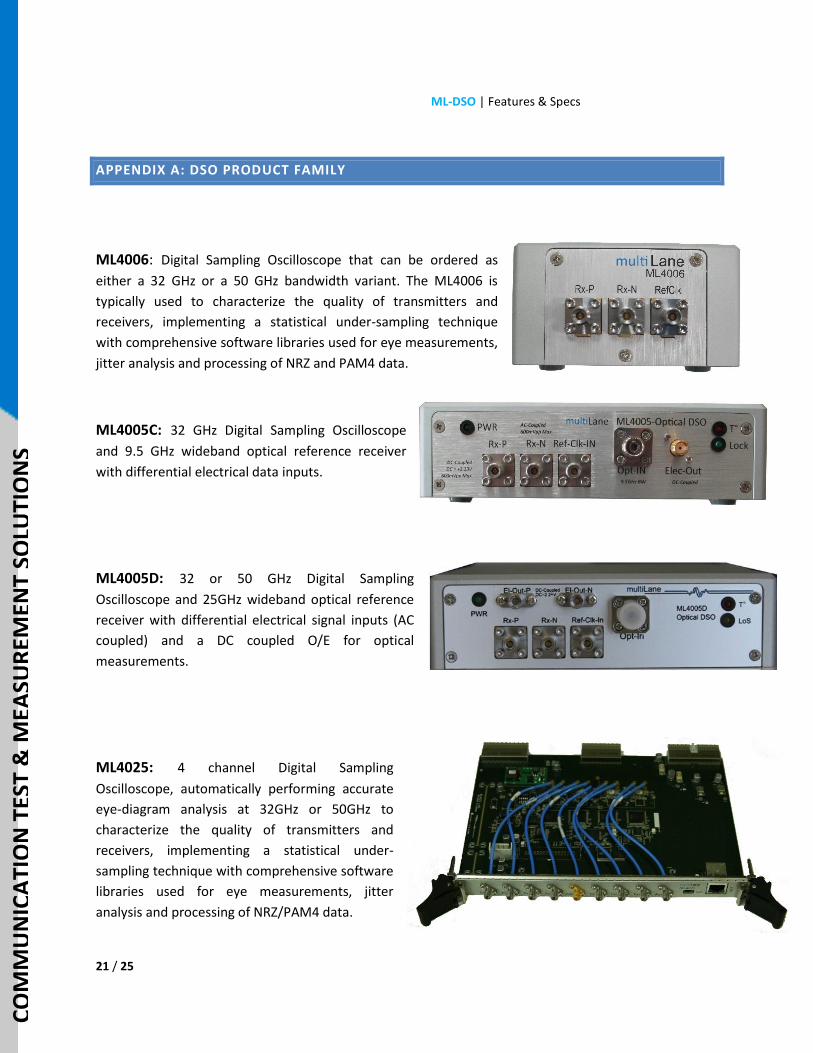
ML4006: Digital Sampling Oscilloscope that can be ordered as
either a 32 GHz or a 50 GHz bandwidth variant. The ML4006 is
typically used to characterize the quality of transmitters and
receivers, implementing a statistical under-sampling technique
with comprehensive software libraries used for eye measurements,
jitter analysis and processing of NRZ and PAM4 data.
ML4005C: 32 GHz Digital Sampling Oscilloscope
and 9.5 GHz wideband optical reference receiver
with differential electrical data inputs.
ML4005D: 32 or 50 GHz Digital Sampling
Oscilloscope and 25GHz wideband optical reference
receiver with differential electrical signal inputs (AC
coupled) and a DC coupled O/E for optical
measurements.
ML4025: 4 channel Digital Sampling
Oscilloscope, automatically performing accurate
eye-diagram analysis at 32GHz or 50GHz to
characterize the quality of transmitters and
receivers, implementing a statistical under-
sampling technique with comprehensive software
libraries used for eye measurements, jitter
analysis and processing of NRZ/PAM4 data.
ML-DSO | Features & Specs
22 / 25
CO
MM
UN
ICA
TIO
N T
EST
& M
EASU
REM
ENT
SOLU
TIO
NS
APPENDIX B: CORRELATION REPORT – TIME DOMAIN MEASUREMENTS
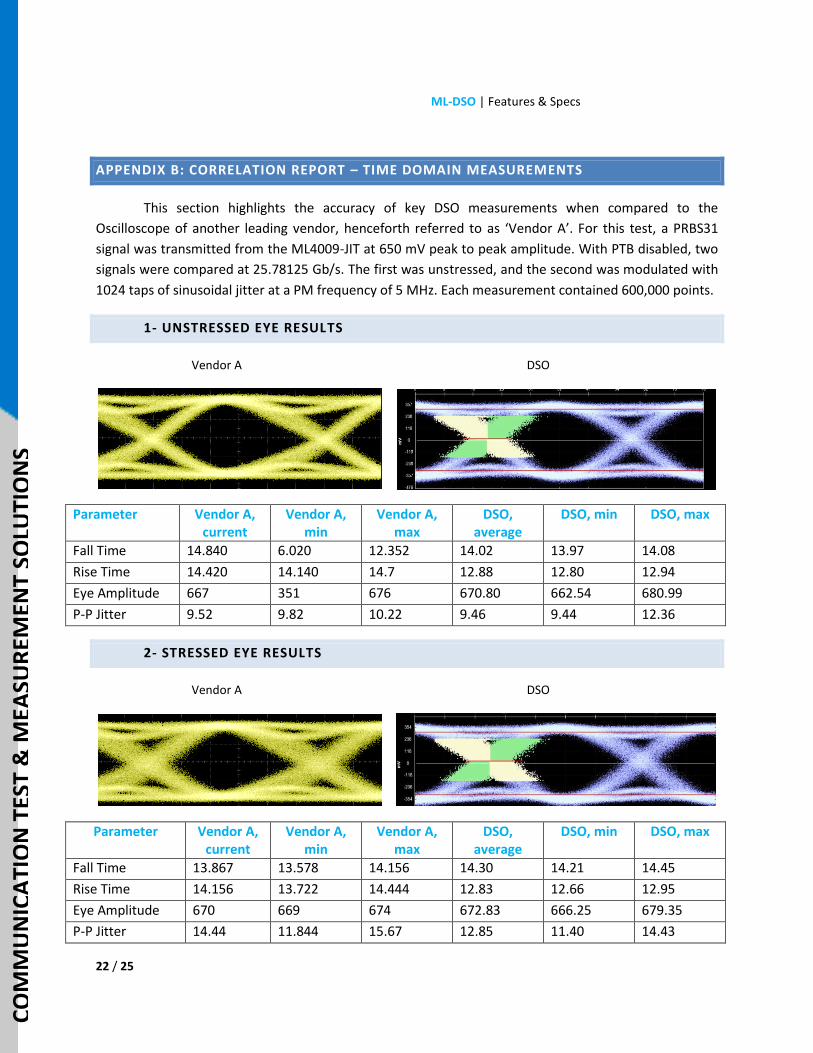
This section highlights the accuracy of key DSO measurements when compared to the
Oscilloscope of another leading vendor, henceforth referred to as ‘Vendor A’. For this test, a PRBS31
signal was transmitted from the ML4009-JIT at 650 mV peak to peak amplitude. With PTB disabled, two
signals were compared at 25.78125 Gb/s. The first was unstressed, and the second was modulated with
1024 taps of sinusoidal jitter at a PM frequency of 5 MHz. Each measurement contained 600,000 points.
1- UNSTRESSED EYE RESULTS
Vendor A DSO
Parameter Vendor A, current
Vendor A, min
Vendor A, max
DSO, average
DSO, min DSO, max
Fall Time 14.840 6.020 12.352 14.02 13.97 14.08
Rise Time 14.420 14.140 14.7 12.88 12.80 12.94
Eye Amplitude 667 351 676 670.80 662.54 680.99
P-P Jitter 9.52 9.82 10.22 9.46 9.44 12.36
2- STRESSED EYE RESULTS
Vendor A DSO
Parameter Vendor A, current
Vendor A, min
Vendor A, max
DSO, average
DSO, min DSO, max
Fall Time 13.867 13.578 14.156 14.30 14.21 14.45
Rise Time 14.156 13.722 14.444 12.83 12.66 12.95
Eye Amplitude 670 669 674 672.83 666.25 679.35
P-P Jitter 14.44 11.844 15.67 12.85 11.40 14.43
ML-DSO | Features & Specs
23 / 25
CO
MM
UN
ICA
TIO
N T
EST
& M
EASU
REM
ENT
SOLU
TIO
NS
APPENDIX C: CORRELATION REPORT – S21 MEASUREMENT
Various circuits were measured to determine how the DSO measurement compares to a VNA.
The results are presented below.
DIRECT ATTACH CABLE INSERTION LOSS MEASUREMENT
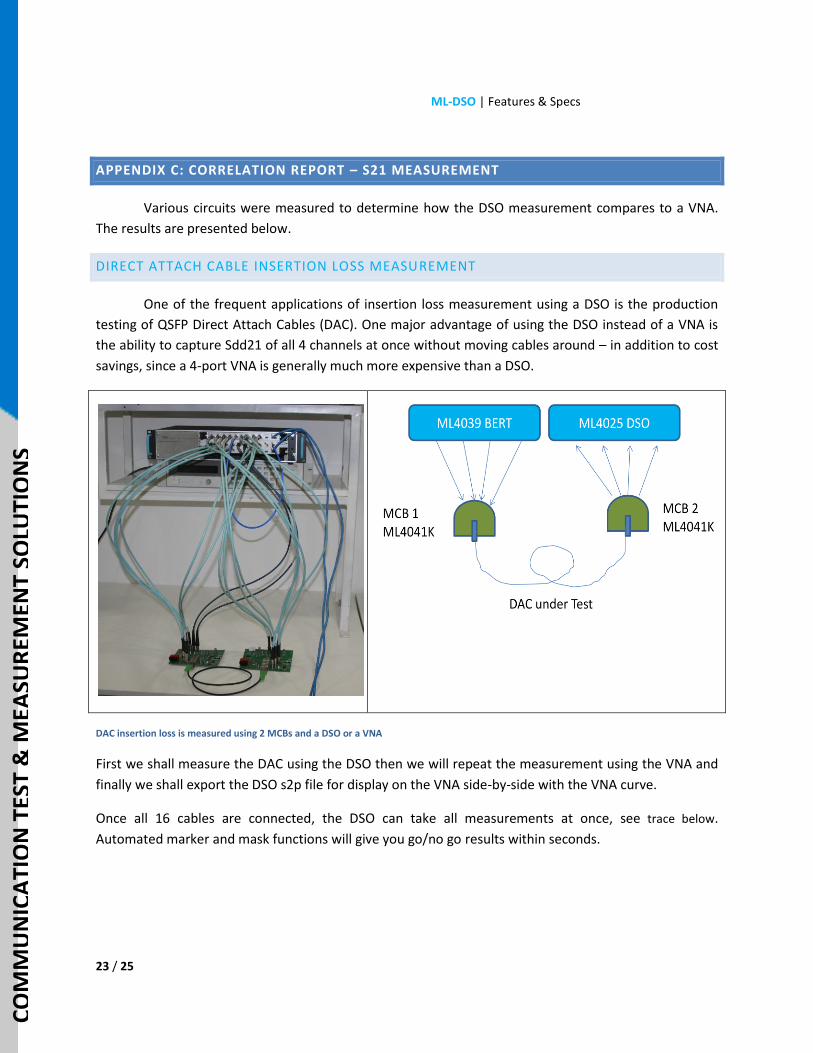
One of the frequent applications of insertion loss measurement using a DSO is the production
testing of QSFP Direct Attach Cables (DAC). One major advantage of using the DSO instead of a VNA is
the ability to capture Sdd21 of all 4 channels at once without moving cables around – in addition to cost
savings, since a 4-port VNA is generally much more expensive than a DSO.
DAC insertion loss is measured using 2 MCBs and a DSO or a VNA
First we shall measure the DAC using the DSO then we will repeat the measurement using the VNA and
finally we shall export the DSO s2p file for display on the VNA side-by-side with the VNA curve.
Once all 16 cables are connected, the DSO can take all measurements at once, see trace below.
Automated marker and mask functions will give you go/no go results within seconds.
ML-DSO | Features & Specs
24 / 25
CO
MM
UN
ICA
TIO
N T
EST
& M
EASU
REM
ENT
SOLU
TIO
NS
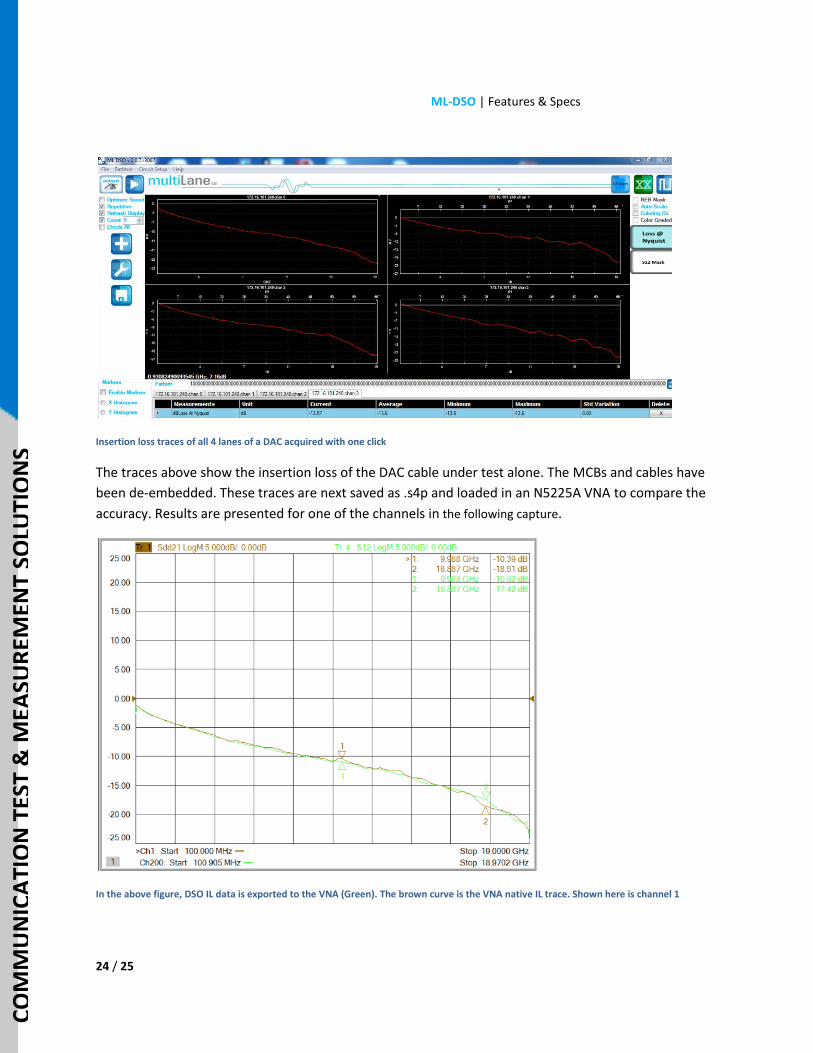
Insertion loss traces of all 4 lanes of a DAC acquired with one click
The traces above show the insertion loss of the DAC cable under test alone. The MCBs and cables have
been de-embedded. These traces are next saved as .s4p and loaded in an N5225A VNA to compare the
accuracy. Results are presented for one of the channels in the following capture.
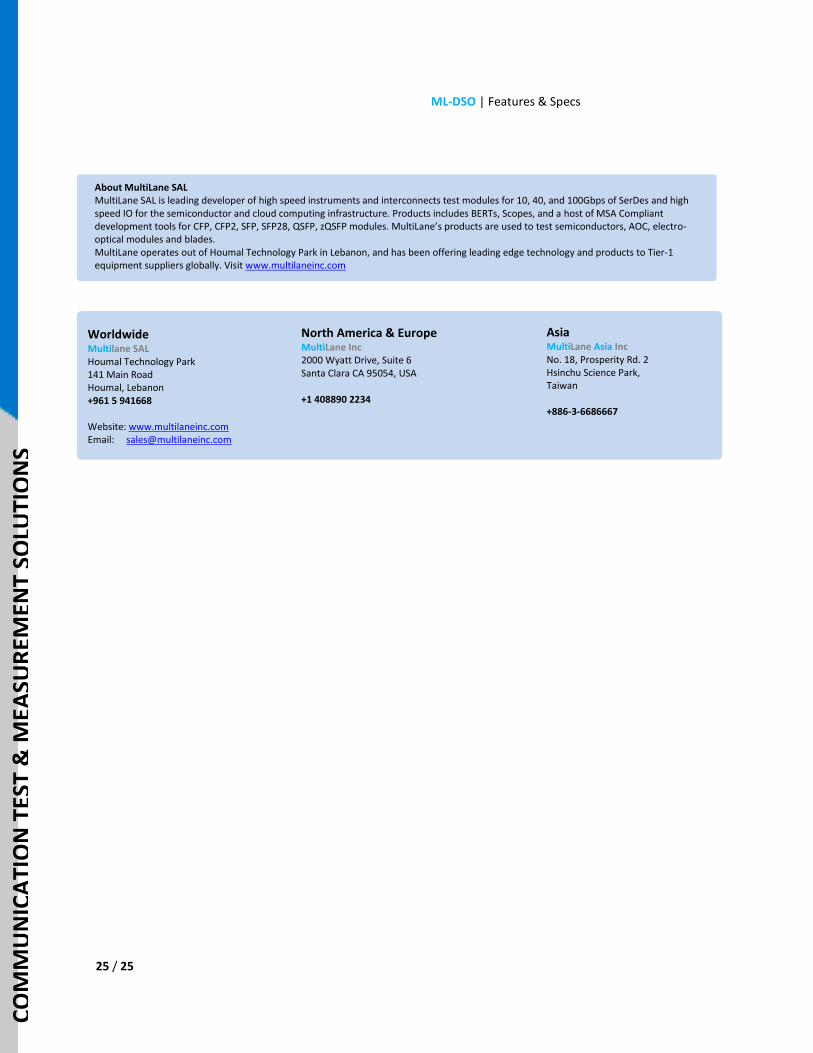
In the above figure, DSO IL data is exported to the VNA (Green). The brown curve is the VNA native IL trace. Shown here is channel 1
ML-DSO | Features & Specs
25 / 25
CO
MM
UN
ICA
TIO
N T
EST
& M
EASU
REM
ENT
SOLU
TIO
NS
About MultiLane SAL MultiLane SAL is leading developer of high speed instruments and interconnects test modules for 10, 40, and 100Gbps of SerDes and high speed IO for the semiconductor and cloud computing infrastructure. Products includes BERTs, Scopes, and a host of MSA Compliant development tools for CFP, CFP2, SFP, SFP28, QSFP, zQSFP modules. MultiLane’s products are used to test semiconductors, AOC, electro-optical modules and blades. MultiLane operates out of Houmal Technology Park in Lebanon, and has been offering leading edge technology and products to Tier-1 equipment suppliers globally. Visit www.multilaneinc.com
Worldwide Multilane SAL Houmal Technology Park 141 Main Road Houmal, Lebanon +961 5 941668 Website: www.multilaneinc.com Email: [email protected]
North America & Europe
MultiLane Inc 2000 Wyatt Drive, Suite 6 Santa Clara CA 95054, USA
+1 408890 2234
Asia MultiLane Asia Inc No. 18, Prosperity Rd. 2 Hsinchu Science Park, Taiwan +886-3-6686667


![CHAPTER-4 Line Codes RZ: Return to Zero [ pulse for half ... · NRZ . Return to Zero[ pulse for full duration of T. b ] Unipolar (NRZ) Unipolar NRZ . NRZ-inverted (differential](https://img.pdfslide.us/doc/110x75/5cc1fa9b88c9933e3a8d2cb0/chapter-4-line-codes-rz-return-to-zero-pulse-for-half-nrz-return-to.jpg)