Embed Size (px)
Citation preview
Demographic Expansion Endures
Investment Activity Slows Down
Tech-Focused Workforce Favors Rebound
MULTIFAMILY REPORT
Raleigh: FirstSigns of RecoverySummer 2020
Contacts Jeff Adler Vice President & General Manager of Yardi Matrix [email protected] (303) 615-3676
Jack Kern Director of Research and Publications [email protected] (800) 866-1124 x2444
Ron Brock, Jr. Industry Principal, Matrix [email protected] (480) 663-1149 x2404
AuthorLaura Calugar Senior Associate Editor
Rental Market Improves Slightly
Recent Raleigh Transactions
The Raleigh-Durham multifamily market has historically been re-silient to downturns. Although stay-at-home orders, significant job losses and tightening bank policies at the onset of the crisis have shaken the metro’s economy, the metro showed signs of resilience this summer. Rents inched up 0.2% on a trailing three-month basis through August to $1,223, while the national rate remained flat.
Raleigh’s unemployment rate hit 11.5% in May, but that figure had dropped to 8.0% by July, according to preliminary data from the U.S. Bureau of Labor Statistics. All employment sectors contract-ed in the 12 months ending in June, but small businesses that lost revenue due to COVID-19 were eligible to receive support through Wake County’s $5 million Wake Forward program. Moreover, Duke University announced a $100 million investment in Research Tri-angle Park for an expansion of its school of medicine, in addition to several private sector investments prompted by the pandemic.
Almost $736 million in multifamily properties traded in Raleigh-Durham in the first eight months of 2020. While the Triangle was not immune to coronavirus-related headwinds, the apartment market’s performance remained relatively stable. Going forward, Raleigh-Durham is likely to benefit from investors’ appetite for less dense metros with strong talent pools.
City: Raleigh, N.C.Buyer: Knightvest Capital Purchase Price: $42 MMPrice per Unit: $168,000
The Ashton
City: Cary, N.C. Buyer: Eaton Vance Corp. Purchase Price: $69 MMPrice per Unit: $229,470
The Manor at Weston
Chandler at University Tower
Oakley Square
City: Durham, N.C. Buyer: Knightvest Capital Purchase Price: $38 MMPrice per Unit: $204,301
City: Durham, N.C. Buyer: Vitus Group Purchase Price: $11 MMPrice per Unit: $112,500
On the cover: Photo by Mark Howard/iStockphoto.com
RALEIGH MULTIFAMILY
Market Analysis | Summer 2020
Raleigh Multifamily | Summer 2020 3
Raleigh vs. National Rent Growth (Trailing 3 Months)
RENT TRENDS
➤ Rents in Raleigh-Durham rose 0.2% on a trailing three-month basis through August, while nation-al rents remained flat. The average rent clocked in at $1,223, trailing the $1,463 U.S. figure. The working-class Renter-by-Necessity segment led growth, with rates up by 0.4% to $1,054, while Lifestyle rents increased by 0.1% to $1,306.
➤ Spurred by an educated workforce, lower popu-lation densities and generally more affordable housing options than gateway metros, tech-driv-en secondary markets were among the best-per-forming prior to the pandemic and continued to fare well during the COVID-19 economic fallout.
➤ At the end of August, North Carolina’s governor announced a new program would provide $175
million in funding for utility and rental payment assistance for households across the state. Ad-ditionally, the North Carolina state legislature passed a $1.1 billion COVID-19 relief package that included extra credit grants for families with children age 17 and younger.
➤ Roughly a third of the 49 submarkets in Ra-leigh-Durham saw rents contract year-over-year as of August, with the steepest declines in Apex (-5.6%) and Woodcroft (-3.3%). Urban core submarkets such as Rhamkatte ($1,596), Downtown Durham ($1,556) and Crabtree Valley ($1,456) remained the most expensive areas of the Triangle.
Raleigh Rent Growth by Asset Class (Trailing 3 Months)
Source: Yardi Matrix
Source: Yardi Matrix
Raleigh Multifamily | Summer 2020 4
➤ Raleigh kicked off the second quarter with an 11.0% unemployment rate, which, by May, had risen to 11.5% due to the statewide lockdown. The situation in Durham-Chapel Hill was similar, with the unemployment rate reaching 10.6% in May. As of July, the rate hovered around 8.0% in both areas, preliminary BLS data showed.
➤ The metro has a large footprint in tourism and manufacturing, and these particular sectors have been hit the hardest by the ongoing health crisis. Leisure and hospitality slid by 36.3% year-over-year through June, while manufactur-ing contracted by 17.2%. Despite this test, the area’s research universities and strong tech pres-
ence are likely to help the Triangle fare better than other comparable metros. Raleigh-Durham ranked No. 10 among 50 major U.S. and Cana-dian metros for tech talent, according to a CBRE analysis. The report found the Triangle has more favorable tech hiring conditions for employers compared to the Bay Area, Seattle or Boston.
➤ Gov. Roy Cooper announced a three-phase plan to reopen North Carolina’s economy, with the first phase going into effect on May 8. Corona-virus restrictions have progressively loosened, with the state entering Phase 2.5 in Septem-ber, which allows gyms, museums and play-grounds to reopen with reduced capacity.
Raleigh Employment Share by Sector
Current EmploymentCode Employment Sector (000) % Share
15 Mining, Logging and Construction 51 5.8%55 Financial Activities 49 5.6%50 Information 26 2.9%80 Other Services 36 4.1%90 Government 155 17.6%60 Professional and Business Services 163 18.5%40 Trade, Transportation and Utilities 144 16.3%30 Manufacturing 54 6.1%65 Education and Health Services 137 15.5%70 Leisure and Hospitality 67 7.6%
Sources: Yardi Matrix, Bureau of Labor Statistics
ECONOMIC SNAPSHOT
2016 2017 2018 2019
National 323,071,342 325,147,121 327,167,434 328,239,523
Raleigh Metro 1,303,845 1,334,342 1,362,540 1,390,785
Sources: U.S. Census, Moody’s Analytics
Population
➤ Raleigh is the fastest-growing major metro in the Carolinas. Last year, the city gained 28,245 residents for a 2.1% uptick, followed by Charlotte (1.7%) and Durham (1.5%).
➤ In the decade ending in 2019, Ra-leigh’s population rose 22.3%, while the U.S. growth rate was 6.1%.
Raleigh vs. National Population
Raleigh Multifamily | Summer 2020 5
Raleigh vs. National Completions as a Percentage of Total Stock (as of August 2020)
➤ Raleigh-Durham had 8,533 rental units under-way as of August, almost half of which were initially slated to come online by year-end. The bulk of the upcoming inventory is geared to-ward the Lifestyle segment, which is likely to continue to feel the impact of the coronavirus crisis, considering the current economic con-text is fueling demand for product at the op-posite end of the quality spectrum.
➤ Developers brought 3,069 units online in the first eight months of the year, accounting for 1.9% of total stock and equating roughly half of last year’s 6,010-unit cycle peak. Despite supply-chain disruptions and strict measures to keep construction workers safe, multifamily projects slowly advanced during the health crisis as de-velopers adapted to the new conditions.
➤ As of August, roughly a quarter of the multi-family pipeline was clustered in two submar-kets: Morrisville (1,213 units underway) and Chapel Hill (816 units underway). All proper-ties under construction in these areas cater to the upscale segment.
➤ The largest project under construction was Wood Partners’ seven-building Alta Davis. The 403-unit development in Durham will be close to Research Triangle Park, Imperial Center Business Park and Perimeter Park—three of the largest employment hubs in the Carolinas. First Citizens Bank provided the developer with $45.2 million in construction financing.
Source: Yardi Matrix
Raleigh Completions (as of August 2020)
SUPPLY
Source: Yardi Matrix
Raleigh Multifamily | Summer 2020 6
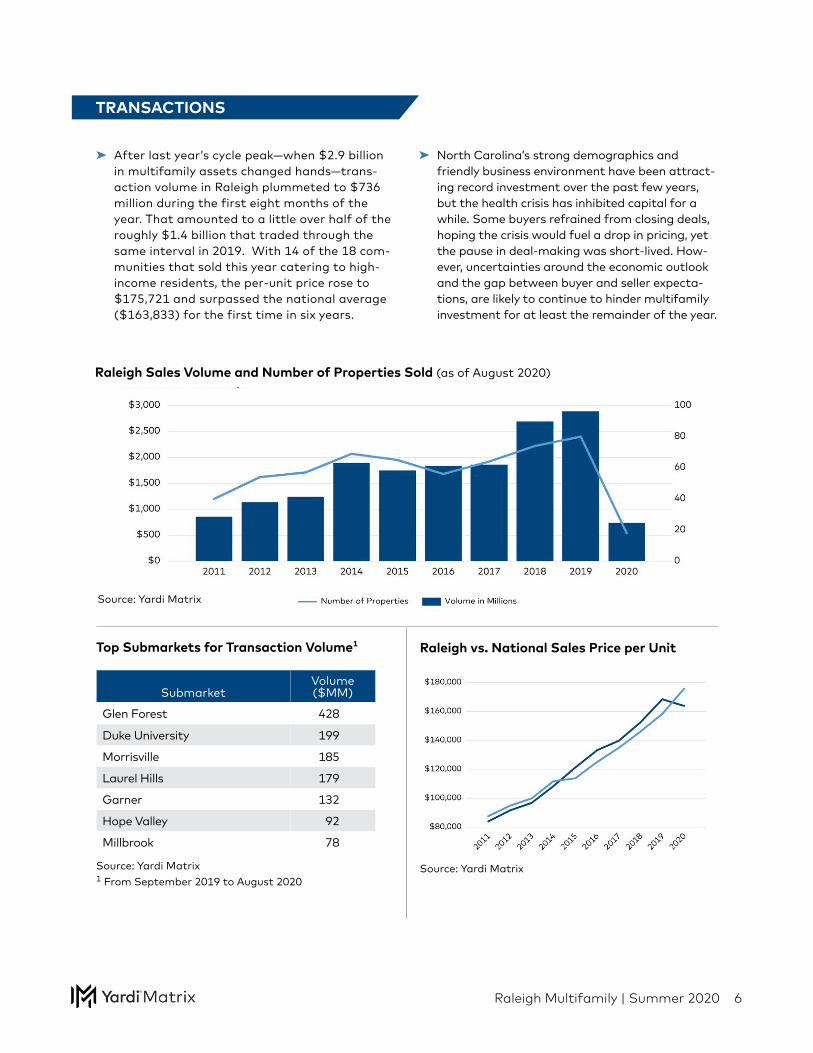
Raleigh Sales Volume and Number of Properties Sold (as of August 2020)
➤ After last year’s cycle peak—when $2.9 billion in multifamily assets changed hands—trans-action volume in Raleigh plummeted to $736 million during the first eight months of the year. That amounted to a little over half of the roughly $1.4 billion that traded through the same interval in 2019. With 14 of the 18 com-munities that sold this year catering to high-income residents, the per-unit price rose to $175,721 and surpassed the national average ($163,833) for the first time in six years.
➤ North Carolina’s strong demographics and friendly business environment have been attract-ing record investment over the past few years, but the health crisis has inhibited capital for a while. Some buyers refrained from closing deals, hoping the crisis would fuel a drop in pricing, yet the pause in deal-making was short-lived. How-ever, uncertainties around the economic outlook and the gap between buyer and seller expecta-tions, are likely to continue to hinder multifamily investment for at least the remainder of the year.
Raleigh vs. National Sales Price per Unit Top Submarkets for Transaction Volume1
Source: Yardi Matrix
SubmarketVolume ($MM)
Glen Forest 428
Duke University 199
Morrisville 185
Laurel Hills 179
Garner 132
Hope Valley 92
Millbrook 78
Source: Yardi Matrix 1 From September 2019 to August 2020
TRANSACTIONS
Source: Yardi Matrix
Raleigh Multifamily | Summer 2020 7
Brought to you by:EXECUTIVE INSIGHTS
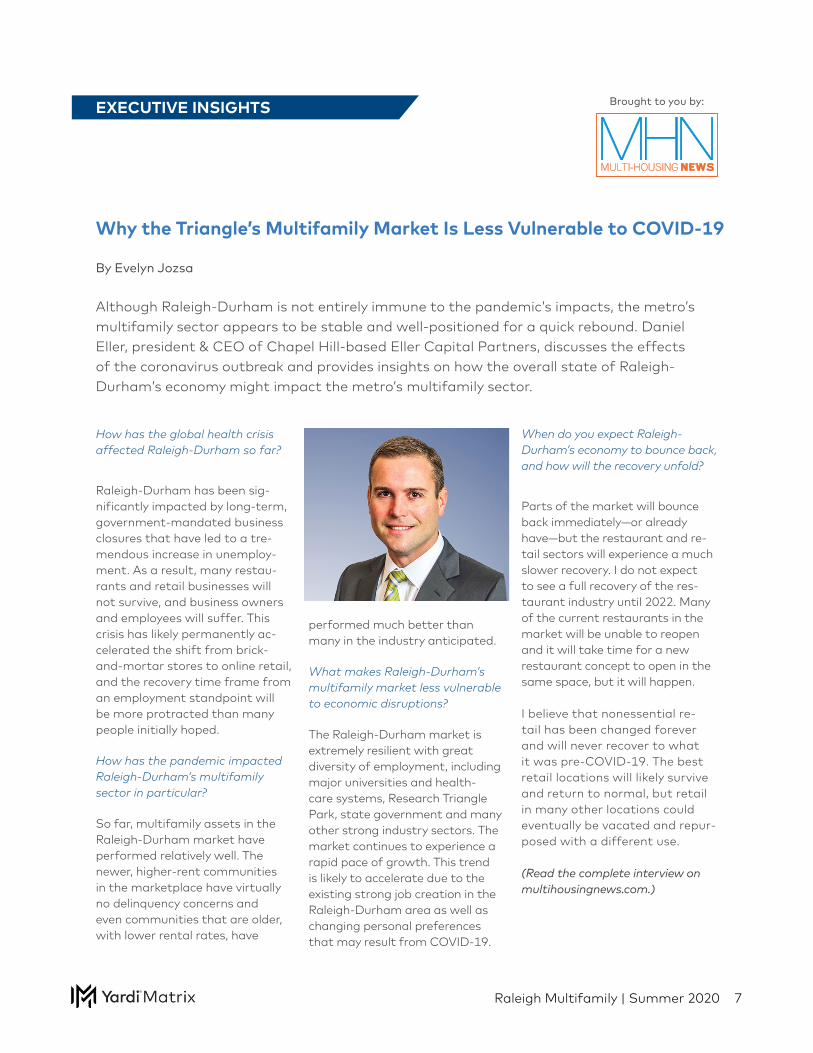
Although Raleigh-Durham is not entirely immune to the pandemic’s impacts, the metro’s multifamily sector appears to be stable and well-positioned for a quick rebound. Daniel Eller, president & CEO of Chapel Hill-based Eller Capital Partners, discusses the effects of the coronavirus outbreak and provides insights on how the overall state of Raleigh-Durham’s economy might impact the metro’s multifamily sector.
Why the Triangle’s Multifamily Market Is Less Vulnerable to COVID-19
How has the global health crisis affected Raleigh-Durham so far?
Raleigh-Durham has been sig-nificantly impacted by long-term, government-mandated business closures that have led to a tre-mendous increase in unemploy-ment. As a result, many restau-rants and retail businesses will not survive, and business owners and employees will suffer. This crisis has likely permanently ac-celerated the shift from brick-and-mortar stores to online retail, and the recovery time frame from an employment standpoint will be more protracted than many people initially hoped.
How has the pandemic impacted Raleigh-Durham’s multifamily sector in particular?
So far, multifamily assets in the Raleigh-Durham market have performed relatively well. The newer, higher-rent communities in the marketplace have virtually no delinquency concerns and even communities that are older, with lower rental rates, have
performed much better than many in the industry anticipated.
What makes Raleigh-Durham’s multifamily market less vulnerable to economic disruptions?
The Raleigh-Durham market is extremely resilient with great diversity of employment, including major universities and health-care systems, Research Triangle Park, state government and many other strong industry sectors. The market continues to experience a rapid pace of growth. This trend is likely to accelerate due to the existing strong job creation in the Raleigh-Durham area as well as changing personal preferences that may result from COVID-19.
When do you expect Raleigh-Durham’s economy to bounce back, and how will the recovery unfold?
Parts of the market will bounce back immediately—or already have—but the restaurant and re-tail sectors will experience a much slower recovery. I do not expect to see a full recovery of the res-taurant industry until 2022. Many of the current restaurants in the market will be unable to reopen and it will take time for a new restaurant concept to open in the same space, but it will happen.
I believe that nonessential re-tail has been changed forever and will never recover to what it was pre-COVID-19. The best retail locations will likely survive and return to normal, but retail in many other locations could eventually be vacated and repur-posed with a different use.
(Read the complete interview on multihousingnews.com.)
By Evelyn Jozsa
Raleigh Multifamily | Summer 2020 8
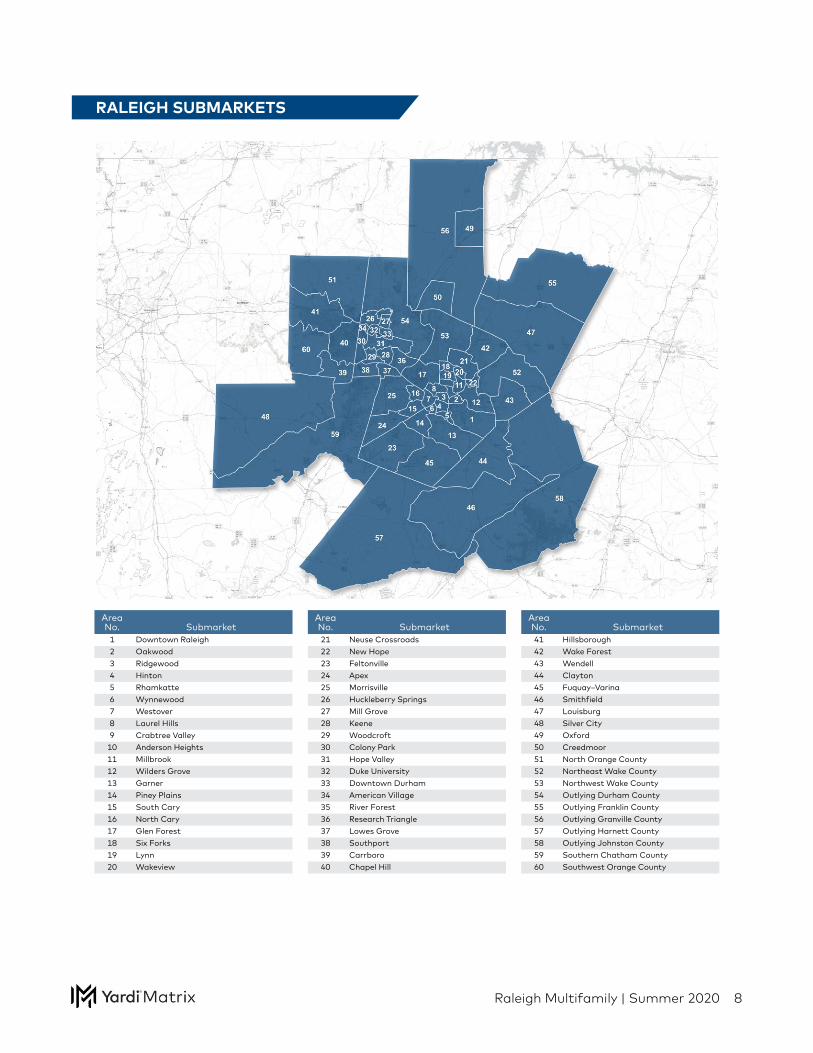
RALEIGH SUBMARKETS
Area No. Submarket
1 Downtown Raleigh2 Oakwood3 Ridgewood4 Hinton5 Rhamkatte6 Wynnewood7 Westover8 Laurel Hills9 Crabtree Valley
10 Anderson Heights11 Millbrook12 Wilders Grove13 Garner14 Piney Plains15 South Cary16 North Cary17 Glen Forest18 Six Forks19 Lynn20 Wakeview
Area No. Submarket21 Neuse Crossroads22 New Hope23 Feltonville24 Apex25 Morrisville26 Huckleberry Springs27 Mill Grove28 Keene29 Woodcroft30 Colony Park31 Hope Valley32 Duke University33 Downtown Durham34 American Village35 River Forest36 Research Triangle37 Lowes Grove38 Southport39 Carrboro40 Chapel Hill
Area No. Submarket41 Hillsborough42 Wake Forest43 Wendell44 Clayton45 Fuquay–Varina46 Smithfield47 Louisburg48 Silver City49 Oxford50 Creedmoor51 North Orange County52 Northeast Wake County53 Northwest Wake County54 Outlying Durham County55 Outlying Franklin County56 Outlying Granville County57 Outlying Harnett County58 Outlying Johnston County59 Southern Chatham County60 Southwest Orange County
Raleigh Multifamily | Summer 2020 9
Lifestyle households (renters by choice) have wealth sufficient to own but have chosen to rent. Discretionary households, most typically a retired couple or single professional, have chosen the flexibility associated with renting over the obligations of ownership.
Renter-by-Necessity households span a range. In descending order, household types can be:
➤ A young-professional, double-income-no-kids household with substantial income but without wealth needed to acquire a home or condominium;
➤ Students, who also August span a range of income capability, extending from affluent to barely getting by;
➤ Lower-middle-income (“gray-collar”) households, composed of office workers, policemen, firemen, techni-cal workers, teachers, etc.;
➤ Blue-collar households, which August barely meet rent demands each month and likely pay a dispropor-tionate share of their income toward rent;
➤ Subsidized households, which pay a percentage of household income in rent, with the balance of rent paid through a governmental agency subsidy. Subsidized households, while typically low income, August extend to middle-income households in some high-cost markets, such as New York City;
➤ Military households, subject to frequency of relocation.
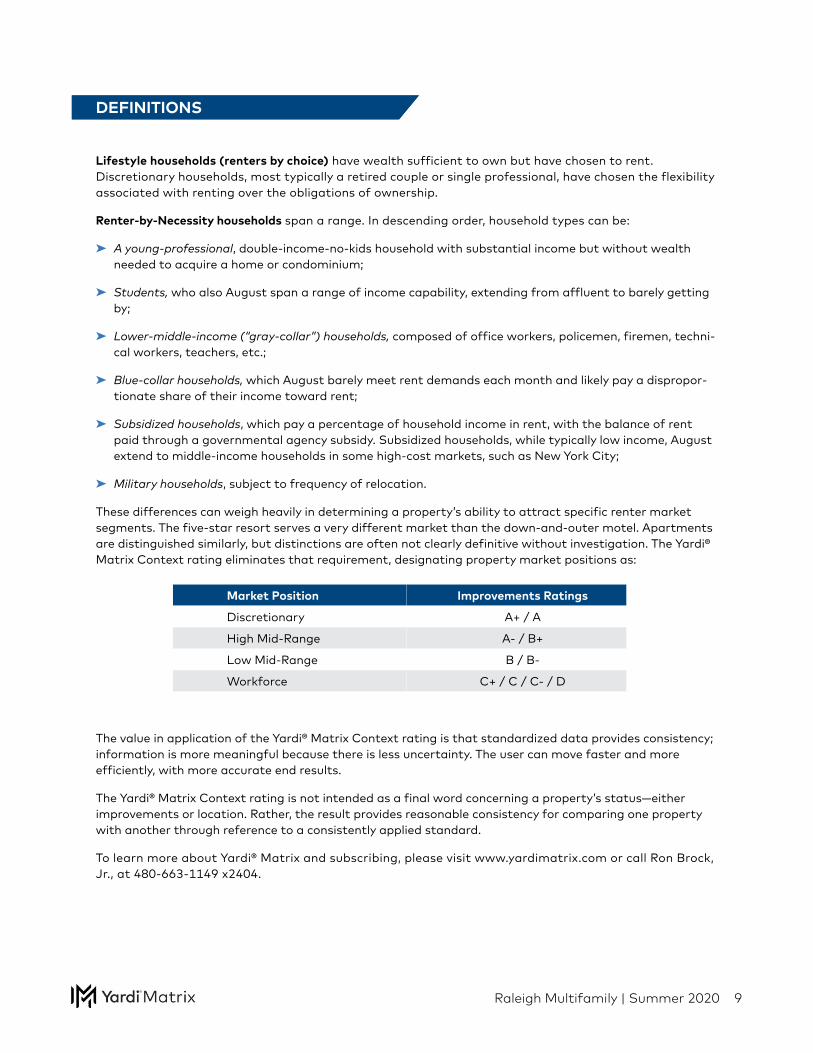
These differences can weigh heavily in determining a property’s ability to attract specific renter market segments. The five-star resort serves a very different market than the down-and-outer motel. Apartments are distinguished similarly, but distinctions are often not clearly definitive without investigation. The Yardi® Matrix Context rating eliminates that requirement, designating property market positions as:
Market Position Improvements Ratings
Discretionary A+ / A
High Mid-Range A- / B+
Low Mid-Range B / B-
Workforce C+ / C / C- / D
The value in application of the Yardi® Matrix Context rating is that standardized data provides consistency; information is more meaningful because there is less uncertainty. The user can move faster and more efficiently, with more accurate end results.
The Yardi® Matrix Context rating is not intended as a final word concerning a property’s status—either improvements or location. Rather, the result provides reasonable consistency for comparing one property with another through reference to a consistently applied standard.
To learn more about Yardi® Matrix and subscribing, please visit www.yardimatrix.com or call Ron Brock, Jr., at 480-663-1149 x2404.
ECONOMIC SNAPSHOTDEFINITIONS
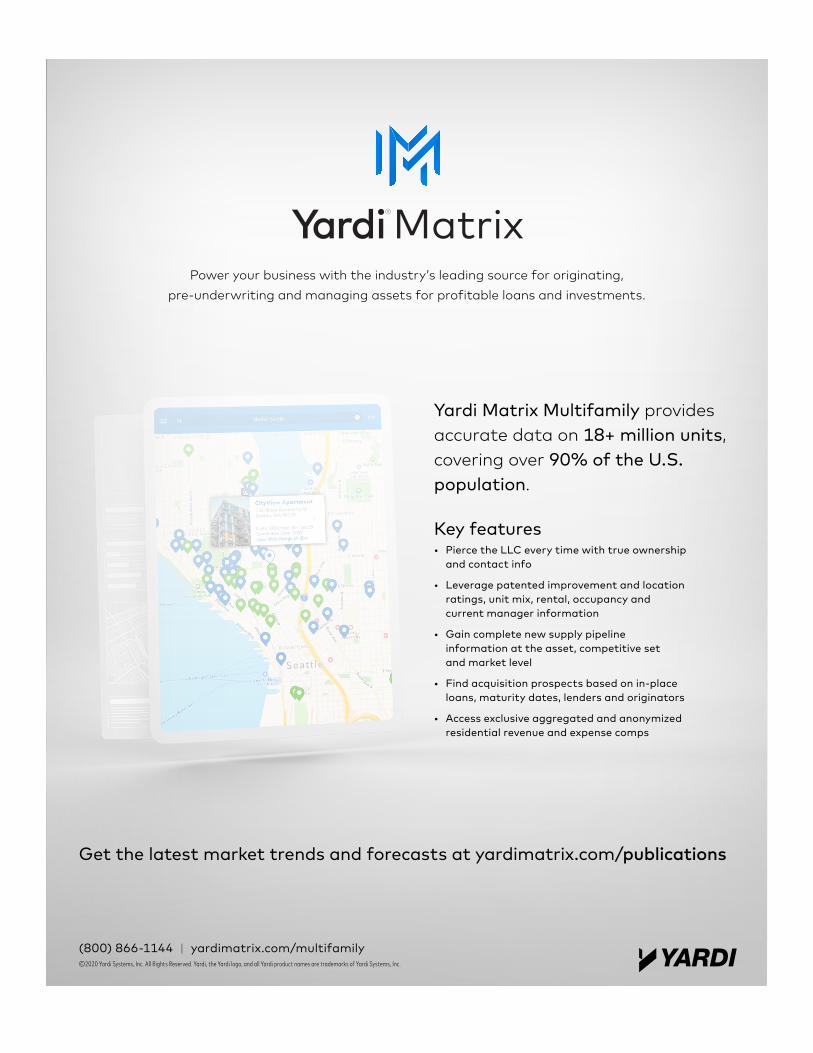
Power your business with the industry’s leading source for originating, pre-underwriting and managing assets for profitable loans and investments.
Key features• Pierce the LLC every time with true ownership
and contact info
• Leverage patented improvement and location ratings, unit mix, rental, occupancy and current manager information
• Gain complete new supply pipeline information at the asset, competitive set and market level
• Find acquisition prospects based on in-place loans, maturity dates, lenders and originators
• Access exclusive aggregated and anonymized residential revenue and expense comps
Get the latest market trends and forecasts at yardimatrix.com/publications
©2020 Yardi Systems, Inc. All Rights Reserved. Yardi, the Yardi logo, and all Yardi product names are trademarks of Yardi Systems, Inc.
Yardi Matrix Multifamily provides accurate data on 18+ million units, covering over 90% of the U.S. population.
(800) 866-1144 | yardimatrix.com/multifamily
Yardi®Matrix
Raleigh Multifamily | Summer 2020 11
DISCLAIMER
Although every effort is made to ensure the accuracy, timeliness and completeness of the information provided in this publication, the information is provided “AS IS” and Yardi Matrix does not guarantee, warrant, represent or undertake that the information provided is correct, accurate, current or complete. Yardi Matrix is not liable for any loss, claim, or demand arising directly or indirectly from any use or reliance upon the information contained herein.
COPYRIGHT NOTICE
This document, publication and/or presentation (collectively, “document”) is protected by copyright, trademark and other intellectual property laws. Use of this document is subject to the terms and conditions of Yardi Systems, Inc. dba Yardi Matrix’s Terms of Use (http://www.yardimatrix.com/Terms) or other agreement including, but not limited to, restrictions on its use, copying, disclosure, distribution and decompilation. No part of this document may be disclosed or reproduced in any form by any means without the prior written authorization of Yardi Systems, Inc. This document may contain proprietary information about software and service processes, algorithms, and data models which is confidential and constitutes trade secrets. This document is intended for utilization solely in connection with Yardi Matrix publications and for no other purpose.
Yardi®, Yardi Systems, Inc., the Yardi Logo, Yardi Matrix, and the names of Yardi products and services are trademarks or registered trademarks of Yardi Systems, Inc. in the United States and may be protected as trademarks in other countries. All other product, service, or company names mentioned in this document are claimed as trademarks and trade names by their respective companies.
© 2020 Yardi Systems, Inc. All Rights Reserved.