Embed Size (px)
Citation preview
Brigham Young University Brigham Young University
BYU ScholarsArchive BYU ScholarsArchive
Theses and Dissertations
2003-07-09
Multienergetic External-beam PIXE as a Means of Stydying the Multienergetic External-beam PIXE as a Means of Stydying the
Surface Enrichment Effect in Coins Surface Enrichment Effect in Coins
Scott Evans Perry Brigham Young University - Provo
Follow this and additional works at: https://scholarsarchive.byu.edu/etd
Part of the Astrophysics and Astronomy Commons, and the Physics Commons
BYU ScholarsArchive Citation BYU ScholarsArchive Citation Perry, Scott Evans, "Multienergetic External-beam PIXE as a Means of Stydying the Surface Enrichment Effect in Coins" (2003). Theses and Dissertations. 89. https://scholarsarchive.byu.edu/etd/89
This Thesis is brought to you for free and open access by BYU ScholarsArchive. It has been accepted for inclusion in Theses and Dissertations by an authorized administrator of BYU ScholarsArchive. For more information, please contact [email protected], [email protected].
MULTIENERGETIC EXTERNAL-BEAM PIXE AS A MEANS OF
STUDYING THE SURFACE ENRICHMENT EFFECT IN COINS
by
Scott E. Perry
A thesis submitted to the faculty of
Brigham Young University
in partial fulfillment of the requirements for the degree of
Master of Science
Department of Physics and Astronomy
Brigham Young University
August 2003

BRIGHAM YOUNG UNIVERSITY
GRADUATE COMMITTEE APPROVAL
of a thesis submitted by
Scott E. Perry
This thesis has been read by each member of the following graduate committee and by majority vote has been found to be satisfactory. _______________________________ __________________________________ Date Lawrence B. Rees, Chair _______________________________ __________________________________ Date Nolan F. Mangelson _______________________________ __________________________________ Date Steven E. Jones

BRIGHAM YOUNG UNIVERSITY As chair of the candidate’s graduate committee, I have read the dissertation of Scott E. Perry in its final form and have found that (1) its format, citations, and bibliographical style are consistent and acceptable and fulfill university and department style require-ments; (2) its illustrative materials including figures, tables, and charts are in place; and (3) the final manuscript is satisfactory to the graduate committee and is ready for sub-mission to the university library. ________________________ __________________________________ Date Lawrence B. Rees Chair, Graduate Committee Accepted for the Department __________________________________ R. Steven Turley, Chair Department of Physics and Astronomy Accepted for the College __________________________________ G. Rex Bryce, Associate Dean College of Physical and Mathematical Sciences

ABSTRACT
MULTIENERGETIC EXTERNAL-BEAM PIXE AS A MEANS OF
STUDYING THE SURFACE ENRICHMENT EFFECT IN COINS
Scott E. Perry
Department of Physics and Astronomy
Master of Science This thesis paper examines the feasibility of using external-beam PIXE to study the
surface enrichment effect in metal artifacts. By varying the energy of the incident
proton beam, we penetrated the artifact’s surface to different levels and were able to
produce a depth profile of the elemental composition of the sample. In this study, the
sample set we chose to examine consisted of ancient and modern coins.
This paper first describes the surface enrichment effect and theoretically how PIXE can
be used to study it. It then details the construction of the components of the external-
beam setup. Many of the refinements of the hardware and experimental methods are
discussed. It recounts the means of calibration of the detector and analytical tools.
Finally, an accounting of the research performed on several coins is set forth, along with

data showing the effectiveness of PIXE in complementing other methods of elemental
analysis.
We found that PIXE revealed statistically significant differences in concentrations of
modern coins at the two beam energies we used. Ancient coins did not have similarly
significant discrepancies between the two beam energies. The modern coin data
suggested depletion in copper in copper-silver and copper-gold alloys, which is
consistent with predictions of the theory of the surface enrichment effect. We suggest
that the ancient coins are so deeply corroded that the PIXE beam is unable to penetrate
adequately to observe surface enrichment. Comparison of our PIXE data to XRF and
SEM data suggest that the trends we observed in modern coins are verified by the other
methods. We therefore assert that external-beam PIXE is an effective tool for studying
the surface enrichment effect, though with the beam energies available at Brigham
Young University, the study must be limited to fairly modern coins.

ACKNOWLEDGEMENTS Many people have made significant contributions to this research project, both through
direct and indirect support. Dr. Rees and Dr. Mangelson have worked countless hours
striving to assure the quality of the research, even though our findings were limited by
time constraints placed upon us by the accelerator. The have generously provided beam
time and research funds to promote the success of this project. Most of all, they have
patiently guided an inexperienced and often simple-minded graduate student without
begrudging any of their time.
From the Department of Physics and Astronomy, Wes Lifferth has been a praiseworthy
collaborator in the construction of all of the hardware in our experiment. He too has
exhibited great patience in being asked to perform very difficult tasks and has remained
as friendly as when I first met him. Joseph Young and Scott Daniel have devoted a
great deal of effort to repairing the machine. Scott Sommerfeldt and Robert Turley
have also patiently continued my funding to allow me to complete this thesis paper.
My family members have encouraged me and in many ways have made it possible for
me to complete this research. My parents and my wife deserve my special thanks for
their faith, love, patience, and help in seeing this project through to the very end.

vii
TABLE OF CONTENTS Abstract.............................................................................................................................. iv Acknowledgements............................................................................................................ vi Table of Contents.............................................................................................................. vii List of Figures and Tables ............................................................................................... viii Chapter I: Introduction and Background ............................................................................1 Chapter II: Preparations......................................................................................................9 Chapter III: Methods.........................................................................................................25 Chapter IV: Samples and Results .....................................................................................35 Chapter V: Conclusions....................................................................................................41 Appendix............................................................................................................................45 References..........................................................................................................................57

viii
LIST OF FIGURES AND TABLES Figure 1: Sample spectrum taken from the RbI standard ....................................................2 Figure 2: Schematic diagram of a PIXE setup.....................................................................3 Figure 3: Electron micrographs of pitting in silver and copper.........................................10 Figure 4: Roman bronze coin after beam exposure, 1000x magnification........................11 Figure 5: Brigham Young University external beam line and target chamber..................14 Figure 6: Photograph of copper pipe and helium intake spigot.........................................15 Figure 7: Diagram of target chamber setup for micromatter standard analysis ................16 Figure 8: Detector to chamber coupling, top view ............................................................17 Figure 9: X-ray detector atop detector mounting table......................................................18 Figure 10: Target holder, glamour shot and in full implementation..................................20 Figure 11: Target holder mechanism for securing coins with 3/8”-1.5” diameter ............21 Figure 12: H-value plots for K and L lines as a function of x-ray energy.........................31 Figure 13: Interpolated H-value curves as a function of x-ray energy ..............................33 Table 1: Proton ranges in metals at our selected beam energies .......................................30 Table 2: PIXE copper concentrations at both energies......................................................37 Table 3: Copper concentration by coin comparing PIXE, XRF, and SEM.......................38

CHAPTER I
INTRODUCTION AND BACKGROUND
PIXE has become a widely recognized method of chemical analysis because of its
simplicity, accuracy, and nondestructive nature. Its name describes the physical
principles behind its functioning: PIXE is an acronym for proton-induced x-ray
emission.1 Protons accelerated into a sample pull inner-shell electrons out of their
orbitals. Outer electrons replenish the inner shells, but in order to drop to the lower-
energy orbital, they emit the energy difference in the form of X rays. Each element has
a unique set of atomic energy levels, therefore each element has a unique spectrum of x-
ray emission. A large number of emissions from a particular transition will produce a
peak in the spectrum, thereby identifying the existence of a species of atom in the
sample. By analyzing the x-ray spectrum of a sample under proton bombardment, one
can deduce which elements are present and what their concentrations are (see Figure 1).
Elements with an atomic number up to fifty (tin) are revealed by their K-series
emissions, or transitions to the first (n=1) energy level. Beyond tin, the K series is too
energetic for our detectors, so we instead look for the L series, or transitions to the
second (n=2) energy levels. Guelph’s GUPIX software analyzes spectra and reports the
concentrations of elements in the sample.2 In order for GUPIX to provide an accurate
report, it must be given information about the sample’s composition, the geometry of

2
Figure 1: Sample spectrum taken from the RbI standard
the PIXE setup, the detector’s specifications, the beam energy, and the total quantity of
charge deposited by the beam.
Several pieces of equipment are needed to carry out PIXE analysis (see Figure 2).
Obviously, a proton accelerator and an x-ray detector are essential to the operation of a
PIXE system. An evacuated beamline is needed to guide the beam from the accelerator
to the target. The steering electromagnet serves two purposes: it allows one accelerator
to be permanently attached to several different beamlines and makes the beam
monoenergetic. The degree of deflection of a beam of charged particles in a magnetic
field depends on the momentum of the particles. If a particle has more or less kinetic
energy than the desired beam, it will not turn with the same radius of curvature when it

3
Figure 2: Schematic diagram of a PIXE setup
passes through the magnet and will not enter the correct beamline. In this way, the
magnet assures that the beam that progresses to the target is nearly monoenergetic.
Another aid in this regard is a set of collimators, which block particles with a trajectory
other than parallel to the beamline axis, such as ones that have a close enough energy to
pass through the steering magnet, but do not travel straight down the beamline. They
also reduce the beam to the desired size.
Further refinement to the beam is possible through the use of a diffusion foil. Usually a
thin graphite layer, the diffusion foil spreads the beam. This reduces the beam’s
intensity and makes it more uniform over its cross section. The beam is usually
collimated after diffusion to achieve the desired beam diameter. After the beam has
reached the target, it is collected in a Faraday cup, which stops the beam and measures
the beam current. The Faraday cup is connected to a current integrator, or scaler, which
measures how many beam particles pass through the sample.

4
A special application of PIXE is external-beam PIXE, in which the proton beam leaves
the evacuated beamline and proceeds through a gaseous medium to the target.1 A beam
snout that terminates with a Kapton-foil window is a necessary addition to the beam line
for external-beam PIXE. The Kapton allows protons to pass with a small decrease in
energy, but it maintains a barrier to separate the atmospheric pressure of the lab from
the very low vacuum inside the beamline.1
External-beam PIXE offers many advantages over standard PIXE, such as the ability to
analyze large or irregularly shaped samples that otherwise could not be put into the
evacuated target chamber. It also aids in making the bombardment of the sample less
destructive because convection cools the sample. Another destructive situation
develops in standard PIXE when charge builds up in the sample. If the sample is
electrically isolated, the constant bombardment by protons produces a net positive
charge in the sample. The Coulomb repulsion from these charges can cause
spontaneous releases of charge, which often damage the sample and produce a large x-
ray background in spectra. Charge buildup on the sample is less of a concern with
external-beam PIXE because the atmosphere allows charges to escape in a slow,
controlled manner. A helium atmosphere is particularly well-suited for external-beam
PIXE because the helium atoms efficiently remove heat from the sample, they do not
react with the sample, they do not rob the beam of as much energy as heavier gases, and
none of the helium spectrum is detectable by the x-ray detectors used in PIXE.

5
Previously an external-beam PIXE apparatus was built and tested at Brigham Young
University. It proved to be functional, as was demonstrated by the successful analysis
of a bronze artifact from the Foundation for Ancient Research and Mormon Studies
(FARMS).3 The system was, however, not fully calibrated or refined, and many
components needed upgrading to make the conditions of analysis more reproducible.
One of our main goals in this research was to make the external-beam PIXE system at
the university more streamlined, safer for samples, and more accurate through a careful
calibration of the entire system.
While researching articles prior to the first external-beam PIXE project, we encountered
many references to surface enrichment in archeometric PIXE studies with metal alloys.
Demortier and Meyer and Brissaud’s team observed silver enrichment in their
respective studies of medieval and Gaulish coins.4,5 The Portuguese team of Araujo,
Alves, and Cabral also reported surface enrichment in gold coins when they compared
their PIXE data to x-ray fluorescence (XRF), which penetrates deeper into the coin.6
Clues to the cause of surface enrichment are found in Methods of Chemical and
Metallurgical Investigation of Ancient Coinage, published by the Royal Numismatic
Society.7 They give the two main causes of silver enrichment in silver-copper alloys as
oxidation of copper and the resulting relief of silver structures after the coin is cleaned.
Evidently the copper oxide is removed from the surface with other crustal deposits,
leaving a larger fraction of silver behind. A third cause of surface enrichment is “the
redeposit of silver which replaces more or less completely the grains of copper oxide in

6
the vicinity of the surface.”7 This appears only in highly oxidized coins, such as ones
left to great exposure to the elements.
The kinetic energy of the protons is critical to the depth to which the beam penetrates a
sample. As the protons pass through a material, they gradually lose energy to
interactions with the other charged particles in the substance. At a certain depth, nearly
all of the energy is given up and the beam stops. When this happens within the target, it
is called “thick”, while if the beam passes through the target and continues beyond it, it
is referred to as “thin”. In the case of thick targets, the depth at which most of the beam
stops is determined by the initial energy of the protons. In general, a higher beam
energy corresponds to a greater depth at which the protons cause x-ray fluorescence. In
this way, varying the energy of the beam affects the depth at which a thick sample’s
composition is analyzed. Depending on the sample’s composition, some of the X rays
may be absorbed by the material before they reach the detector. Gratefully, GUPIX
accounts for this absorption when it analyzes the spectrum. Thus PIXE bears some
advantages over XRF; only ion beams can select a preferential depth of analysis in a
thick target.
Other researchers have capitalized on the finite penetration of proton beams to study the
concentration of samples at varying depths. Early work in the theory and the proof of
principle of this method was conducted respectively by Jaksic, et al, and Brissaud, et
al.8,9 Since then, more papers have appeared which utilize PIXE depth profiling as a
means of analysis. Some researchers have used PIXE as one phase in a multifaceted

7
analytical system involving several methods.10 They have nearly all chosen to vary the
energy of their proton beam, though a similar effect can be achieved by varying the
angle of incidence of a single-energy beam.11
Interestingly, in publications regarding PIXE studies of metal artifacts, surface
enrichment is nearly always cited as a source of uncertainty in the findings. It does not
appear that any research has been done to better determine the circumstances
surrounding surface enrichment or whether an understanding of the surface enrichment
effect might yield information about many of these metal samples. We therefore
determined we would study the surface enrichment effect in coins with multienergetic,
external-beam PIXE as a means of depth profiling. We hoped to link the extent of
surface enrichment to factors surrounding the origin of the coin.
External-beam PIXE is well-suited to the analysis of coins for many reasons. The depth
of penetration is well-defined, so the sample can be analyzed at several different beam
energies with little chance of overlap in the depth of analysis. The energy of the beam
can be changed relatively easily, as can the region that is being analyzed on the surface
of the coin. Based on our research in the literature, it appeared that PIXE’s range of
depth within the sample would allow us to study the surface enrichment effect. Finally,
external-beam PIXE is by nature nondestructive, which is especially important for the
analysis of valuable coins and artifacts.

8
Valuable coins require special considerations which are answered by external-beam
PIXE. Because the analysis may be performed on the coin in its entirety, no sample of
the alloy must be removed for PIXE. Heat buildup is also averted by the use of an
external-beam with a helium atmosphere. Charging of the sample does not occur
because most coins are conductors. If the coin is grounded, PIXE will not deposit
charge in the target more rapidly than it can be dissipated. Thus, we needed a target
holder that would ground the coin and hold it securely without endangering it to
scratching. Finally, the analysis must be accurate to make it worthwhile for a collector
to release the coin to us for examination.
Our objective in undertaking this research was to establish a means of depth profiling
with external-beam, multienergetic PIXE while observing the requirements for valuable
samples listed above. We were required to modify and test the external-beam
apparatus, calibrate our analytical tools, and verify our ability to observe surface
enrichment in actual samples. We then assessed our ability to apply our findings of the
surface enrichment effect as a potential tool for the study of coins and other metallic
samples at Brigham Young University. The following chapters describe the
preparations and methods that brought us to our results, which will then be discussed.

9
CHAPTER II
PREPARATIONS
Before we were able to collect spectra, we had to make a number of changes to the
existing external-beam apparatus. Considerable testing went into determining what we
needed for equipment so that we could obtain reliable and reproducible results. We also
performed tests to improve our knowledge of the behavior of the machine and the
samples during the testing process.
One of the first tests we performed as part of this thesis research was to determine
whether external-beam PIXE is actually nondestructive. Visual inspection of samples
analyzed with PIXE did not reveal any sort of surface marring, even under
magnification, so we chose to use electron microscopy to search for evidence of
damage. Among the coins selected for this study were 1-cent and 25-cent proof coins,
uncirculated quarters and cents, and an ancient bronze. Predetermined regions of the
coins were examined with the electron microscope. Images from the initial scans were
saved for later comparison. The coins were then placed in the external beam where they
were bombarded with maximum-energy protons at high beam currents. This was done
to simulate the harshest conditions to which they could be subjected in our lab. Some
coins were grounded, and some were not. All were run with a helium flow directed on
their surface. The same regions of the coins were then reexamined with the electron

10
Figure 3: Electron micrographs of pitting in silver (above) and copper (below)

11
microscope. It was found that the exceptionally smooth surfaces of the proof coins
exhibited pitting, which was probably caused by the proton beam (see Figure 3). The
pits had a diameter of approximately one micron in copper, less than one micron in
silver. The pits in the copper were spaced more closely than those in silver. Marring
appeared to occur regardless of whether the coin was grounded while in the proton
beam. Pits also appeared on the uncirculated coins after being bombarded by protons,
though their presence was not as obvious because of the relative coarseness of their
surface. The surfaces of the bronze coins were so coarse that no real change in surface
texture could be observed after exposure to the proton beam (see Figure 4). In all three
cases, it would appear that the same pitting occurred, but the effect was hardly
Figure 4: Roman bronze coin after beam exposure, 1000x magnification

12
noticeable in coins that were no longer in mint condition. Therefore, even though the
method appears to cause some microscopic damage to the surface of metals, this should
not be a concern except when analyzing uncirculated coins and artifacts.
Another important step we performed outside of the lab before beginning to experiment
was to estimate of the beam energy at the target. As a proton beam passes through
matter, its intensity is not significantly attenuated, but it loses some energy due to
interactions with the charged particles in the matter’s atoms. Once the beam’s energy
has dropped to a certain value, the protons lose the remainder of their energy. This
causes the beam to stop at a fairly well-defined depth which is determined by the
elements in the sample and the energy of the beam when it reaches the sample’s surface.
GUPIX accounts for x-ray attenuation in the sample, however it requires an accurate
input of the beam energy at the surface of the target so that it can calculate the depth at
which the characteristic X rays originate. Therefore, in order for an accurate GUPIX
analysis of a thick-target spectrum, it is very important to know the energy of the beam
when it impinges on the surface of the sample.
We therefore attempted to accurately measure the properties of the matter that the beam
would encounter after passing through the steering magnet. The graphite diffusion foil
was weighed and its cross-sectional area was found to determine its thickness. Since
the graphite has a density of 1.5 g/cm3, we calculated the thickness to be 7.33 µm.12
The thickness of the Kapton foil, 8.47 µm, was calculated according to the nominal
thickness printed on the roll from which it was taken. The distance from the end of the

13
beam snout to the intended location of the target was also carefully measured.
Throughout this part of the beam’s path, the protons would have to pass through the
atmosphere in the target chamber.
To determine the composition of the gas in the target chamber during operating
conditions, we exploited the presence of argon in air. With the proton beam entering
laboratory air in the target chamber, we recorded a spectrum for a certain period of
time. We then pumped the air out of the chamber and replaced it with helium gas.
Another spectrum was captured over the same time interval. We compared the area
under the argon peak in the air spectrum to the area in the helium spectrum to determine
approximately what fraction of air remained after the chamber had been filled with
helium. We concluded the following composition of the chamber atmosphere, by
nucleus: 99.727% He, 0.2136% N, 0.0573% O, 0.0018% Ar. All of the values for the
various thicknesses were then put into a Matlab program to calculate the beam energy
loss as it passes through a material. The initial energy values were calculated according
to the field strength of the steering magnet when the beam entered the beamline
correctly. The values we obtained through use of this Matlab code provided a starting
point for more elaborate calculations of the beam energy at the target, which will be
described later.
Several important pieces of hardware needed to be incorporated into our apparatus (see
Figure 5). For our target chamber, we chose a large, round vacuum chamber that had
formerly been used with Rutherford backscattering (RBS) studies. The airtight seal

14
Figure 5: Brigham Young University external-beam line and target chamber, not to scale

15
could contain a helium atmosphere for the external beam, and with some slight
modifications, the chamber could still be used for RBS or standard PIXE. The viewers
and diffusion foil carriage from the existing external-beam line were left between the
magnet and the chamber. The original beam snout, however, had to be removed from
the end of the beamline. A sleeve was machined to fit inside the target chamber’s
beamline coupling. The snout was shortened and mounted on the end of this sleeve. A
pair of O-rings between the sleeve and the coupling allowed the beamline to be
evacuated to the Kapton foil at the end of the beam snout, while the target chamber
remained at atmospheric pressure.
The target chamber itself required
a few modifications to make it
usable. A means of attaching a
vacuum pump had to be devised,
and the open orifices had to be
closed. The latter was done by
machining a simple plug to hold an
O-ring in place over an irregular-
sized opening. A copper pipe
underneath the chamber was fitted
with a brass piece to attach it to a
hose from a roughing pump (see
Figure 6). The same pipe also
Figure 6: Photograph of copper pipe and helium intake spigot

16
contained a valve which could be used to open the chamber to the pump. A second tube
in this fixture also contained a valve, through which the helium tank was coupled with
the chamber. This provided a convenient way to evacuate the chamber and then fill it
with helium.
We chose the same geometry as had been previously used in external-beam PIXE
experiments at Brigham Young University. This consisted of the axis of the beamline
and the axis of the detector forming a 60-degree angle, which was bisected by the
normal of the sample (see Figure 7). This geometry allows the beam trajectory and the
axis of the detector to be as close as possible to perpendicular to the face of the sample,
Figure 7: Diagram of target chamber setup for micromatter standard analysis

17
while minimizing the distances from the beam snout and the detector to the sample.
Having the detector close and parallel to the face of the sample is desirable to maximize
the solid angle subtended by the detector, thereby also maximizing the amount of
radiation that enters it. Minimizing the distance between the beam snout and the sample
reduces losses in beam energy and current. If the beam snout and detector were to be
moved closer to the sample than we positioned them, the angle between them would
have to be further spread, whereas if the angle were to be reduced below 60 degrees, the
snouts would have to be retracted. Thus the 60-degree backangle seemed the best
compromise to accommodate both a good solid angle and close proximity for the beam
and detector.
In order to fix the detector in the correct alignment, we had a fitting made to couple the
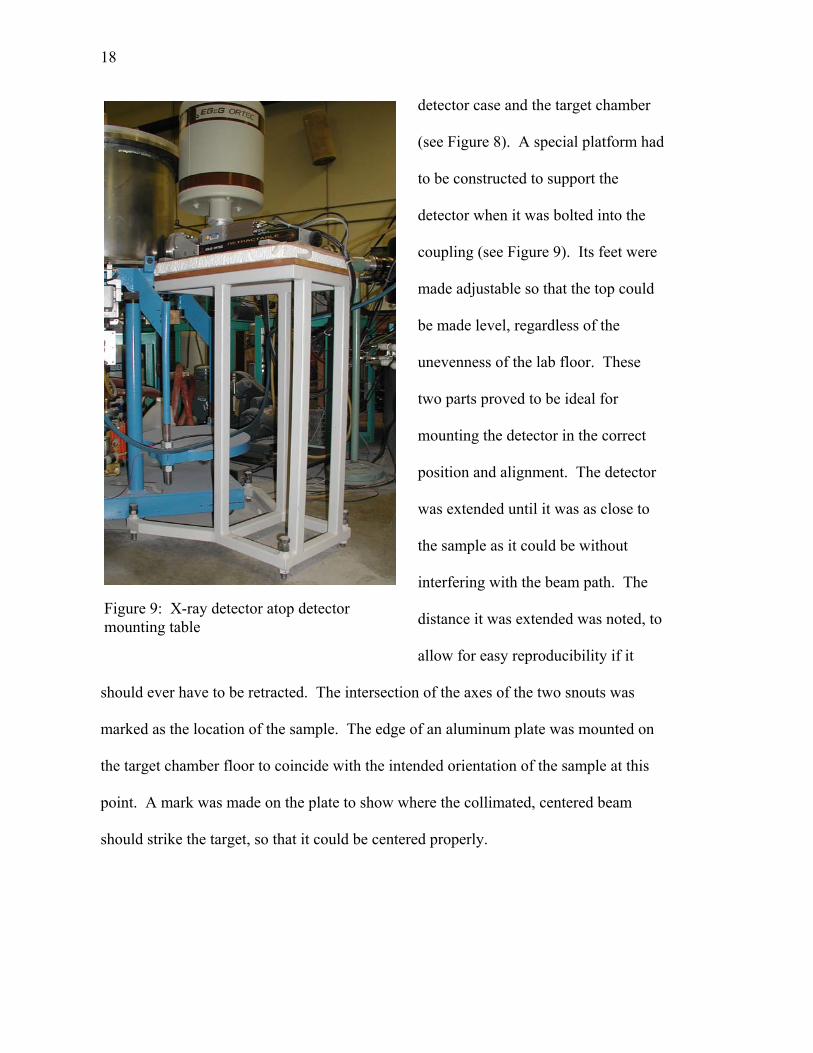
Figure 8: Detector to chamber coupling, top view
18
detector case and the target chamber
(see Figure 8). A special platform had
to be constructed to support the
detector when it was bolted into the
coupling (see Figure 9). Its feet were
made adjustable so that the top could
be made level, regardless of the
unevenness of the lab floor. These
two parts proved to be ideal for
mounting the detector in the correct
position and alignment. The detector
was extended until it was as close to
the sample as it could be without
interfering with the beam path. The
distance it was extended was noted, to
allow for easy reproducibility if it
should ever have to be retracted. The intersection of the axes of the two snouts was
marked as the location of the sample. The edge of an aluminum plate was mounted on
the target chamber floor to coincide with the intended orientation of the sample at this
point. A mark was made on the plate to show where the collimated, centered beam
should strike the target, so that it could be centered properly.
Figure 9: X-ray detector atop detector mounting table

19
Two types of samples were to be accommodated in the new setup. The first were thin
targets: micromatter standards. These were used in the calibration of the detector and
analysis software. The second were coins, which had to be supported differently
because of their thickness. The micromatter standard foils were mounted in thin
aluminum target frames, which fit the dimensions of the target holder in the south
beamline. The frames also provided a convenient way to mount them in the external
beam system. A screw was used to hold them flat against a thin piece of wood with a
hole drilled through it. The hole coincided with the part of the frame that contain the
micromatter foil. This allowed the beam to pass through the foil and the holder to a
Faraday cup behind both (see Figure 7). The Faraday cup collected whatever protons
passed through the foil to give an integrated charge measurement.
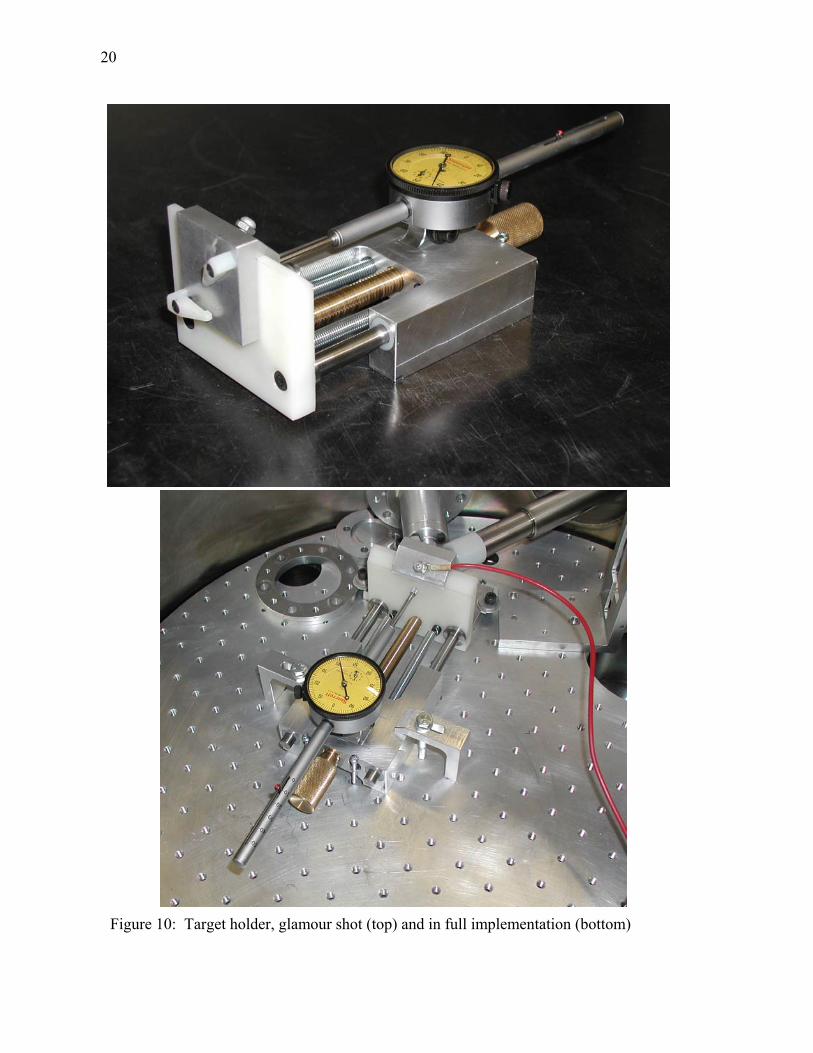
Coins must be mounted differently because they are not already fitted into frames, they
have different diameters and thicknesses, and they stop the beam current, making a
Faraday cup useless. With the help of the expert machinist Wes Lifferth, we designed a
target holder that would allow us to accommodate all of these conditions (see Figure
10). To use it, coins are first measured for thickness, then mounted on a detachable
target holder with Teflon clamps. The Teflon does not scratch the surface of the metals,
making them well-suited to handling valuable samples. The target holder is made of
aluminum, which will also not scratch a coin if it is handled carefully. The coin is
positioned precisely with respect to where the beam will strike through use of a cross-
hair that is etched into the surface of the target holder. The clamps are then angled to
accommodate a coin of any size between 0.375 and 1.5 inches diameter (see Figure 11).
20
Figure 10: Target holder, glamour shot (top) and in full implementation (bottom)

21
Figure 11: Target holder mechanism for securing coins of any diameter between 3/8” and 1.5”
The tightness of the clamps can be adjusted to secure coins from 0.03125 to 0.25 inches
thick. Once the coin is mounted, the holder is placed on a larger frame that is adjustable
in the direction of the normal of the sample. The position is adjusted to account for the
thickness of the coin, causing the face of the coin to coincide with the proper plane. A
micrometer allows for a careful adjustment of the position, to the nearest .01 mm.
Finally, a wire lead is attached to the top of the target holder and connected to the
scaler. Since the coin and the target holder are conductors, the sample acts as its own
Faraday cup, and the beam current is transferred without any post-target loss to the
scaler. Thus, the target holder secures coins of nearly any thickness, positions them
correctly, and acts as a Faraday cup. This device greatly expedites the process of
changing and aligning samples, which is important to preserving the purity of the
helium atmosphere in the target chamber.
Our last step in preparing the external-beam equipment was to set up the detector and
the supporting electronics. A new data acquisition bin was assembled and configured to
accompany the new detector. The bin was connected to the desktop computer through a
coaxial network connection. We installed and configured Canberra’s Genie software to
22
interface with the detector electronics for spectrum collection (Canberra Industries,
Meriden, CT). Once this was accomplished, testing began to determine the optimal
settings in the hardware and software for energy resolution in our spectra. We found
that even with the best possible settings, the resolution still was not as good as it should
have been, based on our work with the south beamline. We also found that we had a
very high low-energy background. We placed a beryllium window in front of the
detector to attempt to filter stray protons that might find their way into the detector.
This helped our problems minimally. We then added a layer of mylar, which
dramatically reduced the number of low-energy X rays reaching the detector. The
lower background and reduced low-energy count rate greatly helped our detector dead
time. It appeared that this improved our energy resolution, though not to the extent that
we had hoped. We determined that the improvement in the background level was
adequate for our purposes, so we chose to operate with both filters in place.
Once we had obtained some calibration spectra, we characterized the detector in
GUPIX. The characterization allowed us to adjust parameters in the software to assist it
in fitting the spectra from the detector. After several attempts, we felt we had a close
enough similarity between the parameters in the model and the actual properties of the
detector.
At one point, the computer we used to collect spectra had to be completely reconfigured
due to software changes on the department network. This was a very good exercise in
setting everything up again, and after about two months, all was working as well as, or

23
even better than, before. One of the greatest challenges of this process was reinstalling
the code which allowed us to convert Genie Camfiles into a GUPIX-readable file
format.
Constructing, testing, and refining our equipment comprised a considerable amount of
time. As one piece of equipment was completed, the need for another piece became
apparent to use our gear to the greatest effectiveness. Once all of the parts were
assembled, we determined that our apparatus afforded us a great deal of ease in
performing the kind of quality analysis we were striving for. However, with beam time
being sometimes difficult to obtain and of unpredictable duration, we did not wait until
every phase of construction was complete before we began calibration. The target
holder, the crowning piece of equipment for our apparatus, was not finished until long
after the detector calibration had been completed. Nevertheless, the effort we put into
designing our machinery paid great dividends in allowing us to work quickly, without
wasting precious beam time to rerun samples. The equipment will be useful in many
sorts of future studies at Brigham Young University.

24

25
CHAPTER III
METHODS
Once all of the equipment was assembled, the next step consisted of a careful
calibration of the detection and analysis systems. This was a two-step procedure,
beginning with the analysis of micromatter standards followed by thick-target
standards.
Micromatter standards are thin mylar foils with an element or compound deposited on
one side. The concentration of each element on the foil is known with moderate
certainty (within five percent) so that the standard can be used as a means of calibrating
the x-ray detector.13 Several of these standards were selected to provide a
representation of the entire spectrum in our analysis. In terms of elements with
observable K lines, these ranged from titanium to tin. In terms of energy, this ranged
from about 4 to 25 keV. Many elements with L lines in this energy range were also
selected.
With the accelerator set to the lowest energy that would produce any spectrum from the
manganese standard, we calculated a beam energy in the beamline of 1.002 MeV. In
making this calculation, we compared the field strength of the steering magnet for the
low-energy beam to the standard high-energy beam, which we knew to be 2.100 MeV.

26
This is the energy necessary to direct the beam into the south beamline at a particular
magnet setting. Through the ratio of the squares of the field strengths, we found the
particle energy as it passed through the magnet to be 1.002 MeV.
B2 ∝ KE
B1 KE1 —— = —— 2
B22 KE2
319.1 KE1 ——— = ——
2
462.02 2.1
KE1 = 1.002
We chose to experiment initially with three energies: 1.002 MeV, 1.499 MeV, and
2.100 MeV. The middle energy corresponds to a fairly stable region about halfway
between the lowest and highest energies. We found that at the lowest energy, we could
not read a beam current in our Faraday cup. Without an integrated charge, it is difficult
to determine absolute concentrations in the sample. Therefore, we retained for our
calibration at the lowest energy only the samples with two elements in the detectable
energy range. Even though we could not determine absolute concentrations in these
targets, we could at least find the relative concentration of the two elements.
In order to analyze the samples, a plate was fixed to the floor of the target chamber,
with one edge at the appropriate angle and distance for the location of a target. The
micromatter target was attached to a wooden stand with a hole drilled to expose the
sample on the back side, allowing the beam to pass through. The stand was placed flush

27
with the plate in such a manner that the micromatter foil was aligned with the beam
snout. Finally, a Faraday cup was placed behind the target to collect the beam current
after it passed through the target (see Figure 7).
Each micromatter standard was run until about 1.5 microcoulombs of integrated charge
was collected at the Faraday cup. In the case of the 1.002 MeV runs, the duration of
sampling was more arbitrary, though peak height and definition in the sample elements
were commonly the standards for determining when enough data had been collected.
Because it was much easier to change targets than beam energy, all samples were run at
one setting before adjusting the accelerator to a different energy. The use of helium
atmosphere in the target chamber necessitated a meticulous procedure to maintain the
same conditions from one target to the next. At the beginning of the session, while the
accelerator was coming up to pressure, we pumped the target chamber out with a
roughing pump, down to approximately 10-3 Torr. Then the valves to the helium tank
were opened to purge the helium lines. The pump valve was shut and helium was
allowed to flow into the chamber until the pressure on the chamber door was released.
When a target was to be changed, helium flow was turned on before opening the hatch.
The chamber was then briefly opened for the operator to reach inside and remove the
sample. The hatch was then closed again while the target on the holder was changed.
The target was replaced, the hatch resealed, and the helium flow turned off. This
method seemed to provide a good compromise between convenience and care in
handling the samples. Though some mixing of air with the tank gasses was permitted

28
using this method, no observable increase in background levels or even argon peak
levels could be seen throughout the day.
After a spectrum had been obtained for a standard, it was analyzed with GUPIX to
determine the elemental concentrations. This yielded a concentration for each element
in terms of micrograms/cm2. An H-value for the element could then be obtained by
dividing this concentration into the product of the integrated charge (in microcoulombs)
and the areal density of the sample (in micrograms/cm2). H-values are correction
factors that make observed concentrations in samples more similar to their actual
values. Although GUPIX considers many factors that influence the x-ray yield from the
sample, including the geometry of the experimental setup, the type of x-ray detector,
and the beam energy, not every detail can be accounted for and some discrepancy
persists. The H-values correct for these systematic sources of error that are consistent
from one sample to another, therefore they improve the accuracy of absolute
concentration values without adversely affecting the comparability of different spectra.
When several standards had been analyzed, a plot of H-values versus emission energy
could be made. We generated such a plot, as will be described later.
Another important factor to the quality of the GUPIX analysis was the accuracy of our
estimate of the beam energy when it reached the target. The beam energies listed above
apply as the beam passes through the evacuated beamline and are based on accelerator
column current measurements and field strengths in the steering magnet. However, by
the time the beam actually reaches the sample, it has traveled through the carbon

29
diffusion foil, the Kapton window, and about two centimeters of a helium-air mixture.
Each of these cause the beam to lose energy, so the energy on target is considerably
lower than the beam energy in vacuum.
Originally, we planned to use the energy values obtained through the Matlab code as a
starting point for an iterative procedure involving GUPIX and H-values. We reasoned
that by using our adjusted energy as the beam energy in a GUPIX analysis, we would
obtain a set of H-values. These H-values could then be applied to a target of known
composition, such as the silver-copper dime. First we ran GUPIX on the copper and
silver micromatter standards with an initial beam energy that was our best estimate,
according to the Matlab routine. From this fit, we obtained H-values for these two
elements, which we then applied to our analysis of the dime. Keeping the H-values
constant, we varied the energy of the beam in GUPIX until the dime analysis yielded a
9:1 silver to copper ratio. The energy needed to achieve the correct ratio was then put
back into GUPIX as the beam energy for the micromatter standards, and the analysis
was repeated. It was our hope that through this process, we would arrive at the correct
beam energies and H-values simultaneously, as the beam energy converged to the actual
value. This was not the case, however, as very slight changes in H-values could lead to
large changes in the calculated beam energy. We abandoned this approach in favor of a
simpler one.
Knowing that the on-target beam energy at the lowest setting had to be close to zero, we
set about trying to find a Kapton thickness that would reduce the beam at this energy to

30
nearly zero. The Kapton was the least-known thickness of consequence in the beam
path. Therefore we sought to apply inductive reasoning to determine its actual
thickness, or at least an effective thickness that would agree with the beam’s exhibited
behavior. Since we had determined 1.002 MeV to be the initial energy of the lowest
setting, we used this value as the starting point for the Matlab routine, through which
we varied the thickness of the Kapton until an on-target energy of 15.1 keV was
obtained. The density we eventually used was 8.52 g/m2. According to Dupont, the
tolerances for this thickness of Kapton are 7.6-14.0 g/m2.14 Since our calculated value
fit into the accepted range of areal densities from the manufacturer, we decided to use
this as the actual thickness of the Kapton. The on-target values of the other two beam
energies were then calculated to be 1.701 MeV and 953 keV. We computed the range
for protons at these two energies in a few metals of interest (see Table 1). These ranges
correspond to the approximate stopping depth of the beam, and therefore the maximum
depth at which characteristic X rays could be produced.
Using these energies, we put all of the micromatter standards’ spectra through GUPIX
and generated a set of H-values for the highest two energies. The lowest energy was
below the 200-keV minimum for GUPIX, so we ceased to analyze this level. In
comparing the H-values for the upper two energies, we found that the sets exhibited
similarities in many regards, including the relative placement of K- versus L-
Table 1: Proton ranges (in microns) in metals at our selected beam energies
Beam energy Au Ag Cu 1701 keV 13.03 15.57 14.79 953 keV 5.97 6.74 6.61

31
1701 keV Combined K, L
5
5.5
6
6.5
7
7.5
8
8.5
9
9.5
0 1 2 3 4 5 6 7 8 9 10 11 12 13 14 15 16 17 18 19 20 21 22 23 24 25 26 27
953 keV Combined K, L
3
3.5
4
4.5
5
5.5
6
6.5
7
7.5
8
8.5
9
9.5
10
10.5
11
0 1 2 3 4 5 6 7 8 9 10 11 12 13 14 15 16 17 18 19 20 21 22 23 24 25 26 27
Figure 12: H-value plots for K and L lines as a function of x-ray energy at both beam energies

32
emission H-values and the general trend in the magnitude of H-values as a function of
emission energy (see Figure 12). In both cases, the L-emission values fell below the K
values of similar energy. The general trend at both energies was to have high H-values
for low-energy emission lines, which then decreased and leveled off as energy
increased. The H-values for the 953-keV sequence averaged about three-fourths of
their higher-energy counterparts.
Encouraged by these similarities, we drew curves through what could believably be
called the averages of the two sets of H-values. We attempted to remain near the
calculated values for copper, since this element will be found in most of our samples.
Unfortunately, the silver H-values appeared to be definite outliers. Uncertainties about
the present concentrations of the silver micromatter foil may account for this error. At
high energy, we instead followed the tin and molybdenum K-lines. We did not
extrapolate the curves below 4 keV on the low end.
The curves seem to agree with the basic characteristics we expected to find in the H-
values. The lower-energy emissions are counted less efficiently than the higher energy
ones, and therefore have higher H-values. As energy increases, the H-values decrease
smoothly and level out where the counting efficiency stabilizes. The actual shape of the
graph may be rather subjective, but preliminary examinations have shown that in
regions of greatest interest, or at least around copper and silver, the H-values give
believable relative concentrations and are therefore valid. Perhaps this is in part due to
the fact that we chose to follow copper in the way the curve is pitched in that region of

33
Interpolated H-values
0
2
4
6
8
10
12
0 5 10 15 20 25 30
1701 keV 953 keV
Figure 13: Interpolated H-value curves as a function of x-ray energy for both beam energies
uncertain curvature. Nevertheless, as the H-values do not generally need to be very
exact, the model we have generated seems to work for our purposes so far.
From these curves we interpolated a new set of H-values for the two energies by
locating the value on the graph corresponding to the energy of the desired emission line
(see Figure 13). These are the H-values we used in calculating the concentrations in our
samples.
In order to further improve our results, we might suggest making a few changes to our
procedure. First, a better measurement of the integrated charge could be obtained if the
Faraday cup were positioned closer to the sample. In fact, it would be worth trying to

34
mount the micromatter standards on the target holder used for thick targets. Since the
target holder is a conductor, virtually all protons that pass through the foil would then
be counted in the integrated charge measurement. Of course, the aluminum peak would
have to be subtracted from the spectrum, but with the filters we have on the detector,
very little aluminum is actually detected in our spectra. Also, when the experiment was
performed, I was not aware that the micromatter standards have a “front” and “back”
with respect to where the standard elements are deposited. It is possible that some
targets were run from the back, thus further decreasing the beam energy before they
actually interacted with the elements of interest. Finally, in some cases, the exact
stoichiometry of the samples was unknown. Even in the best cases, the concentrations
given are only certified to about five percent.13 This could be improved by the creation
of a customized set of thick-target standards. In this way, the concentrations could be
verified by a number of methods and the elements of greatest interest to our studies
could be emphasized. It would furthermore be more consistent with our sample types to
use thick standards, rather than extrapolating the results of thin targets to our work.

35
CHAPTER IV
SAMPLES AND RESULTS
After satisfactorily calibrating the system, we turned our attention to experimenting on a
number of samples. We selected several modern coins with the intent of using them
mostly as standards. We also analyzed five ancient bronzes, since we had previous
experience in examining bronze. We found it very interesting that during the course of
the analysis, the modern “standards” became a more significant sample set than the
bronzes.
Our modern coins were selected as standards because their initial composition was
known to a high degree of accuracy, thanks to the care invested by the US Treasury
Department. These included a 1963 dime with a 90%-10% silver-copper composition
which we used as our primary standard. This was the dime used in the H-value and
beam energy calibrations. We also used a 1965 Kennedy half-dollar, which had an
80%-20% silver to copper composition in the outer cladding. An unstruck 25-cent
piece, or planchet, provided a standard with a clean surface (abbreviated BLNK).
Finally, a 1915 Mexican gold two-Peso coin was used for comparison to the silver-
copper compounds because of the nobility of gold atoms. Later in the procedure, we
milled half of the face off of a 1928 “walking liberty” half dollar. This was done to
compare the composition at the surface to the center of the coin. Unfortunately, this

36
sample was never examined with the external beam, though it was subjected to other
methods.
The following ancient coins were examined:
Egypt Ptolemy IV (222-204 BC), Zeus and eagle on thunderbolt (abbreviated EGPT)
Augustus (27 BC-14 AD), bare head right (abbreviated AUGU)
Trajan (98-117 AD), laureate head right (abbreviated TRAJ)
Egypt Ptolemy II (285-246 BC), Alexander w/elephant skin headdress (PTO2)
Seleucid Empire Antiochus VIII Philometor (145-142 BC), radiating head (SELE)
Little is known of the provenance of these coins, but we anticipated that at some point
in the last 2000 years, they would have been subjected to environmental conditions that
would promote surface enrichment. All showed obvious signs of wear and corrosion.
In order to better examine the alloy composition, they were mounted so that the proton
beam would strike them on a relatively smooth area.
The Appendix contains tables of the values obtained for each coin at the two energies of
our analysis. All of the coins contain elements we expected to see in them. The ancient
coins are composed largely of copper, tin, lead, and trace elements, including iron.
TRAJ and AUGU are comprised almost solely of copper, while the rest are more
traditional old-world bronzes. The modern coins also have concentrations near their
expected values.

37
Below is a table showing the copper concentration for each coin at both beam energies
(see Table 2). By comparing the concentrations at the two energies one coin at a time,
we can assess the effectiveness of this depth profiling method in finding surface
enrichment. In each of the modern coins except the planchet, the copper concentration
decreases significantly while the silver fraction increases (or gold fraction, in the two-
Peso piece). However, in each of the ancient coins, the concentration of copper hardly
changes or the change is not statistically significant. The error values in the table were
determined using the fit error reported by GUPIX. Other sources of error were not
easily quantifiable, and will be discussed later. Nevertheless, the errors arising from the
GUPIX fit provide an adequate reference for comparing the concentrations from the two
energies. Since copper is more reactive than silver or gold, a depletion in copper at the
surface suggests that copper has been removed by chemicals in the environment. It
therefore appears that our multienergetic PIXE has detected surface enrichment in the
modern samples.
Table 2: PIXE copper concentrations at both energies
Modern Coins % Cu at 1701 keV % Cu at 953 keV Expected valueDime 9.098±0.022 7.067±0.053 10Half 16.398±0.036 11.761±0.068 20Blnk 74.165±0.142 74.586±0.075 75Peso 9.318±0.018 8.800±0.021 10 Ancient Coins % Cu at 1701 keV % Cu at 953 keV Egpt 64.134±0.149 63.799±0.383 Augu 99.285±0.075 98.288±0.638 Traj 98.683±0.210 98.670±0.077 Pto2 81.474±0.207 80.113±0.969 Sele 65.851±0.289 65.632±1.215

38
Because only modern samples exhibited significant differences between the two beam
energies, it appears they are more suited to surface enrichment studies with the
equipment we have. The depth to which the proton beam can penetrate is limited by the
maximum beam energy of the accelerator. It is possible that the ancient coins
underwent surface enrichment centuries ago, and in order to find an appreciable
difference between the surface and the inner parts of the coin, a much higher-energy
beam is needed. If this is so, then the modern coins may be in a period in which their
surface enrichment has just begun and can be observed with the Brigham Young
University accelerator.
Other methods were employed to attempt to corroborate our PIXE data. These include
XRF, which penetrates much more deeply than PIXE, and scanning electron
microscopy (SEM), which scans only the surface layers of atoms. In several cases, the
same coins used in PIXE were subjected to these methods. The other methods agreed
Table 3: Copper concentration by coin comparing PIXE, XRF, and SEM
Coin XRF PIXE 1701 keV PIXE 953 keV SEM
Dime 9.24±0.23 9.098±0.022 7.067±0.053 5.30±0.24
Peso N/A 9.318±0.018 8.800±0.021 8.37±0.20
Blnk N/A 74.165±0.142 74.586±0.075 74.63±0.22
Sele N/A 65.851±0.289 65.632±1.215 60.96±1.04
Egpt N/A 64.134±0.149 63.799±0.383 63.15±0.21
Traj N/A 98.683±0.210 98.670±0.077 96.74±0.31
Augu N/A 99.285±0.075 98.288±0.638 96.26±0.36
Pto2 N/A 81.474±0.207 80.113±0.969 81.37±0.41

39
with the PIXE results, suggesting that the concentration changes we observed with
PIXE fit into a greater trend of surface enrichment (see Table 3). XRF and SEM studies
done with other coins support the data, though they are not included here because they
are not as directly applicable to the PIXE study. However, the calibration of the XRF
and SEM data seems correct, so it can be compared to the PIXE data.
Of the sources of possible error in this study, the uncertainty in the H-values is the most
significant. The H-values enter the concentration and error calculations after GUPIX
has computed its results, and therefore offer a final opportunity for error to enter as the
results are calculated. Normally the arbitrariness of the H-value curves is not especially
significant when the same curve is used to compare many samples and the curve is
reasonably close to the actual values. However, in this study, we compare the values
generated by two different sets of H-values, so if one curve is drawn too high or low, it
impacts the ability to compare the two. We believe that the data obtained through other
methods and the consistency of the results within our data set show that our H-value
curves are reasonably well calibrated. Improving our confidence in these values would
greatly enhance our ability to study the surface enrichment effect, particularly if we
were to analyze at several more energies in the range of our accelerator’s capability.
Additionally, we noted that the fit errors for the ancient coins are generally higher than
those of the modern coins. This can be explained by the presence of many more trace
elements in the ancient coins. The tails from the peaks of these elements have the effect
of raising the background level, so the signal to noise ratio is adversely affected. The

40
increase in the number of elements also adds variables to the fit, which prevents GUPIX
from fitting each one as precisely. Nevertheless, even if the error in the percent
composition of the ancient coins were improved, the normalized values would still be
much closer from energy to energy than those of the modern coins, and our conclusions
would be the same.

41
CHAPTER V
CONCLUSIONS
In consequence of our research, we have demonstrated that we can observe statistically
different compositions with different beam energies in modern coins. We believe that a
more powerful accelerator would allow us to peer farther into the interior of ancient
coins and perhaps observe the same effect in them as well. We believe our observations
in modern coins are the result of the surface enrichment effect, as the more reactive
metals are present in lower concentrations at the surface. We also have a feel for the
error in concentration of major elements. For modern coins whose alloy constituents
are not close on the periodic table, this appears to be about .02%. For ancient coins, the
error is quite a bit higher because of the presence of so many more elements in greater
concentration, so it is not possible to generalize.
One possible application of our research is in coin authentication. Since we have
observed surface enrichment close to the surface of modern coins, it may be used as a
distinguishing feature of a recently minted sample. Thus depth profiling may be able to
detect a modern counterfeit of an ancient coin, though ancient counterfeits and
counterfeits of modern coins could not be detected on this basis alone. In order for this
process to be confidently implemented, more research would need to be done to

42
determine whether artificial aging techniques are limited to the surface or penetrate
deep into the bulk of the coin, making a PIXE depth profile inconclusive.
Several aspects of this research could be improved with additional time and more
advanced equipment. A more energetic beam would allow us to analyze at a greater
depth and expand the range over which we could sample. This would improve the
credibility of our results by allowing us to analyze at more energy settings. Even with
our present equipment, we suggest adding more calibrated energies to our toolkit. Now
that we have a greater familiarity with the beam energy, we could more accurately add a
low energy below 953 keV, as well as several between 953 and 1701 keV. When the
time comes to replace the Kapton foil again, I would recommend measuring the areal
density of the new window to verify how well it agrees with the calculations we did
during this experiment. This would help us specify our beam energy and give us a
slight improvement in the GUPIX analysis. If it were possible to improve the energy
resolution of the detector, that would help reduce the statistical error in our spectra.
Improving the counting efficiency of the detector would also aid in this regard. Finally,
a more accurate calibration would greatly benefit our confidence. Concentrations
obtained from different beam energies could be more properly compared if the Faraday
cup were directly behind the micromatter standards or if thick, conducting standards
were used. In this way, less beam current would be lost at lower energies as protons
travel to the Faraday cup, and the H-value curves could be placed more exactly. By
taking these steps in a future calibration, we could reduce the error introduced by H-

43
values and make a better assertion of how the composition changes as a function of
depth.
Through our study in PIXE depth profiling, we believe that PIXE would play an
important role in a multifaceted analysis using XRF, SEM, and PIXE. Regions of
interest in the coin are accessible with PIXE, particularly in modern samples. The beam
energy in PIXE can also be varied with relative ease, allowing for a more detailed depth
profile. With our PIXE data corroborated by XRF and SEM on either side, we will be
able to offer coin collectors a highly accurate, nondestructive means of finding coin
composition over a broad range of depths.

44

APPENDIX


47
The tables in this appendix represent data collected on the coin specified on the top of
the page. In order to conserve space at the head of each column, I have abbreviated the
headings. This page will explain in greater detail what the ambiguous titles represent.
Column 3: Concentration—concentration as reported by GUPIX, in arbitrary units
because the calibration does not allow the computation of absolute concentrations
Column 4: % Error—fit error as reported by GUPIX
Column 5: Adjusted Concentration—concentration value reported in column 3,
multiplied by the H-value
Column 6: Adjusted Error—adjusted concentration value reported in column 5,
multiplied by the error reported in column 4—converts error from a percentage to a
range in arbitrary units of concentration
Column 7: Normalized %—concentration now converted to the atomic fraction of that
element in the sample—note that these numbers are percentages
Column 8: Error in %—error in the normalized concentration, in terms of percent
concentration—represents the “±” value of the normalized percentage

48
DIME

49
BLNK

50
HALF

51
PESO

52
EGPT

53
AUGU

54
TRAJ

55
PTO2

56
SELE

57
REFERENCES
1. S. Johansson, J. Campbell, and K. Malmqvist, eds., Particle-Induced X-Ray
Emission Spectrometry (PIXE), (John Wiley & Sons, New York, 1995) 451 p.
2. J. Maxwell, J. Campbell, and W. Teesdale, “The Guelph PIXE Software Package”,
Nuclear Instruments and Methods in Physics Research B43 (1988) 218.
3. S. Perry, Design, Construction, and Testing of an External-Beam PIXE System for
Coin and Manuscript Analysis at Brigham Young University [Undergraduate
Honors Thesis], (Brigham Young University, Provo, 1999) 69 p.
4. G. Demortier and M. Meyer, “Nonvacuum Analysis of Silver Coins (9th to 15th
Century A.D.)”, Nuclear Instruments and Methods in Physics Research B49 (1990)
300.
5. I. Brissaud and others, “Analysis of Gaulish Coins by Proton Induced X-Ray
Emission, Synchrotron Radiation X-Ray Fluorescence and Neutron Activation
Analysis”, Nuclear Instruments and Methods in Physics Research B49 (1990) 305.

58
6. M. Araujo, L. Alves, and J. Cabral, “Comparison of EDXRF and PIXE in the
analysis of ancient gold coins”, Nuclear Instruments and Methods in Physics
Research B75 (1993) 450.
7. J. Condamin and M. Picon, in: Methods of Chemical and Metallurgical
Investigation of Ancient Coinage, eds. E. Hall and D. Metcalf, Special Publication
No. 8 (Royal Numismatic Society, London, 1972) pp. 49.
8. M. Jaksic and others, “PIXE Depth Profiling”, Nuclear Instruments and Methods in
Physics Research B40/41 (1989) 643.
9. I. Brissaud, J. Frontier, and P. Regnier, “Evaluation of Depth Profiling with PIXE”,
Nuclear Instruments and Methods in Physics Research B12 (1985) 235.
10. G. Demortier, Y. Morciaux, and D. Dozot, “PIXE, XRF and GRT for the global
investigation of ancient gold artifacts”, Nuclear Instruments and Methods in Physics
Research B150 (1999) 640.
11. G. Demortier, S. Mathot, and B. Van Oystaeyen, “Complementarity of RBS, PIGE
and PIXE for the Determination of Surface Layers of Thicknesses Up to 30
Microns”, Nuclear Instruments and Methods in Physics Research B49 (1990) 46.

59
12. H. Stanley and R. Froberg, “Unusual Structural Characteristics of a Unique Thin
Pyrolytic Graphite Film”, 10th Biennial Conference on Carbon, Lehigh University
(1971).
Foil manufactured by Pfizer, Inc., Easton, PA.
13. D. Mingay, “Calibration of Micromatter Co. Standards Used for the Calibration of
PIXE Analysis Systems”, Journal of Radioanalytical Chemistry 78/1 (1983) 127.
Foils manufactured by Micromatter Co., Deer Harbor, WA.
14. http://www.pleo.com/Dupont/kap_thick.htm (May, 2003).