Embed Size (px)
Citation preview
An early diagnosis of cancer initiative supported by:
NHS England, Cancer Research UK and Macmillan Cancer Support
Multidisciplinary Diagnostic Centre (MDC) based pathways for patients with non-specific but concerning symptoms
Interim report
May 2018 Version 2.5
Accelerate, Coordinate, Evaluate (ACE) Programme
The following people contributed to this report:
MDC project leads: Dawn Gulliford (Airedale), Karen Blackburn and Susan Sykes (Greater
Manchester), Helen Ryan (Leeds), Felicity Carson (London), and Laura Carter (Oxford)
ACE evaluation leads: Dave Chapman, Véronique Poirier, Clare Pearson, Karen Fitzgerald
Policy Research Unit cancer evaluation team: Stephen W. Duffy, Daniel Vulkan
We would like to thank other colleagues in the Policy Research Unit, ACE team and MDC projects that
contributed in reviewing this document.
We would also like to acknowledge the work undertaken as part of the CRUK-PHE partnership which
has contributed to this report.
About the ACE Programme
The Accelerate, Coordinate, Evaluate (ACE) Programme is an early diagnosis of cancer initiative
focused on testing innovations that either identify individuals at high risk of cancer earlier or
streamline diagnostic pathways. It was set-up to accelerate the pace of change in this area by adding
to the knowledge base and is delivered with support from: NHS England, Cancer Research UK and
Macmillan Cancer Support; with support on evaluation provided by the Department of Health’s Policy
Research Units (PRUs).
The first phase of the programme consisted of 60 projects split into various topic-based clusters to
facilitate evidence generation and learning. The second phase comprises five projects exploring
Multidisciplinary Diagnostic Centre (MDC) based pathways. The learning from ACE is intended to
provide ideas and evidence to those seeking to improve local cancer services. The evaluations and
findings are produced independently, and are therefore not necessarily endorsed by the three
supporting organisations.
Contents Multidisciplinary Diagnostic Centre (MDC) Based Pathways _________________________________ i
Interim report _____________________________________________________________________ i
Introduction _____________________________________________________________________ 1
Context _________________________________________________________________________ 1
National Cancer Diagnosis Audit ......................................................................................................... 3
Background ..................................................................................................................................... 4
Results ............................................................................................................................................. 5
Programme structure (Wave 2) ______________________________________________________ 8
Project descriptions and approaches __________________________________________________ 9
Design principles _________________________________________________________________ 11
MDC comparator data ____________________________________________________________ 11
Results ........................................................................................................................................... 12
MDC early findings _______________________________________________________________ 14
Results ........................................................................................................................................... 14
Discussion ______________________________________________________________________ 20
Key interim findings .......................................................................................................................... 21
Future lines of enquiry ...................................................................................................................... 23
Early project learning _____________________________________________________________ 24
Next steps and planned resources ___________________________________________________ 26
References _____________________________________________________________________ 28
Appendix A: High level summary of updated data to 28th February 2018 ____________________ 29

1 Interim report – MDCs v2.5
Introduction
Achieving World Class Cancer Outcomes: A Strategy for England 2015-2020 [1] confirmed the absence
of an optimal referral pathway for patients presenting with non-specific but concerning symptoms
(henceforth referred to as non-specific symptoms or NSCS). In the absence of more specific symptoms
indicative of particular cancers, it is often challenging to identify the most appropriate referral
pathway first time. As a result, patients with non-specific symptoms may be referred on multiple
pathways before the correct diagnostic test is applied and a diagnosis confirmed. This can result in a
longer time taken to reach a diagnosis, which can negatively impact on subsequent clinical outcomes
for the patient, in addition to potentially impacting upon patient experience of care. Presentation via
emergency routes is also common amongst patients with non-specific symptoms, with similarly poor
associated clinical outcomes.
The Accelerate, Coordinate, Evaluate (ACE) Programme of interventions are aimed at improving the
pathway to cancer diagnosis and thereby improving cancer outcomes and patient experience, through
a joint initiative between NHS England, Cancer Research UK, Macmillan Cancer Support, and the
Department of Health’s Policy Research Units (PRU). Wave 2 of the Programme focuses on the
potential for Multidisciplinary Diagnostic Centre (MDC) based pathways to support earlier and faster
detection of cancers amongst patients with non-specific symptoms, who do not meet current
thresholds for urgent referral (Suspected Cancer Referral (SCR)).
The Multidisciplinary Diagnostic Centre concept aims to provide rapid access to a range of diagnostic
tests, ideally in one location and conducted on one visit when possible, with a number of specialists
working together to speed up diagnosis for the patient. Similar approaches have been implemented,
or are being developed, in a number of nations including, amongst others, Denmark, Sweden, and
Wales (Rapid Diagnostic Centres), across England via Cancer Alliances, and within specific locations
(for example, at Guys and St. Thomas in London).
This report provides an interim analysis of activity within the 5 ACE projects in England, in addition to
outlining the current limitations of the data and planned approaches to improve its quality and
robustness. The report also provides information relating to practical learning from the projects, and
considers potential areas of interest for evaluation as the programme continues.
The report is being published at this stage to illustrate positive findings to date, and also to identify
some of the difficulties encountered so far by pilot sites, in order to aid the potential development of
similar MDC-based pathways in other areas.
Context
Earlier diagnosis of cancer can improve clinical outcomes and subsequent quality of life for patients
through the availability of potentially curative treatments, such as surgery and radiotherapy. Overall,
figures suggest that survival for some of the most common cancers is more than three times higher
for patients when diagnosed early at stages 1 and 2 [2].

2 Interim report – MDCs v2.5
However, cancers presenting with non-specific symptoms are often more difficult to diagnose than
those with ‘red flag’ alarm symptoms [3], as certain symptoms or symptom combinations can have a
range of potential causes, a number of which may be cancer (National Institute for Clinical Excellence
(NICE)) [4]. In this context, non-specific symptoms refer to symptoms such as unexplained weight loss,
fatigue, nausea and/or vomiting, and non-specific abdominal pain. For some of these symptoms, the
risk of developing individual cancers may be low, but the overall risk of developing cancer of any type
may be higher [4].
Whilst some cancers are harder to detect, such as pancreatic, lung and stomach, other cancers may
share similar symptoms with other diseases and conditions, making decisions regarding appropriate
referral and investigation more difficult. In some instances, a lack of any discernible symptoms until
disease has progressed to a late stage can make early stage diagnosis for certain cancers problematic.
Furthermore, non-specific symptoms can sometimes be reflective of early stage disease, making it
challenging to identify the underlying cause before the disease progresses to a more advanced stage
and severity [5]. In this sense, waiting for non-specific symptoms to develop in severity potentially
reduces the opportunity for early diagnosis.
Evidence suggests that a significant proportion of cancer patients present without recognised alarm
symptoms [6], with Danish studies indicating that this figure is as high as 52%, with similar rates also
identified in England [7]. In 2015, NICE guidance was updated for suspected cancer referral, with the
risk threshold for referral reduced from 5% to 3%, in an attempt to enable the earlier referral of
patients, and to therefore support earlier diagnosis of cancers and improvements to clinical outcomes
for patients.
Although an urgent referral pathway for suspected cancers (SCR) exists in England, in 2015, 37% of
cancers were diagnosed through this route, with a proportion of patients (20%) diagnosed via
emergency presentation (e.g. at A&E) [12]. Diagnoses via emergency routes are often associated with
late stage disease, and with poorer clinical outcomes.
Prolonged time to diagnosis and treatment can also negatively affect clinical outcomes and contribute
to avoidable deaths [1]. Consequently, initiatives to improve the speed and efficiency of diagnostic
pathways have also been strategically prioritised, as more rapid diagnosis can improve outcomes, as
well as reducing patient anxiety. Evidence also suggests a strong link between patient experience of
care and associated clinical outcomes [8], thus emphasising the importance of rapid diagnostic
approaches and effective, integrated processes.
Danish research indicates that patients with non-specific symptoms can wait a median of 34 days extra
to diagnosis, when compared to those with recognised alarm symptoms [7]. The same research [7] also
suggests that these patients are less likely to be referred as quickly as their comparators, which
contributes to longer diagnostic intervals. These referral difficulties are highlighted by evidence from
pancreatic cancer patients which suggests they often have an increased number of pre-referral
consultations before being placed on the appropriate pathway for their condition; due to the
complexity of their presenting symptoms [9] [10] [11].
For patients with non-specific symptoms, the expected referral route will be a routine one, risking a
slow diagnostic process. As part of Wave 1 of the ACE Programme, the Vague Symptoms cluster
evaluated a series of projects which explored ways of achieving earlier diagnosis for patients with non-
specific symptoms. The evaluation found that opportunities existed to improve the time to diagnosis
3 Interim report – MDCs v2.5
for these patients by developing a non-specific symptoms-based diagnostic pathway, which would
provide planned, rapid access to a range of appropriate tests and reporting [13].
Recommendation 21 of Achieving World Class Cancer Outcomes [1] calls for the trial and evaluation of
Multidisciplinary Diagnostic Centres for non-specific symptoms, as part of Wave 2 of the ACE
Programme. The work referenced in this interim report contributes to the evidence-base regarding
MDC-based pathways, in accordance with the requirements of Recommendation 21. ACE Wave 2
programme activity also contributes to the wider NHS ambition to improve earlier diagnosis of cancer
through the development and roll-out of Rapid Diagnostic and Assessment Centres (RDAC) [14].
Ongoing learning and evaluation from MDC pilot sites will increase available knowledge on this subject
and will support the development and implementation of similar approaches in other areas.
Intended improvements to the overall speed of cancer diagnostic pathways have been framed by the
Faster Diagnosis Standard (FDS), which aims to ensure that patients are told if they have cancer or not
within 28 days of referral. The Faster Diagnosis Standard is currently being implemented and
performance against the standard will be monitored from April 2020, in accordance with
Recommendation 24 of Achieving World Class Cancer Outcomes [1].
The ACE Programme (Wave 2) is due to complete at the end of 2018, at which point, a full evaluation
of MDC approaches will be produced, incorporating quantitative, qualitative and economic analyses.
The evaluation will focus on outcomes and an assessment of the viability of the MDC model, rather
than providing information on operational arrangements at a granular level. It will be necessary to
consider what impact, if any, MDC-based approaches have on the issues outlined above; including,
any improvements to earlier and faster diagnosis; a greater use of planned, non-emergency care; and
improvements to experiences of care for patients with non-specific symptoms.
This interim report acts as a mid-point review of progress so far, as part of this wider evaluation, and
offers an objective appraisal of activity to date and the challenges encountered so far.
National Cancer Diagnosis Audit
In order to develop a more comprehensive understanding of why change is required for patients
presenting with non-specific symptoms, it is necessary to build an accurate picture of activity and
associated clinical outcomes.
To assess non-specific symptoms referrals within their catchment areas, each MDC pilot has collated
a comparator dataset, which aims to provide appropriate benchmarks to evaluate the impact of MDC-
based approaches. Details of this process are discussed further on page 11.
To complement this localised comparator data, the National Cancer Diagnosis Audit (NCDA) has also
been analysed to provide a national overview, and to act as a ‘proxy comparator’ measure regarding
symptoms presentation, primary care intervals and primary care led investigations prior to referral.

4 Interim report – MDCs v2.5
Background The NCDA is a national initiative, which is operationally managed by Cancer Research UK, and
supported by the Royal College of GPs, Macmillan Cancer Support, Public Health England and NHS
England. As part of the audit, GPs are asked to complete primary care information about cancer
patients, and their interactions with primary care, including information on symptoms, referral, and
diagnostic testing.
For the purposes of this report, the second National Cancer Diagnosis Audit (NCDA) conducted in
England in 2016 and based on 2014 cancer diagnoses has been the source of data. Records of patients
presenting with non-specific but concerning symptoms (NSCS) matching the symptoms criteria
developed by the ACE MDC projects were identified (NSCS cohort) (Table 1), and then compared
against the remainder of the NCDA data (non-NSCS cohort). The two specified cohorts were then
compared using appropriate statistical methodologies, with analyses focusing on characteristics of
age, stage of diagnosis, route to diagnosis, and primary care and diagnostic intervals.
Table 1: Symptom definitions from NCDA data item dictionary used to define the NSCS cohort
Broad category Symptom
Presenting symptoms Distention
Abdominal pain – NOS*
Upper abdominal pain
Lower abdominal pain
Change in bowel habit
Diarrhoea
Constipation
Nausea and/or vomiting
Lymphadenopathy – generalised
Lymphadenopathy – localised
Back pain
Chest infection
Chest pain
Loss of appetite
Deep vein thrombosis
New onset diabetes
Fatigue
Pallor
Jaundice
Weight loss
Presenting signs and abnormal investigation that led to a suspicion of cancer
Hepatomegaly
Splenomegaly
Non iron deficiency anaemia
Hypercalcaemia
Thrombocythaemia
* Not otherwise specified
5 Interim report – MDCs v2.5
Results The overall number of cases collated as part of the audit was 17,042. The NSCS cohort included 2,865
cases, whilst the non-NSCS cohort included the remainder of cases excluding the ‘unknown or not
applicable’ (n=10,333).
NCDA data on patient sex and age suggests a similar gender distribution between both NSCS and non-
NSCS cohorts, but that NSCS patients had a significantly higher median age of 72 years (p<0.01) than
the non-NSCS cohort (69 years). NSCS patients were more commonly identified within older age bands
than their comparator cohort, suggesting that patients with cancer presenting with non-specific
symptoms increased in prevalence as they grew older.
The majority of patients in both cohorts reported having at least one existing comorbidity, with
approximately a fifth of NSCS patients identified as having no comorbidity at point of presentation
(22.3% (NSCS); 26.2% (non-NSCS)).
Presenting symptoms
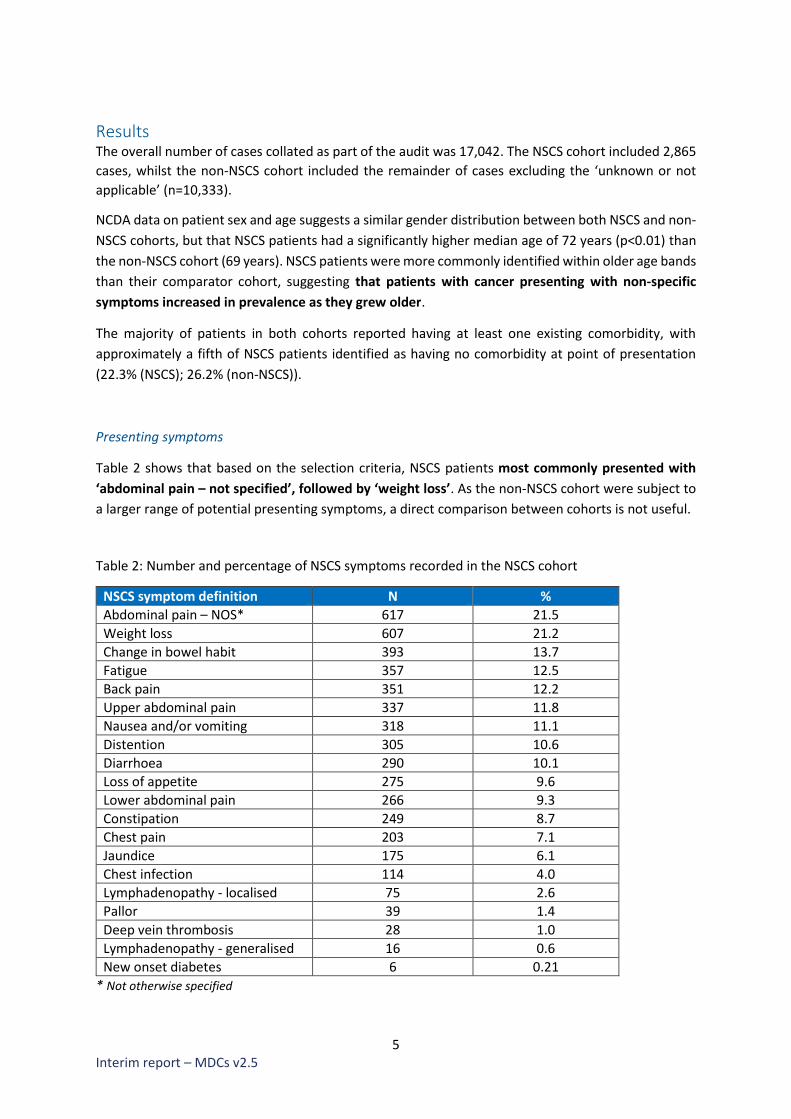
Table 2 shows that based on the selection criteria, NSCS patients most commonly presented with
‘abdominal pain – not specified’, followed by ‘weight loss’. As the non-NSCS cohort were subject to
a larger range of potential presenting symptoms, a direct comparison between cohorts is not useful.
Table 2: Number and percentage of NSCS symptoms recorded in the NSCS cohort
NSCS symptom definition N %
Abdominal pain – NOS* 617 21.5
Weight loss 607 21.2
Change in bowel habit 393 13.7
Fatigue 357 12.5
Back pain 351 12.2
Upper abdominal pain 337 11.8
Nausea and/or vomiting 318 11.1
Distention 305 10.6
Diarrhoea 290 10.1
Loss of appetite 275 9.6
Lower abdominal pain 266 9.3
Constipation 249 8.7
Chest pain 203 7.1
Jaundice 175 6.1
Chest infection 114 4.0
Lymphadenopathy - localised 75 2.6
Pallor 39 1.4
Deep vein thrombosis 28 1.0
Lymphadenopathy - generalised 16 0.6
New onset diabetes 6 0.21
* Not otherwise specified

6 Interim report – MDCs v2.5
Cancer diagnoses
Figure 1 provides details on the type of cancers diagnosed within the NSCS cohort, and indicates that
colorectal cancers were the most commonly diagnosed cancer type, followed by upper GI and lung.
Figure 1: Distribution of cancer types in the NSCS cohort
Stage at diagnosis
Figure 2 provides details on the stage of cancers at diagnosis. Excluding unknown stages cases, NSCS
patients (67.3%) were more frequently diagnosed at a late stage than non-NSCS patients (44.8%).
Figure 2: Stage distribution in the NSCS cohort and the non-NSCS cohort
0
5
10
15
20
25
30
35
Per
cen
tage
Cancer types
Distribution of cancer types
0%
10%
20%
30%
40%
50%
60%
70%
80%
90%
100%
NSCS non-NSCS
Stage distribution
Stage 1 Stage 2 Stage 3 Stage 4 Unknown
7 Interim report – MDCs v2.5
Routes to diagnoses
When comparing routes to diagnosis, analysis indicates that NSCS patients were less likely (28.8%) to
be referred on an urgent 2 Week Wait (SCR) pathway than their comparator cohort (47.3%). Similar
rates were evident for both cohorts regarding routine GP referral (24.3% (NSCS); 24.9% (non-NSCS)).
The proportion of emergency presentations was significantly higher (33.7 vs 16%) (p<0.01) in the
NSCS cohort compared to the non-NSCS cohort
GPs also indicated that the NSCS cohort were more likely to experience avoidable delays to diagnosis
(28.7% (NSCS); 23.6% (non-NSCS)). These delays were mainly associated with stages of the pathways
such as investigative tests (test request & performance) (28.3% (NSCS); 22.8% (non-NSCS)) but also at
patient level (possibly not seeking help or not attending appointments) (20.4% (NSCS); 25.5% (non-
NSCS)).
Interval times
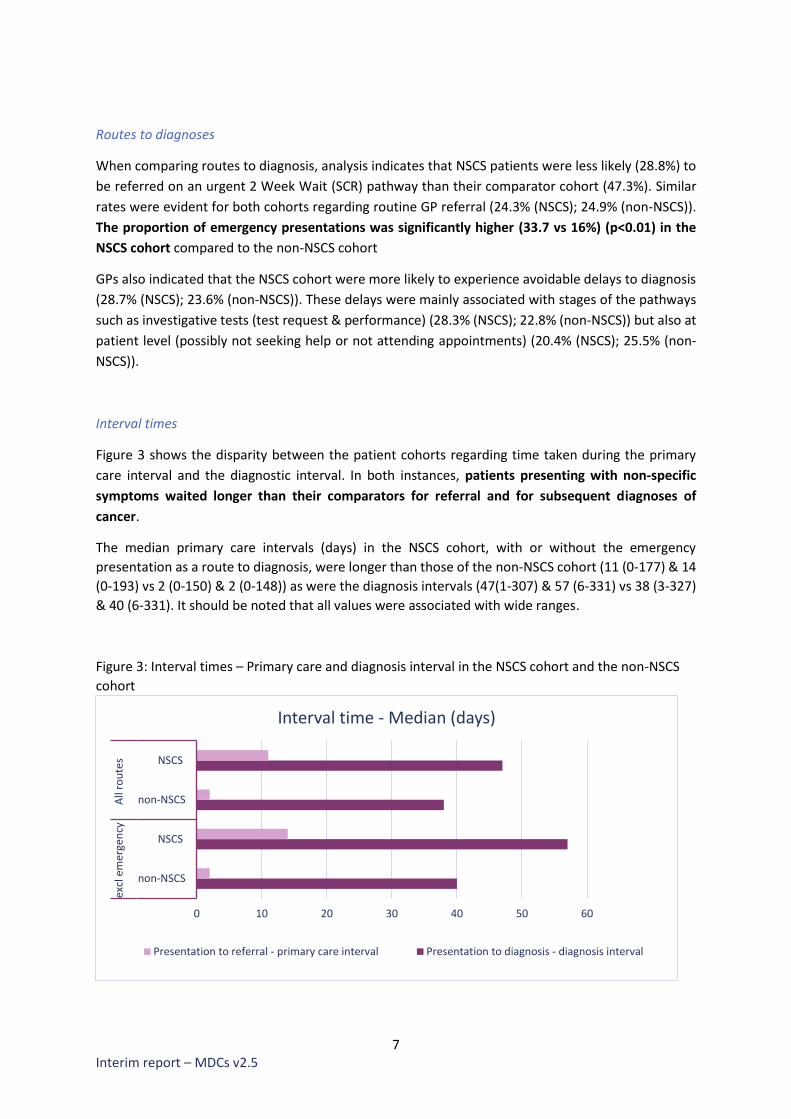
Figure 3 shows the disparity between the patient cohorts regarding time taken during the primary
care interval and the diagnostic interval. In both instances, patients presenting with non-specific
symptoms waited longer than their comparators for referral and for subsequent diagnoses of
cancer.
The median primary care intervals (days) in the NSCS cohort, with or without the emergency
presentation as a route to diagnosis, were longer than those of the non-NSCS cohort (11 (0-177) & 14
(0-193) vs 2 (0-150) & 2 (0-148)) as were the diagnosis intervals (47(1-307) & 57 (6-331) vs 38 (3-327)
& 40 (6-331). It should be noted that all values were associated with wide ranges.
Figure 3: Interval times – Primary care and diagnosis interval in the NSCS cohort and the non-NSCS
cohort
0 10 20 30 40 50 60
non-NSCS
NSCS
non-NSCS
NSCS
excl
em
erge
ncy
All
rou
tes
Days
Interval time - Median (days)
Presentation to referral - primary care interval Presentation to diagnosis - diagnosis interval

8 Interim report – MDCs v2.5
Although the NCDA analysis has some limitations, the main one being that the audit captures patients
diagnosed in 2014 and therefore does not reflect the implementation of the 2015 NICE NG12
recommendations, it helps to illustrate issues relating to the presentation of patients with NSCS. The
NCDA itself is a valuable dataset of primary care and, when linked to other cancer datasets, can
provide a useful tool to investigate full diagnostic pathways for cancer patients. This will enable a more
informed position to be taken when assessing information generated from the MDC projects, and for
any conclusions to be considered in the appropriate context.
The identification of the NSCS cohort is based on the combined range of presenting symptoms for all
MDC sites, which were locally selected as part of initial MDC planning. As an overall pool of symptoms,
they might lead to a cohort not fully reflective of solely NSCS patients presenting to each MDC. This
will impact on which patients are compared in the NSCS and non-NSCS groups.
Finally, some of the questions in the NCDA involve a certain degree of subjectivity on the part of the
GP and therefore could lead to an element of error typical of this type of methodology, but
nevertheless needing to be considered during the interpretation of the results.
This initial NCDA analysis will be enhanced by undertaking a sensitivity analysis in building cohorts of
NSCS, using each MDC project specific symptom referral criteria. There will also be further work
examining the number of consultations, reasons for these, and focusing on cancers that are more
difficult to diagnose (e.g. pancreatic cancer), as well as considering if there are differences based on
age group and sex in relation to routes to diagnosis and stage of disease between the NSCS and non-
NSCS cohorts.
Programme structure (Wave 2)
The Programme is structured around the work of 5 projects in England, with 10 operational MDC sites
based in Airedale, Greater Manchester (2), Leeds, London (5) and Oxford, as indicated in Figure 4. The
pilot sites are developing and trialling MDC-based pathways for patients with non-specific symptoms
that could be indicative of cancer, but who don’t currently meet the threshold for urgent referral.
Amongst those areas with no prior arrangements in place, it has taken an average of 16 months to
develop and implement the MDC.
To gain a comprehensive understanding of MDC-based approaches, and how these could be best
employed to meet varying local need within different communities, each project is trialling a core set
of agreed referral criteria, but with a few additional local variations.
To ensure that activity and impact can be assessed and evaluated at a programme level, all MDC sites
have agreed to a common dataset and reporting framework. In addition to project specific items, the
dataset includes items based on the Cancer Outcomes and Services Dataset (COSD), with a focus on
secondary care presentation, cancer diagnosis processes, and incidental diseases.

9 Interim report – MDCs v2.5
Figure 4: ACE Multidisciplinary Diagnostic Centre projects
Project descriptions and approaches
Detailed information on referral criteria, MDC diagnostics, and MDC pathways by individual project
has been included in the MDC Resource Pack, which is available upon request via
However, Table 3 provides an overall summary of some of the key elements of each MDC project, in
order to illustrate the operational distinctions between sites. It should also be noted that these MDC
sites were launched at different times during 2017.
Airedale, Wharfedale & Craven
MDC site: Airedale General Hospital
Greater Manchester
MDC sites: Manchester University NHS Foundation Trust (Wythenshawe Hospital) & The Northern Care Alliance (Royal Oldham Hospital)
Oxford
MDC site: Oxford University Hospitals Trust (Specialist Cancer Centre)
Leeds
MDC site: St James University Hospital (Specialist Cancer Centre)
London
MDC sites: North Middlesex University Hospital, University College London Hospital (Specialist Cancer Centre), Southend University Hospital, Queens BHRUT) & the Royal Free Hospital

10 Interim report – MDCs v2.5
Table 3: Initial MDC arrangements by individual project
Airedale Launch date 17th Jan 17
Setting/ location General Hospital
Referral criteria Persistent unexplained abdominal pain; persistent unexplained weight loss; too unwell for 2 week wait (SCR)
Referral route GP; A&E; Allied Health Professional
MDC co-ordination CNS
Main MDC diagnostics CT Scan CAP (Chest, Abdomen, Pelvis)
Lead Clinician Medical Oncologist
Greater Manchester Launch date 3rd Mar 17 (Royal Oldham Hospital1); 13th Dec 16 (Wythenshawe Hospital2)
Setting / location General Hospital1; University Teaching Hospital2
Referral criteria New unexplained abdominal pain; unexplained weight loss; Nausea / loss of appetite; severe unexplained fatigue; non-iron deficiency anaemia
Referral route GP
MDC co-ordination CNS / Navigator
Main MDC diagnostics CT Scan CAP (Chest, Abdomen, Pelvis), Gastroscopy
Lead Clinician Gastroenterologist
Leeds Launch date 31st Jan 17
Setting / location Specialist Cancer Centre
Referral criteria New unexplained abdominal pain; unexplained weight loss; nausea / loss of appetite; non-iron deficiency anaemia
Referral route GP; Acute Medicine
MDC co-ordination CNS / MDC Co-ordinator
Main MDC diagnostics Chest X-ray
Lead Clinician Clinical Oncologist & Acute Medical Consultant
London Launch date 1st May 17 (North Middlesex1); 1st Apr 17 (UCLH1); 1st Dec 16 (Queens - BHRUT2); 1st Jan 18 (Royal
Free Hospital1); April 18 (Southend University Hospital3)
Setting / location Includes Specialist Cancer Centre
Referral criteria New unexplained abdominal pain; unexplained weight loss; persistent nausea; painless jaundice; GP suspicion of GI symptoms
Referral route GP; A&E
MDC co-ordination CNS
Main MDC diagnostics Endoscopy, CT Scan, MRI, Colonoscopy, Ultrasound
Lead Clinician 1Gastroenterologist, 2GI Surgeon 3Oncologist
Oxford Launch date 15th Mar 17
Setting / location Specialist Cancer Centre
Referral criteria New atypical pain; unexplained weight loss; persistent nausea or appetite loss; severe unexplained fatigue; unexplained lab. test findings; no other urgent referral pathway for clinical scenario; >40 yrs; GP gut feeling
Referral route GP
MDC co-ordination Clinical Navigator (Radiographer)
Main MDC diagnostics Low dose CT CAP (Chest, Abdomen & Pelvis)
Lead Clinician General Physician & Radiologist
11 Interim report – MDCs v2.5
Design principles
As noted, each of the MDC projects has been configured to deliver a core set of approaches and
functionalities, but with variations to meet local circumstances. However, from a programme
perspective, it has been possible to identify 3 emerging variations to the MDC model, in addition to a
set of key commonalities found within each MDC approach.
These variations demonstrate the range of potential options that are available regarding the
development of MDC-based pathways. The information also outlines the potential flexibility of the
model, which is required to ensure that arrangements can be tailored to meet specific local needs. By
providing a set of overarching design principles, the information aims to ensure that discussions on
the practical application of these variant approaches are cognisant of the key elements of a MDC
pathway.
These distinct approaches, along with the overarching design principles for a MDC-based pathway, are
available on the ACE website at www.cruk.org/ACE.
It is important to note that whilst the details are correct at the time of writing this report, they will
continue to evolve further as projects continue to develop. It will be important to revise these
approaches as necessary and, where possible, to assess them in light of the emerging evidence and
MDC data.
MDC comparator data
In order to provide a benchmark of local activity regarding patients with non-specific symptoms prior
to the implementation of the MDC, all projects were asked to collate comparator data using the
common dataset agreed for the overall project. This information would then be used to provide a
baseline against which any impact could be measured, as part of the evaluation of MDC effectiveness.
As no current pathway exists for non-specific symptoms, it was not possible to create a baseline from
existing arrangements. Therefore, a bespoke, manual approach was required. Initially, projects

12 Interim report – MDCs v2.5
planned to use a stepped wedge approach to implementation, whereby the MDC pathway would be
rolled out across individual project areas over a period of time. Using the same referral criteria, GPs in
areas without the MDC would note the referral pathway they chose for patients. Initially, this would
predominantly produce local comparator data, which would be sequentially replaced by MDC
operational data (as the pathway was more widely introduced).
However, as all projects reported difficulties in implementing such an approach across a complex
health environment, the decision was taken in most areas to conduct retrospective audits from a
combination of primary and secondary care systems. Due to the different approaches undertaken,
and the challenges encountered when collating data of sufficient quality and completeness, the
comparator data currently only provides a partial picture of local activity. Consequently, although
improvements are ongoing, comparator data is based on data available for Airedale, Greater
Manchester, and Leeds.
The results presented below are based on information submitted from these 4 MDC sites. It is
preliminary and it is anticipated that additional comparator data from other MDCs will be available in
the near future.
As mentioned above, approaches used by the MDC to undertake their audits differ except for the
overall focus on patients presenting with non-specific symptoms. The approaches adopted by
individual projects were as follows:
Airedale:
• The patients had been diagnosed with cancer across 2 week-wait (SCR), A&E, Clinical
Upgrade, dental practice and non-fast track breast covering all pathways
• Data (Dec 2015 to Sept 2016) was extracted from the hospital system (PPM (precision
practice management) and SystmOne) but a very small number of notes might have been
requested if the systems were not clear
Greater Manchester:
• The patients were all referred initially as tumour specific 2 week-wait (SCR) referrals and the
referrals were selected from across specialties
• Data (Apr 2016 to Sept 2016 (Wythenshawe Hospital) and Mar 2016 to July 2016 (Royal
Oldham Hospital)) was extracted from notes and hospital referral systems were reviewed
Leeds:
• The patients were all referred initially as tumour specific 2 week-wait (SCR) (upper GI and
hepato-pancreato-biliary referrals)
• Data (Apr 2016 to Apr 2017) was extracted from the hospital system (PPM) and notes were
also reviewed.
Results Of the 201 patients who presented with non-specific symptoms in Airedale (61), Greater Manchester
(93) and Leeds (47), 56% were female (n=112). Patients presented across a wide age range (16–92
years old), with ‘weight loss’ the most commonly reported presenting symptom (58% of cases).
Table 4 provides details of the most commonly recorded presenting symptoms within the comparator
cohort.
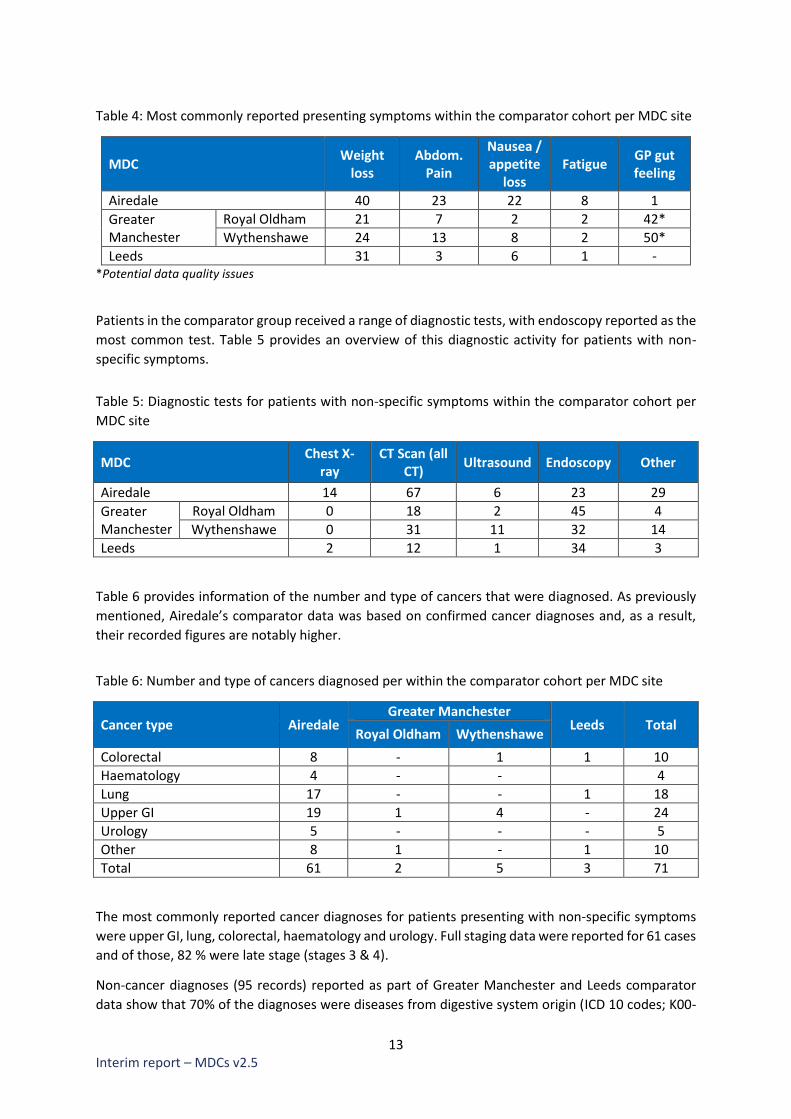
13 Interim report – MDCs v2.5
Table 4: Most commonly reported presenting symptoms within the comparator cohort per MDC site
MDC Weight
loss Abdom.
Pain
Nausea / appetite
loss Fatigue
GP gut feeling
Airedale 40 23 22 8 1
Greater Manchester
Royal Oldham 21 7 2 2 42*
Wythenshawe 24 13 8 2 50*
Leeds 31 3 6 1 - *Potential data quality issues
Patients in the comparator group received a range of diagnostic tests, with endoscopy reported as the
most common test. Table 5 provides an overview of this diagnostic activity for patients with non-
specific symptoms.
Table 5: Diagnostic tests for patients with non-specific symptoms within the comparator cohort per
MDC site
MDC Chest X-
ray CT Scan (all
CT) Ultrasound Endoscopy Other
Airedale 14 67 6 23 29
Greater Manchester
Royal Oldham 0 18 2 45 4
Wythenshawe 0 31 11 32 14
Leeds 2 12 1 34 3
Table 6 provides information of the number and type of cancers that were diagnosed. As previously
mentioned, Airedale’s comparator data was based on confirmed cancer diagnoses and, as a result,
their recorded figures are notably higher.
Table 6: Number and type of cancers diagnosed per within the comparator cohort per MDC site
Cancer type Airedale Greater Manchester
Leeds Total Royal Oldham Wythenshawe
Colorectal 8 - 1 1 10
Haematology 4 - - 4
Lung 17 - - 1 18
Upper GI 19 1 4 - 24
Urology 5 - - - 5
Other 8 1 - 1 10
Total 61 2 5 3 71
The most commonly reported cancer diagnoses for patients presenting with non-specific symptoms
were upper GI, lung, colorectal, haematology and urology. Full staging data were reported for 61 cases
and of those, 82 % were late stage (stages 3 & 4).
Non-cancer diagnoses (95 records) reported as part of Greater Manchester and Leeds comparator
data show that 70% of the diagnoses were diseases from digestive system origin (ICD 10 codes; K00-
14 Interim report – MDCs v2.5
K95) and 17% of the blood and blood-forming organs and certain disorders involving the immune
mechanism (ICD 10 codes; D50-D89).
While data on clinical diagnostics across the 4 MDCs were available, the nature of the comparator
data collated from these 4 MDCs does not make it possible to pool the data at this stage. Airedale
alone could provide a date of diagnosis being communicated to the patient (cancer diagnoses) and
showed that 68% of cases were told of the diagnosis within 28 days. Nevertheless, the dates of clinical
diagnosis given across the 4 MDC will be useful to compare within each respective MDC.
These results illustrate the current partial coverage of comparator data from the MDC sites and do
not enable a complete baseline to be established for patients with non-specific symptoms. As already
noted, the identification and collation of comparator data has been challenging, mainly due to the
absence of such a referral pathway for patients with non-specific symptoms. Additionally,
retrospective auditing is difficult to achieve, and any results will need to be interpreted within this
context.
Nevertheless, based on the data available, some facts related to the presentation of patients with
non-specific symptoms are emerging:
• The main symptom at presentation is weight loss
• The cancer diagnoses are in line with those expected from a cohort of patients with non-
specific symptoms
Additional data are expected and further data collections will be considered.
MDC early findings
The following analyses are based on grouped data from patients with a MDC referral date up to 30th
November 2017. It includes 8 MDC sites based in Airedale, Greater Manchester (2), Leeds, London (3)
and Oxford.
The information represents an interim snapshot of activity across the 5 projects at this point in time
and is based on the data recorded and received by the deadline. They should be viewed in this
context only. It is understood that the data will evolve not only in quantity but also in quality.
Updated data from patients with a referral date up to 28th February 2018 has now been received and
is currently being processed. Although a detailed analysis is not yet available, a high-level summary of
activity up to 28th February 2018 is attached at Appendix A.
Results As of 30th November 2017, 1,034 patients had been referred into the MDC sites. Anecdotal evidence
indicates that the implementation of these pathways has been positively received by clinical
colleagues in both primary and secondary care settings.
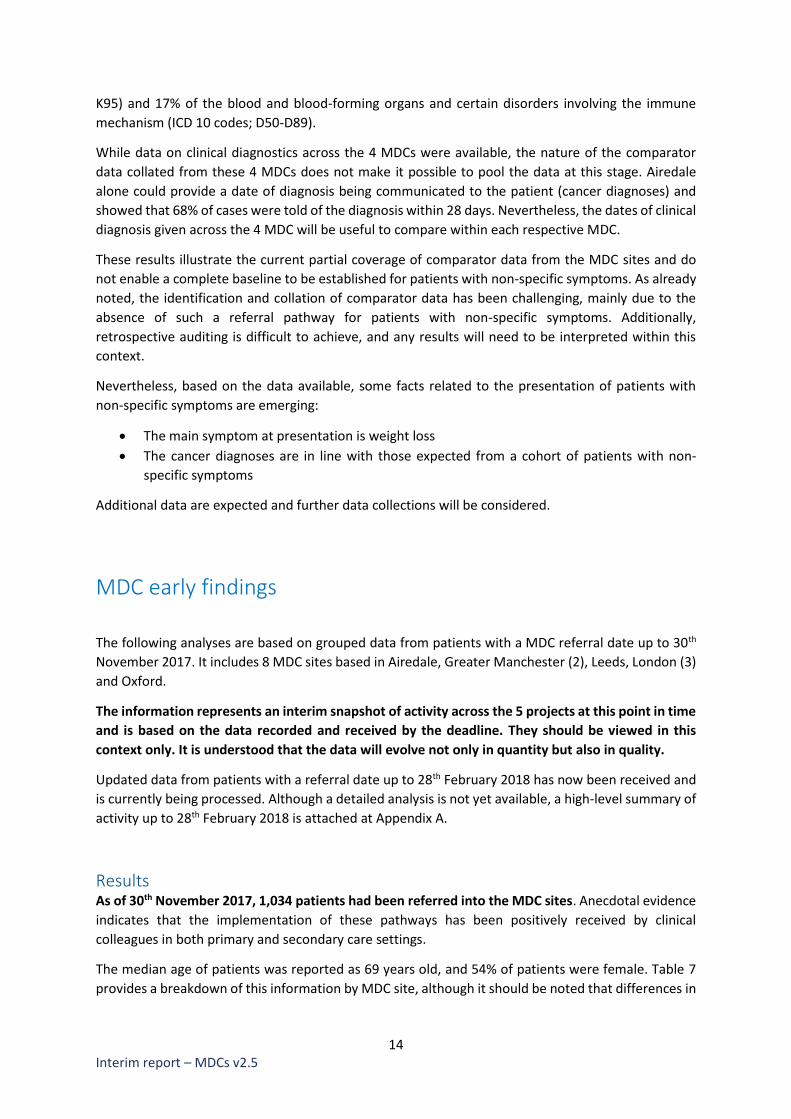
The median age of patients was reported as 69 years old, and 54% of patients were female. Table 7
provides a breakdown of this information by MDC site, although it should be noted that differences in
15 Interim report – MDCs v2.5
the number of patients seen will reflect the different launch dates of specific sites and the varying
populations served, in addition to the differing approaches being trialled.
Table 7: Number of patients, percentage of females and median age per MDC
MDC Patient
numbers Female (%) Median age Patient age
range
Airedale 142 52 71.5 31-93
Greater Manchester
Royal Oldham 77 60 71 22-88
Wythenshawe 143 59 71 29-94
Leeds 217 49 69 18-97
London
BHRUT 81 52 66 22-92
North Mid 48 54 60.5 24-85
UCLH 175 52 64 25-91
Oxford 151 60 70 44-97
Total 1,034 54 69 -
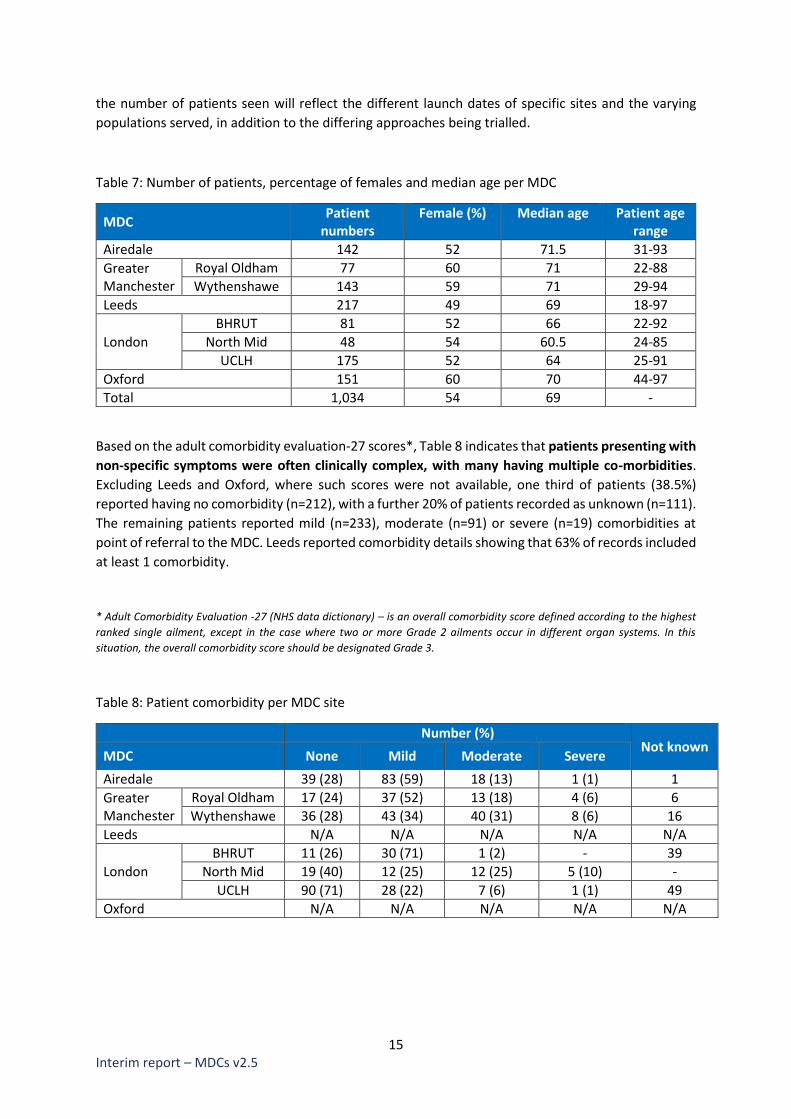
Based on the adult comorbidity evaluation-27 scores*, Table 8 indicates that patients presenting with
non-specific symptoms were often clinically complex, with many having multiple co-morbidities.
Excluding Leeds and Oxford, where such scores were not available, one third of patients (38.5%)
reported having no comorbidity (n=212), with a further 20% of patients recorded as unknown (n=111).
The remaining patients reported mild (n=233), moderate (n=91) or severe (n=19) comorbidities at
point of referral to the MDC. Leeds reported comorbidity details showing that 63% of records included
at least 1 comorbidity.
* Adult Comorbidity Evaluation -27 (NHS data dictionary) – is an overall comorbidity score defined according to the highest
ranked single ailment, except in the case where two or more Grade 2 ailments occur in different organ systems. In this
situation, the overall comorbidity score should be designated Grade 3.
Table 8: Patient comorbidity per MDC site
Number (%) Not known
MDC None Mild Moderate Severe
Airedale 39 (28) 83 (59) 18 (13) 1 (1) 1
Greater Manchester
Royal Oldham 17 (24) 37 (52) 13 (18) 4 (6) 6
Wythenshawe 36 (28) 43 (34) 40 (31) 8 (6) 16
Leeds N/A N/A N/A N/A N/A
London
BHRUT 11 (26) 30 (71) 1 (2) - 39
North Mid 19 (40) 12 (25) 12 (25) 5 (10) -
UCLH 90 (71) 28 (22) 7 (6) 1 (1) 49
Oxford N/A N/A N/A N/A N/A

16 Interim report – MDCs v2.5
Presenting symptoms The majority of patients referred to the MDC presented with weight loss (62%), followed by nausea
and appetite loss (28%), abdominal pain (25%), and fatigue (20%). GP gut feeling was cited as a
reason for referral across all sites (33% of referrals overall), but reported rates varied.
In addition to patients having multiple long-term conditions, patients also often presented with
combinations of symptoms, further increasing the potential complexity of decision making around
referral and diagnostic activities. Table 9 provides details of the occurrence of the presenting
symptoms by MDC site and the mean number of symptoms per patient per MDC site. As often patients
presented with more than one symptom, the percentage by MDC site does not add up to 100%.
Table 9: Main presenting symptoms per MDC
MDC
Presenting symptom - number (%) and mean
Weight loss
Fatigue Nausea/ appetite
loss
Abdo. Pain
GP gut feel
Mean no. symptoms
per patient*
Airedale 111 (78) 53 (37) 62 (44) 46 (32) 62 (44) 3
Greater Manchester
Royal Oldham 59 (77) 45 (58) 39 (51) 25 (32) 59 (77) 4.5
Wythenshawe 101 (71) 24 (17) 32 (22) 7 (5) 43 (30) 2.6
Leeds 102 (47) 13 (6) 49 (23) 26 (12) 40 (18) 1.9
London
BHRUT 33 (41) 24 (30) 34 (42) 40 (49) 12 (15) 2.5
North Mid 35 (73) 0 (0) 7 (15) 8 (17) 4 (8) 1.4
UCLH 117 (67) 3 (2) 22 (13) 76 (43) 17 (10) 1.4
Oxford 84 (56) 49 (32) 42 (28) 26 (17) 107 (71) 2.5
Total 642(62) 211 (20) 287(28) 254 (25) 344 (33) -
* The number of data items provided to record symptoms varied slightly between projects, and therefore the average
should be considered within this context. Additional open-ended information regarding symptoms is provided for some
projects but has not been included in Table 9.
Routes to referral and diagnostics The predominant route to referral into the MDC was from primary care, which represents 94% of all
referrals to date. However, as some sites (for example, Leeds and Airedale) have intentionally included
alternate referral routes into their pathways, variations in referral routes are to be expected, and are
reflective of deliberate pathway design. Details on routes to referral by individual MDC project have
been described in Table 3 of this report.
With reference to diagnostic testing, differences in approach were evident amongst the project sites,
therefore reflecting the approaches being trialled in the MDC pathways. Table 10 provides information
on the most common imaging procedures per MDC and the number of diagnostic tests per record.
Those included CXR, endoscopy, ultrasound and blood tests.
17 Interim report – MDCs v2.5
Table 10: Most common diagnostic imaging test and number of overall diagnostic tests undertaken
per record
Most common diagnostic imaging test and % of patients
amongst those with at least one test
Diagnostic test per record
Type of test % Max number
of tests No test recorded
Airedale CT Scan 90 4 9
Greater Manchester
Royal Oldham CT Scan 100 4 2
Wythenshawe CT Scan 93 5 15
Leeds CXR 52 6 45
London
BHRUT CT Scan 71 5 4
North Mid CT Scan 61 5 7
UCLH CT Scan 82 4 8
Oxford CT Scan 100 1 -
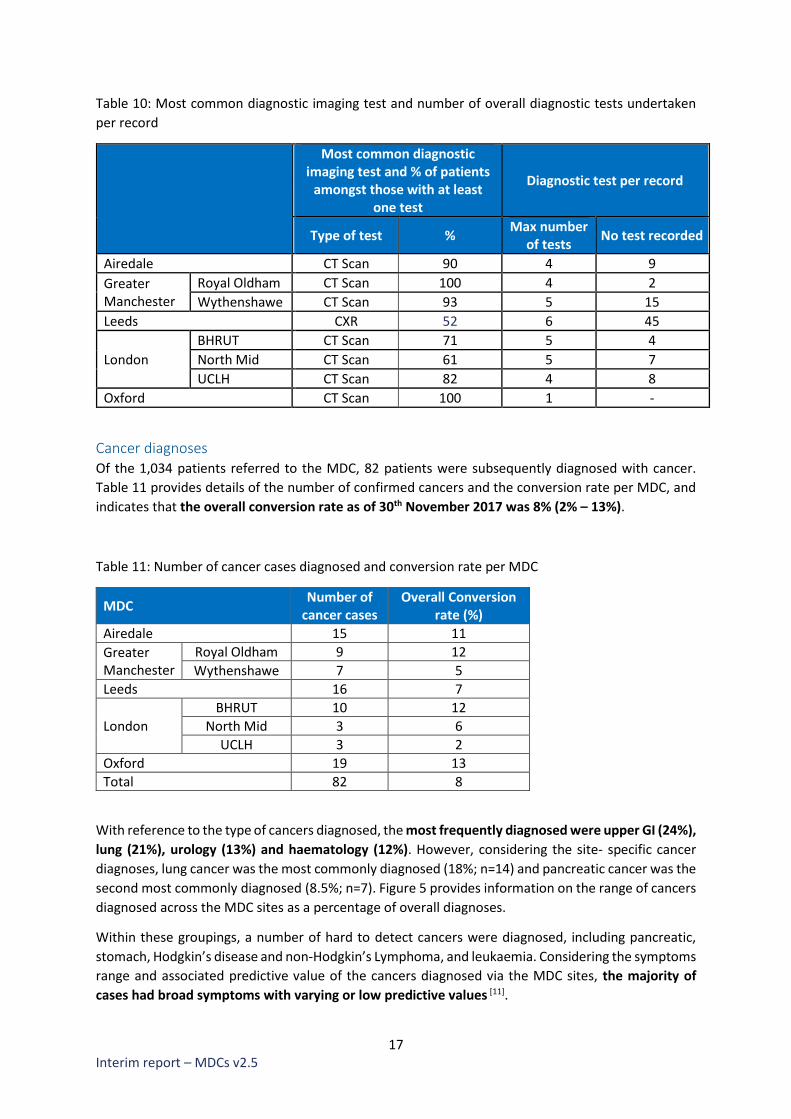
Cancer diagnoses Of the 1,034 patients referred to the MDC, 82 patients were subsequently diagnosed with cancer.
Table 11 provides details of the number of confirmed cancers and the conversion rate per MDC, and
indicates that the overall conversion rate as of 30th November 2017 was 8% (2% – 13%).
Table 11: Number of cancer cases diagnosed and conversion rate per MDC
MDC Number of
cancer cases Overall Conversion
rate (%)
Airedale 15 11
Greater Manchester
Royal Oldham 9 12
Wythenshawe 7 5
Leeds 16 7
London
BHRUT 10 12
North Mid 3 6
UCLH 3 2
Oxford 19 13
Total 82 8
With reference to the type of cancers diagnosed, the most frequently diagnosed were upper GI (24%),
lung (21%), urology (13%) and haematology (12%). However, considering the site- specific cancer
diagnoses, lung cancer was the most commonly diagnosed (18%; n=14) and pancreatic cancer was the
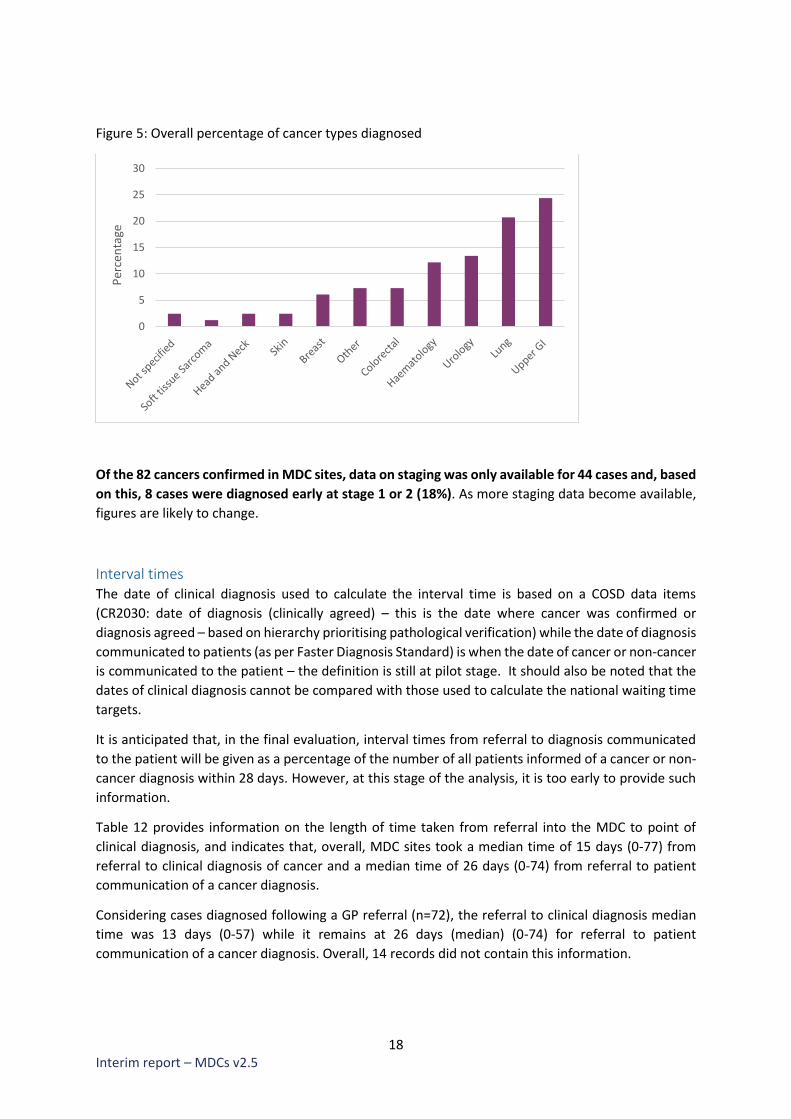
second most commonly diagnosed (8.5%; n=7). Figure 5 provides information on the range of cancers
diagnosed across the MDC sites as a percentage of overall diagnoses.
Within these groupings, a number of hard to detect cancers were diagnosed, including pancreatic,
stomach, Hodgkin’s disease and non-Hodgkin’s Lymphoma, and leukaemia. Considering the symptoms
range and associated predictive value of the cancers diagnosed via the MDC sites, the majority of
cases had broad symptoms with varying or low predictive values [11].
18 Interim report – MDCs v2.5
Figure 5: Overall percentage of cancer types diagnosed
Of the 82 cancers confirmed in MDC sites, data on staging was only available for 44 cases and, based
on this, 8 cases were diagnosed early at stage 1 or 2 (18%). As more staging data become available,
figures are likely to change.
Interval times The date of clinical diagnosis used to calculate the interval time is based on a COSD data items
(CR2030: date of diagnosis (clinically agreed) – this is the date where cancer was confirmed or
diagnosis agreed – based on hierarchy prioritising pathological verification) while the date of diagnosis
communicated to patients (as per Faster Diagnosis Standard) is when the date of cancer or non-cancer
is communicated to the patient – the definition is still at pilot stage. It should also be noted that the
dates of clinical diagnosis cannot be compared with those used to calculate the national waiting time
targets.
It is anticipated that, in the final evaluation, interval times from referral to diagnosis communicated
to the patient will be given as a percentage of the number of all patients informed of a cancer or non-
cancer diagnosis within 28 days. However, at this stage of the analysis, it is too early to provide such
information.
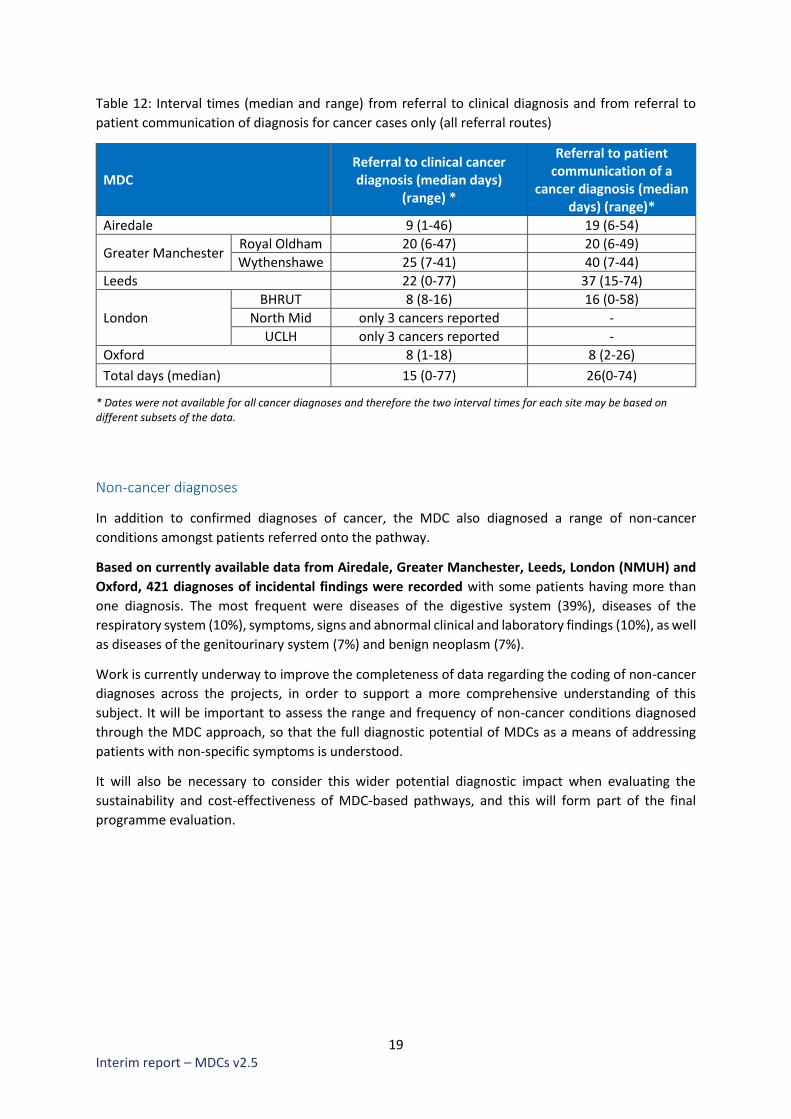
Table 12 provides information on the length of time taken from referral into the MDC to point of
clinical diagnosis, and indicates that, overall, MDC sites took a median time of 15 days (0-77) from
referral to clinical diagnosis of cancer and a median time of 26 days (0-74) from referral to patient
communication of a cancer diagnosis.
Considering cases diagnosed following a GP referral (n=72), the referral to clinical diagnosis median
time was 13 days (0-57) while it remains at 26 days (median) (0-74) for referral to patient
communication of a cancer diagnosis. Overall, 14 records did not contain this information.
0
5
10
15
20
25
30
Per
cen
tage
19 Interim report – MDCs v2.5
Table 12: Interval times (median and range) from referral to clinical diagnosis and from referral to
patient communication of diagnosis for cancer cases only (all referral routes)
MDC Referral to clinical cancer diagnosis (median days)
(range) *
Referral to patient communication of a
cancer diagnosis (median days) (range)*
Airedale 9 (1-46) 19 (6-54)
Greater Manchester Royal Oldham 20 (6-47) 20 (6-49)
Wythenshawe 25 (7-41) 40 (7-44)
Leeds 22 (0-77) 37 (15-74)
London
BHRUT 8 (8-16) 16 (0-58)
North Mid only 3 cancers reported -
UCLH only 3 cancers reported -
Oxford 8 (1-18) 8 (2-26)
Total days (median) 15 (0-77) 26(0-74)
* Dates were not available for all cancer diagnoses and therefore the two interval times for each site may be based on different subsets of the data.
Non-cancer diagnoses
In addition to confirmed diagnoses of cancer, the MDC also diagnosed a range of non-cancer
conditions amongst patients referred onto the pathway.
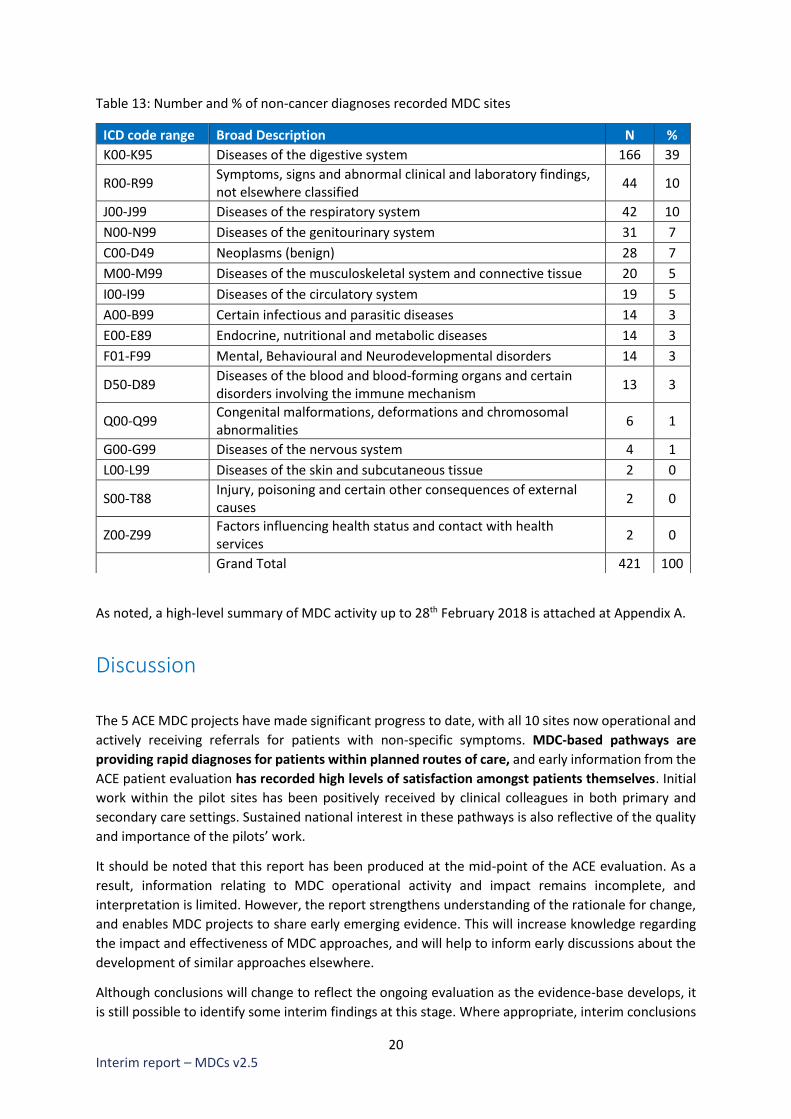
Based on currently available data from Airedale, Greater Manchester, Leeds, London (NMUH) and
Oxford, 421 diagnoses of incidental findings were recorded with some patients having more than
one diagnosis. The most frequent were diseases of the digestive system (39%), diseases of the
respiratory system (10%), symptoms, signs and abnormal clinical and laboratory findings (10%), as well
as diseases of the genitourinary system (7%) and benign neoplasm (7%).
Work is currently underway to improve the completeness of data regarding the coding of non-cancer
diagnoses across the projects, in order to support a more comprehensive understanding of this
subject. It will be important to assess the range and frequency of non-cancer conditions diagnosed
through the MDC approach, so that the full diagnostic potential of MDCs as a means of addressing
patients with non-specific symptoms is understood.
It will also be necessary to consider this wider potential diagnostic impact when evaluating the
sustainability and cost-effectiveness of MDC-based pathways, and this will form part of the final
programme evaluation.
20 Interim report – MDCs v2.5
Table 13: Number and % of non-cancer diagnoses recorded MDC sites
As noted, a high-level summary of MDC activity up to 28th February 2018 is attached at Appendix A.
Discussion
The 5 ACE MDC projects have made significant progress to date, with all 10 sites now operational and
actively receiving referrals for patients with non-specific symptoms. MDC-based pathways are
providing rapid diagnoses for patients within planned routes of care, and early information from the
ACE patient evaluation has recorded high levels of satisfaction amongst patients themselves. Initial
work within the pilot sites has been positively received by clinical colleagues in both primary and
secondary care settings. Sustained national interest in these pathways is also reflective of the quality
and importance of the pilots’ work.
It should be noted that this report has been produced at the mid-point of the ACE evaluation. As a
result, information relating to MDC operational activity and impact remains incomplete, and
interpretation is limited. However, the report strengthens understanding of the rationale for change,
and enables MDC projects to share early emerging evidence. This will increase knowledge regarding
the impact and effectiveness of MDC approaches, and will help to inform early discussions about the
development of similar approaches elsewhere.
Although conclusions will change to reflect the ongoing evaluation as the evidence-base develops, it
is still possible to identify some interim findings at this stage. Where appropriate, interim conclusions
ICD code range Broad Description N %
K00-K95 Diseases of the digestive system 166 39
R00-R99 Symptoms, signs and abnormal clinical and laboratory findings, not elsewhere classified
44 10
J00-J99 Diseases of the respiratory system 42 10
N00-N99 Diseases of the genitourinary system 31 7
C00-D49 Neoplasms (benign) 28 7
M00-M99 Diseases of the musculoskeletal system and connective tissue 20 5
I00-I99 Diseases of the circulatory system 19 5
A00-B99 Certain infectious and parasitic diseases 14 3
E00-E89 Endocrine, nutritional and metabolic diseases 14 3
F01-F99 Mental, Behavioural and Neurodevelopmental disorders 14 3
D50-D89 Diseases of the blood and blood-forming organs and certain disorders involving the immune mechanism
13 3
Q00-Q99 Congenital malformations, deformations and chromosomal abnormalities
6 1
G00-G99 Diseases of the nervous system 4 1
L00-L99 Diseases of the skin and subcutaneous tissue 2 0
S00-T88 Injury, poisoning and certain other consequences of external causes
2 0
Z00-Z99 Factors influencing health status and contact with health services
2 0
Grand Total 421 100
21 Interim report – MDCs v2.5
presented below have been supplemented by the addition of updated MDC data as of 28th February
2018 (also, see Appendix A).
Key interim findings ACE programme activity is evaluating the potential for MDC-based pathways to positively influence
the following strategic objectives for patients with non-specific symptoms. It is helpful to consider
progress in these terms:
Cancer diagnoses Early evidence suggests that MDCs are a valuable way to diagnose cancer within this patient group.
Although conversion rates vary across the pilot sites, and are reflective of activity from the initial
implementation phase, the current overall conversion rate at programme level (8 %; range 2%-13%)
is consistent with the current conversion rate (8%) for patients referred with ‘alarm’ symptoms, [15]
thus addressing an identified disparity in urgent referral routes for these patient groups. Information
as of 28th February 2018 provides further positive evidence; of the 1,623 patients referred to the MDC
by this stage, 142 cancers were diagnosed (conversion rate 9%; range 4% - 15%).
Importantly, the MDCs appear to be predominantly diagnosing cancers with a broad symptoms range
with varying or low predictive value [11] which is entirely appropriate for a pathway focusing on non-
specific symptoms. A number of these cancers, including pancreatic, which accounted for 8.5% (n=7)
of all cancer diagnoses within the MDC (to 30th November 2017), are considered to be hard to detect
and have poor outcomes. It is very encouraging to see early indications that MDCs are well
configured to diagnose hard to detect cancers amongst patients with non-specific symptoms. It is
also positive to note from the updated data (Feb 2018) that these hard to detect cancers continue to
be amongst the most frequently diagnosed cancers (pancreatic cancer (8%) and, more broadly,
haematological cancers with a symptoms range with low predictive value represent 13% of all
cancers). Updated data also indicates that one ovarian cancer has been diagnosed, which often
presents with non-specific symptoms.
The low number of diagnoses for certain cancers (for example, ovarian) may be a reflection of the
relatively small number of MDC diagnoses under consideration, but may also be due to the scarcity of
some cancers. It will be necessary to monitor this situation as the pilots continue, in order to see if the
MDC-based pathway continues to be adept at diagnosing harder to detect cancers amongst patients
with non-specific symptoms, and if any notable omissions should / can be identified.
Non-cancer diagnoses In addition to cancer diagnoses, over half (54%; n=421) of MDC records that included the relevant data
on non-cancer conditions (n=778) showed patients being diagnosed with non-cancer conditions, with
the majority of known diagnoses relating to digestive (39%) and respiratory (10%) systems. As data
quality and completeness continues to improve throughout the remainder of the evaluation, these
figures will likely change.
MDC approaches being evaluated all appear to provide a useful diagnostic framework for clinically
complex patients who are clearly unwell, and for whom appropriate diagnostic decision-making can
be challenging. As noted below, the establishment of such a pathway for these patients may prevent
them from being eventually diagnosed via emergency routes. It is also important to consider that
22 Interim report – MDCs v2.5
some patients presenting with non-specific symptoms will be addressed and triaged appropriately as
a consequence of the pre-MDC filter function, without being referred into the MDC itself.
Furthermore, with reference to the patient, it is arguable that the real value of the MDC lies in its
ability to reach a confirmed diagnosis for the patient, irrespective of whether this relates to cancer
or non-cancer conditions. [15]
It is prudent to consider whether MDC pathways should be configured to address cancer-specific
activity, or whether a broader diagnostic approach is more helpful. This will be considered further as
the evidence-base increases and a more detailed understanding of the impact of the differing
approaches being trialled is obtained.
Reduce time from patient presentation to diagnosis (cancer or other) Patients with non-specific symptoms often experience longer times to diagnosis and, in some
instances, a longer diagnostic interval is required in recognition of the clinical complexity of individual
patients. However, evidence suggests that MDCs are having a positive impact on the time to diagnosis
by providing a rapid referral pathway for patients currently not well served by existing referral
routes.
NCDA analysis of the NSCS patient cohort showed that diagnostic intervals were associated with wide
ranges (1-307 days (all routes)), indicative of substantial variation regarding individual patient
journeys. Direct comparison between NCDA and MDC ranges is not possible due to the size of the
NCDA cohort, the likely variation of cases therein, and the range of referral pathways included.
However, it is worth noting that diagnostic interval data from MDC pilot sites show a fairly narrow
range (0-77 days), suggesting that patients on this pathway are overall being diagnosed within the
same timeframe across MDC pilot sites. It will be important to consider whether diagnostic speed
and consistency are characteristic of the pathway at the end of the evaluation.
As part of the ACE evaluation, pilot sites will also consider the timeliness of MDC-based pathways
against the Faster Diagnosis Standard (FDS), and variation will be monitored. It will be important to
evaluate if this variation is reflective of the differing approaches being developed (for example, the
specificity of the pathway), and if any impact on speed to diagnosis is counterbalanced by other
benefits of that particular approach.
Drive a shift from late to early diagnosis At this point, the majority of staged cancers diagnosed within the MDC have been found at a late stage
(81.8% at stage 3 or 4). However, this is perhaps unsurprising given that many of these cancers will
present when disease is already advanced. When considering that early diagnosis for some of these
cancers may not be possible, it is perhaps more appropriate to consider the MDC pathway in terms
of achieving earlier diagnosis for patients presenting with non-specific symptoms.
It is also reasonable to argue that this position may shift over the course of the evaluation; for
example, as of 28th February 2018, staging data has increased to include 60% of records, with a
subsequent improving impact on rates of early diagnosis. It is also possible that this position will
change as MDCs see a greater number of patients and knowledge of the pathway increases within
local primary care settings. A more detailed breakdown of diagnosis by stage may also be informative,
as it may show movement from stage 4 to 3, which would likely have a positive impact on treatment
options and therefore clinical outcomes.

23 Interim report – MDCs v2.5
NCDA analysis indicates that patients with non-specific symptoms experience significantly longer
times from initial presentation to referral, and on to subsequent diagnosis. Therefore, it is reasonable
to assume that a greater awareness and uptake of an urgent referral pathway for these patients
would support earlier referral of patients, which may impact favourably on earlier diagnosis. Data
as of 28th February 2018 indicates that 53% of patients (based on approximately 2/3 of records)
reported that symptoms had started more than 3 months prior to MDC referral.
The desired shift towards earlier diagnosis may be most helpfully supported by an increased
awareness of the MDC referral pathway within primary care settings, an increased ability to refer at
an earlier stage, and wider work to support timely help-seeking amongst patients with non-specific
symptoms. [11]
Reduce number of diagnoses via emergency presentation Regarding routes to diagnosis, the majority of patients were referred into the MDC from primary care,
which is as expected given the design of the pathways.
NCDA analysis indicates that a high proportion (34%) of patients with non-specific symptoms were
referred into secondary care systems via emergency presentation, then via 2 week wait (SCR) and
routine GP referral. When considering that patients presenting with non-specific symptoms do not
meet current referral thresholds for 2 week wait (SCR) pathways, it is arguable that the introduction
of an urgent referral pathway for non-specific symptoms should have a positive effect on potentially
inappropriate referrals onto urgent pathways.
Although it is not possible at the moment to make any judgements, it will be important to look at any
impact on emergency presentation, 2 week wait (SCR) and GP routine referral following the
introduction of MDC pathways as rates should, theoretically, decrease as a more appropriate pathway
for these patients is adopted. However, considering the small numbers involved in the programme,
any such change will consequently be limited, making an impact assessment difficult to achieve.
Improve overall patient experience Although a full evaluation of the patient experience element of the MDC pilots has yet to be
completed, early analysis shows that patients have responded positively to the MDC approach.
The majority of responding patients (85% compared to 61.2% in CPES, 2016) felt positively about the
effectiveness of people working together to provide the best possible care for patients. As this is a
fundamental aspect of the MDC approach, it suggests that the pilot sites are providing high quality
care that is valued by patients.
Further, more detailed analysis of patient experience will form an important part of the final
programme evaluation.
Future lines of enquiry As the programme continues, it may be possible to examine certain areas in more detail as part of the
ongoing evaluation. It would be helpful to consider further research to establish:
• If a correlation exists between certain non-specific symptoms and their predictive value for
specific cancers, with particular consideration given to weight loss

24 Interim report – MDCs v2.5
• The potential impact of pathway design on cancer conversion rates and diagnostic speed, non-
cancer diagnoses, and the overall impact, if any, on cost-effectiveness and sustainability
• If any judgements can be made regarding the effectiveness of detecting specific types of
cancer (and non-cancer conditions)
• If implementation and adoption of the MDC pathway has resulted in the earlier referral of
patients with non-specific symptoms and if any impact is detectable on stage of diagnosis
• If increasing awareness and uptake of MDC pathways has reduced patient numbers on 2 week
wait (SCR) pathways, routine GP referral, and emergency presentations, and whether it is
possible to compare activity from the beginning and end of the evaluation to assess MDC
impact on surrounding pathways
• If any judgements can be made regarding what tests should be used, and any optimal
sequencing of diagnostics to improve outcomes for patients and their experience of care, and
any potential applications to other cancer referral pathways
• If a demographic assessment of local populations (e.g. size; age; comorbidities; deprivation;
engagement with healthcare) can be helpful in estimating local need [prevalence of non-
specific symptoms] and MDC referral volumes.
Early project learning
In order to provide information and support regarding the development of MDC-based pathways, an
audit was conducted with the 5 project sites in December 2017. The audit focused on the early
experiences of projects regarding the initial planning and development phase, in order to provide
practical early information and support for others considering similar approaches.
Knowledge regarding this subject will be enhanced considerably through the work undertaken by the
Policy Research Unit in conjunction with the MDC pilot sites. This qualitative evaluation, focusing on
a substantial, theory-based analysis of the introduction of MDC-based pathways, will be available from
the PRU at the end of 2018, and will form a core element of the final programme evaluation.
Process Projects reported that the process of setting up a MDC took a considerable amount of time, with an
average of 16 months taken amongst those projects with no prior arrangements in place. All projects
advocated the importance of establishing dedicated project management and administrative roles
from the outset, in order to establish the level of governance and co-ordination required to implement
such complex and multifaceted change. In many cases, projects found it helpful to route their
governance into local cancer improvement boards (for example, the Cancer Vanguard Board in
London, the Leeds Integrated Cancer Services Board in Leeds, and the Greater Manchester Cancer
Board in Greater Manchester), in order to support effective decision-making and delivery.
Having a clear and compelling vision for the MDC was seen as important when attempting to secure
the buy in of senior decision makers, especially due to the lack of available statistical evidence
regarding the potential impact of this new pathway. Clarity regarding project objectives and success
criteria were also seen as invaluable to make sure that activity remained focused. Projects were also
in agreement that, regarding the MDC Lead Clinician, it was more important for them to believe in
and champion the MDC approach than to have any specific clinical specialism.
25 Interim report – MDCs v2.5
All projects indicated that securing required comparator data was challenging, and that it had been
difficult to develop a robust dataset for benchmarking and demonstrating MDC impact. Most areas
have now implemented a retrospective audit of primary care records in order to achieve this, but this
process has been complex and time-consuming, with work to improve data completeness still
ongoing.
As a lack of comparator data may impact on the early development of business cases for MDC
sustainability, projects have advised others to allow plenty of time to address issues relating to data
and information governance, and to start this work as soon as possible. Similarly, early attention has
also been advised for areas relating to clinical job planning, identification of appropriate clinic space
for the MDC, and stakeholder engagement, all of which have been found to take considerable time to
get right.
People Although a range of stakeholders were involved in the planning and development of MDC pathways,
all projects agreed that primary care was critical to the process, both in terms of designing and
developing systems that would be compatible with MDC arrangements, and in ensuring subsequent
pathways were understood and utilised effectively.
Projects had approached this in a number of ways, but all had primary care representation on their
MDC Steering Groups. Greater Manchester also stressed the value of early engagement with CCG
colleagues, which had been extremely helpful in ensuring the development and use of compatible
referral arrangements from the outset. This continued engagement has also been valuable during
conversations relating to the development of sustainable business plans for the future service.
Effective engagement with primary care was reported as being a resource-intensive and continuous
process, and a number of projects were exploring the increased use of local CCG Cancer Leads,
Macmillan GPs and/or Strategic CRUK GPs as a way of effectively communicating with practice
communities. This approach was also found to be helpful in promoting a broader understanding of
cancer services, which supported MDC activity to be placed in context and suitably prioritised.
Projects also reported that 1 to 1 practice visits were the most effective way of raising awareness and
appropriate referral activity, but that other successful approaches included attendance at primary
care events, protected learning time/education days, and the regular use of monthly GP Bulletins.
All projects emphasised the need to actively involve patients in the development and delivery of the
MDC pathway, and were clear about the value of patient voice in these processes. Consequently,
patient representatives sat on project MDC steering groups and advised on a range of issues, or had
been influential via focus groups and interviews. For example, in Leeds, patient representatives fed
into the development of the ACE model and methodology, and also advised on the content of patient
leaflets and the MDC website content. Greater Manchester had also undertaken an additional survey
of patients [to run in conjunction with the ACE patient evaluation], in order to ensure that patient
voice was understood and included in planning and delivery.
Projects also emphasised the importance of early and sustained engagement with a range of other
stakeholders, including A&E, Cancer of Unknown Primary (CUP) and Malignancies of Unknown Origin
(MUO) teams, Cancer MDT leads, Diagnostic Services, Ambulatory Care, Booking and Appointments
teams, and Business Intelligence.
26 Interim report – MDCs v2.5
Pathway Projects had all anticipated a rapid uptake from the point of implementing the MDC but, in many
cases, referral volumes were initially low, with this rate gradually building to capacity as primary care
practices became more aware of the pathway. In order to ensure appropriate (and complete)
referrals, a number of MDCs implemented arrangements to feedback to GPs and advise them on
referral criteria and required information. For example, Leeds introduced a systems alert (on
Integrated Clinical Environment (ICE) software) to prompt the completion of blood tests at point of
referral, whereas London introduced feedback arrangements with GPs to enable discussions regarding
the reasons for inappropriate referral.
The CNS role was considered essential to the success of all MDC pilots, with Greater Manchester
highlighting the successful collaboration between the CNS and the MDC Navigator post in their area.
These roles supported effective collaborative working within the MDC and often provided an essential
level of connectivity across a range of specialist areas and wider community support/services. In all
projects, the CNS assessment formed an essential early part of the MDC approach, with this in-depth
clinical nursing assessment informing decision-making regarding subsequent diagnostic activity. From
a patient perspective, Greater Manchester also indicated that the CNS/Navigator support provided for
patients throughout the diagnostic element of the pathway was highly valued.
Further work was underway to map out MDC integration across wider clinical pathways, but projects
had benefitted from close working with colleagues in MUO and CUP pathways, and from close
partnership working with A&E, Acute Medicine and Ambulatory Care. These partnerships had
consistently been supported by regular information sharing regarding the MDC pathway and by the
establishment of named contacts within these respective areas.
An information leaflet outlining the key learning points from projects has been developed and is
available upon request from [email protected].
Next steps and planned resources
A high level of interest exists in Multidisciplinary Diagnostic Centres, with many areas considering the
development of similar approaches. In order to inform these discussions and use programme learning
to support informed decision making, a range of support materials and resources are planned for the
coming months.
Programme resources will be developed in conjunction with the MDC pilot sites, to ensure that the
materials are centred on direct clinical experience and are therefore applicable to those developing
MDC-based approaches elsewhere in the country.
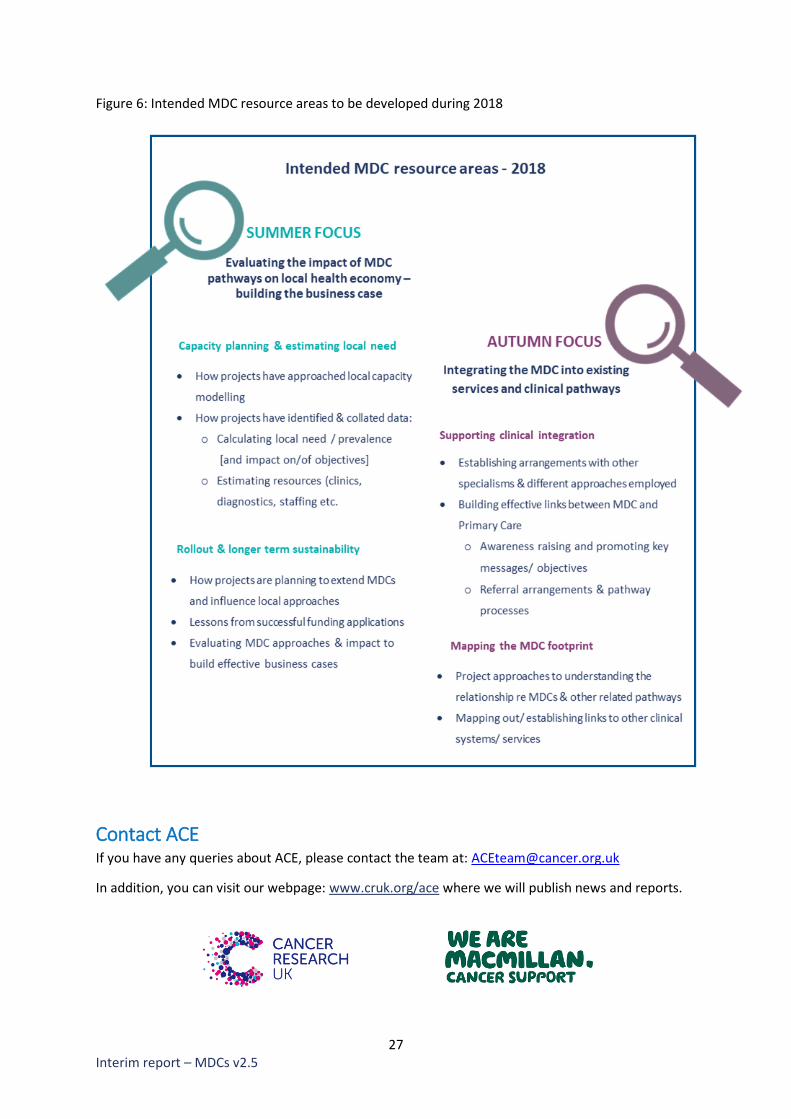
Figure 6 provides an outline of intended resource areas, which will complement existing materials
such as the MDC Design Principles document and the Early Lessons handout, both of which are
available at: www.cruk/ACE.
In addition to these supplementary resources, a full programme evaluation is scheduled for the end
of 2018, which will include quantitative, qualitative and economic analyses from the Department of
Health’s Policy Research Units.
27 Interim report – MDCs v2.5
Figure 6: Intended MDC resource areas to be developed during 2018
Contact ACE If you have any queries about ACE, please contact the team at: [email protected]
In addition, you can visit our webpage: www.cruk.org/ace where we will publish news and reports.
28 Interim report – MDCs v2.5
References
[1] NHS England, “Achieving world-class cancer outcomes: a strategy for England 2015-2020,”
Independent Cancer Taskforce, 2015.
[2] Cancer Research UK, “Survival three times higher when cancer is diagnosed early,,” 10 August
2015. [Online]. Available: http://www.cancerresearchuk.org/about-us/cancer-news/press-
release/2015-08-10-survival-three-times-higher-when-cancer-is-diagnosed-early.
[3] G. Rubin, A. Berendsen, S. M. Crawford , et al., “The expanding role of primary care in cancer
control,” The Lancet Oncology, vol. 16, no. 12, p. 1231–1272, 2015.
[4] National Institute for Health and Care Excellence, “Suspected cancer: recognition and referral,”
2015.
[5] P. Vedsted and F. Olesen, “A differentiated approach to referrals from general practice to
support early cancer diagnosis – the Danish three-legged strategy,” Br J Cancer, p. S65–S69,
2015.
[6] M. L. Ingeman, M. B. Christensen, F. Bro , et al., “The Danish cancer pathway for patients with
serious non-specific symptoms and signs of cancer-a cross-sectional study of patient
characteristics and cancer probability.,” BMC Cancer, vol. 15, p. 421, 2015.
[7] H. Jensen, M. L. Tørring, F. Olesen , et al., “Cancer suspicion in general practice, urgent referral
and time to diagnosis: a population-based GP survey and registry study.,” BMC Cancer, vol. 14,
no. 636, 2014.
[8] National Quality Board, “Improving experiences of care: our shared understanding and
ambition,” 2015.
[9] S. C. Mendonca, G. A. Abel and G. Lyratzopoulos, “Pre-referral GP consultations in patients
subsequently diagnosed with rarer cancers: a study of patient-reported data,” The British
Journal of General Practice, vol. 66, no. 644, pp. e171-81, 2016.
[10] Pancreatic Cancer UK who provide the Secretariat for the All-Party Parliamentary Group on
Pancreatic Cancer, “The Need for Speed: Diagnosing Pancreatic Cancer Earlier, Giving Patients
a Chance of Living Better for Longer,” 2017.
[11] M. M. Koo, W. Hamilton, F. M. Walter , et al., “Symptom Signatures and Diagnostic Timeliness
in Cancer Patients: A Review of Current Evidence,” Neoplasia, vol. 20, no. 2, pp. 165-174, 2018.
[12] National Cancer Registration and Analysis Service, “Routes to diagnosis 2006-2013 workbook,”
2015.
[13] ACE Programme, “Improving diagnostic pathways for patients with vague symptoms, final
report,” 2017.
[14] NHS England, “Next Steps on the NHS Five Year Forward View,” 2017.
[15] A. S. Forster, C. Renzi and G. Lyratzopoulos, “Diagnosing cancer in patients with 'non-alarm'
symptoms: Learning from diagnostic care innovations in Denmark.,” Cancer Epidemiology, vol.
54, pp. 101-103, 2018.
[16] R. D. Neal, P. Tharmanathan, B. France , et al., “Is increased time to diagnosis and treatment in
symptomatic cancer associated with poorer outcomes? Systematic review.,” Br J Cancer, vol.
112, no. Suppl 1, pp. S92-107, 2015.

29 Interim report – MDCs v2.5
Appendix A: High level summary of updated data to 28th February 2018 (2 tables)
up to 28th February 2018 Airedale
Greater Manchester
Leeds
London
Oxford Royal Oldham
Wythenshawe BHRUT North Mid Royal Free
UCLH
Patients
Go-live date 17th Jan
2017 3rd Mar
2017 13th Dec 2016
31st Jan 2017
1st Dec 2016
1st May 2017
1st Jan 2018
1st Apr 2017
15th Mar 2017
Number seen (total) 187 119 187 326 119 103 8 281 293
% referred by GP 90 100 99 84 98 96 100 100 100
Patient age range 22-93 22-89 29-94 18-97 22-92 18-89 48-76 17-91 44-97
Comorbidity
None 52 30 45 individual
comorbidity given no
score
15 36 not given 90 not given
Mild 110 56 58 43 27 not given 28 not given
Moderate 21 18 53 2 22 not given 7 not given
Severe 1 4 9 1 17 not given 1 not given
Not known 3 11 22 59 1 not given 155 not given
Symptoms
Abdominal pain (N) 54 27 14 40 51 24 5 125 94 (atypical
pain)
Weight loss (N) 143 91 130 167 48 67 5 181 176
Nausea (N) 73 61 51 69 44 16 1 31 92
Fatigue (N) 65 63 43 20 24 0 0 3 89
GP gut feeling (N) 82 94 57 65 30 23 0 36 92
% cases with symptom duration of at least 3 months
45 70 54 60 52 54 60 61 45
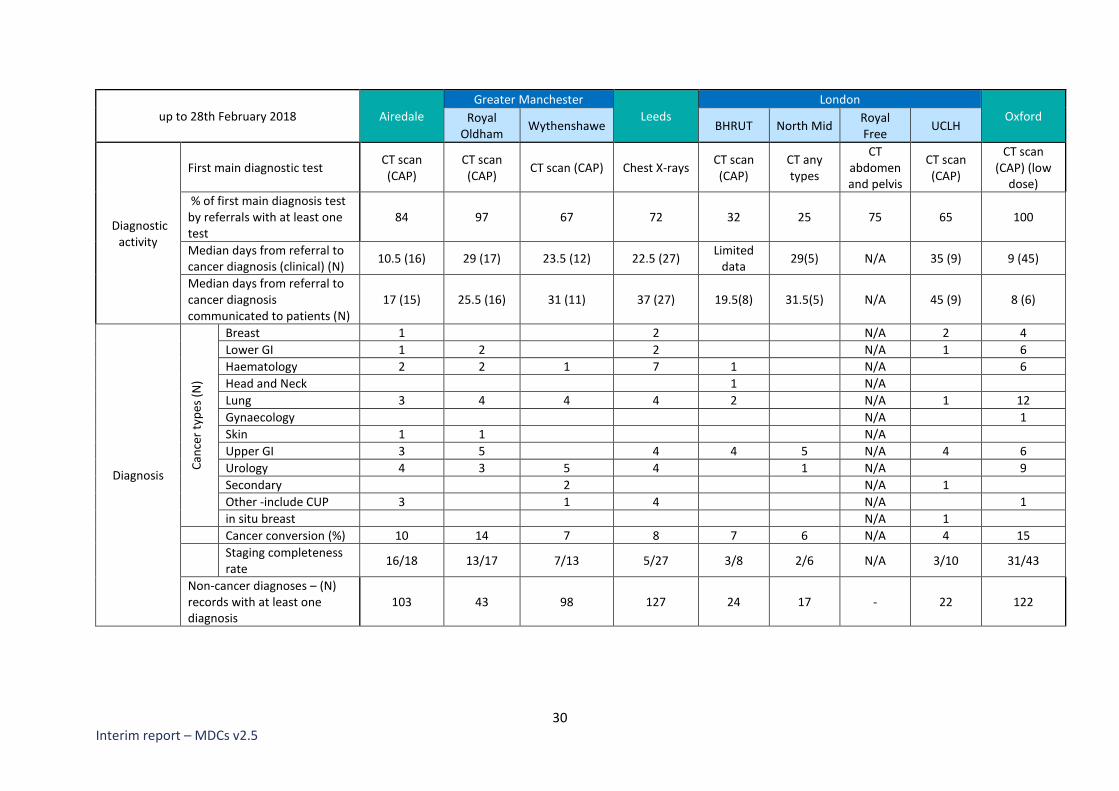
30 Interim report – MDCs v2.5
up to 28th February 2018 Airedale
Greater Manchester
Leeds
London
Oxford Royal Oldham
Wythenshawe BHRUT North Mid Royal Free
UCLH
Diagnostic activity
First main diagnostic test CT scan (CAP)
CT scan (CAP)
CT scan (CAP) Chest X-rays CT scan (CAP)
CT any types
CT abdomen and pelvis
CT scan (CAP)
CT scan (CAP) (low
dose)
% of first main diagnosis test by referrals with at least one test
84 97 67 72 32 25 75 65 100
Median days from referral to cancer diagnosis (clinical) (N)
10.5 (16) 29 (17) 23.5 (12) 22.5 (27) Limited
data 29(5) N/A 35 (9) 9 (45)
Median days from referral to cancer diagnosis communicated to patients (N)
17 (15) 25.5 (16) 31 (11) 37 (27) 19.5(8) 31.5(5) N/A 45 (9) 8 (6)
Diagnosis
Can
cer
typ
es (
N)
Breast 1 2 N/A 2 4
Lower GI 1 2 2 N/A 1 6
Haematology 2 2 1 7 1 N/A 6
Head and Neck 1 N/A
Lung 3 4 4 4 2 N/A 1 12
Gynaecology N/A 1
Skin 1 1 N/A
Upper GI 3 5 4 4 5 N/A 4 6
Urology 4 3 5 4 1 N/A 9
Secondary 2 N/A 1
Other -include CUP 3 1 4 N/A 1
in situ breast N/A 1 Cancer conversion (%) 10 14 7 8 7 6 N/A 4 15
Staging completeness rate
16/18 13/17 7/13 5/27 3/8 2/6 N/A 3/10 31/43
Non-cancer diagnoses – (N) records with at least one diagnosis
103 43 98 127 24 17 - 22 122