Embed Size (px)
Citation preview

European Journal of Science and Theology, April 2013, Vol.9, No.2, 91-106
_______________________________________________________________________
MULTIDISCIPLINARY APPROACH FOR THE
CONSERVATION OF AN ETRUSCAN HYPOGEAN
MONUMENT
Susanna Bracci1, Oana Adriana Cuzman
1*, Amleto Ignesti
2, Rachele
Manganelli Del Fà1, Roberto Olmi
2, Pasquino Pallecchi
3, Cristiano
Riminesi1 and Piero Tiano
1
1ICVBC-CNR - Istituto per la Conservazione e la Valorizzazione dei Beni Culturali,
Via Madonna del Piano 10, 50019 Sesto Fiorentino, Italy 2IFAC-CNR - Istituto di Fisica Applicata ‘Nello Carrara’, Via Madonna del Piano 10,
50019 Sesto Fiorentino, Italy 3SBAT - Soprintendenza per i Beni Archeologici della Toscana, Via della Pergola 65, 50121
Firenze, Italy
(Received 25 June 2012)
Abstract
Tomba della Scimmia is part of the antique religious arts related with the Etruscan
funerary cult. This hypogean monument is located near Chiusi, Italy, eight meters below
the ground level. It is decorated with wall paintings realized with hematite, Egyptian
blue and charcoal black. During time, some conservation problems occurred, such as
wall decohesion, including the painted areas, whitening due to biological development or
salts efflorescences. Microenvironmental conditions, building materials characteristics
and microbial colonization have been investigated in order to determine the factors
inducing deterioration and to propose countermeasures to prevent it. The main objectives
of this work were focused on the application of modern technologies and innovative
devices for investigating the state of conservation and to control surface and
environmental conditions present in this hypogean environment. Data logger and
portable measurement devices have been used for monitoring the microclimate of the
tomb. A micro-photogrammetric system has been employed for the analysis of the
surface patterns, beside the colour change measurements and investigations of pigments
by means of non-invasive fibre optic reflectance spectroscopy (FORS) in the visible
range. Furthermore, microsamples have been collected for microscopic observations or
for examine the biodeteriogens dwelling in this location. An innovative control method
based on microwave heating, was tested against white microbiological spots present in
this tomb. The advantages of the proposed techniques and their prospects to be used for
similar conservation situations are discussed in this paper.
Keywords: hypogean monument, microclimate, microwave heating, micro-
photogrammetry, VIS reflectance spectroscopy
* E-mail: [email protected], tel.: +390555225473, fax: +390555225403

Bracci et al/European Journal of Science and Theology 9 (2013), 2, 91-106
92
1. Introduction
The Tomb of the Monkey (Tomba della Scimmia, 480-470 b.C), is one of
the most important visitable Etruscan tombs of the Poggio Renzo Necropolis [1,
2]. This tomb, discovered in 1846 by Alexandre François, is located in Tuscany,
4 km near Chiusi. It has a cross shape, with three rooms around the atrium
(Figure 1a), and was realized into a lithological complex made by Pliocene sands
(quartz, feldspars and lesser calcite amount) with clay cement, 8 m below the
ground level. Its name comes from a polychrome painting in the atrium, which
depicts a monkey on a tree. Some murals inside this tomb feature old Etruscan
sports [3] such as wrestling and boxing (Figure1b and c). The paintings, realized
with hematite, Egyptian blue and charcoal black, were made on a thin clay layer
[4].
(a)
(b)
(c)
Figure 1. Schematic map of the Tomba della Scimmia in the Etruscan necropolis of
Chiusi (a) and details of mural paintings (b, c)
As many other Etruscan and Roman tombs, this hypogean monument is
included in a tourism net that brings thousands of visitors per year. Areas
receiving visits are exposed to temporarily microclimatic modifications due to
the presence of the people for short periods of time, and correlated disturbances

Multidisciplinary approach for the conservation of an Etruscan hypogean monument
93
of the usual steady state climate (i.e., switch on/off of the lights, ventilation,
openings of the door), which may introduce risk factors for the conservation of
mural paintings, with possible development of microbiological growth and
transportation of new microorganisms from other sites [5]. Beside this,
hypogean environments often suffer from characteristic and specific damages
such as infiltrations of ground waters and salts with high level of humidity and
condensation phenomena. Such phenomena were observed in the case of Tomba
della Scimmia as well, where the presence of microbiological growth and
superficial decohesion of the walls with painting losses.
This study aimed to characterize the tomb features and conditions,
proposing innovative diagnostic tools and treatment techniques for its
conservation. Microenvironmental conditions, building materials, and microbial
colonization have been investigated in order to determine the factors inducing
deterioration and to propose countermeasures to prevent deterioration. Specific
devices have been used for monitoring the microclimate of the tomb. A micro-
photogrammetric system [6], a non invasive FORS analyses and color
measurements have been employed for studying painted surfaces, and
microsamples have been collected for the study of biodeteriogens dwelling in
this location. The microwave heating method was tested to control a biological
spot present in the tomb.
3. Experimental
2.1. Monitoring microclimate
The tomb is visited by many tourists during the summer period. The
visitors are organized in four small groups of 6 persons each within one day, two
groups in the morning and the other 12 persons in the evening. The access to
visitors inside the tomb was Tuesday, Friday and Saturday, when the
microclimatic measurements were performed. Now, the tomb can be visited on
Tuesday, Thursday and Saturday. Temperature and relative humidity variations
were monitored using specific sensors (LSI-Lastem s.r.l.) (Figure 2). The
characteristics for the temperature transducer range is between -40°C and 60°C,
with a precision of +/- 0.1°C. The characteristics for the relative humidity
transducer range is between 0% and 100%, with a precision of +/- 0.8% (0%-
90%) and +/- 1.5% (RH<10% and RH>90%). They were placed in different
areas of the tomb (entrance, stairs near entrance, atrium, room on the right, room
on the left and central room). The measuring points are depicted in Figure 1a.
2.2. Surface Pattern Analysis
Four areas (Figure 3a) of the first chamber of the Tomba della Scimmia
have been selected for monitoring possible changes induced by microclimate
variation on the painted surface, using a digital microphotogrametric system
(Figure 3b) [7].

Bracci et al/European Journal of Science and Theology 9 (2013), 2, 91-106
94
Figure 2. Climatic station for controlling temperature and relative humidity, placed in
the atrium of the Tomba della Scimmia.
(a)
(b)
Figure 3. The four selected areas: (a) inside the tomb for analyzing the surface changes
in time by the micro-photogrammetry system (b)
Each area is reconstructed by creating a mosaic of many image acquisition
areas (40x40mm). The system is composed of a digital camera Canon EOS
400D (10M pixel) equipped with Canon EFS 60mm macro lens, which runs on
an automated bar. A dedicated software (Zscan Micro®) automatically estimates
the distance between the area of interest and camera sensor, indicating the best
step for capturing the images. Using the same software, three shot of the selected
surface are acquired and the 3D model is generated. Once the acquisition and 3D
model reconstruction have been done, is possible to generate the Digital
Elevation Model (DEM), a representation of the quotes of the surface, choosing
a suitable reference plane (UCS). A dedicated software allows to extract some
dimensional information on the surface pattern such as roughness or quote of
particular areas (maximum and minimum values of elevation). DEM is the
digital representation of the surface pattern respect to the selected UCS. The
Surface Pattern Analysis (SPA) was made confronting two different campaigns -
at time zero (T0) and after 8 months (T1). Specific differences DEM were
1 4
3
2

Multidisciplinary approach for the conservation of an Etruscan hypogean monument
95
therefore generated for each investigated area, using ZMap® software, by
overlapping the data obtained by SPA at T0 and T1.
(a)
(b)
Figure 4. Color measurement of one selected area: (a) using the masks held in place
by hand, and (b) a detail of the head of the colorimeter in the acquisition phase.
Figure 5. FORS measurement area.
2.3. Colour measurement
The colorimetric measurements were made using a portable colorimeter
(Minolta Chroma Meter CR-200). Three zones were selected and a mask (size
30 cm x 21cm, holes 1.5 cm x 1.5 cm) made of acetate was used (Figure 4) for
each one, indicating reference points (outline drawings, lines of demarcation) as
well in order to be able to repositioning the mask in the subsequent field surveys.
On the mask, each hole corresponding to a measuring area, was then identified
by a progressive number (1-20) and each mask was identified by a code (M) and
a number (1-3). To calculate the colour parameters was adopted the colour space
CIEL*a*b* 1976 [CIELAB 1976, Commission Internationale de l’Eclairage] in
which the colour of a surface is described by three parameters: L* (0 to 100) that

Bracci et al/European Journal of Science and Theology 9 (2013), 2, 91-106
96
represents the lightness, a* which is in relation to the stimulus colour red-green
and b* which is related to the stimulus colour yellow-blue [EN15886 –
Conservation of Cultural Property – Test Method – Colour Measurements of
Surfaces, 2010].
The total change in colour ΔE * is calculated according to equation (1) for
each point of measurement:
2*2*2* )b()a()L(ΔE* (1)
where ΔL* = (L1-L2), Δa* = (a1-a2), Δb* = (b1-b2).
For each area the measurements were repeated 2 times. This makes it
possible to assess the error introduced by the repositioning of the measuring
head, this parameter being important in the case where the colour measurements
obtained on the surface has to be repeated after time as monitoring test. In this
way the colour changes above the threshold defined error can be attributed to
real changes and not to the measurement procedure. The measurement was made
using diffused illumination (D65 standard source), and the measured area has a
diameter of 8 mm. The monitoring campaigns were conducted on May 6th and
October 4th, 2010.
2.4. Fibre optic reflectance spectroscopy (FORS)
The spectra were acquired using a tungsten lamp as source, and a
spectrometer Ocean Optics (model USB2000) equipped with optical fibers as a
detector. The measuring head, in the configuration with a 2x45° illumination and
signal collection 0°, allows the acquisition of the reflectance spectrum of an area
of about 2 mm2. Each acquired spectrum is the average of 30 scans. As reference
a plate of Spectralon® was used. The chosen area is located on the wall opposite
the entrance on the left side at the figures of the wrestlers (Figure 5).
(a)
(b)
(c)
Fig. 6. Set-up of the microwave treatment (a) with details of microwave applicator (b)
and the head of applicator with the soft wet sponge (d)
2.5. Biodeterioration
Several biological samples have been collected from painted walls of
Tomba della Scimmia using common adhesive tape and sterile swabs, and
observed under microscope. A mix of two fluorescent dyes (Plant Cell Viability
Multidisciplinary approach for the conservation of an Etruscan hypogean monument
97
Kit, Sigma Co.) has been tested for controlling the microwave treatment
efficiency. The staining mix was prepared according to the provided protocol.
Fluoresceine stains the viable cells, while the big molecule of propidium iodide
dye is able to penetrate only into dead cells. The fluorescence of the samples was
observed using the Nikon Eclipse 600 microscope equipped with filter cubes
FITC (Ex. 465-495 nm, DM 505 nm, BA 515-535 nm) and UV-2A (Ex. 330-380
nm, DM 400 nm, BA 420 nm), respectively, and the images were collected with
a Nikon DXM1200F digital CCD camera.
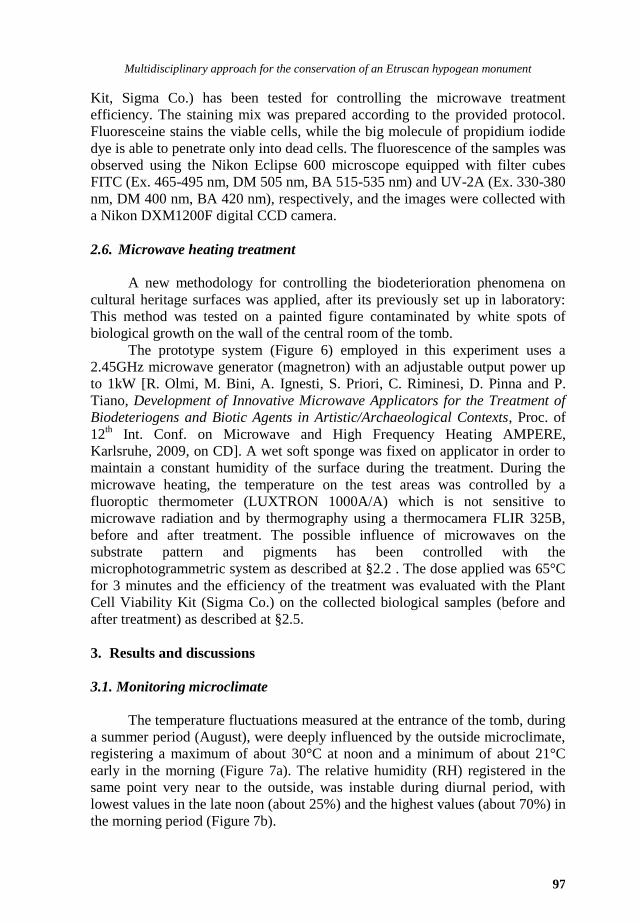
2.6. Microwave heating treatment
A new methodology for controlling the biodeterioration phenomena on
cultural heritage surfaces was applied, after its previously set up in laboratory:
This method was tested on a painted figure contaminated by white spots of
biological growth on the wall of the central room of the tomb.
The prototype system (Figure 6) employed in this experiment uses a
2.45GHz microwave generator (magnetron) with an adjustable output power up
to 1kW [R. Olmi, M. Bini, A. Ignesti, S. Priori, C. Riminesi, D. Pinna and P.
Tiano, Development of Innovative Microwave Applicators for the Treatment of
Biodeteriogens and Biotic Agents in Artistic/Archaeological Contexts, Proc. of
12th Int. Conf. on Microwave and High Frequency Heating AMPERE,
Karlsruhe, 2009, on CD]. A wet soft sponge was fixed on applicator in order to
maintain a constant humidity of the surface during the treatment. During the
microwave heating, the temperature on the test areas was controlled by a
fluoroptic thermometer (LUXTRON 1000A/A) which is not sensitive to
microwave radiation and by thermography using a thermocamera FLIR 325B,
before and after treatment. The possible influence of microwaves on the
substrate pattern and pigments has been controlled with the
microphotogrammetric system as described at §2.2 . The dose applied was 65°C
for 3 minutes and the efficiency of the treatment was evaluated with the Plant
Cell Viability Kit (Sigma Co.) on the collected biological samples (before and
after treatment) as described at §2.5.
3. Results and discussions
3.1. Monitoring microclimate
The temperature fluctuations measured at the entrance of the tomb, during
a summer period (August), were deeply influenced by the outside microclimate,
registering a maximum of about 30°C at noon and a minimum of about 21°C
early in the morning (Figure 7a). The relative humidity (RH) registered in the
same point very near to the outside, was instable during diurnal period, with
lowest values in the late noon (about 25%) and the highest values (about 70%) in
the morning period (Figure 7b).
Bracci et al/European Journal of Science and Theology 9 (2013), 2, 91-106
98
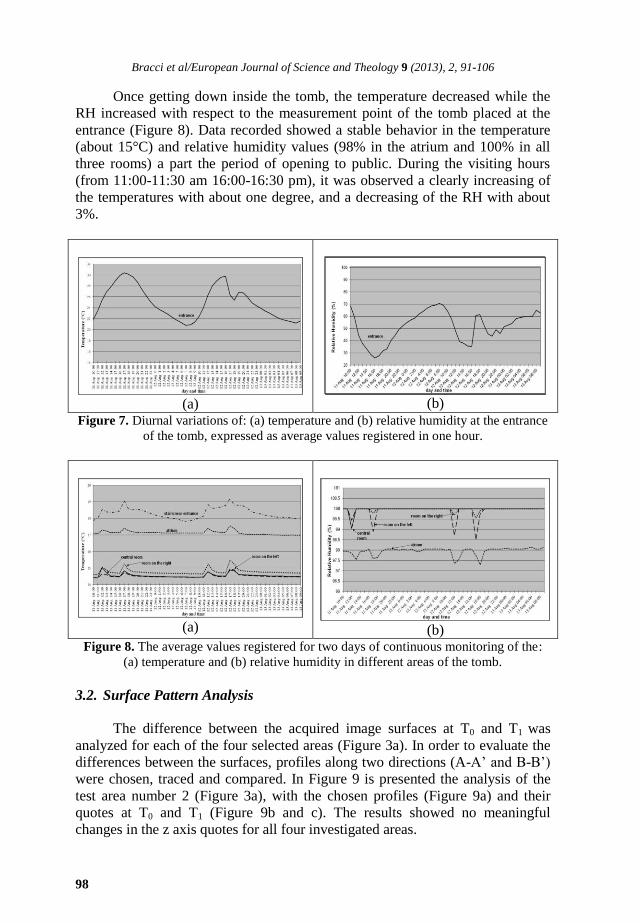
Once getting down inside the tomb, the temperature decreased while the
RH increased with respect to the measurement point of the tomb placed at the
entrance (Figure 8). Data recorded showed a stable behavior in the temperature
(about 15°C) and relative humidity values (98% in the atrium and 100% in all
three rooms) a part the period of opening to public. During the visiting hours
(from 11:00-11:30 am 16:00-16:30 pm), it was observed a clearly increasing of
the temperatures with about one degree, and a decreasing of the RH with about
3%.
(a)
(b)
Figure 7. Diurnal variations of: (a) temperature and (b) relative humidity at the entrance
of the tomb, expressed as average values registered in one hour.
(a)
(b)
Figure 8. The average values registered for two days of continuous monitoring of the:
(a) temperature and (b) relative humidity in different areas of the tomb.
3.2. Surface Pattern Analysis
The difference between the acquired image surfaces at T0 and T1 was
analyzed for each of the four selected areas (Figure 3a). In order to evaluate the
differences between the surfaces, profiles along two directions (A-A’ and B-B’)
were chosen, traced and compared. In Figure 9 is presented the analysis of the
test area number 2 (Figure 3a), with the chosen profiles (Figure 9a) and their
quotes at T0 and T1 (Figure 9b and c). The results showed no meaningful
changes in the z axis quotes for all four investigated areas.

Multidisciplinary approach for the conservation of an Etruscan hypogean monument
99
(a)
-8000
-7000
-6000
-5000
-4000
-3000
-2000
-1000
0
0 5000 10000 15000 20000 25000 30000
A_A' Tempo zero
A_A' Tempo uno
(b)
-7000
-6000
-5000
-4000
-3000
-2000
-1000
0
1000
-50000 -40000 -30000 -20000 -10000 0 10000 20000 30000 40000
B_B' Tempo zero
B_B' Tempo uno
(c)
Figure 9. Evaluating the possible surface changes by tracing surface profiles (a) and by
comparing their Z profiles along the chosen A-A’(b) and B-B’ (c) directions, where T0
(blue line) show the data acquired at time zero, and T1 (red line) the one acquired after 8
months.
3.3. Colour measurements
For all measured areas colour variations of the surface after 5 months are
quite low considering the repositioning of the mask. In all cases (except for the
point M3-18) the E values are below 3 which is considered the limit for the
4

Bracci et al/European Journal of Science and Theology 9 (2013), 2, 91-106
100
naked eye and within the variability of the measure confirming the stability of
the painted surface (Table 1). In the case of zone 1 (M1 mask) E values (Table
1) are less than 1 with the exception of three points where the difference is
between 1 and 1.5. In the case of zone 2 (M2 mask) the main differences are
found in the two areas (M2-11, M2-12) that include both the red paint and the
beige background. In the case of zone 3 (M3 mask) the highest values are found
on M3-15 and M3-18 areas, those that during the first campaign had proved
critical for the repositioning of the measuring head.
Therefore the observed variations are within the variability of the measure
and are not due to physical or chemical changes of the surfaces. Anyway, the
average value of colour change due to repositioning between two measures is
quite low (0.77) except for some areas where the variation between the two
measures is substantially higher (> 3, e.g. M3-15 and M3-18). This variation is
due to the extreme unevenness of the surface and then small differences in
positioning reflected in large differences in the measures. These areas must be
evaluated with particular consideration for the analysis of monitoring data.
Table 1. Values of total colour variation ΔE in all twenty points of measurements (PM)
established for each mask (M1, M2 and M3).
ΔE
ΔE
M1 M2 M3 M1 M2 M3
01 0.33 0.49 1.60 11 0.75 1.28 0.64
02 0.76 0.64 0.60 12 0.50 1.43 0.58
03 0.61 0.13 0.97 13 0.92 0.97 0.40
04 0.27 0.30 0.34 14 0.72 0.80 1.52
05 0.67 1.03 2.08 15 0.68 0.55 2.33
06 0.73 0.23 0.98 16 0.57 0.51 0.96
07 1.43 0.85 0.31 17 0.59 0.42 0.56
08 0.33 1.32 0.84 18 1.12 0.68 3.62
09 0.44 0.24 2.45 19 0.70 0.50 0.97
10 1.22 0.79 1.18 20 0.33 0.56 1.15
Table 2. FORS spectra and description of the analyzed areas
Area
(FORS spectra measured points) Results
Red wrestler (TS01, TS02, TS03) Iron-based pigment based (Red Ochre)
Red horse (TS04, TS05, TS06) Iron-based pigment (Red Ochre)
Dark red horse
(TS07, TS08, TS09)
Iron-based pigment (Red Ochre) - very similar
to TS01÷TS03
Blu monkey, very fragmented
(TS10, TS11, TS12)
Very similar to TS16÷TS18,
being not uniform it is not possible a univocal
identification
Black, below monkey
(TS13, TS14, TS15)
Spectral response very low due to dark
pigment, no identification
Beige background
(TS16, TS17, TS18) Traces of iron-based materials
Multidisciplinary approach for the conservation of an Etruscan hypogean monument
101
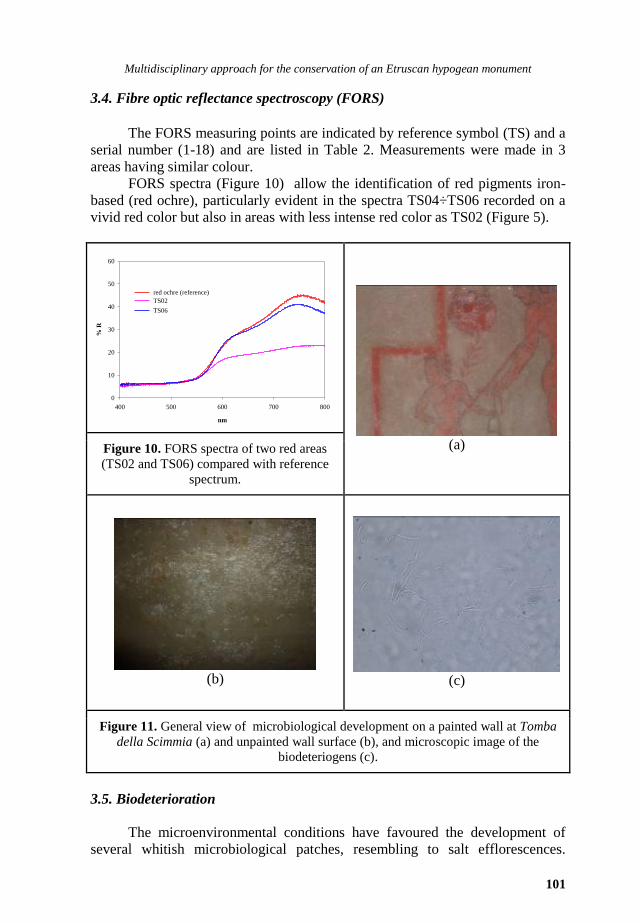
3.4. Fibre optic reflectance spectroscopy (FORS)
The FORS measuring points are indicated by reference symbol (TS) and a
serial number (1-18) and are listed in Table 2. Measurements were made in 3
areas having similar colour.
FORS spectra (Figure 10) allow the identification of red pigments iron-
based (red ochre), particularly evident in the spectra TS04÷TS06 recorded on a
vivid red color but also in areas with less intense red color as TS02 (Figure 5).
nm
400 500 600 700 800
% R
0
10
20
30
40
50
60
red ochre (reference)
TS02
TS06
(a) Figure 10. FORS spectra of two red areas
(TS02 and TS06) compared with reference
spectrum.
(b)
(c)
Figure 11. General view of microbiological development on a painted wall at Tomba
della Scimmia (a) and unpainted wall surface (b), and microscopic image of the
biodeteriogens (c).
3.5. Biodeterioration
The microenvironmental conditions have favoured the development of
several whitish microbiological patches, resembling to salt efflorescences.
Bracci et al/European Journal of Science and Theology 9 (2013), 2, 91-106
102
Microbial colonization was observed in many areas, both on painted (Figure
11a) and unpainted wall surfaces (Figure 11b). Biological investigation revealed
the presence of bacteria (Figure 11c) belonging to Actinobacteria and Firmicutes
groups such as Rhodococcus sp., Streptomyces spp., Bacillus spp., Paenibacillus
sp. (identified by Saiz Jimenez within the bilateral project CNR-CSIC).
3.6. Microwave heating treatment
3.6.1. Temperature control of the treated wall surfaces
The heating variation on the areas treated with microwaves was evaluated
by thermal analysis, while the possible induced effects were evaluated both
macroscopically and by the micro-photogrammetry. In laboratory experiments
several tests on fungal contaminated mortar samples using different dose that
raging in temperature from 60°C to 70°C and in treatment time from 1 minute to
6 minutes were performed. The most effective killing dose without over
stressing the support has been determined in 65°C for 3 minutes. This dose was
applied on a preliminary testing area without paintings checking the temperature
variation before and after the microwave heating (data not shown). Thermal
investigations showed that the wall completely reverted to the initial temperature
after 2 hours (Figure 12a). The same procedure and dose were applied on the
selected painted area as well. The thermographs immediately after the
microwave treatment are shown in Figures 12b and c.
3.6.2. Control of microwaves efficacy against biodeteriogens
Only one microwave treatment was applied on the painted area where
whitish microbiological spot was present (Figure 6a). The mix of fluoresceine
diacetate and propidium iodide fluorescent dyes was directly used on adhesive
tape containing the samples of biodeteriogens. The results showed different
fluorescence of the treated microorganisms with respect to the untreated ones
(Figure 13). The untreated biological sample showed only green fluorescence
due to the fluoresceine diacetate which stains only the live cells. By contrast, the
biological samples collected after the microwave heating treatment showed only
red fluorescence in the UV channel and no green fluorescence (Figure 13). This
is due to the penetration of the propidium iodide inside dead cells.
3.6.3. Surface pattern of the treated wall surfaces
The SPA of the test area (Figure 14a) before/after microwave treatment
and after microbiological sampling, was performed by micro-photogrammetry.
This test area is part of the painting showed in Figure 3b. The comparison
between Z profiles along AA’ and BB’ direction showed no significant surface
changes after the microwave treatment (Figures 14b and c).

Multidisciplinary approach for the conservation of an Etruscan hypogean monument
103
0 50 100 150 200 250 300
1015
2025
posizione (scala arbitraria)
Tem
pera
tura
dopo 13 minuti
dopo 64 minuti
dopo 110 minuti
(a)
(b)
(c)
Figure 12. Temperature variation on the unpainted tomb wall after 13, 64 and 110
minutes from microwave treatment remotion (a) and thermographs of the painted area
treated by microwave heating method after: (b) 10 seconds and (c) 26 minutes after the
applicator removal.
(a)
(b)
(c)
(d)
(e)
(f)
Figure 13. Vitality assessment of microorganisms sampled: (a) before and (d) after the
microwave heating treatment, observed in: (a, d) transmitted light, (b, e) UV light and
(c, f) green light, using a 40x objective.

Bracci et al/European Journal of Science and Theology 9 (2013), 2, 91-106
104
(a)
(b)
(c)
Figure 14. Detail of the painted area chosen for the microwave treatment test (a) with
two chosen Z profiles along the A-A’ (b) and B-B’ axes (c), before (blue line) and after
the microwave treatment (red line). Dashed rectangle represents the area chosen for
generating a DEM.
(a)
(b)
Figure 15. DEM of the chosen area: (a) before and (b) after the microwave treatment.
Units scale are mm.
It was also generated a DEM (Figure 15) of the two shots in order to
observe the possible changes on the selected area and not only along the chosen
profiles. It was obtained a map of Z-differences which showed no significant
changes of the superficial pattern.

Multidisciplinary approach for the conservation of an Etruscan hypogean monument
105
4. Conclusions
The causes of the hypogean monuments degradation are related to
physical-chemical and biological processes. Variation of the environmental
parameters, such as temperature, humidity, CO2 concentration and the dew point
temperature, can accelerate the rate of alterations. For example, the variations of
humidity, when high, imply the succession of precipitation and successive
solubility of salts inducing the formation of white efflorescence and weakening
of the external layer of the stone wall, with possible loss of painted areas. It is
therefore required, when some alteration processes occur, to clearly assessed the
main cause and to chose the best solution for the conservation, employing
affordable devices for acquiring data. In our experience, the main conservation
procedures for the hypogean monuments are generally related to monitoring and
controlling the microenvironmental parameters.
The Etruscan tomb, Tomba della Scimmia was one ideal place for testing
a great variety of innovative non-invasive and affordable techniques aimed to
easily diagnose and solve possible conservation problems. The diagnostic
technique – micro-photogrammetry, FORS, color measurements and micro-
sampling – have been used to evaluate the state of conservation of mural
paintings and the cohesion of the tomb wall, and to assess the possible alteration
processes. To control the biodegradation attack the microwave system has been
tentatively used on a white spotted area. The effectiveness of this method on
micro-bacteria has been assessed by the vital fluorescent kit (fluoresceine
diacetate and propidium iodide) on the samples collected before and after the
treatment.
Acknowledgements
This work was made within the frame of bilateral project ‘Technology
and Biotechnology for the Conservation of Hypogean Cultural Heritage’
between CNR (Italy) and CSIC (Spain), 2009-2010.
References
[1] S. Steingraber, Etruscan Studies: Journal of Etruscan Foundation, 2 (1995) 1.
[2] R. Bianchi Bandinelli, Clusium, I, le pitture delle tombe arcaiche, in Monumenti
della pittura antica scoperti in Italia: La pittura Etrusca, Istituto poligrafico dello
Stato, Roma, 1939, 1.
[3] K.B. Vellucci, Expedition, 27 (1985) 2.
[4] M.P. Colombini, G. Giachi, P. Pallechi and E. Ribechini, Tecniche pittoriche
utilizzate nelle tombe etrusche di Chiusi e Sarteano, in Pittura etrusca. Problemi e
Prospettive, A. Minetti (ed.), Musei Senesi, Siena, 2003, 162.
[5] P. Albertano, C. Urzì and G. Caneva, Tombs, catacombs, and other hypogean
environments, in Plant biology for cultural heritage, G. Caneva, M. P. Nugari & O.
Salvadori (eds.), The Getty Conservation Institute, Los Angeles, 2008, 183.

Bracci et al/European Journal of Science and Theology 9 (2013), 2, 91-106
106
[6] P. Tiano, D. Tapete, M. Matteini and F. Ceccaroni, The Micro-photogrammetry: a
new diagnostic tool for on site monitoring of monumental surfaces, Proc. of the Int.
Workshop SMW08, P. Tiano, C. Pardini (eds), ICVBC-CNR, Florence, 2008, 97-
106.
[7] P. Tiano, P. Salvo and F. Ceccaroni, The Micro-photogrammetry as a Portable
Diagnostic Tool for Monumental Surface Monitoring, Proc. of the DGaO/SIOF
Joint Meeting, Deutsche Gesellschaft für angewandte Optik e.V., Brescia, 2009,
85-89.
.