Embed Size (px)
Citation preview

Multidimensional Poverty in China: Findings Based on CHNS
Jiantuo Yu China Development Research FoundationSeptember, 2012

Contents Why Multidimensional Perspective Alkire-Foster Approach Data, Indicators, and Cut-offs Results and Findings Conclusions and Suggestions

1. Why Multidimensional Perspective
Income is important for achieving human well-being, but is only a insufficient indicator for measuring human well-being Income is a means instead of end There always are higher errors of inclusion and exclusion between those who are
income poor and those who are capability poor
Poverty, in its nature, is a multidimensional phenomenon Basic needs approach Entitlement approach Capability approach

Economic miracle of China since 1978 Average annual economic growth rate: close to 10% Global second largest economy Headcount ratio of income poverty decreased from 84% in 1981
to 7% in 2007 (World Bank, 2007)
What questions do we want to answer by applying multidimensional approach? How many people who are multidimensionally poor? What is breadth of the poverty? Where do the poor concentrate? Which dimension is most seriously deprived ?
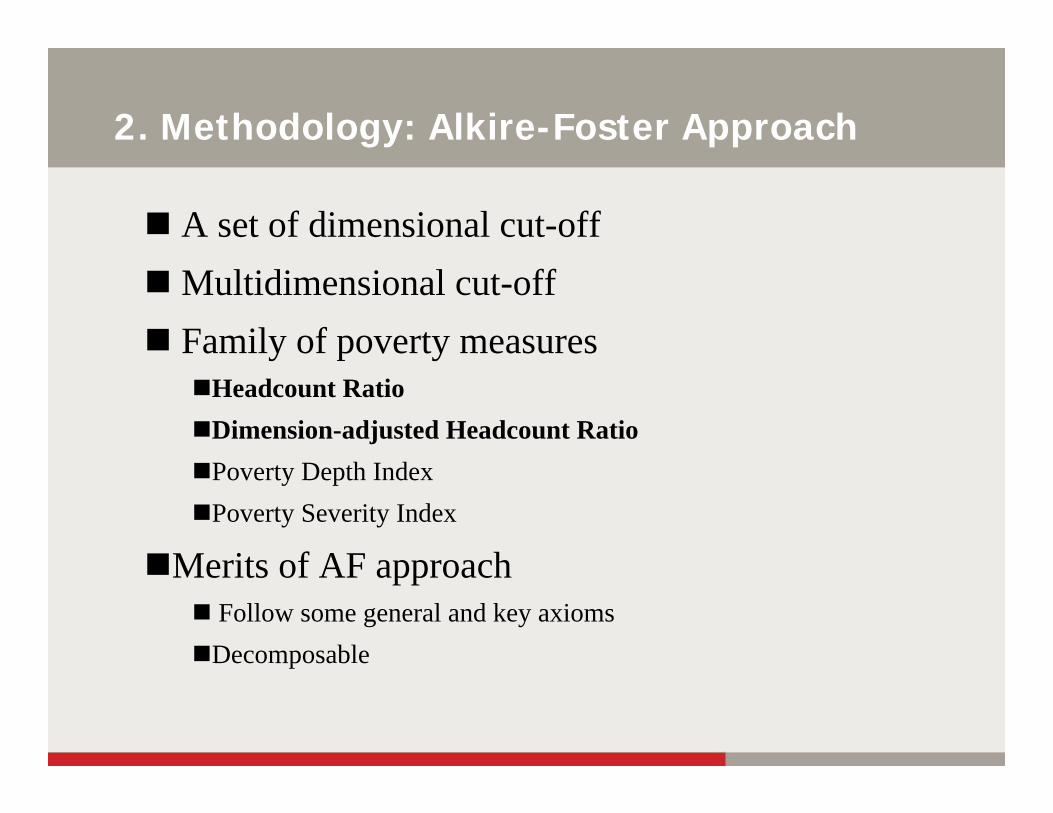
2. Methodology: Alkire-Foster Approach
A set of dimensional cut-offMultidimensional cut-off Family of poverty measures
Headcount Ratio Dimension-adjusted Headcount RatioPoverty Depth IndexPoverty Severity Index
Merits of AF approach Follow some general and key axiomsDecomposable

3. Data, Indicators, and Cut-offs
China Health and Nutrition Survey, by North Carolina University at Chapel and Chinese Center for Disease Control and Prevention
Five dimensions Income EducationHealth Social Security Living Standard

Dimensional cut-offs
No any household member has access to any kind of medical insuranceMedical InsuranceSocialSecurity
None of household member has completed the primary education Completion of Primary School
Education
At least one adult member of the household with BMI less than 18.5 kg/m2Body Mass Index (BMI)
Health
Using wood, stick/straw, charcoal, etc. as main fuels for cookingAccess to Improved Cooking Fuel
Not using electricity as a main energy source for lightingAccess to Electricity
No access to toilet facilities, no access to private restroom, or using open earth pit as toilet
Access to Improved Sanitation Facilities
No access to tap water in-house or in-yardAccess to Clean Water
Living Standard
Per capita income of the household less than CNY 2300 in rural areas and less than CNY 3014 in urban areas, at 2010 constant prices, adjusted according to prices in different waves and regions.
Per capita income of household
Income
Deprivation Cut-offs (The household is deprived if) IndicatorsDimensions

Spearman Correlation Coefficient between Selected Indicators (2009)
1Fuel
0.007(0.625)
1Electricity
0.102**(0.000)
0.020(0.191)
1Sanitation
0.212**(0.000)
0.024(0.121)
0.219**(0.000)
1Water
-0.005(0.751)
-0.012(0.445)
0.038*(0.012)
-0.010(0.517)
1Security
0.025(0.094)
-0.01(0.528)
-0.002(0.875)
-0.005(0.759)
0.014(0.344)
1Health
.077**(0.000)
-0.009(0.548)
.096**(0.000)
0.029(0.061)
0.110**(0.000)
0.005(0.731)
1Education
-0.086**(0.000)
-0.009(0.554)
-0.176**(0.000)
-0.144**(0.000)
-0.101**(0.000)
-0.044**(0.004)
-0.160**(0.000)
1Income pc
FuelElectricitySanitationWaterSecurityHealthEducationIncome pc
Note: The valid number of sample household is 4319. Significance of coefficients reflected in parenthesis**. Correlation is significant at the 0.01 level (2-tailed).*. Correlation is significant at the 0.05 level (2-tailed).
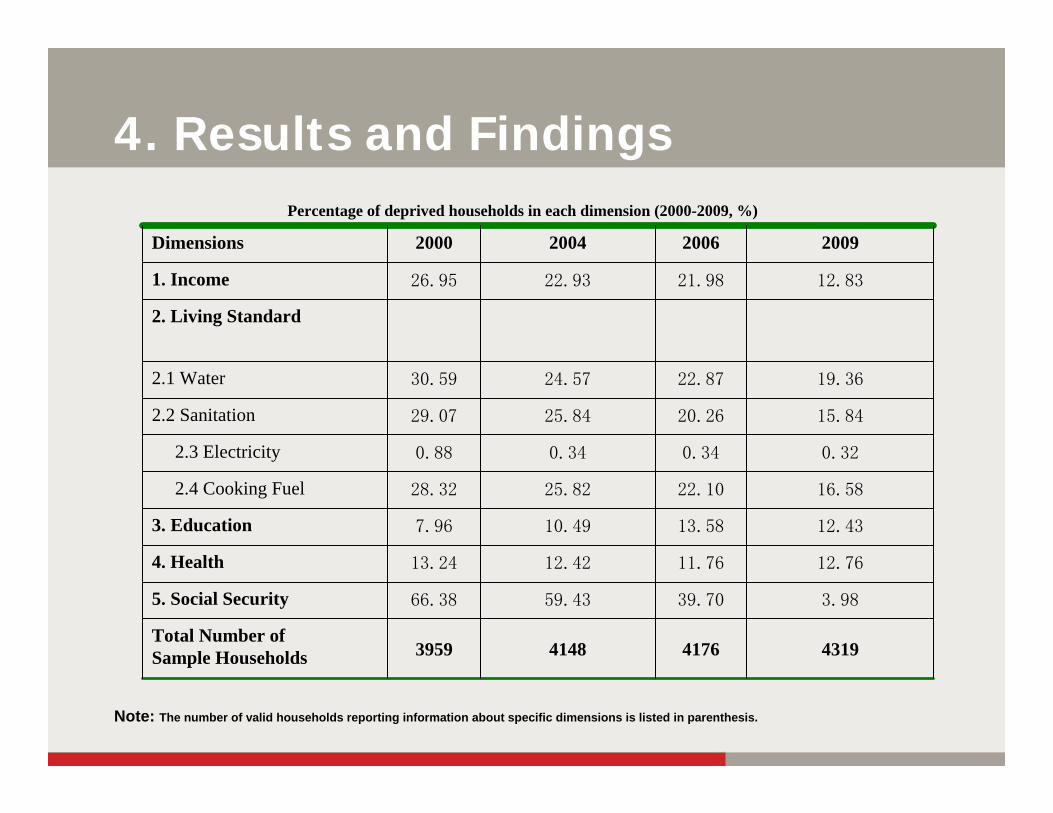
4. Results and FindingsPercentage of deprived households in each dimension (2000-2009, %)
4319417641483959Total Number of Sample Households
3.9839.7059.4366.385. Social Security
12.7611.7612.4213.244. Health
12.4313.5810.497.963. Education
16.5822.1025.8228.322.4 Cooking Fuel
0.320.340.340.882.3 Electricity
15.8420.2625.8429.072.2 Sanitation
19.3622.8724.5730.592.1 Water
2. Living Standard
12.8321.9822.9326.951. Income
2009200620042000Dimensions
Note: The number of valid households reporting information about specific dimensions is listed in parenthesis.

Distribution of the Number of Deprivation Dimensions
4319 4176 4148 3959 Valid Sample
0%0%0.02%0.05%5
0.05%0.55%0.65%0.76%[4-5)
0.95%4.96%5.67%6.11%[3-4)
5.95%17.41%23.02%25.92%[2-3)
27.11%35.23%39.59%41.42%[1-2)
22.57%15.11%9.59%7.73%(0-1)
43.37%26.75%21.46%18.01%0
Percentage of the Poor in
2009
Percentage of the Poor in
2006
Percentage of the Poor in 2004
Percentage of the Poor in 2000
Weighted Number of Deprivation
Dimensions (c)

Change of H0 and M0 During the Survey Period
0%5%10%15%20%25%30%35%40%45%50%
Jiangs
uShan
dong
Liaoni
ngGua
ngxi
Heilong
jiang
Aggrega
te
Hunan
Hubei
Henan
Guizho
u2000 2004 2009
0.00
0.05
0.10
0.15
0.20
0.25
Jiangs
uShan
dong
Liaoni
ngGua
ngxi
Heilong
jiang
Aggrega
te
Hunan
Hubei
Henan
Guizho
u
2000 2004 2009
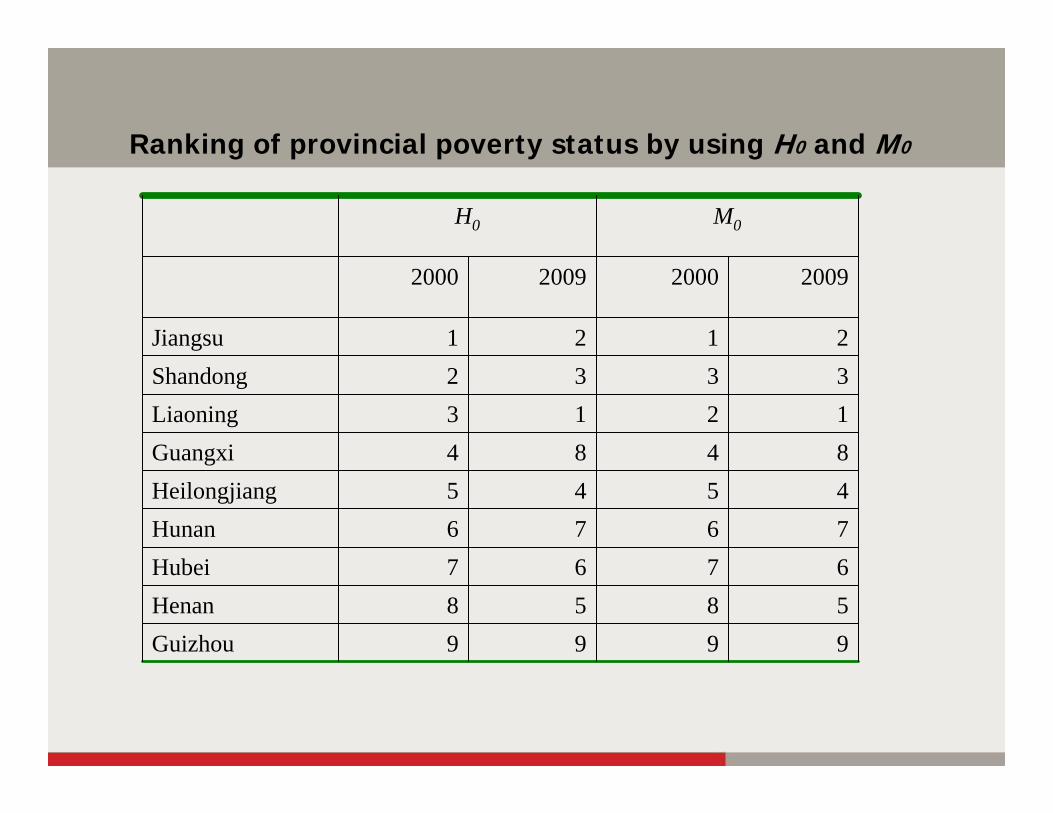
Ranking of provincial poverty status by using H0 and M0
9999Guizhou5858Henan6767Hubei7676Hunan4545Heilongjiang8484Guangxi1213Liaoning3332Shandong2121Jiangsu
2009200020092000
M0H0
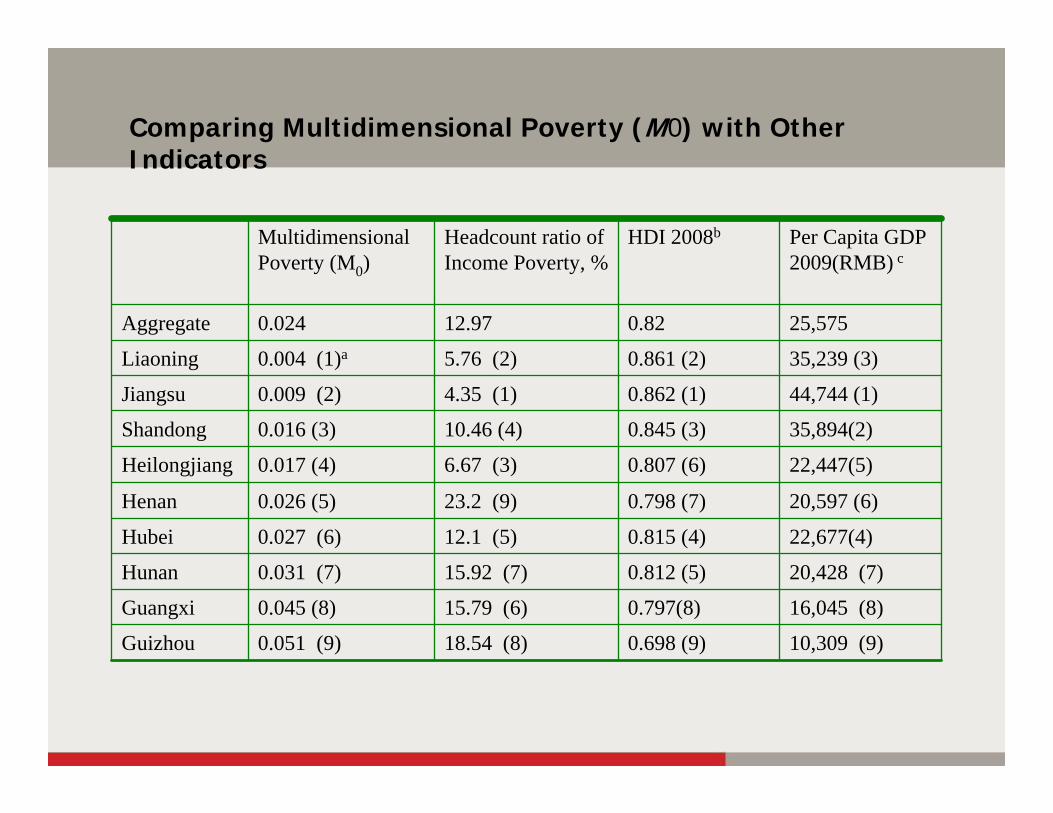
Comparing Multidimensional Poverty (M0) with Other Indicators
10,309 (9)0.698 (9)18.54 (8)0.051 (9)Guizhou
16,045 (8)0.797(8)15.79 (6)0.045 (8)Guangxi
20,428 (7)0.812 (5)15.92 (7)0.031 (7)Hunan
22,677(4)0.815 (4)12.1 (5) 0.027 (6)Hubei
20,597 (6)0.798 (7)23.2 (9)0.026 (5)Henan
22,447(5)0.807 (6)6.67 (3)0.017 (4)Heilongjiang
35,894(2)0.845 (3)10.46 (4)0.016 (3)Shandong
44,744 (1)0.862 (1)4.35 (1)0.009 (2)Jiangsu
35,239 (3)0.861 (2)5.76 (2)0.004 (1)aLiaoning
25,5750.8212.970.024Aggregate
Per Capita GDP 2009(RMB) c
HDI 2008bHeadcount ratio of Income Poverty, %
Multidimensional Poverty (M0)

Contribution Rate of Each Dimension to M0
0%
20%
40%
60%
80%
100%
2000 2004 2006 2009
Social Security
Income
Living standard
Health
Education

The Censored Headcounts and Raw Headcounts inSpecific Dimension (2009)
0%
2%
4%
6%
8%
10%
12%
14%
Social Security Living Standard Health Education Income
Raw Headcount Censored Headcount

Contribution Rate of Each Dimension to the Reduction of Provincial M0 (2000~2009) (%)
-0.171 7.77 48.73 15.97 -0.29 27.81 Guizhou
-0.110 13.91 44.28 18.22 -1.09 24.68 Guangxi*-0.145 8.64 46.29 9.27 2.17 33.63 Hunan
-0.187 13.81 42.97 10.35 0.76 32.12 Hubei
-0.195 14.70 42.96 6.77 0.15 35.42 Henan
-0.102 14.35 41.27 7.20 4.67 32.51 Shandong
-0.049 10.67 41.63 10.23 8.20 29.26 Jiangsu
-0.144 18.76 41.20 7.90 -0.23 32.38 Heilongjiang
-0.106 7.68 42.13 16.61 0.39 33.19 Liaoning
ΔM0Living Standard
Social Security
HealthEducationIncome

Contribution Rate of Each Province to Overall M0
0
5
10
15
20
25
30
Jiangs
uLia
oning
Heilongj
iang
Guangxi
Guizhou
Shandon
g
Hunan
Hubei
HenanP
rovincial Contribution,%
2000 2004 2009
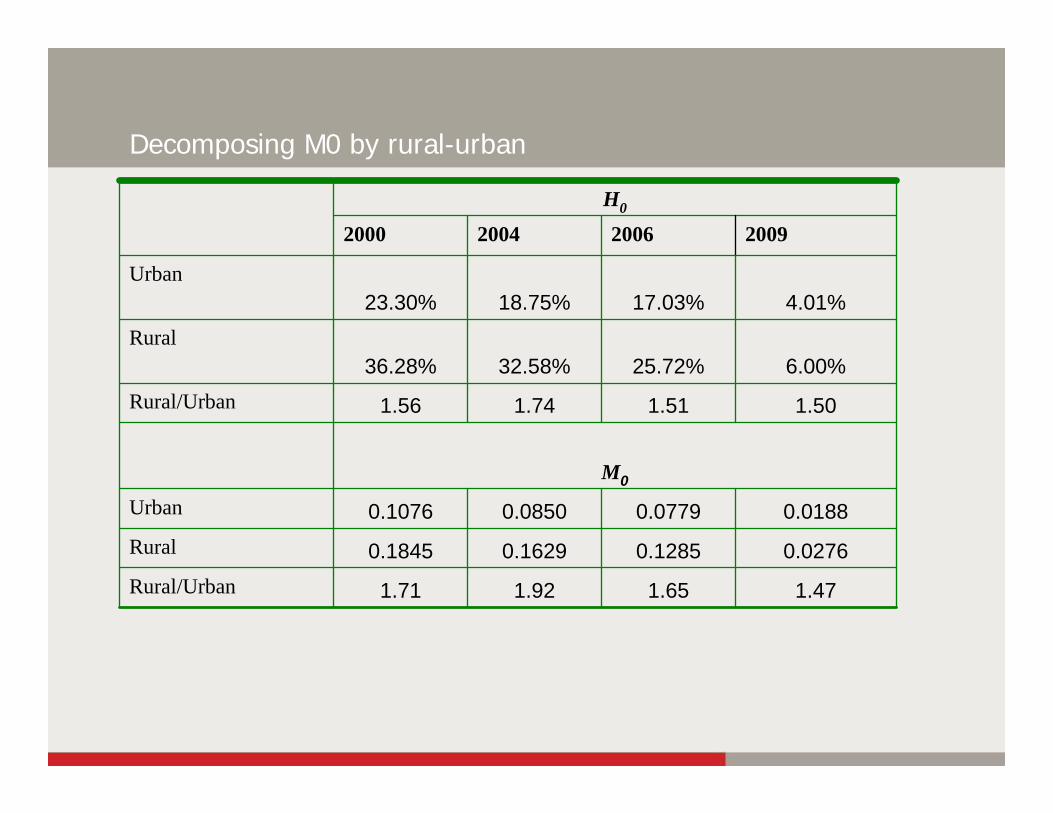
Decomposing M0 by rural-urban
1.471.651.921.71Rural/Urban
0.02760.12850.16290.1845Rural
0.01880.07790.08500.1076Urban
M0
1.50 1.51 1.741.56 Rural/Urban
6.00%25.72%32.58%36.28%Rural
4.01%17.03%18.75%23.30%Urban
2009200620042000
H0

Poverty and Population Contributions of Rural and Urban Areas
53.94 57.27 60.02 64.33 Population Contribution
63.21 68.85 74.20 75.56 Poverty Contribution
Rural
46.06 42.73 39.98 35.67 Population Contribution
36.79 31.15 25.80 24.44 Poverty Contribution
Urban
2009 2006 2004 2000

5. Conclusions
China witnessed decreasing multidimensional poverty between 2000 and 2009
All sample provinces experienced a decrease of poverty Higher economic development doesn’t automatically transited into
higher human development and lower multidimensional poverty Deprivation of access to social security system is the largest source
of multidimensional poverty Worsening of deprivation in education raises new policy concerns Although urban-rural income gap widened during the survey period,
however, urban-rural gap in multidimensional poverty didn’t expand during the survey period, probably suggesting a positive effects of Socialist New Countryside Constructions.