Embed Size (px)
Citation preview
WORKING PAPERS
Multidimensional Poverty and the
State of Child Health in India
Sanjay K. Mohanty
CR Parekh Visiting Fellow Asia Research Centre London School of Economics and Political Science Houghton Street, London WC2A 2AE United Kingdom
______________________________________________________________
ASIA RESEARCH CENTRE WORKING PAPER 30
2
Multidimensional Poverty and the State of Child
Health in India
Written by: Sanjay K. Mohanty
Sanjay K. Mohanty was C R Parekh Visiting fellow at Asia Research Centre, LSE, 2009-10 and Associate Professor, Department of Fertility Studies, International Institute for Population Sciences, Govandi Station Road, Deonar, Mumbai- 400088, India. Email: [email protected], [email protected]
All rights reserved. Apart from any fair dealing for the purpose of research or private study, or criticism or review, no part of this publication may be reproduced, stored in a retrieval system or transmitted in any form or by any means without the prior permission by the publisher or author.
Copyright © Sanjay K Mohanty 2010
For further information, please contact
Asia Research Centre (ARC)
London School of Economics & Political Science
Houghton Street
London WC2A 2AE
www.lse.ac.uk/collections/AsiaResearchCentre
3
ACKNOWLEDGMENTS
My assignment as the C.R. Parekh Visiting Fellow at the Research Centre (ARC), London
School of Economics and Political Science was memorable, productive and pleasant.
During my stay (January-April 2010), I have benefited immensely from the academic
environment at the ARC and the School. With the kind permission of course teachers, Dr
Jouni Kuha, Dr Sally Stares and Dr Elliot Green, I attended three courses: Special Topics
in Quantitative Analysis (MI 456); Quantitative Analysis III: Applied Multivariate
Analysis (MI-455); and Poverty (DV 407). I have completed my research paper entitled,
“Multidimensional Poverty and the State of Child Health in India”, within the stipulated
time. The findings of my research were presented at a seminar on March 16, 2010 in room
no S 78, St Clement’s House, LSE. I thank the participants for their useful suggestions.
and the anonymous reviewer for providing thoughtful suggestions that helped me to revise
the paper.
I had the opportunity to meet and discuss my research topic with Dr Ruth Kattumuri, Dr
Athar Hussain, Dr Elliot Green and Prof John Cleland and incorporated their valuable
suggestions. My deep gratitude to the ARC for awarding me the C.R. Parekh fellowship
and to the Nirman Foundation for the generous financial support that enabled me to carry
out the work. I would like to thank Dr Ruth Kattumuri for all her help, from academics to
administration and for making my stay comfortable. I thank Mr. Keith Tritton and Mr.
Kevin Shields for providing me prompt administrative support at all stages of my work. I
also thank the previous Centre Manager, Mr. Scott Shurtleff and the accommodation
office at LSE for providing me excellent accommodation at Sidney Webb House.
My gratitude to Prof F.Ram, Prof T.K.Roy, Prof P.C. Saxena and Prof R.K. Sinha for their
encouragement. I thank Dr. Bijaya Malik for his constant support, Mr Ranjan Pursty who
helped me to draw the maps and Ms Sudha Raghavendran for editing the paper, Ms Lipika
and Mr Siddhant for their dedicated help and the Almighty for shaping my career.
Sanjay Kumar Mohanty
01.11.2010
4
Multidimensional Poverty and the State of Child Health in India
Abstract
Using data from the National Family and Health Survey 3, India, this paper measures and
validates the extent of multidimensional poverty and examines the linkages of poverty level with
child health in India. Multidimensional poverty is measured in the domain of education, health
and living standard and child health is measured with respect to infant mortality rate, the under-
five mortality rate, immunization of children and medical assistance at birth. Results indicate that
one-fifth of the households in India are abject poor; half of them are poor and the poor have
limited access to child care. While infant mortality rate and under-five mortality rate are
disproportionately higher among the abject poor compared to the non-poor, there are no
significant differences in child survival among the educational, economical and health poor at the
national level. Regional patterns in child survival among education, economical and health poor
are mixed.
Key words: multidimensional poverty, infant mortality, under-five mortality, India, child health
5
1. Introduction
The goal of this paper is both methodological and empirical. The methodological goal is to
measure the state of multidimensional poverty and the empirical goal is to examine the state of
child health among the abject poor, poor and non-poor households in India. This paper has been
conceptualized with the following rationale; First, though multidimensional poverty has been
acknowledged cutting across disciplines (among economists, development thinker, social
scientists, public health professionals, policy makers and international organizations) and
included in the development agenda, its measurement and application are still limited. Second,
poverty eradication program in India identifies poor using the concept of multidimensional
poverty but the official estimates of poverty continue to be derived from consumption
expenditure data. Third, empirical evidence suggests an inverse association of level and
inequality in child survival, that is, as mortality declines, the gap in child mortality between the
poor and the better-off widens (Wang 2003). Four, in transitional economies, health care services
are more likely to benefit the non-poor than the poor (Gwatkin 2005). Along with these goals
and rationale, we hypothesize that there are no significant differences in child survival (infant
mortality rate and under-five mortality rate) among the educational poor, wealth poor and health
poor.
In deriving multidimensional poverty, both theoretical and methodological issues are of immense
importance. Methodological issues include the fixing of a cut off point for the poor and non-
poor, aggregation of multiple dimensions into a single index, weighting of dimensions and the
unit of analyses, while theoretical issues relate to the choice of dimensions, choice of indicators
and the context (Alkire and Foster 2009; Alkire 2007). The UNDP has devised two composite
6
indices, namely the Human Poverty Index 1 (HPI 1 for developing countries) and Human
Poverty Index 2 (HPI 2 for developed countries) to measure the state of multidimensional
poverty in the domain of health, knowledge and living standard (UNDP 1997). Among
researchers, there is general agreement in specifying the poverty line of each dimension, but they
differ in deriving the aggregate poverty line. While some have used the union approach (poor in
any dimension) (Bourguignon and Chakravarty 2003), others have used the intersection (poor in
two or more dimension) approach (Gordon et al 2003) or relative approach (Wagle U 2007) in
fixing the poverty line. On the theoretical front, the dimensions of education, health and income
are often measured and few studies have included subjective well being such as fear to face
hardship (Calvo 2008) in defining multidimensional poverty. Studies also document varying
degrees of correlation between dimensions of poverty or deprivation (Klasen S 2000).
Traditionally in the domain of income/consumption, poverty estimates were primarily based on
income and/or consumption expenditure survey data. More recently, data from the Demographic
and Health Surveys (DHS) were used in estimating poverty. Sahn and Stiefel (2000) estimated
the change in poverty of African countries in the 1990s using the asset based welfare index.
Along with consumer durables and housing characteristics, they had used the educational level of
head of household in defining poverty. Booysen, Maltitz and Rand (2008) extended the work of
Sahn and Stiefel to seven African countries and found a decline in the poverty in five of these
countries. Srinivasan and Mohanty (2008) using three rounds of Indian DHS data, estimated the
change in deprivation level in Indian states.
7
In India, the estimates of poverty and the identification of poor for conditional cash transfer are
carried out independently. The official estimates of poverty are derived by the Planning
Commission based on consumption expenditure data collected by the National Sample Survey
Organization (NSSO) in its quinquinneal round (since 1973-74). On the other hand, the poor are
identified by a Below Poverty Line (BPL) Survey carried out by the District Rural Development
Authority (DRDA) of each state with guidelines from the Ministry of Rural Development,
Government of India. Based on the Planning Commission, Government of India estimates of
2004-05 (uniform recall period), 27% of India’s population (25.7% urban and 28.3% rural) were
living below the poverty line (Planning Commission 2007). However, these estimates are often
debated and revised owing to different recall periods (365 vs. 30 vs. 7 days) in various rounds,
the fixed basket of goods and services, the price index applied and appropriate minimum
threshold. Additionally, the consumption expenditure is sensitive to household size and
composition and not adjusted in poverty estimates. Recently, the Government of India appointed
the Tendulkar Committee to suggest an amendment of poverty estimates. The Committee
recommended the same poverty estimates for urban India (25.7%) but re-estimated rural poverty
for 2004-05 (Planning Commission 2009). On the other hand, three rounds of BPL survey had
already been carried out with different methodology for identifying the poor. The first BPL
survey was conducted in 1992, the second in 1997 and the third in 2002. There were
improvements in the methodology in successive rounds of BPL surveys but all these rounds
used the concept of multidimensional poverty. For example, the 2002 round used a set of 13
socioeconomic indicators (size of operational land holding, type of house, availability of food
and clothing, security, sanitation, ownership of consumer durables, literacy status, status of
household labour, means of livelihood, status of school going children, type of indebtedness,
8
reason for migration and preference of assistance) with a score ranging from 0 to 4 for the
variables. The total score ranged from 0 to 52 and the states were given the flexibility of
deciding the cut off points. There has been discontent on the methodology used in BPL surveys
and misuse in the distribution of BPL cards (Sundaram 2003; Ram et al 2009).
Evidence in India suggests reduction in consumption poverty, but the state of child health has not
improved substantially. During 1992-2006, the proportion of undernourished children had
declined marginally (about two-fifths of children were undernourished in 2005-06). The infant
mortality rate had declined from 77 deaths per 1000 live births in 1991-95 to 57 per 1000 live
births in 2001-05 (IIPS and Macro International 2007). Though there is a large differential in the
state of child health and health care utilization by education and wealth status of the households,
little is known on the state of child health by multiple deprivations. This paper attempts to
measure the deprivation in multiple dimensions of capability and understand its linkage with
child survival in India, using large scale population based survey data.
2. Data and Methods
In the last two decades, the Demographic and Health Surveys (DHS) have bridged the data gap
on population, health and nutrition parameters of many developing countries, including India.
The DHS in India, known as the National and Family and Health Survey (NFHS), was first
conducted in 1992-93 and the second and the third rounds were conducted in 1998-99 and 2005-
06 respectively. The NFHS’s are large scale population based representative sample surveys that
cover more than 99% of India’s population under rigorous conditions of scientific sampling
design, training of investigators and high quality data collection and edit procedures. These
9
surveys collect reliable information on births, deaths, family planning, nutrition, a range of
health related issues including HIV/AIDS and the living conditions of households. There were
improvements in coverage and dimensions in successive rounds of the survey. NFHS-3
canvassed three different survey instruments namely, the household schedule, the women’s
questionnaire and the men’s questionnaire from the sampled households. The household
schedule collected information on economic proxies such as housing quality, household
amenities, size of land holding and consumer durables, whereas the women questionnaire
collected detailed information on reproductive histories, health, nutrition and related information
of mothers and children. The men’s questionnaire collected information on men’s involvement in
health care, reproductive intention and knowledge and use of contraception from men in the age
group 15-54. A detailed description of the survey design of the NFHS and the findings are
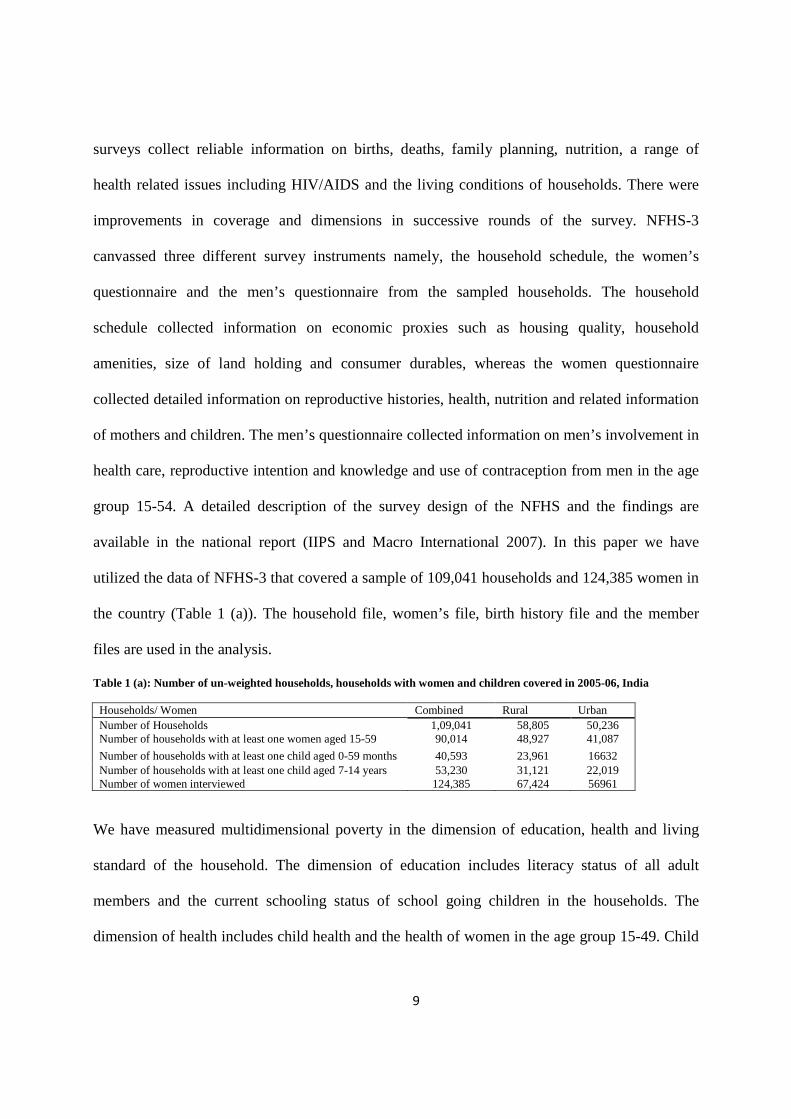
available in the national report (IIPS and Macro International 2007). In this paper we have
utilized the data of NFHS-3 that covered a sample of 109,041 households and 124,385 women in
the country (Table 1 (a)). The household file, women’s file, birth history file and the member
files are used in the analysis.
Table 1 (a): Number of un-weighted households, households with women and children covered in 2005-06, India Households/ Women Combined Rural Urban Number of Households 1,09,041 58,805 50,236 Number of households with at least one women aged 15-59 90,014 48,927 41,087
Number of households with at least one child aged 0-59 months 40,593 23,961 16632 Number of households with at least one child aged 7-14 years 53,230 31,121 22,019 Number of women interviewed 124,385 67,424 56961
We have measured multidimensional poverty in the dimension of education, health and living
standard of the household. The dimension of education includes literacy status of all adult
members and the current schooling status of school going children in the households. The
dimension of health includes child health and the health of women in the age group 15-49. Child
10
health is measured by a set of health care variables (the vaccination coverage of children, the
medical assistance at delivery), infant mortality rate (IMR) and under-five mortality rate
(U5MR). The living standard is measured by a set of economic proxies of the household. In
deriving the estimate of multidimensional poverty, the unit of analysis is the household, whereas
the child is the unit of analysis for child health variables. The estimates of IMR and U5MR are
derived from the birth history file and analyses were carried out separately for rural and urban
areas. NFHS data has been used for all the analyses. All the data from NFHS has been weighted
to adjust for non-response (IIPS and Macro International 2007). The national weight is used in
the national analyses and state weight is used in state level analyses. The basic objective of state
weight is to maximize the representativeness of the sample in terms of the size, distribution, and
characteristics of the study population. Specifically it takes care of the non-equal probability of
selection in different domain i.e., rural and urban areas and slum and no-slum areas in the states
of Andhra Pradesh, Delhi, Madhya Pradesh, Maharashtra, Tamil Nadu, Uttar Pradesh and West
Bengal. It also takes care of the differential non-response rates of household interviews in urban
and rural areas and slums and non-slums. After adjusting for non-response, the weights are
normalized so that the total number of weighted cases is equal to total number of unweighted
cases. Because of the normalization of the state household weight at the state level, the
normalized state household weight cannot be used for national indicators. Hence the national
weight is the product of design weight of each state and the state weight. SPSS 14 and STATA
10 software packages are used. Bi-variate analysis is used in understanding the differentials in
poverty and health care, while the principal component analysis (PCA) is used in estimating the
wealth index. The life table technique is used to estimate the IMR (probability of dying in first
11
year of life) and the U5MR (the probability of dying within first five years of life) by poverty
level of the household.
3. Results
Results are presented in three sections. Section 1 describes the methodology of identification of
poor and estimates of multidimensional poverty, section 2 describes health care utilization by
poverty level and section 3 describes child survival among the abject poor, poor but not abject
poor and non-poor.
3.1: Identification of the Poor and the Extent of Multidimensional Poverty
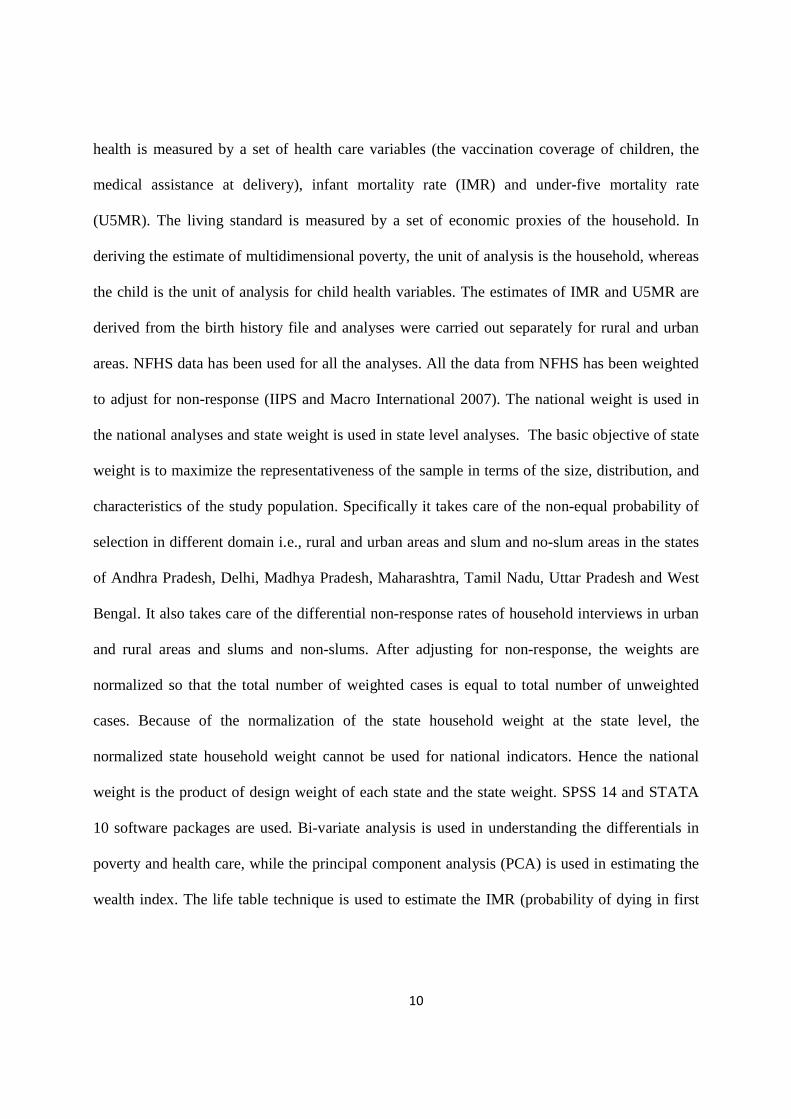
Table 1 (b) show the specific indicators used in quantifying dimensional poverty in education,
health and living standard separately for rural and urban areas. It also provides the method of
fixing the cut off point of poor in each of these dimensions.
12
Table 1 (b): Dimensional indicators of poverty and the method of deriving poor in India
Dimension Indicators for Rural Indicators for Urban Defining Poor No adult literate member in the household
No adult literate member in household
Education
Any child in the school going age (7-14) never attended school Any child in the school going age (7-14) discontinued schooling
Any child in the school going age (7-14) never attended school Any child in the school going age (7-14) discontinued schooling
Household do not have an adult literate member or any of the child age 7-14 in the household never attended or discontinued school
Any child below 5 years of age is severely underweight
Any child below 5 years of age is severely underweight
Health
Any woman age 15-49 years is severely or moderately anaemic
Any woman age 15-49 years is severely or moderately anaemic
Either any child in the household is severely underweight or any woman is severely/moderately anemic
Wealth
Housing Condition: Floor type, wall type, roof type, window type Persons per room Access to improved water Type of cooking fuel Electricity Separate kitchen Consumer Durables: Motorcycle, car, landline telephone, mobile, television , pressure cooker, refrigerator, computer, sewing machine, watch, bicycle, radio Size of Landholding: No land, marginal, small, medium/ large holdings Agricultural accessories: Thresher, Tractor, Water Pump
Housing Condition : Floor type, wall type, roof type, window type, Persons per room, own house Access to improved water Type of toilet facility Type of cooking fuel Separate kitchen Consumer Durables: Motorcycle, car, landline telephone, mobile, television, pressure cooker, refrigerator, computer sewing machine, watch
Derived from the composite wealth index using the PCA. The cut off point of poor in is 26% in urban areas and 28% in rural areas. This cut-off point is equivalent to the poverty estimates of the Planning Commission, Govt. of India, 2004-05
In the dimensional index of education, three indicators, namely, any adult literate member (15+)
in the household and children in the school going age who had never attended school or had
discontinued schooling are used. The literacy status of any adult member in a household is the
basic and frequently used indicator that measures literacy. It is computed by the presence or
absence of any adult literate member in the household. We prefer to use this indicator to that of
the head of household as the average age of the household head is 46 years in the country. In
such cases, the recent benefits of education (say in last 10-15 years) to the members of household
13
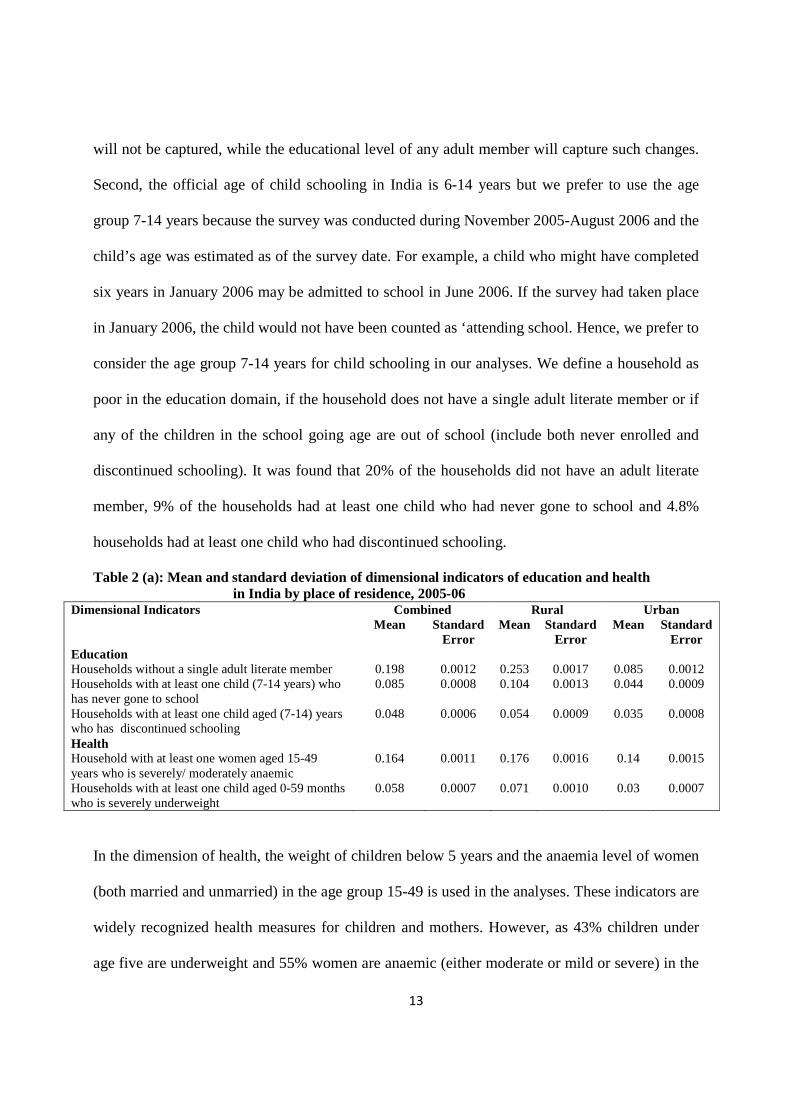
will not be captured, while the educational level of any adult member will capture such changes.
Second, the official age of child schooling in India is 6-14 years but we prefer to use the age
group 7-14 years because the survey was conducted during November 2005-August 2006 and the
child’s age was estimated as of the survey date. For example, a child who might have completed
six years in January 2006 may be admitted to school in June 2006. If the survey had taken place
in January 2006, the child would not have been counted as ‘attending school. Hence, we prefer to
consider the age group 7-14 years for child schooling in our analyses. We define a household as
poor in the education domain, if the household does not have a single adult literate member or if
any of the children in the school going age are out of school (include both never enrolled and
discontinued schooling). It was found that 20% of the households did not have an adult literate
member, 9% of the households had at least one child who had never gone to school and 4.8%
households had at least one child who had discontinued schooling.
Table 2 (a): Mean and standard deviation of dimensional indicators of education and health in India by place of residence, 2005-06
Combined Rural Urban Dimensional Indicators Mean Standard
Error Mean Standard
Error Mean Standard
Error Education Households without a single adult literate member Households with at least one child (7-14 years) who has never gone to school Households with at least one child aged (7-14) years who has discontinued schooling
0.198 0.085
0.048
0.0012 0.0008
0.0006
0.253 0.104
0.054
0.0017 0.0013
0.0009
0.085 0.044
0.035
0.0012 0.0009
0.0008
Health Household with at least one women aged 15-49 years who is severely/ moderately anaemic Households with at least one child aged 0-59 months who is severely underweight
0.164
0.058
0.0011
0.0007
0.176
0.071
0.0016
0.0010
0.14
0.03
0.0015
0.0007
In the dimension of health, the weight of children below 5 years and the anaemia level of women
(both married and unmarried) in the age group 15-49 is used in the analyses. These indicators are
widely recognized health measures for children and mothers. However, as 43% children under
age five are underweight and 55% women are anaemic (either moderate or mild or severe) in the
14
country, we prefer to use the severity in these parameters in defining the health domain. We
consider a household poor in the health domain if the household has at least a child who is
severely underweight or a woman who is severely or moderately anemic. It may be mentioned
that information on blood sample was not collected in the state of Nagaland and so the variable
for the state is not used.
In the wealth domain, economic proxies (housing conditions, household amenities, consumer
durables, size of land holding) of the household are usually used in explaining the economic
differentials in population and health parameters as DHS does not collect data on income or
consumption expenditure. These economic proxies are combined to form a composite index,
often referred to as the wealth index and the PCA is the most frequently used method in deriving
the wealth index. The utility of wealth index in explaining economic differentials in population
and health parameters have been established (Rutstein and Johnson 2004; Filmer and Pritchett
2001). However, our wealth index differs from the DHS wealth index in many aspects. First, we
have constructed the wealth indices for rural and urban areas separately using the PCA, as
estimates of health care utilization differ significantly when separate wealth indices are used for
rural and urban areas rather than a single index (Mohanty 2009). Second, we have carefully
selected variables based on theoretical and statistical significance in the construction of the
wealth index for rural and urban areas. For example, the DHS wealth index does not include land
in the construction of the wealth index, but uses agricultural accessories such as tractors and
threshers. We have used agricultural related variables for rural but not for urban areas. Similarly,
in rural areas a large proportion of households own a house, therefore we have not included this
variable in the construction of the wealth index for rural India. Third, we have equated the cutoff
point of the poor to the Planning Commission, Government of India estimates of poverty in
15
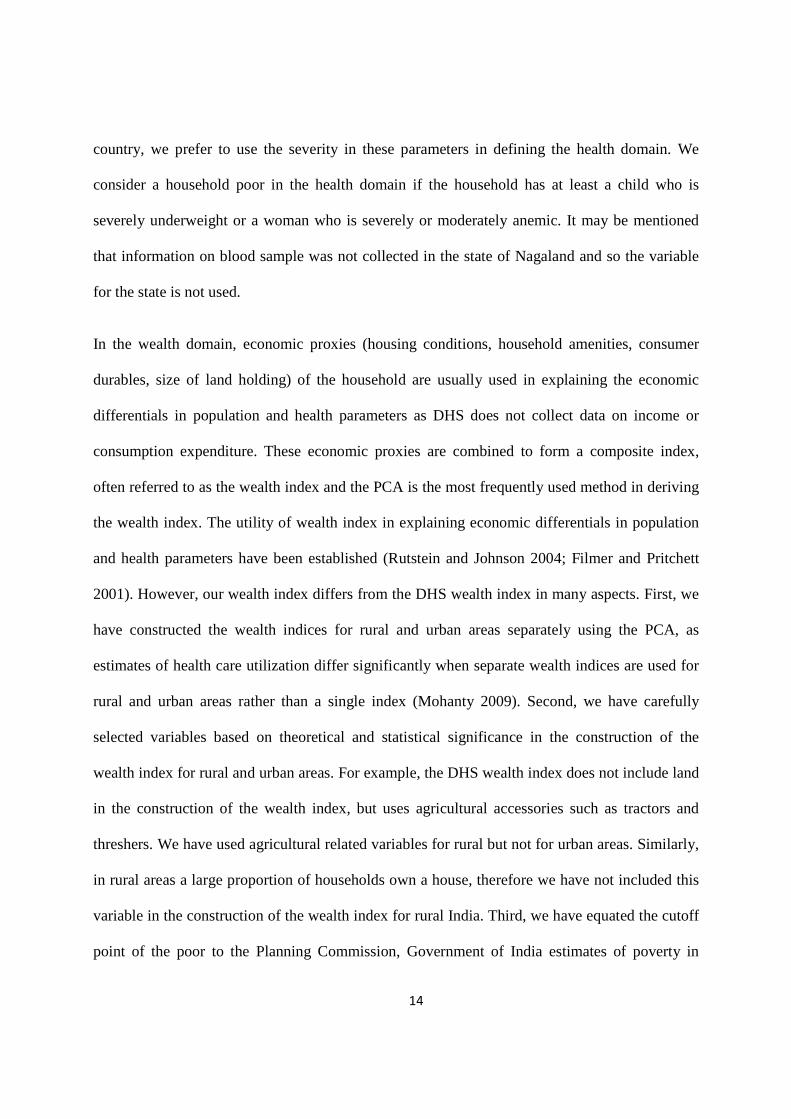
2004-05, based on uniform recall period. Accordingly, 26% of urban households and 28% of
rural households were considered poor in the economic domain.
Table 2 (b): Mean, standard deviation and factor score of variables used in the construction of wealth index by place of residence, India, 2005-06
Rural
Urban
Variables Mean SD
Factor score Mean SD Factor score
Housing quality Floor type 0.305 0.460 0.253 0.807 0.395 0.212 Wall type 0.533 0.499 0.237 0.889 0.314 0.204 Roof type 0.714 0.452 0.165 0.924 0.265 0.166 No window 0.412 0.492 -0.239 0.151 0.358 -0.216 Window without cover 0.290 0.454 0.022 0.216 0.411 -0.109 Window with cover 0.299 0.458 0.235 0.633 0.482 0.253 Person per room Two person 0.325 0.468 0.056 0.376 0.484 0.093 2-4 0.426 0.494 0.026 0.431 0.495 -0.002 4+ 0.249 0.433 -0.090 0.193 0.395 -0.111 Own house 0.933 0.250 *** 0.782 0.413 0.042 Improved drinking water 0.848 0.359 0.048 0.960 0.196 0.038 Cooking fuel 0.088 0.283 0.233 0.601 0.490 0.285 Electricity 0.558 0.497 0.229 0.931 0.254 *** Separate kitchen 0.440 0.496 0.173 0.634 0.482 0.241 Toilet facility No toilet 0.740 0.438 *** 0.169 0.375 -0.247 Pit toilet 0.060 0.237 *** 0.044 0.206 -0.058 Flush toilet 0.200 0.400 *** 0.787 0.409 0.255 Consumer durables Pressure cooker 0.221 0.415 0.283 0.699 0.459 0.266 Television 0.301 0.459 0.281 0.732 0.443 0.237 Sewing machine 0.126 0.332 0.209 0.309 0.462 0.178 Mobile 0.074 0.261 0.227 0.363 0.481 0.243 Telephone 0.080 0.271 0.244 0.266 0.442 0.239 Computer 0.006 0.076 0.093 0.080 0.272 0.157 Refrigerator 0.066 0.248 0.230 0.334 0.472 0.271 Watch 0.714 0.452 0.192 0.911 0.285 0.152 Motorcycle 0.108 0.310 0.245 0.305 0.460 0.232 Car 0.010 0.099 0.122 0.061 0.239 0.145 Radio 0.270 0.444 0.161 0.389 0.487 *** Bicycle 0.517 0.500 0.083 0.501 0.500 *** Land and agricultural accessories No land 0.415 0.493 -0.057 0.810 0.393 *** Marginal holding (up to 2.5 acer) 0.392 0.488 -0.036 0.111 0.314 *** Small holding (2.51-5) 0.082 0.275 0.111 0.038 0.192 *** Medium/large (5+) 0.110 0.313 0.048 0.041 0.199 *** Irrigated land 0.381 0.486 0.080 0.125 0.331 *** Water pump 0.099 0.298 0.150 0.110 0.313 *** Threshers 0.022 0.147 0.082 0.004 0.065 *** Tractors 0.023 0.151 0.121 0.005 0.069 ***
*** Not used in the analyses
16
The mean, standard deviation and the factor score (weight) of the variables used in deriving
wealth indices are shown in Table 2(b). The weight of the variables generated in the construction
of wealth indices are in the expected direction, both in urban and rural areas. The variables that
reflect a higher living standard have a positive weight, while those with a lower standard of
living have a negative weight. For example, the weight of a flush toilet in urban areas is 0.255,
pit toilet is -0.058 and that of no toilet is -0.247. The distribution of the wealth index showed that
it is positively skewed in urban areas and negatively skewed in rural areas. The alpha value is
0.86 in urban and 0.81 in rural areas indicating that the estimates are reliable. Based on the
ascending order of the composite index, a percentile distribution is obtained for the household
both in rural and urban areas.
Based on poverty in each dimension, we have classified a household as abject poor, poor but not
abject poor and non-poor (Table 3). A household is classified as “abject poor” if it is poor in at
least two of the three dimensions and “poor but not abject poor” if it is poor in only one
dimension. Similarly, a household is classified as “non-poor” if it is not poor in any one of the
dimensions and poor, if it is poor in at least one dimension. Results indicate that 27% of the
households in India are poor in education and wealth dimensions each, while 21% are poor in the
health dimension. The distribution of households in overall multidimensional poverty score
suggests that 31% of the households in India are poor in one dimension, 17% are poor in two
dimensions, 4% are poor in all three dimensions and 48% are non-poor. Based on the
classification, 20% of the households in the country are said to be abject poor and 52% poor
(inclusive of abject poor) with large rural-urban differentials.
17
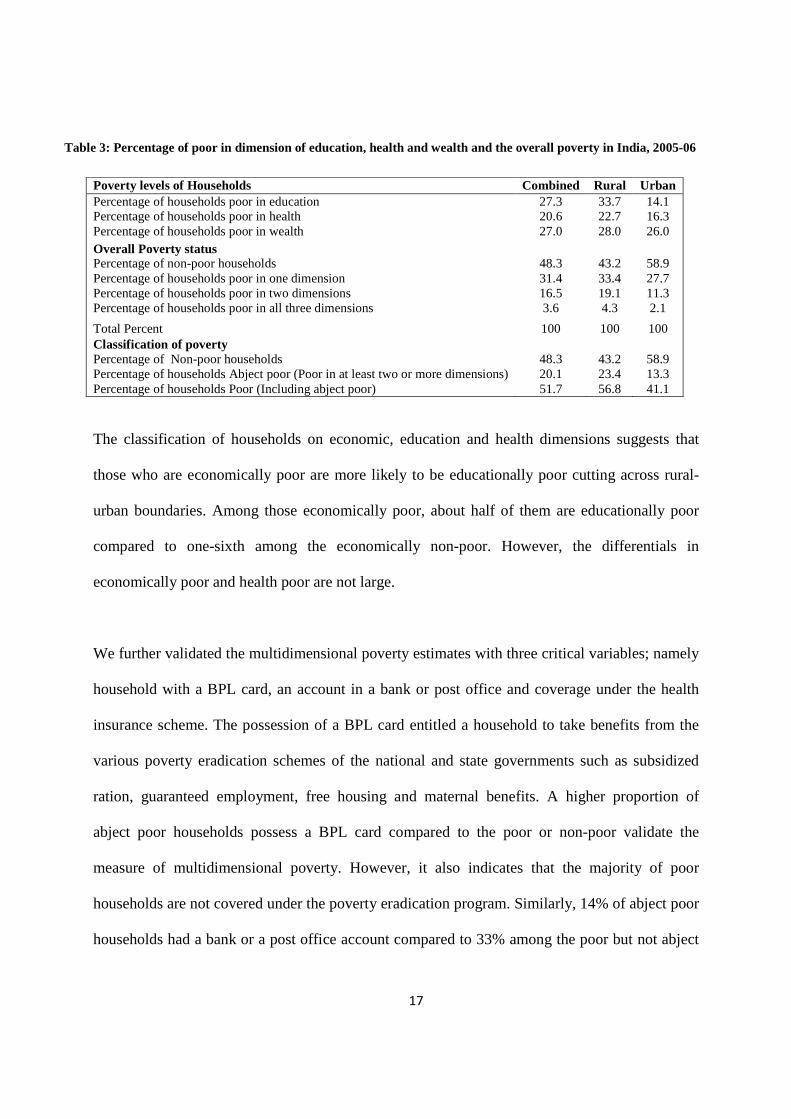
Table 3: Percentage of poor in dimension of education, health and wealth and the overall poverty in India, 2005-06
Poverty levels of Households Combined Rural Urban Percentage of households poor in education Percentage of households poor in health Percentage of households poor in wealth
27.3 20.6 27.0
33.7 22.7 28.0
14.1 16.3 26.0
Overall Poverty status Percentage of non-poor households Percentage of households poor in one dimension Percentage of households poor in two dimensions Percentage of households poor in all three dimensions
48.3 31.4 16.5 3.6
43.2 33.4 19.1 4.3
58.9 27.7 11.3 2.1
Total Percent 100 100 100 Classification of poverty Percentage of Non-poor households Percentage of households Abject poor (Poor in at least two or more dimensions) Percentage of households Poor (Including abject poor)
48.3 20.1 51.7
43.2 23.4 56.8
58.9 13.3 41.1
The classification of households on economic, education and health dimensions suggests that
those who are economically poor are more likely to be educationally poor cutting across rural-
urban boundaries. Among those economically poor, about half of them are educationally poor
compared to one-sixth among the economically non-poor. However, the differentials in
economically poor and health poor are not large.
We further validated the multidimensional poverty estimates with three critical variables; namely
household with a BPL card, an account in a bank or post office and coverage under the health
insurance scheme. The possession of a BPL card entitled a household to take benefits from the
various poverty eradication schemes of the national and state governments such as subsidized
ration, guaranteed employment, free housing and maternal benefits. A higher proportion of
abject poor households possess a BPL card compared to the poor or non-poor validate the
measure of multidimensional poverty. However, it also indicates that the majority of poor
households are not covered under the poverty eradication program. Similarly, 14% of abject poor
households had a bank or a post office account compared to 33% among the poor but not abject
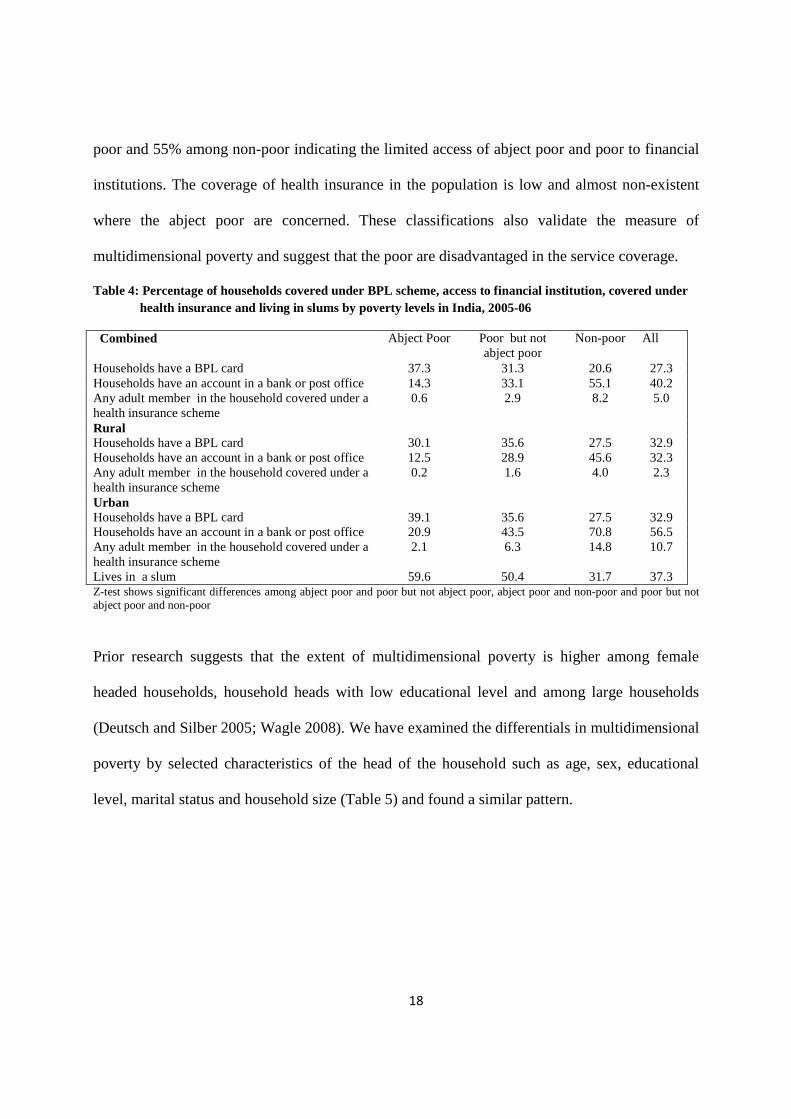
18
poor and 55% among non-poor indicating the limited access of abject poor and poor to financial
institutions. The coverage of health insurance in the population is low and almost non-existent
where the abject poor are concerned. These classifications also validate the measure of
multidimensional poverty and suggest that the poor are disadvantaged in the service coverage.
Table 4: Percentage of households covered under BPL scheme, access to financial institution, covered under health insurance and living in slums by poverty levels in India, 2005-06
Combined Abject Poor Poor but not abject poor
Non-poor All
Households have a BPL card 37.3 31.3 20.6 27.3 Households have an account in a bank or post office 14.3 33.1 55.1 40.2 Any adult member in the household covered under a health insurance scheme
0.6 2.9 8.2 5.0
Rural Households have a BPL card 30.1 35.6 27.5 32.9 Households have an account in a bank or post office 12.5 28.9 45.6 32.3 Any adult member in the household covered under a health insurance scheme
0.2 1.6 4.0 2.3
Urban Households have a BPL card 39.1 35.6 27.5 32.9 Households have an account in a bank or post office 20.9 43.5 70.8 56.5 Any adult member in the household covered under a health insurance scheme
2.1 6.3 14.8 10.7
Lives in a slum 59.6 50.4 31.7 37.3 Z-test shows significant differences among abject poor and poor but not abject poor, abject poor and non-poor and poor but not abject poor and non-poor
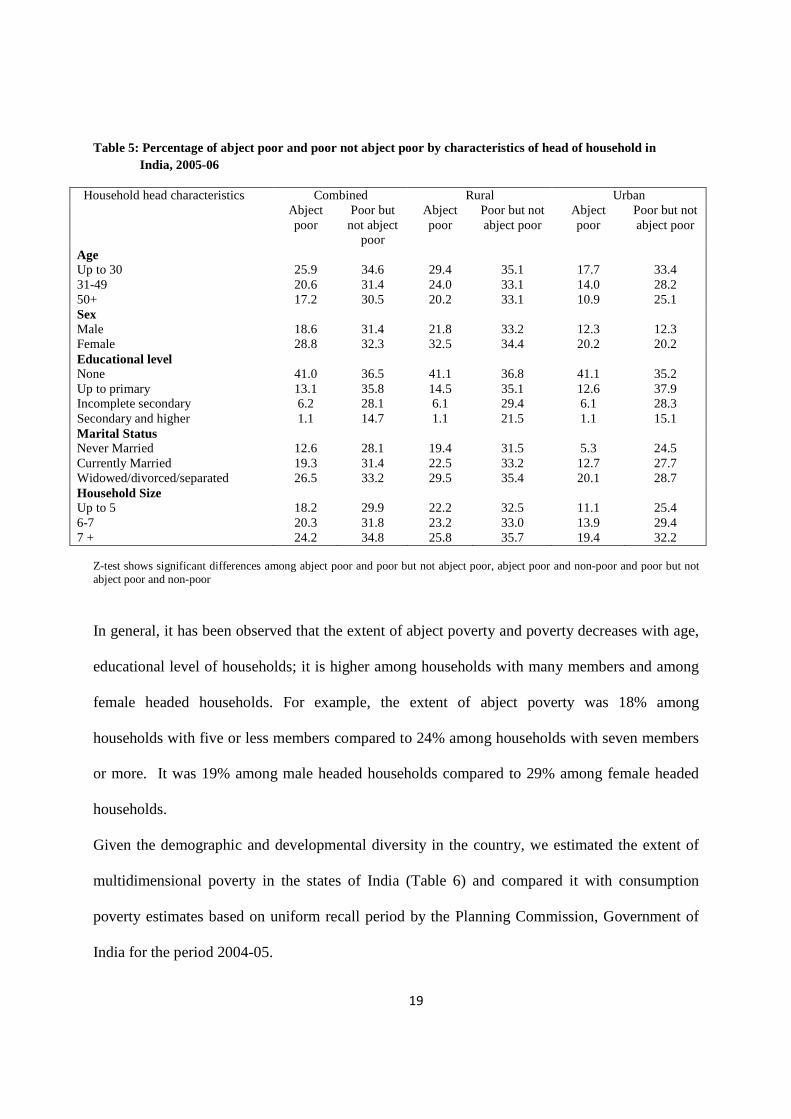
Prior research suggests that the extent of multidimensional poverty is higher among female
headed households, household heads with low educational level and among large households
(Deutsch and Silber 2005; Wagle 2008). We have examined the differentials in multidimensional
poverty by selected characteristics of the head of the household such as age, sex, educational
level, marital status and household size (Table 5) and found a similar pattern.
19
Table 5: Percentage of abject poor and poor not abject poor by characteristics of head of household in India, 2005-06
Combined Rural Urban Household head characteristics Abject poor
Poor but not abject
poor
Abject poor
Poor but not abject poor
Abject poor
Poor but not abject poor
Age Up to 30 31-49 50+
25.9 20.6 17.2
34.6 31.4 30.5
29.4 24.0 20.2
35.1 33.1 33.1
17.7 14.0 10.9
33.4 28.2 25.1
Sex Male Female
18.6 28.8
31.4 32.3
21.8 32.5
33.2 34.4
12.3 20.2
12.3 20.2
Educational level None Up to primary Incomplete secondary Secondary and higher
41.0 13.1 6.2 1.1
36.5 35.8 28.1 14.7
41.1 14.5 6.1 1.1
36.8 35.1 29.4 21.5
41.1 12.6 6.1 1.1
35.2 37.9 28.3 15.1
Marital Status Never Married Currently Married Widowed/divorced/separated
12.6 19.3 26.5
28.1 31.4 33.2
19.4 22.5 29.5
31.5 33.2 35.4
5.3 12.7 20.1
24.5 27.7 28.7
Household Size Up to 5 6-7 7 +
18.2 20.3 24.2
29.9 31.8 34.8
22.2 23.2 25.8
32.5 33.0 35.7
11.1 13.9 19.4
25.4 29.4 32.2
Z-test shows significant differences among abject poor and poor but not abject poor, abject poor and non-poor and poor but not abject poor and non-poor
In general, it has been observed that the extent of abject poverty and poverty decreases with age,
educational level of households; it is higher among households with many members and among
female headed households. For example, the extent of abject poverty was 18% among
households with five or less members compared to 24% among households with seven members
or more. It was 19% among male headed households compared to 29% among female headed
households.
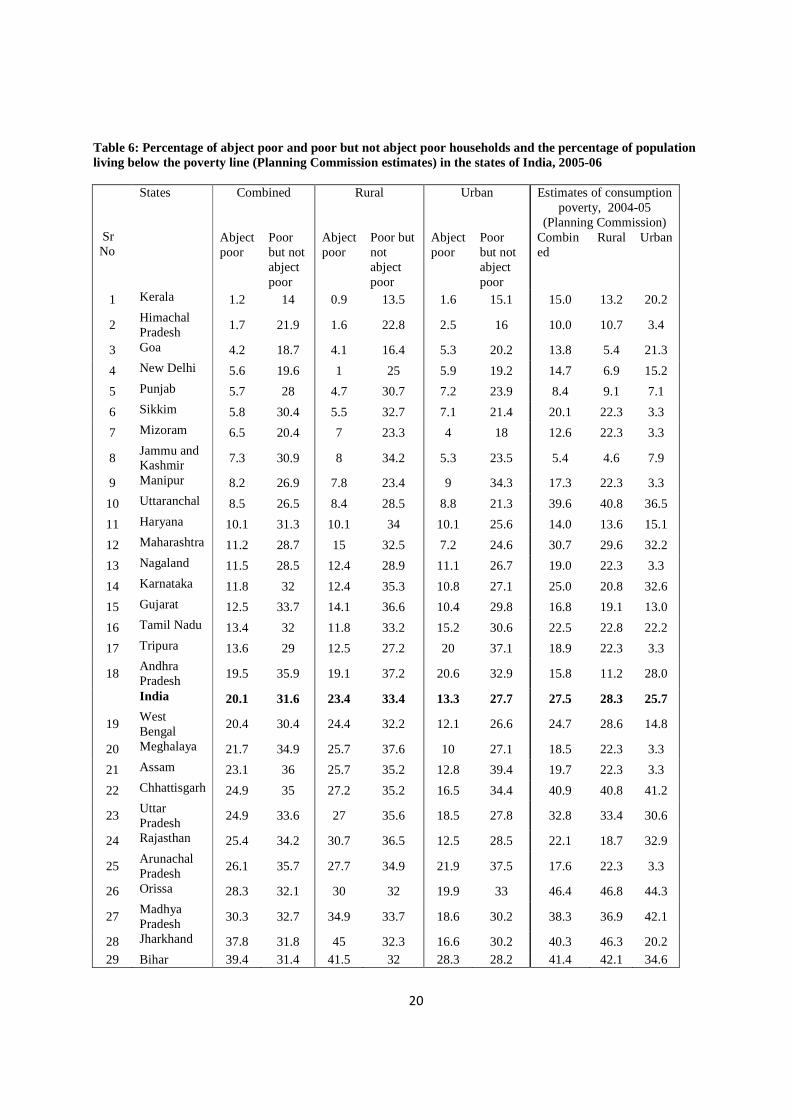
Given the demographic and developmental diversity in the country, we estimated the extent of
multidimensional poverty in the states of India (Table 6) and compared it with consumption
poverty estimates based on uniform recall period by the Planning Commission, Government of
India for the period 2004-05.
20
Table 6: Percentage of abject poor and poor but not abject poor households and the percentage of population living below the poverty line (Planning Commission estimates) in the states of India, 2005-06
Combined Rural Urban Estimates of consumption poverty, 2004-05
(Planning Commission) Sr No
States
Abject poor
Poor but not abject poor
Abject poor
Poor but not abject poor
Abject poor
Poor but not abject poor
Combined
Rural Urban
1 Kerala 1.2 14 0.9 13.5 1.6 15.1 15.0 13.2 20.2
2 Himachal Pradesh
1.7 21.9 1.6 22.8 2.5 16 10.0 10.7 3.4
3 Goa 4.2 18.7 4.1 16.4 5.3 20.2 13.8 5.4 21.3
4 New Delhi 5.6 19.6 1 25 5.9 19.2 14.7 6.9 15.2
5 Punjab 5.7 28 4.7 30.7 7.2 23.9 8.4 9.1 7.1
6 Sikkim 5.8 30.4 5.5 32.7 7.1 21.4 20.1 22.3 3.3
7 Mizoram 6.5 20.4 7 23.3 4 18 12.6 22.3 3.3
8 Jammu and Kashmir 7.3 30.9 8 34.2 5.3 23.5 5.4 4.6 7.9
9 Manipur 8.2 26.9 7.8 23.4 9 34.3 17.3 22.3 3.3
10 Uttaranchal 8.5 26.5 8.4 28.5 8.8 21.3 39.6 40.8 36.5
11 Haryana 10.1 31.3 10.1 34 10.1 25.6 14.0 13.6 15.1
12 Maharashtra 11.2 28.7 15 32.5 7.2 24.6 30.7 29.6 32.2
13 Nagaland 11.5 28.5 12.4 28.9 11.1 26.7 19.0 22.3 3.3
14 Karnataka 11.8 32 12.4 35.3 10.8 27.1 25.0 20.8 32.6
15 Gujarat 12.5 33.7 14.1 36.6 10.4 29.8 16.8 19.1 13.0
16 Tamil Nadu 13.4 32 11.8 33.2 15.2 30.6 22.5 22.8 22.2
17 Tripura 13.6 29 12.5 27.2 20 37.1 18.9 22.3 3.3
18 Andhra Pradesh
19.5 35.9 19.1 37.2 20.6 32.9 15.8 11.2 28.0
India 20.1 31.6 23.4 33.4 13.3 27.7 27.5 28.3 25.7
19 West Bengal
20.4 30.4 24.4 32.2 12.1 26.6 24.7 28.6 14.8
20 Meghalaya 21.7 34.9 25.7 37.6 10 27.1 18.5 22.3 3.3
21 Assam 23.1 36 25.7 35.2 12.8 39.4 19.7 22.3 3.3
22 Chhattisgarh 24.9 35 27.2 35.2 16.5 34.4 40.9 40.8 41.2
23 Uttar Pradesh
24.9 33.6 27 35.6 18.5 27.8 32.8 33.4 30.6
24 Rajasthan 25.4 34.2 30.7 36.5 12.5 28.5 22.1 18.7 32.9
25 Arunachal Pradesh
26.1 35.7 27.7 34.9 21.9 37.5 17.6 22.3 3.3
26 Orissa 28.3 32.1 30 32 19.9 33 46.4 46.8 44.3
27 Madhya Pradesh
30.3 32.7 34.9 33.7 18.6 30.2 38.3 36.9 42.1
28 Jharkhand 37.8 31.8 45 32.3 16.6 30.2 40.3 46.3 20.2 29 Bihar 39.4 31.4 41.5 32 28.3 28.2 41.4 42.1 34.6
21
Based on the estimates of abject poverty, we have classified the states of India as follows;
States with abject poverty of more than 20%: Bihar, Jharkhand, Madhya Pradesh, Orissa,
Arunachal Pradesh, Rajasthan, Uttar Pradesh, Chhattisgarh, Assam, Meghalaya and West
Bengal.
States with abject poverty of 10%-20%: Andhra Pradesh, Tripura, Tamil Nadu, Gujarat,
Karnataka, Nagaland, Maharashtra and Haryana.
States with abject poverty of less than 10%: Uttaranchal, Manipur, Jammu and Kashmir,
Mizoram, Sikkim, Punjab, New Delhi, Goa, Himachal Pradesh and Kerala.
The extent of abject poverty and the overall poverty is maximum in the state of Bihar followed
by Jharkhand and minimum in the states of Kerala followed by Himachal Pradesh and Goa. It is
observed that the overall poverty is high among states where the extent of abject poverty is high.
Further, the pattern of poverty generally follows the state of human development in these states.
A comparison of consumption poverty estimates by the Planning Commission, Government of
India and the multidimensional poor indicates the large differences in the ranking of poverty.
The correlation coefficient of multidimensional poor and consumption poverty in the states of
India is weak; 0.27 in urban and 0.65 in rural areas.
We have attempted to understand the correlation of dimensional poor and the correlation of
consumption poor and wealth poor in the states of India at the macro level. Among the states of
India, the rank order correlation of wealth poor and education poor (0.78) is higher than the
correlation of wealth poor and health poor (0.58). However, the correlation of consumption poor
and wealth poor are large and significant (0.70).
22
3.2. Poverty and Health Care Utilization
Many studies documented the rising inequality in health care utilization by economic status of
households using direct economic measures (monthly per capita consumption expenditure) or
asset based index in India (Mohanty and Pathak 2009). Evidence also suggests that the progress
in basic health services like medical assistance at birth and childhood immunization is slow and
uneven within the country (Ram et al 2009). In this section, we have examined the differentials
in health care utilization with respect to four indicators namely, the usual source of health care of
household, medical assistance at delivery, health card (vaccination) of the child and
immunization coverage of children. The unit of analyses for utilization of usual health care
services is the household, while the child is the unit of analysis for other variables.
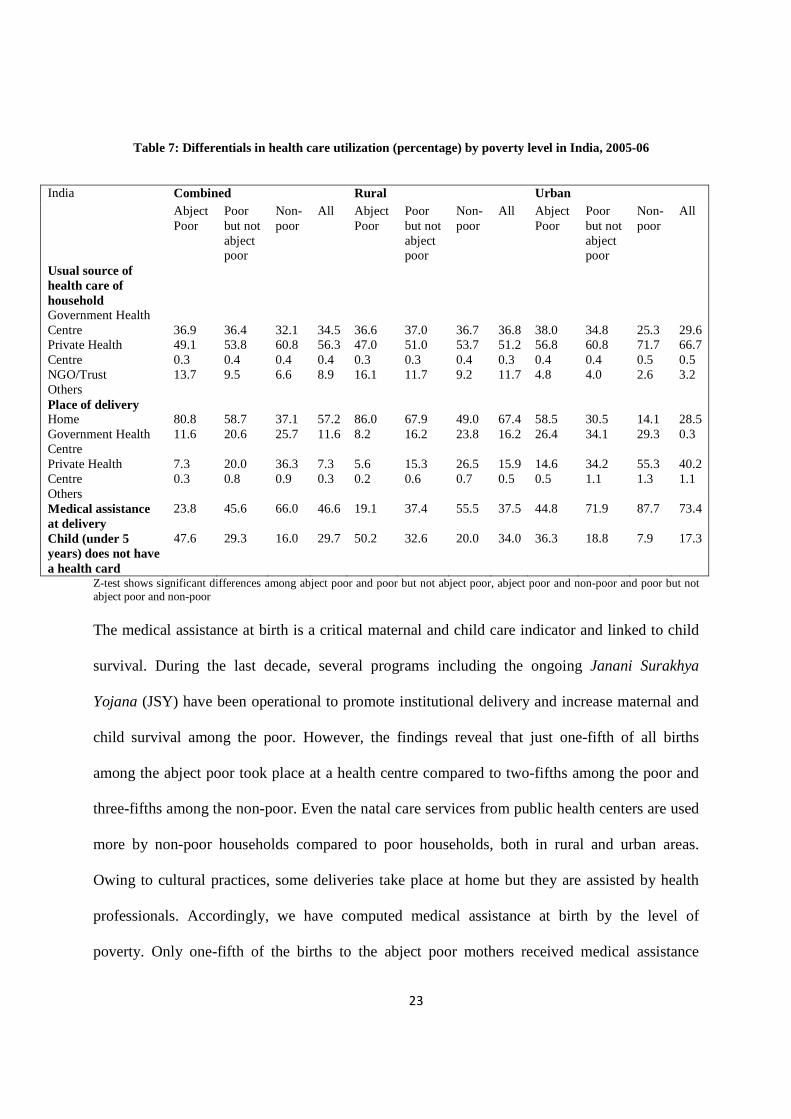
The NFHS survey enquires the usual source of health care of the household. Based on the
distribution, the usual source of health care has been categorized into the use of health services
from the government health centre, the private health centre, the NGO/ Trust and others. A
higher proportion of non-poor households mainly depend on the private health services
compared to abject poor households. On the other hand, the differentials in use of health services
from public health centers are small among abject poor and non-poor. However, a substantially
higher proportion of abject poor usually depends on others, largely the traditional health
practitioner, chemist and shop.
23
Table 7: Differentials in health care utilization (percentage) by poverty level in India, 2005-06
Combined Rural Urban India Abject Poor
Poor but not abject poor
Non-poor
All Abject Poor
Poor but not abject poor
Non-poor
All Abject Poor
Poor but not abject poor
Non-poor
All
Usual source of health care of household Government Health Centre Private Health Centre NGO/Trust Others
36.9 49.1 0.3 13.7
36.4 53.8 0.4 9.5
32.1 60.8 0.4 6.6
34.5 56.3 0.4 8.9
36.6 47.0 0.3 16.1
37.0 51.0 0.3 11.7
36.7 53.7 0.4 9.2
36.8 51.2 0.3 11.7
38.0 56.8 0.4 4.8
34.8 60.8 0.4 4.0
25.3 71.7 0.5 2.6
29.6 66.7 0.5 3.2
Place of delivery Home Government Health Centre Private Health Centre Others
80.8 11.6 7.3 0.3
58.7 20.6 20.0 0.8
37.1 25.7 36.3 0.9
57.2 11.6 7.3 0.3
86.0 8.2 5.6 0.2
67.9 16.2 15.3 0.6
49.0 23.8 26.5 0.7
67.4 16.2 15.9 0.5
58.5 26.4 14.6 0.5
30.5 34.1 34.2 1.1
14.1 29.3 55.3 1.3
28.5 0.3 40.2 1.1
Medical assistance at delivery
23.8 45.6 66.0 46.6 19.1 37.4 55.5 37.5 44.8 71.9 87.7 73.4
Child (under 5 years) does not have a health card
47.6 29.3 16.0 29.7 50.2 32.6 20.0 34.0 36.3 18.8 7.9 17.3
Z-test shows significant differences among abject poor and poor but not abject poor, abject poor and non-poor and poor but not abject poor and non-poor
The medical assistance at birth is a critical maternal and child care indicator and linked to child
survival. During the last decade, several programs including the ongoing Janani Surakhya
Yojana (JSY) have been operational to promote institutional delivery and increase maternal and
child survival among the poor. However, the findings reveal that just one-fifth of all births
among the abject poor took place at a health centre compared to two-fifths among the poor and
three-fifths among the non-poor. Even the natal care services from public health centers are used
more by non-poor households compared to poor households, both in rural and urban areas.
Owing to cultural practices, some deliveries take place at home but they are assisted by health
professionals. Accordingly, we have computed medical assistance at birth by the level of
poverty. Only one-fifth of the births to the abject poor mothers received medical assistance
24
compared to half among the poor and two-thirds among the non-poor. The rural-urban and state
differentials in medical assistance at deliveries are large.
Information on health card and type of vaccination was collected from children born during the
five years preceding the survey. Table 7 reports that half of the children belonging to the abject
poor households did not have a health card compared to 29% among the poor but not abject poor
and 16% among the non-poor. It was 8% among the non-poor in urban areas compared to 36%
among the abject poor in rural areas. The differentials in health card by state shows that more
than half of the children among the abject poor in the states of Assam, Bihar, Chhattisgarh,
Jharkhand, Madhya Pradesh, Rajasthan and Uttar Pradesh did not even have a health card. Such
proportions were much lower among non-poor households.
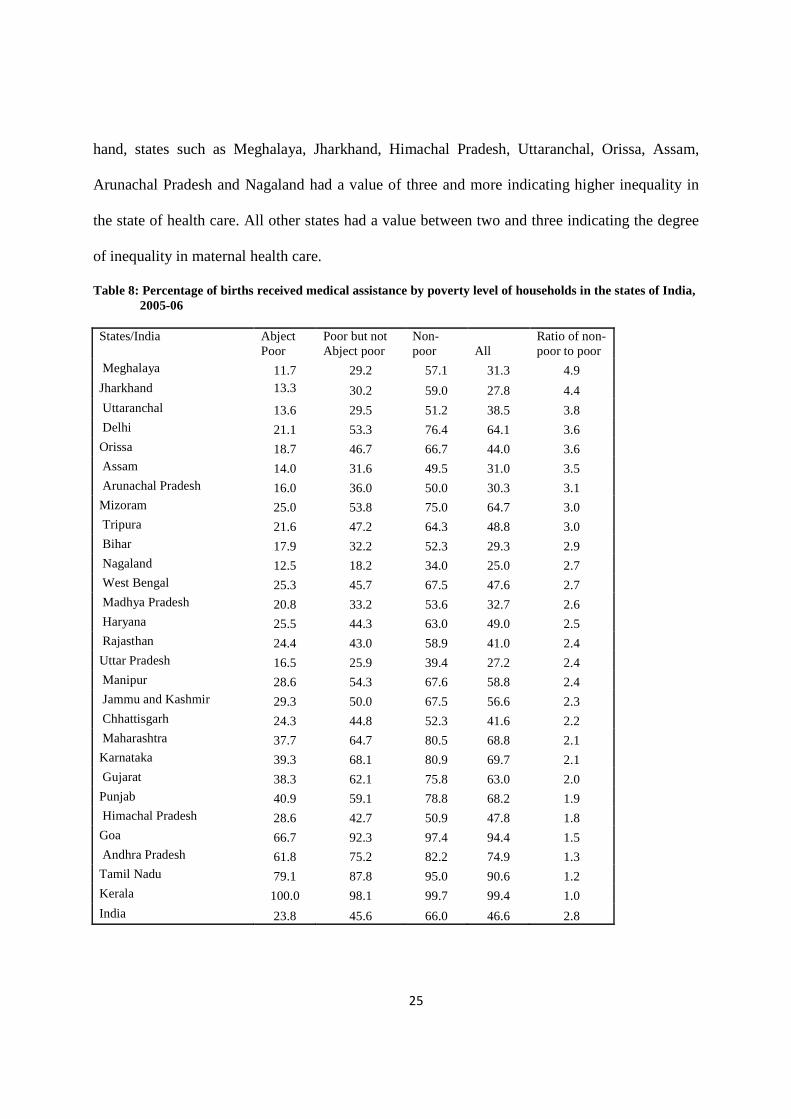
The state differential in medical assistance at delivery by poverty level showed that it was lowest
among the abject poor followed by the poor but not abject poor and the non-poor in all the states
except Kerala (Table 8). The state of Kerala is a model state in health care utilization and in the
state of human development. In an underdeveloped state like Jharkhand, only 13% deliveries
among the abject poor were assisted by a medical professional compared to 30% among the poor
but not abject poor and 59% among the non-poor. Similarly, in developed states like Tamil
Nadu, 79% deliveries among mothers of abject poor households received medical attention
compared to 88% among the poor but not abject poor and 95% among the non-poor. To
understand the differentials in medical assistance at delivery among the poor and non-poor in the
states, we have computed the ratio in the service coverage of non-poor to abject poor. The closer
the ratio is to 1, the lesser the inequality and vice versa. We found that states such as Kerala,
Tamil Nadu, Andhra Pradesh, Goa, Himachal Pradesh and Punjab had a ratio of less than two
indicating a smaller inequality in health care among the abject poor and non-poor. On the other
25
hand, states such as Meghalaya, Jharkhand, Himachal Pradesh, Uttaranchal, Orissa, Assam,
Arunachal Pradesh and Nagaland had a value of three and more indicating higher inequality in
the state of health care. All other states had a value between two and three indicating the degree
of inequality in maternal health care.
Table 8: Percentage of births received medical assistance by poverty level of households in the states of India, 2005-06 States/India Abject
Poor Poor but not Abject poor
Non-poor All
Ratio of non-poor to poor
Meghalaya 11.7 29.2 57.1 31.3 4.9 Jharkhand 13.3 30.2 59.0 27.8 4.4 Uttaranchal 13.6 29.5 51.2 38.5 3.8 Delhi 21.1 53.3 76.4 64.1 3.6 Orissa 18.7 46.7 66.7 44.0 3.6 Assam 14.0 31.6 49.5 31.0 3.5 Arunachal Pradesh 16.0 36.0 50.0 30.3 3.1 Mizoram 25.0 53.8 75.0 64.7 3.0 Tripura 21.6 47.2 64.3 48.8 3.0 Bihar 17.9 32.2 52.3 29.3 2.9 Nagaland 12.5 18.2 34.0 25.0 2.7 West Bengal 25.3 45.7 67.5 47.6 2.7 Madhya Pradesh 20.8 33.2 53.6 32.7 2.6 Haryana 25.5 44.3 63.0 49.0 2.5 Rajasthan 24.4 43.0 58.9 41.0 2.4 Uttar Pradesh 16.5 25.9 39.4 27.2 2.4 Manipur 28.6 54.3 67.6 58.8 2.4 Jammu and Kashmir 29.3 50.0 67.5 56.6 2.3 Chhattisgarh 24.3 44.8 52.3 41.6 2.2 Maharashtra 37.7 64.7 80.5 68.8 2.1 Karnataka 39.3 68.1 80.9 69.7 2.1 Gujarat 38.3 62.1 75.8 63.0 2.0 Punjab 40.9 59.1 78.8 68.2 1.9 Himachal Pradesh 28.6 42.7 50.9 47.8 1.8 Goa 66.7 92.3 97.4 94.4 1.5 Andhra Pradesh 61.8 75.2 82.2 74.9 1.3 Tamil Nadu 79.1 87.8 95.0 90.6 1.2 Kerala 100.0 98.1 99.7 99.4 1.0 India 23.8 45.6 66.0 46.6 2.8
26
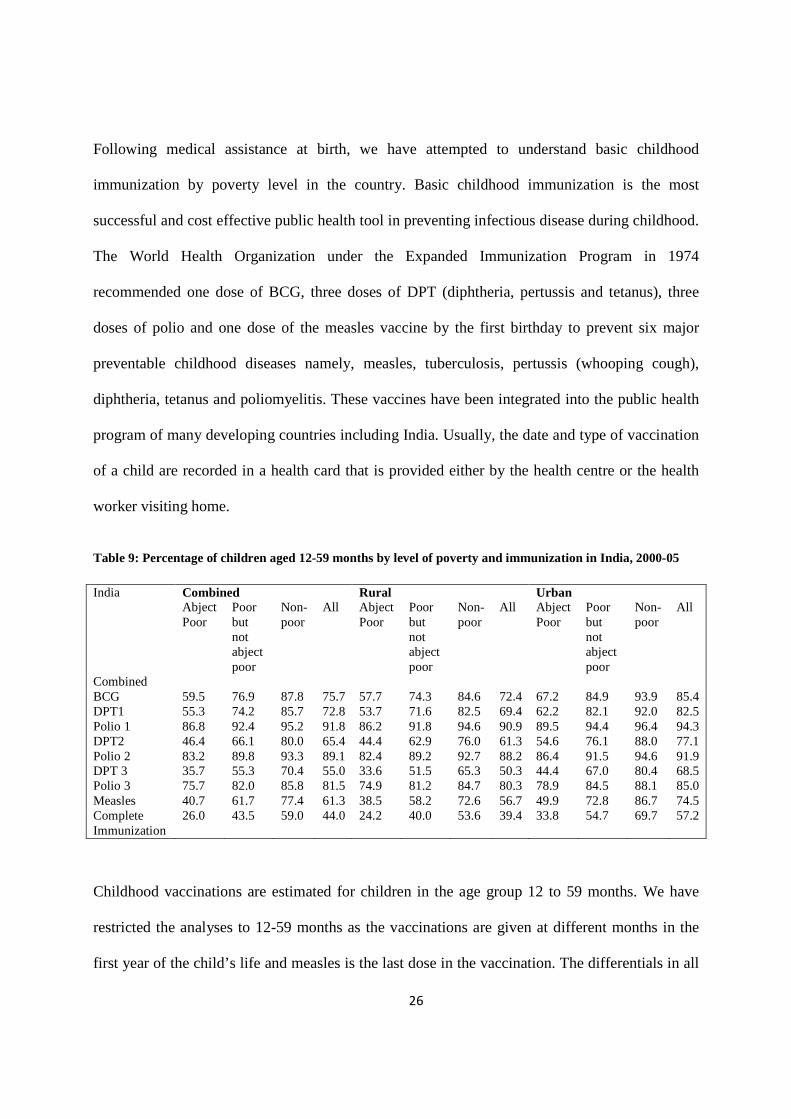
Following medical assistance at birth, we have attempted to understand basic childhood
immunization by poverty level in the country. Basic childhood immunization is the most
successful and cost effective public health tool in preventing infectious disease during childhood.
The World Health Organization under the Expanded Immunization Program in 1974
recommended one dose of BCG, three doses of DPT (diphtheria, pertussis and tetanus), three
doses of polio and one dose of the measles vaccine by the first birthday to prevent six major
preventable childhood diseases namely, measles, tuberculosis, pertussis (whooping cough),
diphtheria, tetanus and poliomyelitis. These vaccines have been integrated into the public health
program of many developing countries including India. Usually, the date and type of vaccination
of a child are recorded in a health card that is provided either by the health centre or the health
worker visiting home.
Table 9: Percentage of children aged 12-59 months by level of poverty and immunization in India, 2000-05
Combined Rural Urban India Abject Poor
Poor but not abject poor
Non-poor
All Abject Poor
Poor but not abject poor
Non-poor
All Abject Poor
Poor but not abject poor
Non-poor
All
Combined BCG DPT1 Polio 1 DPT2 Polio 2 DPT 3 Polio 3 Measles
59.5 55.3 86.8 46.4 83.2 35.7 75.7 40.7
76.9 74.2 92.4 66.1 89.8 55.3 82.0 61.7
87.8 85.7 95.2 80.0 93.3 70.4 85.8 77.4
75.7 72.8 91.8 65.4 89.1 55.0 81.5 61.3
57.7 53.7 86.2 44.4 82.4 33.6 74.9 38.5
74.3 71.6 91.8 62.9 89.2 51.5 81.2 58.2
84.6 82.5 94.6 76.0 92.7 65.3 84.7 72.6
72.4 69.4 90.9 61.3 88.2 50.3 80.3 56.7
67.2 62.2 89.5 54.6 86.4 44.4 78.9 49.9
84.9 82.1 94.4 76.1 91.5 67.0 84.5 72.8
93.9 92.0 96.4 88.0 94.6 80.4 88.1 86.7
85.4 82.5 94.3 77.1 91.9 68.5 85.0 74.5
Complete Immunization
26.0 43.5 59.0 44.0 24.2 40.0 53.6 39.4 33.8 54.7 69.7 57.2
Childhood vaccinations are estimated for children in the age group 12 to 59 months. We have
restricted the analyses to 12-59 months as the vaccinations are given at different months in the
first year of the child’s life and measles is the last dose in the vaccination. The differentials in all
27
recommended vaccination coverage by poverty level are large, more disadvantageous to the
abject poor than to the poor and non-poor. While the difference in polio coverage among the
poor and non-poor is small, it is large in DPT and measles. For example, only 36% of the
children belonging to abject poor households had a vaccination of DPT 3 compared to 70%
among the non-poor. Taking all recommended vaccinations into consideration, the complete
immunization coverage has been computed which was 26% among the abject poor, 44% among
the poor and 59% among the non-poor. The low level of vaccination among the children
belonging to abject poor and poor households is a reflection on the services extended to
multidimensional poor households. The differentials in measles vaccination to children in the age
group 12-59 months also vary largely among the states and are similar to that of medical
assistance at birth; it is highest in Kerala and lowest in Nagaland.
3.3. Poverty and Child Survival
Evidence across developing countries suggests substantial reduction in infant and child mortality
during the last two decades. While immunization of children was primarily attributed in
improving child survival in the 1980s, reduction in poverty and malnutrition, improvement in the
environmental conditions, the use of health services by the mother were significant factors in the
reduction of infant and child mortality in the 1990s (Rutstein 2000; Hatt L.E and Waters H.R
2006). In the Indian context, improvement in the under-five mortality rate is slow and it accounts
for about one-fifth of the global under-five mortality rate (You et al 2009). Moreover, the health
care services in India, like those in other transitional economies, benefit the non-poor more than
the poor.
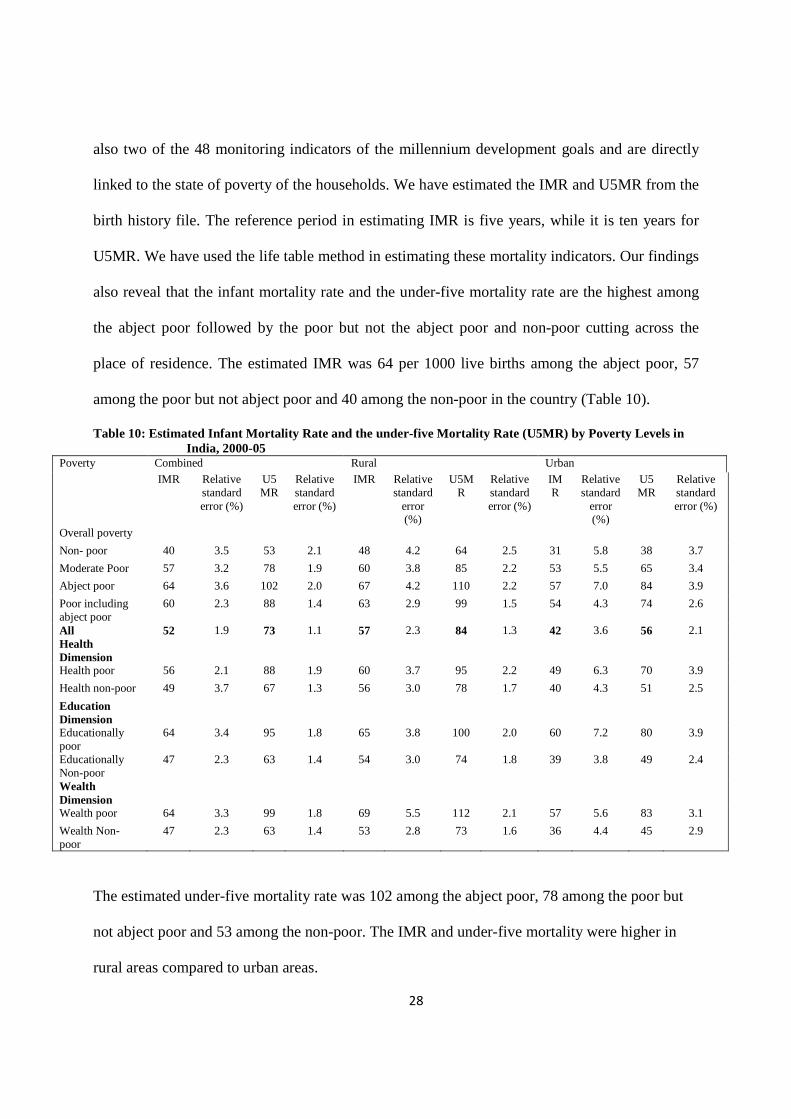
In this section, we have discussed the differentials in infant mortality rate and the under-five
mortality rate by poverty level in India and the states. The IMR and under-five mortality rate are
28
also two of the 48 monitoring indicators of the millennium development goals and are directly
linked to the state of poverty of the households. We have estimated the IMR and U5MR from the
birth history file. The reference period in estimating IMR is five years, while it is ten years for
U5MR. We have used the life table method in estimating these mortality indicators. Our findings
also reveal that the infant mortality rate and the under-five mortality rate are the highest among
the abject poor followed by the poor but not the abject poor and non-poor cutting across the
place of residence. The estimated IMR was 64 per 1000 live births among the abject poor, 57
among the poor but not abject poor and 40 among the non-poor in the country (Table 10).
Table 10: Estimated Infant Mortality Rate and the under-five Mortality Rate (U5MR) by Poverty Levels in India, 2000-05
Combined Rural Urban Poverty
IMR Relative standard error (%)
U5MR
Relative standard error (%)
IMR Relative standard
error (%)
U5MR
Relative standard error (%)
IMR
Relative standard
error (%)
U5MR
Relative standard error (%)
Overall poverty
Non- poor 40 3.5 53 2.1 48 4.2 64 2.5 31 5.8 38 3.7
Moderate Poor 57 3.2 78 1.9 60 3.8 85 2.2 53 5.5 65 3.4
Abject poor 64 3.6 102 2.0 67 4.2 110 2.2 57 7.0 84 3.9
Poor including abject poor
60 2.3 88 1.4 63 2.9 99 1.5 54 4.3 74 2.6
All 52 1.9 73 1.1 57 2.3 84 1.3 42 3.6 56 2.1 Health Dimension
Health poor 56 2.1 88 1.9 60 3.7 95 2.2 49 6.3 70 3.9
Health non-poor 49 3.7 67 1.3 56 3.0 78 1.7 40 4.3 51 2.5
Education Dimension
Educationally poor
64 3.4 95 1.8 65 3.8 100 2.0 60 7.2 80 3.9
Educationally Non-poor
47 2.3 63 1.4 54 3.0 74 1.8 39 3.8 49 2.4
Wealth Dimension
Wealth poor 64 3.3 99 1.8 69 5.5 112 2.1 57 5.6 83 3.1
Wealth Non-poor
47 2.3 63 1.4 53 2.8 73 1.6 36 4.4 45 2.9
The estimated under-five mortality rate was 102 among the abject poor, 78 among the poor but
not abject poor and 53 among the non-poor. The IMR and under-five mortality were higher in
rural areas compared to urban areas.
29
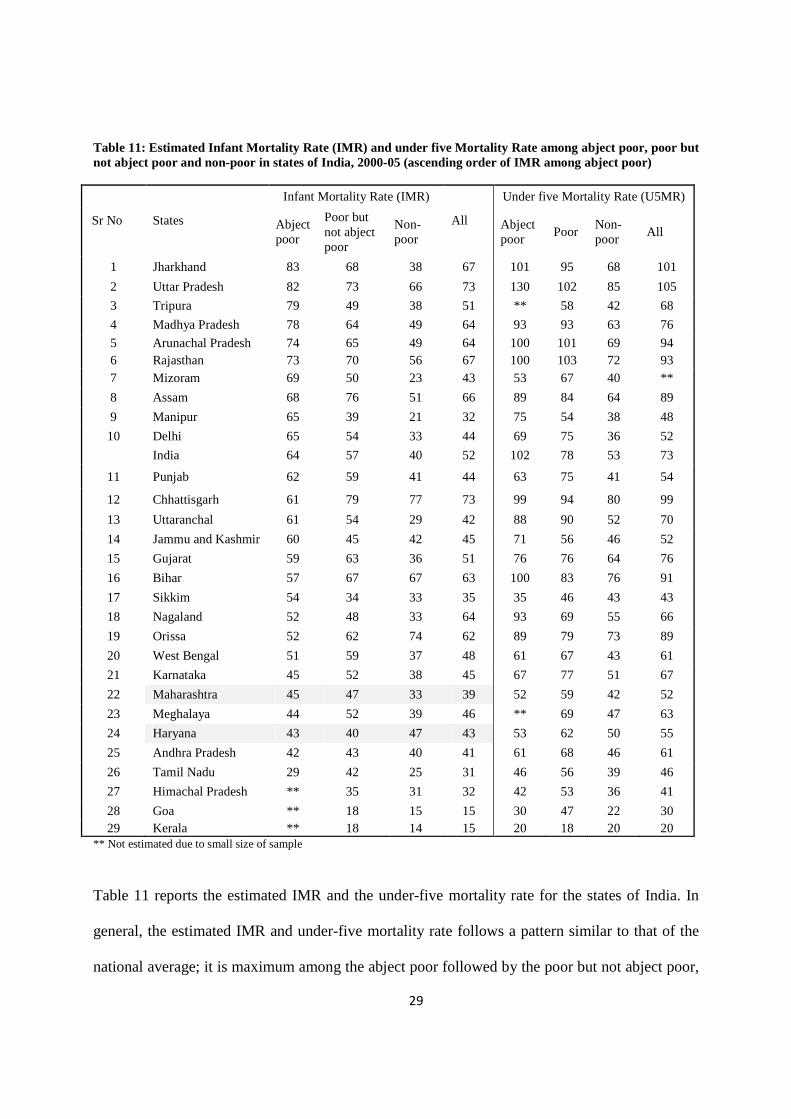
Table 11: Estimated Infant Mortality Rate (IMR) and under five Mortality Rate among abject poor, poor but not abject poor and non-poor in states of India, 2000-05 (ascending order of IMR among abject poor)
Infant Mortality Rate (IMR) Under five Mortality Rate (U5MR) Sr No States Abject
poor
Poor but not abject poor
Non- poor
All Abject
poor Poor
Non- poor
All
1 Jharkhand 83 68 38 67 101 95 68 101
2 Uttar Pradesh 82 73 66 73 130 102 85 105
3 Tripura 79 49 38 51 ** 58 42 68
4 Madhya Pradesh 78 64 49 64 93 93 63 76
5 Arunachal Pradesh 74 65 49 64 100 101 69 94 6 Rajasthan 73 70 56 67 100 103 72 93 7 Mizoram 69 50 23 43 53 67 40 **
8 Assam 68 76 51 66 89 84 64 89
9 Manipur 65 39 21 32 75 54 38 48
10 Delhi 65 54 33 44 69 75 36 52
India 64 57 40 52 102 78 53 73
11 Punjab 62 59 41 44 63 75 41 54
12 Chhattisgarh 61 79 77 73 99 94 80 99
13 Uttaranchal 61 54 29 42 88 90 52 70
14 Jammu and Kashmir 60 45 42 45 71 56 46 52
15 Gujarat 59 63 36 51 76 76 64 76
16 Bihar 57 67 67 63 100 83 76 91
17 Sikkim 54 34 33 35 35 46 43 43
18 Nagaland 52 48 33 64 93 69 55 66
19 Orissa 52 62 74 62 89 79 73 89
20 West Bengal 51 59 37 48 61 67 43 61
21 Karnataka 45 52 38 45 67 77 51 67
22 Maharashtra 45 47 33 39 52 59 42 52
23 Meghalaya 44 52 39 46 ** 69 47 63
24 Haryana 43 40 47 43 53 62 50 55
25 Andhra Pradesh 42 43 40 41 61 68 46 61
26 Tamil Nadu 29 42 25 31 46 56 39 46
27 Himachal Pradesh ** 35 31 32 42 53 36 41
28 Goa ** 18 15 15 30 47 22 30 29 Kerala ** 18 14 15 20 18 20 20
** Not estimated due to small size of sample
Table 11 reports the estimated IMR and the under-five mortality rate for the states of India. In
general, the estimated IMR and under-five mortality rate follows a pattern similar to that of the
national average; it is maximum among the abject poor followed by the poor but not abject poor,
30
and minimum among the non-poor. For example, the estimated IMR among the abject poor in
Jharkhand was 83 per 1000 live births compared to 68 among the poor but not abject poor and 38
among the non-poor. Similarly in Uttar Pradesh, the estimated IMR was 82 per 1000 live births
among the abject poor compared to 73 among the poor and 66 among the non-poor.
For comparative purposes, we have classified the states on the basis of differences of IMR
among the abject poor and the non-poor. We found that there are eight states, namely, Arunachal
Pradesh, Jharkhand, Tripura, Mizoram, Manipur, Uttaranchal, Madhya Pradesh and New Delhi,
where the differences are more than 25 points. There are ten mores states (Uttar Pradesh,
Rajasthan, Assam, Nagaland, Gujarat, West Bengal, Jammu and Kashmir, Punjab and Sikkim)
where the differences are between 10 to 25 points and in the remaining states, the differences are
small. This brought out the interstate differentials in IMR and U5MR within the country.
However, there are four states (out of 29 states) where the estimated IMR among the abject poor
or poor but not abject poor is lower than that of the non-poor. These states are Haryana, Bihar,
Chhattisgarh and Orissa. This is probably due to misreporting of infant deaths as the level of
female literacy is low in these states. These states also have higher estimates of IMR among the
poor but not abject poor, than among the abject poor. There are two more states, namely, Assam
and Meghalaya where the estimated IMR among the abject poor is lower by 5 points or more, to
those of poor but not abject poor, probably due to lower sample size. The pattern is similar for
the under-five mortality rate. We have not provided the estimated IMR of the abject poor in the
states of Himachal Pradesh, Goa and Kerala because the size of the sample is small. The standard
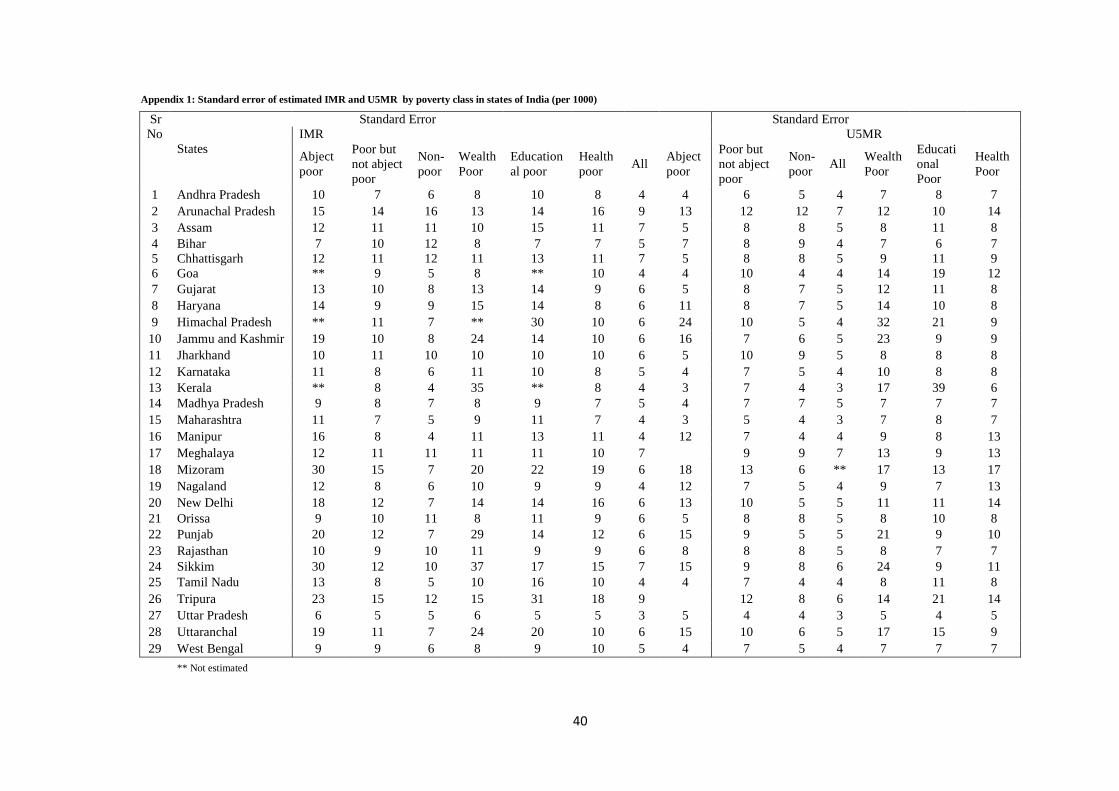
error of IMR and U5MR by poverty class is also shown in Appendix 1.
31
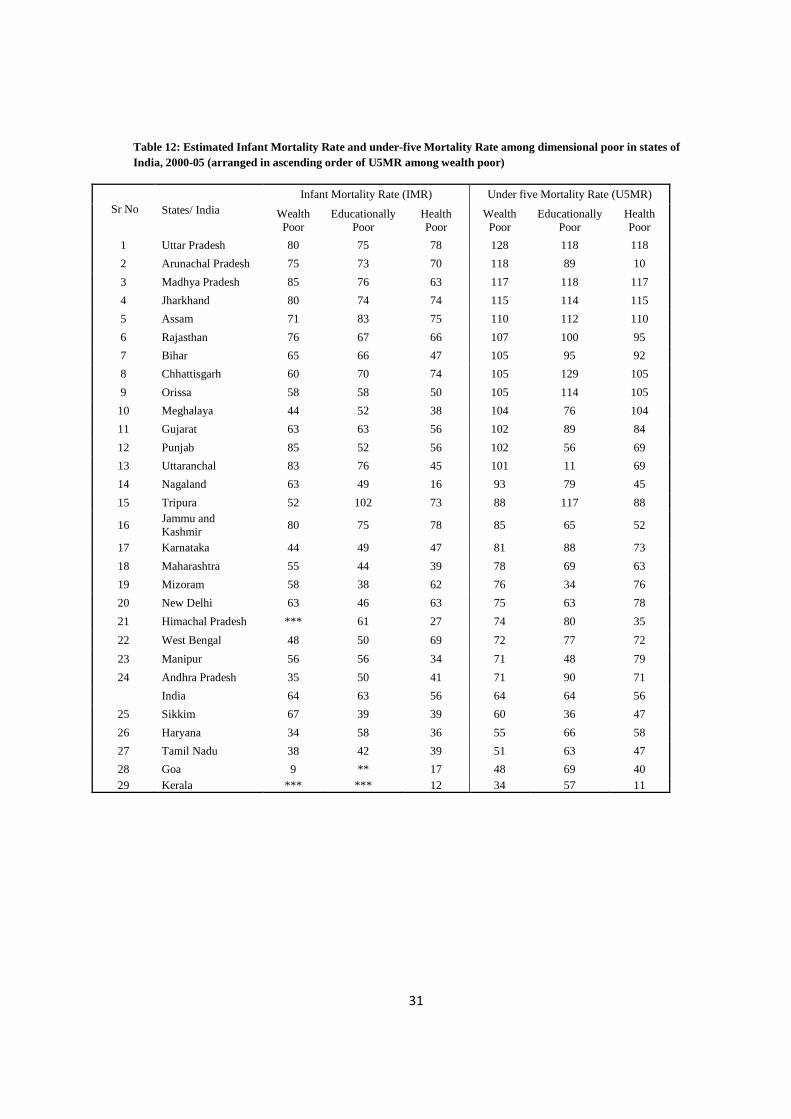
Table 12: Estimated Infant Mortality Rate and under-five Mortality Rate among dimensional poor in states of India, 2000-05 (arranged in ascending order of U5MR among wealth poor)
Infant Mortality Rate (IMR) Under five Mortality Rate (U5MR) Sr No States/ India Wealth
Poor Educationally
Poor Health Poor
Wealth Poor
Educationally Poor
Health Poor
1 Uttar Pradesh 80 75 78 128 118 118
2 Arunachal Pradesh 75 73 70 118 89 10
3 Madhya Pradesh 85 76 63 117 118 117
4 Jharkhand 80 74 74 115 114 115
5 Assam 71 83 75 110 112 110
6 Rajasthan 76 67 66 107 100 95
7 Bihar 65 66 47 105 95 92
8 Chhattisgarh 60 70 74 105 129 105
9 Orissa 58 58 50 105 114 105
10 Meghalaya 44 52 38 104 76 104
11 Gujarat 63 63 56 102 89 84
12 Punjab 85 52 56 102 56 69
13 Uttaranchal 83 76 45 101 11 69
14 Nagaland 63 49 16 93 79 45
15 Tripura 52 102 73 88 117 88
16 Jammu and Kashmir
80 75 78 85 65 52
17 Karnataka 44 49 47 81 88 73
18 Maharashtra 55 44 39 78 69 63
19 Mizoram 58 38 62 76 34 76
20 New Delhi 63 46 63 75 63 78
21 Himachal Pradesh *** 61 27 74 80 35
22 West Bengal 48 50 69 72 77 72
23 Manipur 56 56 34 71 48 79
24 Andhra Pradesh 35 50 41 71 90 71
India 64 63 56 64 64 56
25 Sikkim 67 39 39 60 36 47
26 Haryana 34 58 36 55 66 58
27 Tamil Nadu 38 42 39 51 63 47
28 Goa 9 ** 17 48 69 40 29 Kerala *** *** 12 34 57 11
32
We examined the differentials in IMR and under-five mortality rate with respect to education,
health and wealth poor and non-poor (Table 10 and Table 12). We found that there are no
significant differences in both IMR and U5MR with respect to the wealth poor and the education
poor at the national level. However, the estimates are marginally lower among the health poor
compared to the wealth poor or education poor. For example, the estimated IMR among the
education and wealth poor households was 64 each per 1000 live births and 56 among the health
poor. However, at the state level there is a mixed pattern. There are twelve states where the
estimates of IMR among the educational poor are the same or more than those among the wealth
poor. These states are Tripura, Assam, Chhattisgarh, Bihar, Gujarat, Orissa, Haryana, Manipur,
Meghalaya, West Bengal, Karnataka and Tamil Nadu. Similarly, there are eight states namely,
Tripura, Assam, West Bengal, Andhra Pradesh, Karnataka, New Delhi, Tamil Nadu and
Mizoram where the estimated IMR among the health poor is more than that of the wealth poor.
In all other states, the IMR among the wealth poor is higher than that of the educationally poor
and health poor. Even in these states, the level of IMR is quite high among the educationally
poor or health poor. The pattern is similar with respect to U5MR.
4. Discussion
With the evolution of the human development paradigm (UNDP 1990) and the capability
deprivation (Sen 1985, 1999), a shift from money metric poverty to multidimensional poverty
has been envisaged in national and international development agenda. However, the
measurement and application of multidimensional poverty is limited in many developing
countries including India. Though there are concerted efforts to alleviate multidimensional
poverty through various developmental schemes like the National Rural Health Mission
33
(NRHM), the National Rural Employment Guarantee Scheme (NREGS), Sarva Siksha Abhiyan
(SSA), the official estimates of poverty in India are still confined to money-metric poverty,
derived from consumption expenditure data.
In this paper, we have attempted to estimate multidimensional poverty in India using the most
recent round of National Family and Health Survey data and examined the state of child health
among the abject poor, poor but not abject poor and non-poor households. The choices of
indicators are context specific and subject to the availability of data. However, many of the
indicators we have used are commonly used and available in a large number of developing
countries. Four of the health care and child health indicators used in the analyses (medical
assistance at delivery, coverage of measles vaccination, the infant mortality rate and the under-
five mortality rate) are the monitoring indicators of MDGs. We have used the most simplified
and practical method of deriving dimensional poor; multidimensional poverty is derived using
the union approach. Our results show that about half of India’s population is poor and one-fifth
are abject poor (poor in two or all three dimensions) with large rural-urban and inter-state
differentials. These estimates are substantially higher compared to the official estimates of
poverty for all the states of India. We found that abject poor households had limited access to
financial institutions, health insurance schemes and that a higher proportion of abject poor are
excluded from the poverty eradication program. The findings of higher poverty among female
headed households, large households and households with little or no education (of head of
household) are consistent with the findings from other studies. The correlations of wealth and
education poor are higher than that of wealth and health. The extent of abject poverty and overall
poverty is maximum in the state of Bihar and minimum in the state of Kerala. It follows the
general state of human development observed among the states of India (Planning Commission
34
2004). With respect to health care utilization, the poorest of the poor (abject poor) are the
disadvantaged in all states with the exception of Kerala. When we compared the three fold
differentials (among abject poor and non-poor) in health care utilization with that of wealth
quintiles as defined in NFHS 3 (fifth and first quintiles), we found that our differences are large
which validates the utility of deriving multidimensional poverty. The estimated infant mortality
rate and the under-five mortality rate are substantially higher among the abject poor compared to
the poor and non-poor across all states. Further, we observed that there are no significant
differentials in estimates of IMR and under-five mortality rate among the education poor and
wealth poor households and the differences with health poor households are marginally lower
than that of the wealth poor at the national level. At the state level, there are varying patterns
with twelve states having equal or higher estimated IMR among the education poor compared to
the wealth poor. Similarly, there are eight states where the estimated IMR among the health poor
is higher than that of the wealth poor. This indicates that all these dimensions are equally
important in devising strategies to promote child survival and calls for integrating
multidimensional poverty in planning and program implementation. Further, the large
differentials in health care utilization, the infant mortality rate and the under-five mortality rate
among the abject poor and poor not only validates our measure of multidimensionality poverty
but also depicts the poor state of child health in the country. This differential holds good by place
of residence and among the states. We acknowledge that this study could not provide the
estimates of infant and child mortality for the smaller states in India because the size of the
sample was small and limited to the indicators available in the data set.
From policy perspectives, multidimensional poverty clearly demonstrates the multiple
deprivation of a household in the key domain of human development, that is, education, health
35
and living standard and its linkage with inequality in health care utilization and health of the
population. The multidimensional poverty index will serve better for policy formulation as it can
address the growing inequality in health care utilization and health outcome among population
sub-groups in the country effectively. The large differentials in health care utilization and child
survival among abject poor and non-poor (for example three-fifth of births among abject poor
received a medical assistance compared to one-fifth among the abject poor) clearly demonstrate
the utility of focusing multiple deprivations in policy and program to reduce inequality in
healthcare utilization. Also, the small differences in IMR and U5MR among the education poor,
wealth poor and health poor demonstrated that the MDGs are interconnected and therefore the
need to address these together.
5. Research and Policy Implications
The implications of the findings of this study are both for research and policy. With respect to
research, the paper demonstrated the robust measurement of multidimensional poverty and its
linkages with child survival and health care utilization using data from a large scale population
based survey. The selection of indicators is illustrative and contextual. We recommend that data
collected in a number of population based surveys such as the Demographic and Health Surveys
(DHS), World Health Survey (WHS), the Multiple Indicator Cluster Surveys (MICS) etc can be
used to develop the measurement of multidimensional poverty at national and sub-national
levels. It is also useful to link multidimensional poverty with process and outcome indicators
such as health care utilization, health and health inequality in the population and derive
inferences for evidence based planning.
36
Based on the findings, the foremost policy implication from the study is to take note of the
exclusion of a high proportion of the abject poor in BPL programs which are specifically
designed for conditional cash transfer and eradicating extreme poverty. That only two-fifths of
abject poor households had a BPL card is an indication that majority of the poor are excluded
from the poverty eradication program. Hence, the inclusion criterion and the transparency in the
allocation of BPL cards need to be examined so as to reduce poverty. Second, we recommend
moving from the long contested measure of consumption poverty to multidimensional poverty in
planning and program implementation of the centre and state governments, by developmental
agencies and various organizations. The Planning Commission has already recognized the
multidimensional nature of poverty. We suggest more research to be undertaken so as to arrive at
more precise estimates of poverty. We also suggest in using multidimensional poverty as one of
the criteria in the transfer of fiscal resources from the centre to the state. Among other factors,
the 13th Finance Commission recommended deprivation and percentage of Scheduled Castes and
Tribes in rural areas (based on 2001 census) as criteria in the transfer of central funds to the
states (Ministry of Finance 2009). We suggest using scientific measures as illustrated in the
analyses and increase the weightage of deprivation in transfer of resources. Given the federal
structure and diversity in socio economic development in India, there is a need for general
consensus among the states of India to fight poverty together. Such a collective effort and
consensus among the states of India will be similar to the commitment of developing and
developed countries in achieving the MDGs. Finally we recommend protective measures in
health care utilization for the abject poor irrespective of caste, creed, religion and space so as to
address the equity issues to realize the MDGs.
37
References
Alkire Sabina. (2007). The missing dimensions of poverty data: Introduction to the special issue, Oxford Development Studies, 35 (4), 347-359.
Alkire Sabina and James Foster,(2009). Counting and multidimensional poverty measures, OPHI
Working Paper No 7.5. Booysen F; Michael Von Maltitz & Gideon Du Rand.(2008). Using an asset index to assess
trends in poverty in seven Sub-Saharan African countries. World Development, 36(6), 1113-1130.
Bourguignon, F and Chakravarty, S.R. (2003). The measurement of multidimensional poverty,
Journal of Economic Inequality, 1(1), 25-49. Calvo Cesar. (2008). Vulnerability to Multidimensional Poverty: Peru, 1998-2002, World
Development, 36(6), 1011-1020. Deutsch, J; and Silber, J.(2005). Measuring multidimensional poverty: An empirical comparison
of various approaches. Review of Income and Wealth, 5(1), 145-174. Filmer, D. and Pritchett, L.H. (2001). Estimating wealth effects without expenditure data- or
tears: An application to educational enrolments in states of India, Demography, 38 (1), 115-132.
Gwatkin, D.R. (2005). How much would poor people from faster progress towards the
millennium development goals for health? Lancet, 365,813-817 Gordon, D; Namdy, S., Pantazis, C., Pemberton, S. and Towsend, P. (2003). The distribution of
child poverty in the developing world, Bristol: Centre for International Poverty Research Hatt L.E, Waters H.R.( 2006). Determinants of child mortality in Latin America: a pooled
analysis of interactions between parental education and economic status. Social Science Medicine, 62 (2), 375-386.
International Institute for Population Sciences (IIPS) and Macro International.,(2007). National
Family Health Survey (NFHS 3), 2005-06; India: Volume I. Mumbai: IIPS. International Institute for Population Sciences (IIPS) and Macro International.,(2007). National
Family Health Survey (NFHS 3), 2005-06; India: Volume II. Mumbai: IIPS. Klasen, S. (2000). Measuring poverty and deprivation in South Africa, Review of Income and
Wealth, 46 (1), 33-58. Ministry of Health and Family Welfare(MOHFW). (2005). National Rural Health Mission (2005-12). Department of Family Welfare, Govt. of India, New Delhi, India.
38
Finance. (2009). Report of the Thirteenth Finance Commission 2010-15, Vol (1), Department of Economic Affairs, Govt. of India, new Delhi, India
Mohanty, S.K. (2009). Alternate Wealth Index and Health Estimates in India, Genus, 65 (2),113-137 Mohanty S.K and Praveen K. Pathak . (2009). Rich-poor gap in utilization of reproductive and
child health care services in India, 1992-2005”, Journal of Biosocial Sciences, 41(3),381-398.
Planning Commission, Government of India. (2007). Poverty estimates for 2004-05, accessed on
line: http://planningcommission.nic.in/news/prmar07.pdf. Planning Commission, Government of India. (2009). Report of the expert group to review the
methodology for estimation of poverty Ram F, S.K. Mohanty & Usha Ram. (2009). Understanding the distribution of BPL cards: All-
India and selected states, Economic Political Weekly, 44 (7), 66-71. Rutstein S. (2000). “Factors associated with trends in infant and child mortality in developing
countries during the 199s”. Bulletin of the World Health Organsiation 2000; 78(10): 1256-1270
Rutstein, S., Johnson, K.(2004).The DHS Wealth Index in DHS Comparative Reports. ORC Macro.
Sahn,D.E; & Stifel, D.C.(2000).Poverty comparison over-time and across countries in Africa.
World Development, 28(12), 2123-2155. Sen, A.K.(1992). Inequality reexamined. Cambridge: Harvard University Press. Sen, A.K.(1999). Development as freedom. New York: Knoff Press Srinivasan K and Mohanty S.K.(2008). “Household deprivation and its linkages with
reproductive and child health care and health outcome, Economic Political Weekly, 43 (48), 67-76
Sundaram, K. (2003). On identification of households below poverty line: some comments on
the proposed methodology, Economic and Political Weekly, 38 (9), 896-902. UNDP . (1990). Human Development Report, Oxford University Press, New York UNDP. (1997). Human Development Report, Oxford University Press, New York UNDP (2010) . Human Development Report, Palgrave Macmillan, New York Wagle .U. (2008). “Multidimensional poverty: An alternative measurement approach for the
United states?”, Social Science Research, 37, 559-580.
39
Wang Limin . (2003). “Determinants of child mortality in LDCs: Empirical findings from demographic and health surveys”, Health Policy, 65 (3), 277-299.
You danzhen, Tessa Wardlaw, Peter Salama, Gareth Jones .(2009). Levels and trends in under-5
mortality, 1990-2008, Lancet S 0140-6736(09), 61601-9
40
Appendix 1: Standard error of estimated IMR and U5MR by poverty class in states of India (per 1000) Standard Error Standard Error
IMR U5MR Sr No
States
Abject poor
Poor but not abject poor
Non- poor
Wealth Poor
Educational poor
Health poor
All Abject poor
Poor but not abject poor
Non- poor
All Wealth Poor
Educational Poor
Health Poor
1 Andhra Pradesh 10 7 6 8 10 8 4 4 6 5 4 7 8 7 2 Arunachal Pradesh 15 14 16 13 14 16 9 13 12 12 7 12 10 14 3 Assam 12 11 11 10 15 11 7 5 8 8 5 8 11 8 4 Bihar 7 10 12 8 7 7 5 7 8 9 4 7 6 7 5 Chhattisgarh 12 11 12 11 13 11 7 5 8 8 5 9 11 9 6 Goa ** 9 5 8 ** 10 4 4 10 4 4 14 19 12 7 Gujarat 13 10 8 13 14 9 6 5 8 7 5 12 11 8 8 Haryana 14 9 9 15 14 8 6 11 8 7 5 14 10 8 9 Himachal Pradesh ** 11 7 ** 30 10 6 24 10 5 4 32 21 9 10 Jammu and Kashmir 19 10 8 24 14 10 6 16 7 6 5 23 9 9 11 Jharkhand 10 11 10 10 10 10 6 5 10 9 5 8 8 8 12 Karnataka 11 8 6 11 10 8 5 4 7 5 4 10 8 8 13 Kerala ** 8 4 35 ** 8 4 3 7 4 3 17 39 6 14 Madhya Pradesh 9 8 7 8 9 7 5 4 7 7 5 7 7 7 15 Maharashtra 11 7 5 9 11 7 4 3 5 4 3 7 8 7 16 Manipur 16 8 4 11 13 11 4 12 7 4 4 9 8 13 17 Meghalaya 12 11 11 11 11 10 7 9 9 7 13 9 13 18 Mizoram 30 15 7 20 22 19 6 18 13 6 ** 17 13 17 19 Nagaland 12 8 6 10 9 9 4 12 7 5 4 9 7 13 20 New Delhi 18 12 7 14 14 16 6 13 10 5 5 11 11 14 21 Orissa 9 10 11 8 11 9 6 5 8 8 5 8 10 8 22 Punjab 20 12 7 29 14 12 6 15 9 5 5 21 9 10 23 Rajasthan 10 9 10 11 9 9 6 8 8 8 5 8 7 7 24 Sikkim 30 12 10 37 17 15 7 15 9 8 6 24 9 11 25 Tamil Nadu 13 8 5 10 16 10 4 4 7 4 4 8 11 8 26 Tripura 23 15 12 15 31 18 9 12 8 6 14 21 14 27 Uttar Pradesh 6 5 5 6 5 5 3 5 4 4 3 5 4 5 28 Uttaranchal 19 11 7 24 20 10 6 15 10 6 5 17 15 9 29 West Bengal 9 9 6 8 9 10 5 4 7 5 4 7 7 7 ** Not estimated