Embed Size (px)
Citation preview
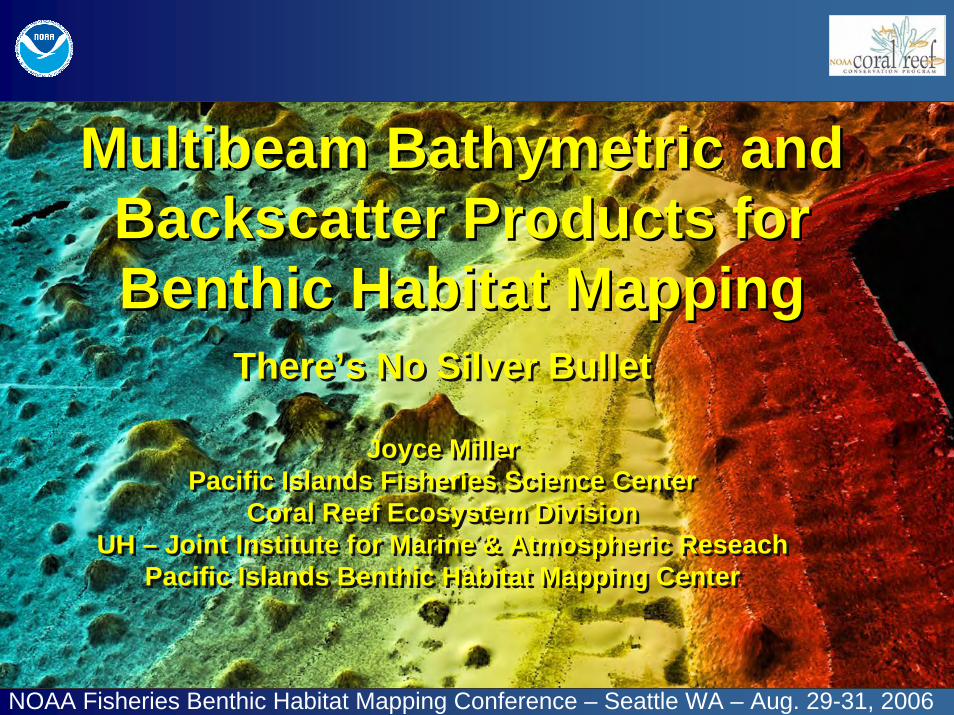
Multibeam Bathymetric and Backscatter Products for Benthic Habitat Mapping
Multibeam Bathymetric and Backscatter Products for Benthic Habitat Mapping
There’s No Silver Bullet
Joyce MillerPacific Islands Fisheries Science Center
Coral Reef Ecosystem DivisionUH – Joint Institute for Marine & Atmospheric Reseach
Pacific Islands Benthic Habitat Mapping Center
There’s No Silver Bullet
Joyce MillerPacific Islands Fisheries Science Center
Coral Reef Ecosystem DivisionUH – Joint Institute for Marine & Atmospheric Reseach
Pacific Islands Benthic Habitat Mapping Center
NOAA Fisheries Benthic Habitat Mapping Conference – Seattle WA – Aug. 29-31, 2006

U.S. Coral Reef Task Force GoalU.S. Coral Reef Task Force Goal
Produce comprehensive digital maps of all shallow (<30m) coral reef ecosystems in the
United States and characterize priority moderate-depth reef
systems by 2009.

R/V AHI R/V R/V AHI AHI NOAA Ship Hi’ialakaiNOAA Ship NOAA Ship HiHi’’ialakaiialakai
Pacific Moderate Depth MappingPacific Moderate Depth Mapping
30 kHz EM300
5000 m range135 beams
300 kHz EM3002D
150 m range250-500 “soundings”
240 kHz Reson 8101ER
250 m range101 beams

Multibeam Coverage Since 2001
NWHI (2002/KM) 38,367 km2
NWHI (2003-2006) 2,821 km2
MHI (2005-2006) 2,505 km2
CNMI/Guam (2003) 244 km2
Am. Samoa (2004-2006) 1,385 km2
PRIAs (2006) 3,793 km2
Total 49,115 km2
(14,319 nm2)
NWHI (2002/KM) 38,367 km2
NWHI (2003-2006) 2,821 km2
MHI (2005-2006) 2,505 km2
CNMI/Guam (2003) 244 km2
Am. Samoa (2004-2006) 1,385 km2
PRIAs (2006) 3,793 km2
Total 49,115 km2
(14,319 nm2)

U.S. Pacific Islands:U.S. Pacific Islands: Vast and RemoteVast and Remote
Monitoring & Mapping ~55 Island/Atoll Ecosystems
(6)
(18)
Wake Island(24)
*********SaipanSaipanSaipan
French Frigate Shoals
French French Frigate Frigate ShoalsShoals
Penguin BankPenguin BankPenguin Bank
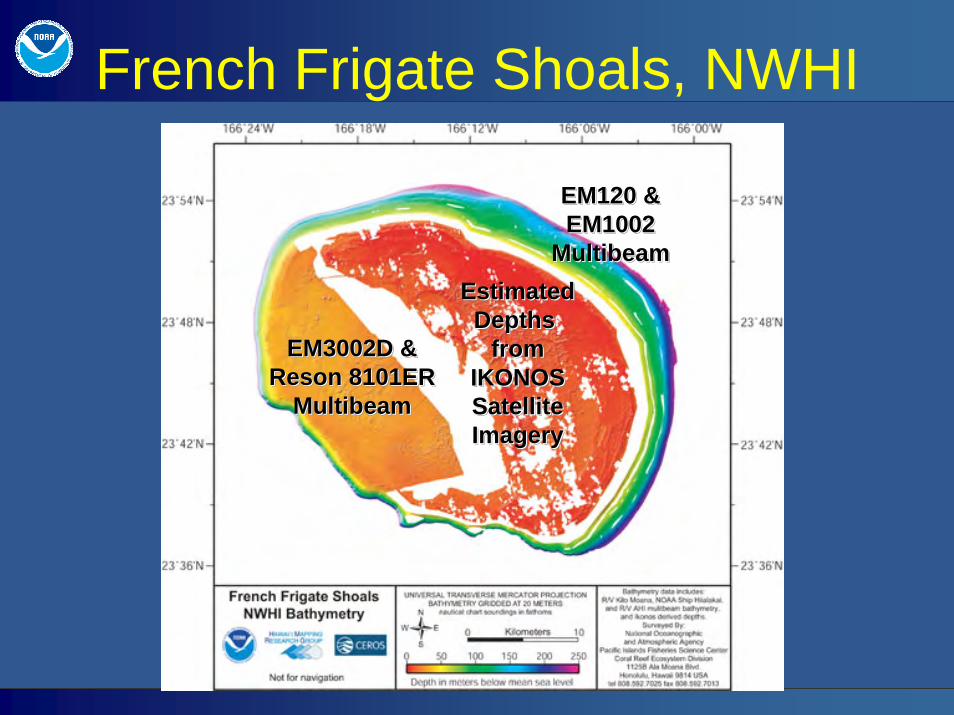
French Frigate Shoals, NWHI
EstimatedDepths
fromIKONOSSatelliteImagery
EstimatedEstimatedDepths Depths
fromfromIKONOSIKONOSSatelliteSatelliteImageryImagery
EM120 &EM1002
Multibeam
EM120 &EM120 &EM1002EM1002
MultibeamMultibeam
EM3002D &Reson 8101ER
Multibeam
EM3002D &EM3002D &Reson 8101ERReson 8101ER
MultibeamMultibeam

French Frigate Shoals, NWHI,Bank top bathymetry
2 m grid cell size
FledermausFledermaus Image Image (next slide)(next slide)

What are we looking for?
Fledermaus Image FledermausFledermaus Image Image
10 m coral pinnacles10 m coral pinnacles10 m coral pinnacles
0.5 m sand waves0.5 m sand waves0.5 m sand waves
0.1-0.2 m roughness0.10.1--0.2 m roughness0.2 m roughness
Complex morphology at edge of bank
Complex morphology Complex morphology at edge of bankat edge of bank
2-m grid of coral-rich bank top in 20-45 m water depths – French Frigate Shoals, NWHI22--m grid of coralm grid of coral--rich bank top in 20rich bank top in 20--45 m water depths 45 m water depths –– French Frigate Shoals, NWHIFrench Frigate Shoals, NWHI

5x Slope & Complexity
Complexity is derived by taking a slope of a 5x exaggerated slope (2nd derivative). A GIS Recipe for Determining Benthic Complexity: Jeff Ardron, Marine Geography, 2002.
Complexity is derived by taking a slope of a 5x exaggerated slopComplexity is derived by taking a slope of a 5x exaggerated slope (2e (2ndnd derivative). derivative). A GIS Recipe for Determining Benthic Complexity: Jeff Ardron, Marine Geography, 2002.
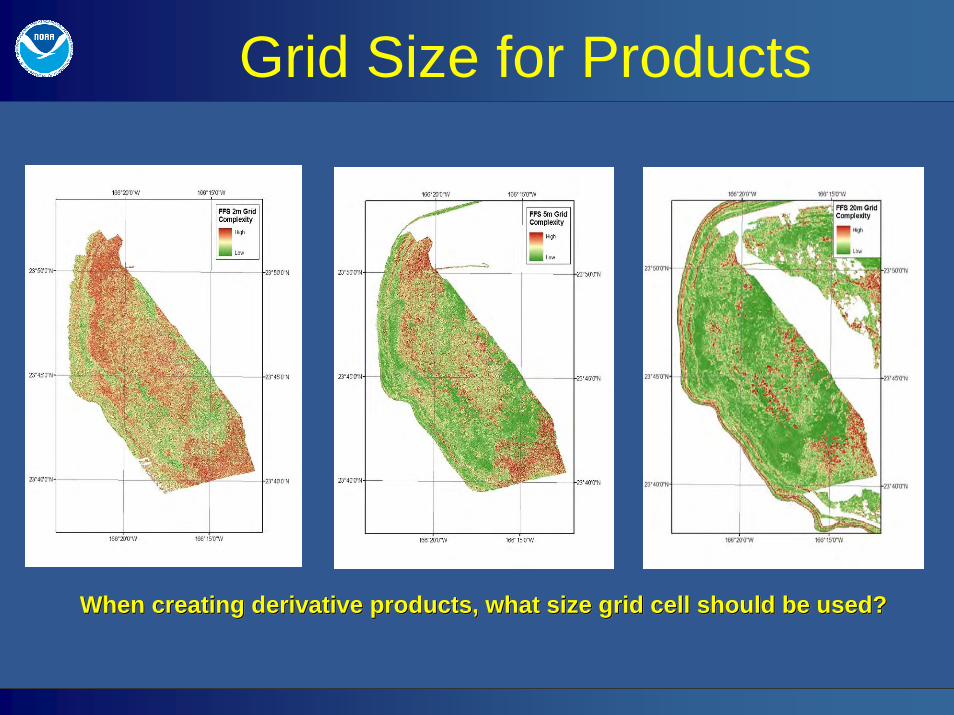
Grid Size for Products
When creating derivative products, what size grid cell should be used?When creating derivative products, what size grid cell should beWhen creating derivative products, what size grid cell should be used?used?
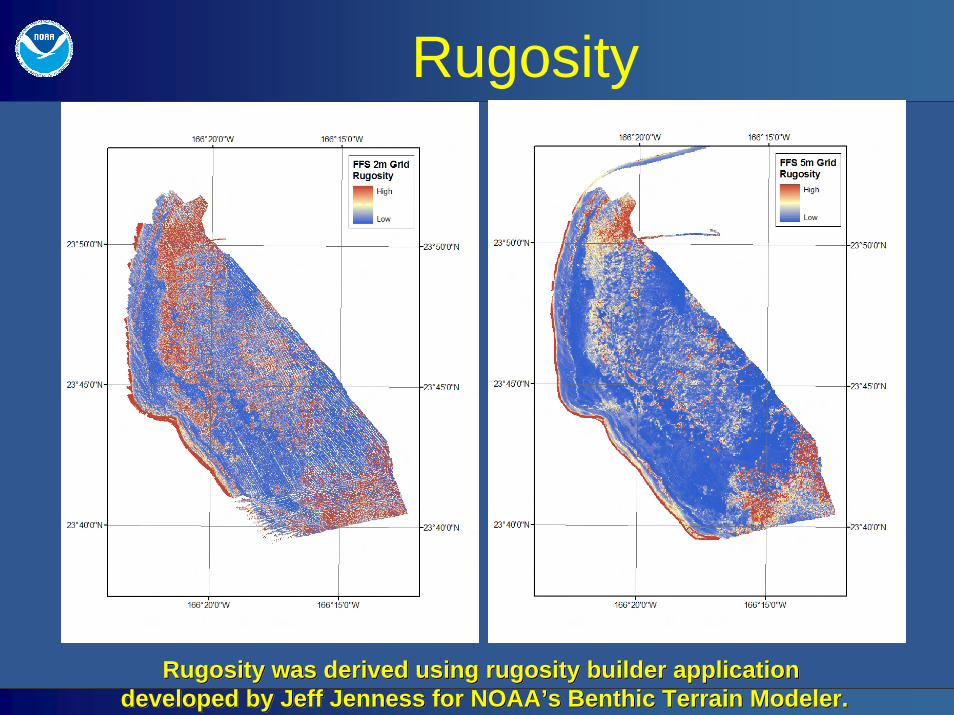
Rugosity
Rugosity was derived using rugosity builder application developed by Jeff Jenness for NOAA’s Benthic Terrain Modeler.
Rugosity was derived using rugosity builder application Rugosity was derived using rugosity builder application developed by Jeff developed by Jeff JennessJenness for NOAAfor NOAA’’s Benthic Terrain Modeler.s Benthic Terrain Modeler.
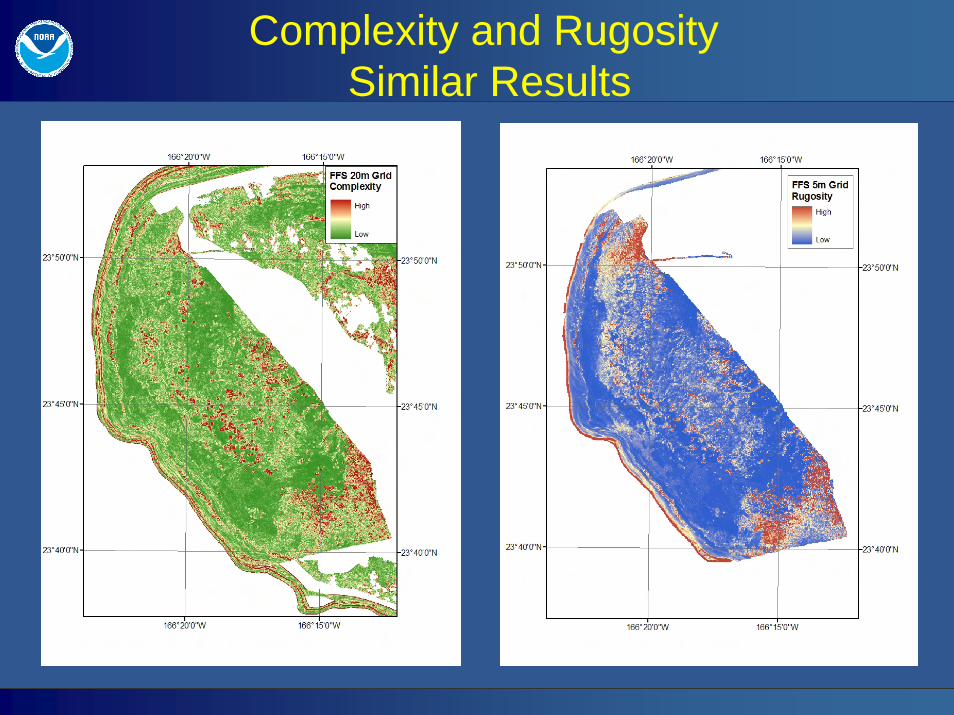
Complexity and RugositySimilar Results

R/V AHI Reson 8101
240-kHz backscatter
Backscatter from EM3002D (300 kHz) & Reson 8101 (240 kHZ)Backscatter from EM3002D (300 kHz) & Reson 8101 (240 Backscatter from EM3002D (300 kHz) & Reson 8101 (240 kHZkHZ))
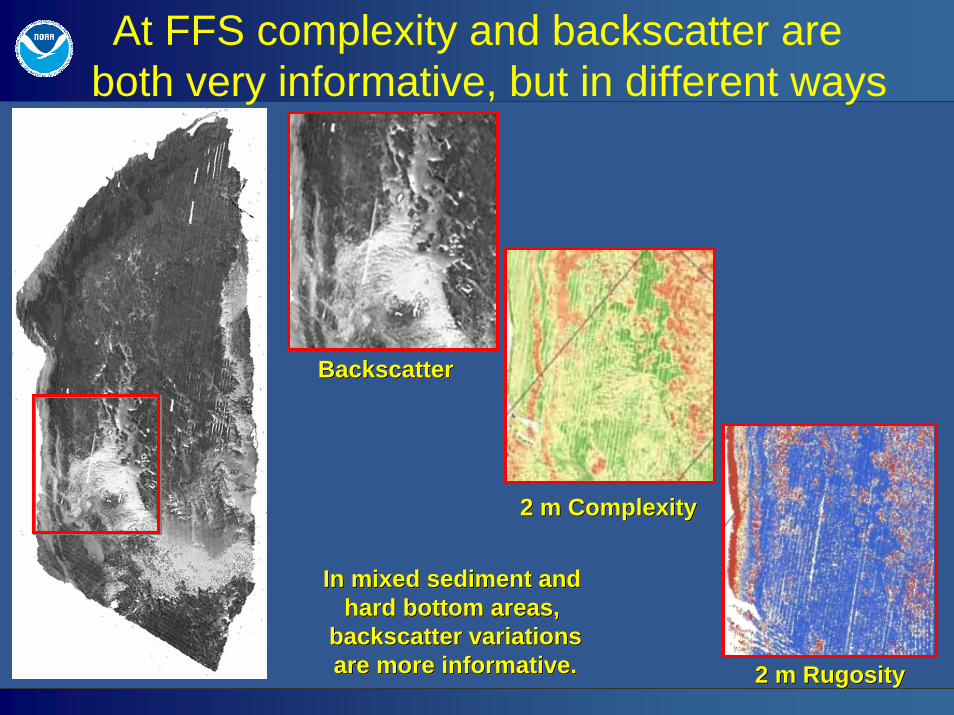
At FFS complexity and backscatter areboth very informative, but in different ways
In mixed sediment and hard bottom areas,
backscatter variationsare more informative.
In mixed sediment and In mixed sediment and hard bottom areas, hard bottom areas,
backscatter variationsbackscatter variationsare more informative.are more informative.
BackscatterBackscatterBackscatter
2 m Complexity2 m Complexity2 m Complexity
2 m Rugosity2 m Rugosity2 m Rugosity
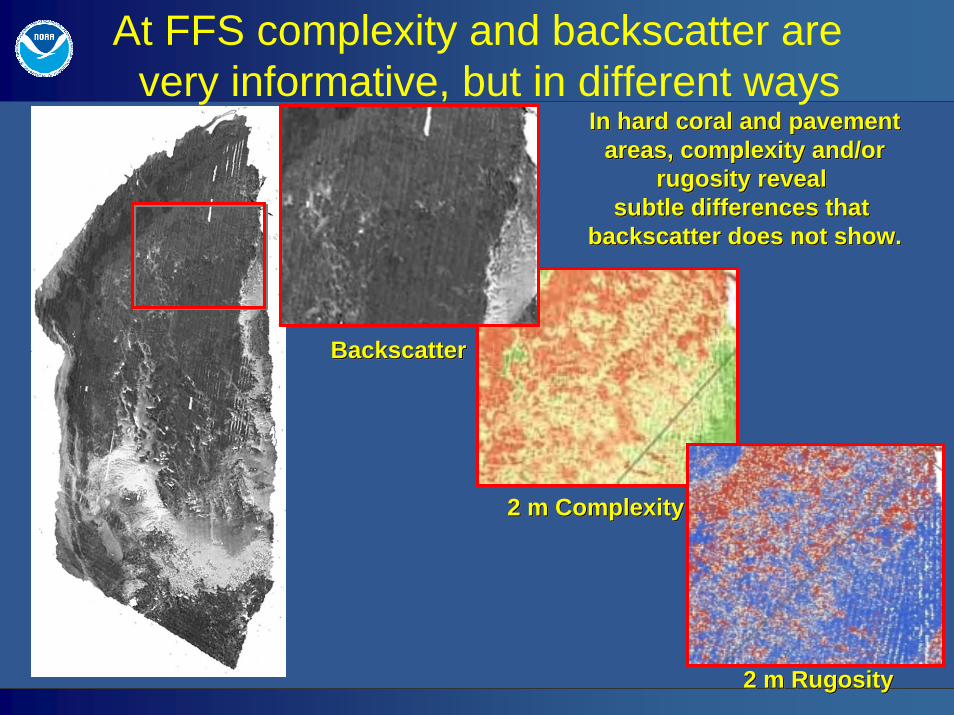
At FFS complexity and backscatter arevery informative, but in different ways
In hard coral and pavementareas, complexity and/or
rugosity reveal subtle differences that
backscatter does not show.
In hard coral and pavementIn hard coral and pavementareas, complexity and/orareas, complexity and/or
rugosity reveal rugosity reveal subtle differences that subtle differences that
backscatter does not show.backscatter does not show.
BackscatterBackscatterBackscatter
2 m Complexity2 m Complexity2 m Complexity
2 m Rugosity2 m Rugosity2 m Rugosity

Saipan Garapan Anchorage, CNMISaipan Garapan Anchorage, CNMI

Saipan Depth and 5x Slope

Saipan Complexity and BathymetricPosition Index (Feature Classification)
NOAA’s Benthic Terraine Modeler BPINOAANOAA’’s Benthic s Benthic TerraineTerraine Modeler BPIModeler BPI
Lundblad et al, 2006, A benthic terrain classification scheme for American Samoa, Marine Geodesy, 29(2): 89-111.LundbladLundblad et al, et al, 2006, A benthic terrain classification scheme for American Samoa2006, A benthic terrain classification scheme for American Samoa, , Marine GeodesyMarine Geodesy, 29(2): 89, 29(2): 89--111.111.
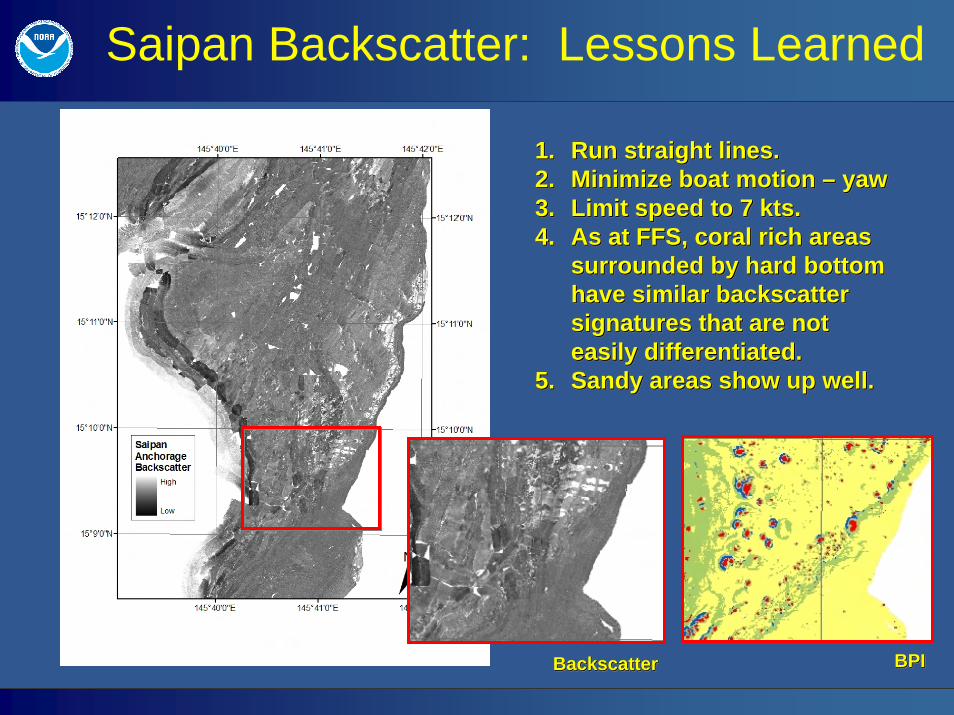
Saipan Backscatter: Lessons Learned
1. Run straight lines.2. Minimize boat motion – yaw3. Limit speed to 7 kts.4. As at FFS, coral rich areas
surrounded by hard bottom have similar backscatter signatures that are not easily differentiated.
5. Sandy areas show up well.
1.1. Run straight lines.Run straight lines.2.2. Minimize boat motion Minimize boat motion –– yawyaw3.3. Limit speed to 7 Limit speed to 7 ktskts..4.4. As at FFS, coral rich areas As at FFS, coral rich areas
surrounded by hard bottom surrounded by hard bottom have similar backscatter have similar backscatter signatures that are not signatures that are not easily differentiated. easily differentiated.
5.5. Sandy areas show up well.Sandy areas show up well.
BackscatterBackscatterBackscatter BPIBPIBPI
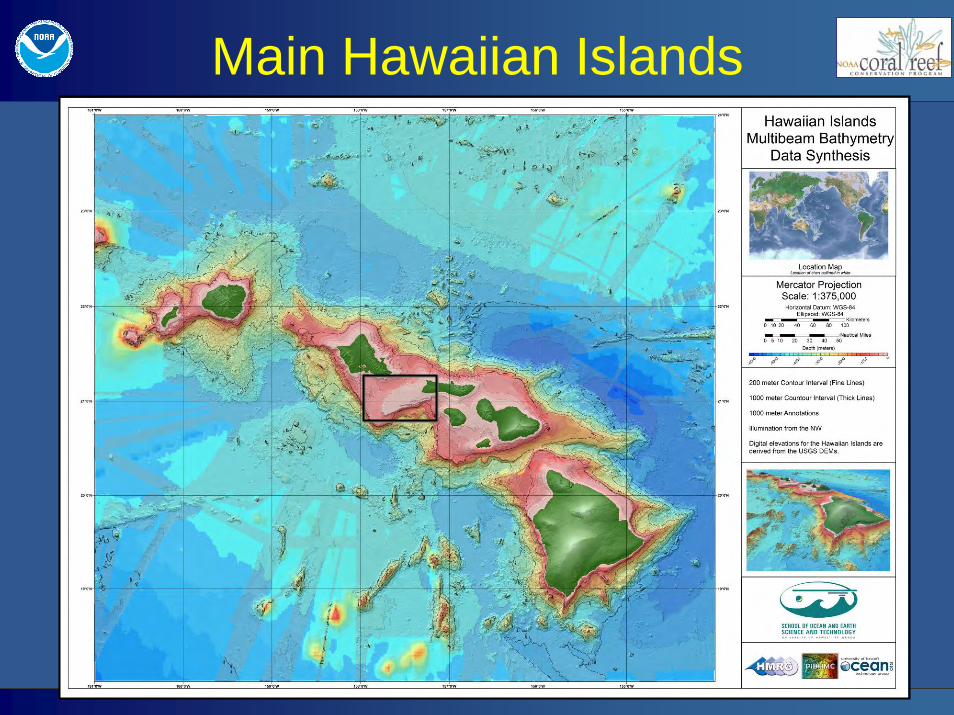
Main Hawaiian Islands

Penguin Bank Bathymetryand Bathymetry Derivatives
DepthDepthDepth 5x Slope5x Slope5x Slope
RugosityRugosityRugosityComplexityComplexityComplexity

Penguin Bank Backscatter

Uses of Derived Productsfor Ecosystem-Based Management
With 22% of habitat still unmapped, there was a 56% correlation of whalesightings with slopes of less than 5% and a 67% correlation with low rugosity.
With 22% of habitat still unmapped, there was a 56% correlation With 22% of habitat still unmapped, there was a 56% correlation of whaleof whalesightings with slopes of less than 5% and a 67% correlation witsightings with slopes of less than 5% and a 67% correlation with low rugosity.h low rugosity.

Techniques Under Investigation
• An Empirical Approach to Mapping the Distribution of Seafloor Geologic and Biologic Characteristics Offshore San Pedro, Southern California, Dartnell et al., Ocean Sciences, Feb. 2006, Honolulu.
• AVO Analysis Of Multibeam Backscatter, An Example From Little Bay, NH And Skjalfandi Ba, Iceland, Fonseca, et al., Ocean Sciences, Feb. 2004, Honolulu.
• Seafloor Texture Analysis of Saipan Anchorage Bathymetry using Local Fourier Histogram (LFH) Texture Features, G. R. Cutter Jr., October 2004

For Information
http://www.soest.hawaii.edu/PIBHMCWebsites:http://www.pifsc.noaa.gov/cred
For information contact: [email protected]@noaa.gov
Websites:Websites: http://www.soest.hawaii.edu/PIBHMChttp://www.soest.hawaii.edu/PIBHMChttp://www.pifsc.noaa.gov/credhttp://www.pifsc.noaa.gov/cred
For information contact:For information contact: [email protected]@[email protected]@noaa.gov