Embed Size (px)
Citation preview
1
Multi-year and reference year weather data for building
energy labelling in North Italy climates
Giovanni Pernigottoa,b (*), Alessandro Pradaa, Daniel Cóstolab, Andrea
Gasparellaa and Jan L. M. Hensenb
a Free University of Bozen-Bolzano, Faculty of Science and Technology, Piazza
Università 5, 39100 Bolzano, Italy b Eindhoven University of Technology, Department of the Built Environment, Building
Physics and Services, Den Dolech 2, 5612 AZ Eindhoven, The Netherlands
(*) corresponding author:
email: [email protected]; phone: +39 0471 017095 / +39 0471 017632;
fax: +39 0471 017009; mail: Free University of Bozen-Bolzano, Faculty of Science and
Technology, Piazza Università 5, 39100 Bolzano, Italy
Abstract
Representative weather information is essential for a reliable building energy
performance evaluation. Even if detailed energy analyses can be carried out considering
the multi-year weather data, generally a single reference year is adopted. Thus, this
artificial year has to correctly approximate the typical multi-year conditions. In this
work, we investigate the representativeness of the method described in the technical
standard EN ISO 15927-4:2005 for the development of reference years. Energy
performance of a set of different simplified buildings is simulated for 5 North Italy
locations using TRNSYS. The energy needs computed using the reference year are
compared to those of a multi-year simulation. The annual variability of energy results
for the studied thermal zones is investigated, paying attention to its effects on the
Pernigotto, G., Prada, A., Cóstola, D., Gasparella, A. and Hensen, J.L.M. (2014). Multi‐year and reference year weather data for building energy labelling in north Italy climates, Energy and Buildings, vol. 72, pp. 62‐72. http://dx.doi.org/10.1016/j.enbuild.2013.12.012
2
building envelope energy ratings according to a proposed classification. Also, those
configurations more influenced by the annual weather changes are identified by means
of statistical indexes. The analyses demonstrate that the representativeness of the
reference year results can vary significantly in the considered locations – and,
consequently, the accuracy in building energy assessment and classification can be
reduced, especially for some building envelope configurations.
Keywords: Multi-year analysis, Test Reference Year, EN ISO 15927-4:2005, Building
Energy Simulation, Building Energy Rating.

3
1. Introduction
In many building design applications, the use of simplified calculation methods for the
evaluation of the energy consumption cannot provide results detailed enough for
advanced investigations. For instance, these approaches are not suitable to achieve both
high energy efficiency and adequate visual and thermal comfort for the occupants.
Consequently, the recourse to the detailed building energy simulation (BES) tools by
professionals is becoming more and more frequent. The higher capability in calculating
detailed outputs requires more complex and detailed inputs [1]. As regards the weather
data, the datasets of monthly mean values used in simplified methods, such as those of
dry bulb temperature, solar radiation and relative humidity in the Italian standard UNI
10349:1994 [2], are not sufficient for detailed simulation tools, which generally require
at least an hourly discretization of the weather data inputs. The problem of the
development of weather data for BES has been widely investigated in the literature and
Barnaby and Crawley discussed and presented the main aspects, contexts and issues
related to their definition [3].
We can distinguish three kinds of data for dynamic simulation [4]:
• multi-year weather data;
• typical or reference years;
• representative days.
The multi-year weather data are the best solution in trend and sensitivity analyses of
building performance to the variability of the weather conditions, especially if aimed at
a design robust to climatic changes [5]. Typical weather data years are simply a single
year of hourly data representative of the profiles recorded in a multi-year dataset. The
representative days are hourly data for some average days descriptive of the typical
climatic conditions (e.g., summer conditions). Simulations with typical years (or

4
representative days) instead of multi-year weather data lead to less information but they
are less time-consuming and results are easier to manage [6, 7]. They are also preferred
to mitigate the effects of missing or wrong data in the collected series. Eventually,
typical years are also necessary for assessing the building energy performance under
standard weather reference conditions, which are expected to be representative of the
multi-year series in a given location. Some previous studies observed that the variability
of buildings annual energy uses are less than 10 % in the multi-year period – between 4
% and 6 % for U.S. climates [8, 9] or 4.6 % for Hong-Kong [10]. Although the previous
studies are valid only for the climatic context and buildings analysed, they indicate that
a single reference year can generally be used to express the typical energy performance.
The reference years have been defined in different ways in the last decades. One of the
first definitions was given for 60 American localities [11]: the test reference year TRY
was an actual year selected using a process where years in the period 1948-1975 with
extremely high or low mean dry bulb temperatures were progressively eliminated until
only one year remained. Crawley [12] recommends using the typical meteorological
years (TMY), the European test reference years [3] or other typical years built according
to similar procedures instead of the original TRY of 1976. In these cases the reference
year is an artificial year composed of 12 months selected as the most representative in
the multi-year series. One of the first definitions of the typical year was given by Hall et
al. [13]. According to Lund [14-16] and Lund and Eidorff [17], they have to be
characterized by:
• true frequencies (i.e., the reference year should be a good approximation of the
mean values derived from a long period of measurements);
• true sequences (i.e., the weather situations must follow each other in a similar
manner to the recorded data);
5
• true correlations (i.e., the weather data are cross-correlated variables).
The last feature is probably one of the most important [18].
In the literature many approaches are available and there is not a single procedure
accepted for the construction of a reference year [19]. Each method starts from the
calculation of some statistics of the weather variables (e.g., mean dry bulb temperature,
daily solar radiation) for the selection of the representative month from the collected
data [13]. The relative importance of the different variables is given by weighting
factors, whose selection should be made considering the final use of the reference year,
for instance distinguishing sizing from energy assessment [20]. Most of the approaches
are based on the Finkelstein-Schafer statistic [21], with the exception of the method by
Festa and Ratto [22], which implements the Kolmogorov–Smirnov statistic. Among the
methods there is no agreement on the number of weather parameters to use. For
instance, as observed by Argiriou et al. [23], 9 weather parameters were considered in
the SANDIA method [13], while 7 were considered in the “Danish method” [17, 24]
and 5 were considered in the method by Festa and Ratto [22]. Moreover, there is no
general agreement on the weighting factors for the weather variables and some authors
remarked that they should be based also on the type of building analysed [25].
Different methods and groups of weighting factors for the determination of the
reference year were compared by many authors, considering the average results of the
multi-year series as benchmark. Weather statistics, solar fraction of thermal solar
systems, electrical power output of PV systems, heating and cooling degree-days,
energy needs or final uses were considered as indexes for the assessment of the
reference years [26-28]. Analysing different climates and applications, some authors
drew different conclusions. Implementing different approaches for the development of a
reference year for Damascus, Syria, Skeiker and Ghani observed that the selected

6
typical month can vary significantly [29]. Comparing the SANDIA, the “Danish” and
the Festa-Ratto methods for the evaluation of the reference years for 4 localities in
Thailand, Janjai and Deeyai concluded that there is no significant difference in solar
fractions and outputs of both thermal and PV solar systems [30]. In their study for the
location of Subang, Malaysia, Rahman and Dewsbury recommended to weight equally
the weather parameters in the calculation [31]. Studying the sensitivity of the energy
production of a PV module and building energy needs in Palermo, Sicily, to the chosen
method, Sorrentino et al. underlined that the best solution can be found using different
weights for the selection of the TRY months, in particular for the building energy need
evaluation [32]. Argiriou et al. assessed 17 different methodologies for the generation
of a reference year in the climate of Athens, Greece, and stated that the optimum choice
depends on the considered energy system (e.g., building or thermal solar system) and on
the focus of the analysis (e.g., heating or cooling demand, solar system output) [23].
In Italy, for the revision (currently in progress) of the technical standard UNI
10349:1994 reporting the weather data to use for energy calculations, the procedure
described in the European technical standard EN ISO 15927-4:2005 [33] was selected.
The dataset previously used in Italy was developed from weather data collected in
Italian airports from 1951 till 1970 and so it is far from being representative of the
current urban conditions. In order to improve the representativeness, instead of
modifying previous reference years, for instance to include the urban heat island effect
as done by Chan for Hong Kong [34], new data series have been collected in the urban
sites by the regional environmental protection agencies (ARPAs). This choice is also
coherent with the need to periodically update the weather dataset to account medium
and long term climate change trends [19, 35]. Although there are some cases for which
7
the new data collection started 20 years ago, for many Italian localities only a limited
number of years is generally available [36].
The selection method adopted for the Italian localities is based on the dry bulb
temperature, the solar radiation and the relative humidity as primary variables for the
determinations of a short list of eligible reference months and the wind speed as
secondary variable for the final selection. No different weighting coefficients are
considered for the primary variables even if the standard allows the user to build a new
test reference year (TRYEN) for specific purposes. The method of the technical standard
has already been implemented for the evaluation of the reference years in several
climates, as for instance for 7 localities in South Korea [37]. Moreover, for building
energy analyses, some authors tried to identify the optimum combination of weighting
factors to improve the standard procedure, such as those proposed by Kalamees et al. in
the Finnish climate [38].
In spite of the large literature on reference years, the impact of the EN ISO 15927-
4:2005 assumptions on the building energy labelling with BES tools is not deeply
investigated. In the present work, the EN ISO 15927-4:2005 method adopted in Italy for
the development of the new reference years based on the new data collected in urban
sites is applied for some localities in the northern regions of the country. The
representativeness issues are discussed both under the perspective of the weather
parameters and that of the energy needs of a sample of buildings, focusing on the
problem of the limited number of years available in the data series. Moreover, the
variability of the building energy performances in a multi-year period are studied
considering also the effects on the ratings of heating and cooling energy needs given by
the reference years. By means of statistical indexes, the correlations between the
envelope characteristics of the considered sample of buildings and the variability of the
8
weather data in the multi-year series are studied, in order to identify those
configurations sensitive to the change of the climatic conditions.
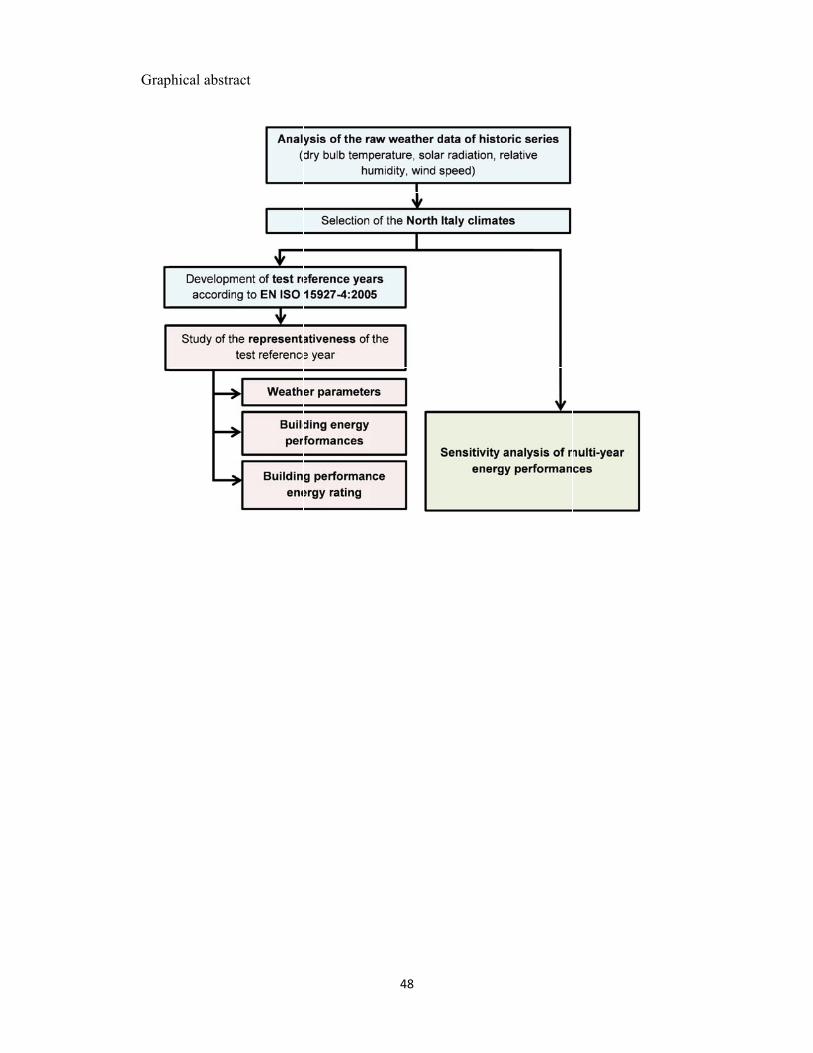
2. Methods
The analysis requires 4 main steps:
(2.1) selection and analysis of the weather data of the multi-year series,
(2.2) definition of a TRYEN according to EN ISO 15927-4:2005,
(2.3) analysis of the representativeness of the TRYEN by comparing:
a) the weather variables distribution,
b) the energy performance of a set of reference buildings calculated both with
TRYEN and multi-year weather files,
c) The energy performance rating of the reference building set resulting from the
previous calculations.
(2.4) sensitivity analysis of multi-year energy performance.
2.1 Selection and analysis of the weather data of the multi-year series
The data collected by the local ARPAs are available for 24 cities, capitals of each
province in 4 North Italy Regions: Emilia-Romagna, Lombardia, Trentino-Alto
Adige/Südtirol and Valle d’Aosta. Errors and outliers are generally present in the raw
weather data measurements: before using the hourly weather data in BES, the wrong
entries have to be identified and, if possible, fixed. Since the weather variables are
measured with different instruments and affected by different errors, the specific criteria
indicated in Table 1 [39] are followed for each variable to find the errors in a first
analysis, according to the recommendations of WMO Guide [40].
9
For single hours or a low number of consecutive hours affected by wrong data, the
errors are fixed by interpolation. Wrong and missing data are replaced using linear
interpolation for the temperature, the relative humidity and the wind speed when the
consecutive incorrect data points are less than 6 entries, otherwise a cyclic interpolation
is considered [41]. For larger periods, bias errors are corrected by properly shifting the
relevant data.
2.2 Definition of a TRYEN according to EN ISO 15927-4:2005
The construction of a TRYEN requires mean values of the meteorological variables and,
in particular, the individual frequency distributions and the cross correlations between
the parameters.
A test reference year, TRYEN, can be built in accordance with the technical standard EN
ISO 15927-4:2005 following the steps described below:
1. calculation of the daily averages p for each primary climatic parameter p, month
m and year y of the series;
2. sorting of all the p for a specific month m of all the available years in increasing
order and calculating the cumulative distribution function Φ(p, m, i) for each
parameter and ith day as:
1)(
,,
N
iKimpΦ (1)
where K(i) is the rank order of the ith day and N is the total number of days for a
month over all the available years;
3. sorting of all the p for a specific month m and year y in increasing order and
calculating the cumulative distribution function F(p, y, m, i) for each parameter and
ith day, as:
10
1)(
,,,
n
iJimypF (2)
where J(i) is the rank order of the ith day and n is the number of days for a specific
month;
4. calculation of the statistics by Finkelstein-Schafer for each month m and year y as
n
iS impimypFmypF
1,,,,,,, (3)
5. sorting of the months for increasing values of FS for each parameter, calculating the
ranks for each month and parameter and summing them in order to calculate the
total ranking;
6. for each month among the first 3 months with the lowest ranking sum, calculate the
absolute deviation between the mean wind speed of the month m of the year y and
the multi-year mean wind speed: the month with the lowest deviation can be chosen
for a TRYEN.
The final 8 hours of a month and the first 8 hours of the next month have to be
smoothed by means of a cubic spline interpolation in order to avoid discontinuities.
Since the adjustment involves night-time hours and wind speed is generally not
involved in the correction, it applies only to the dry bulb temperature and the relative
humidity.
In accordance with the EN ISO 15927-4:2005, at least 10 years (not necessarily
consecutive) should be used but the longer the period, the better. For those locations
without this minimum requirement, a slightly less restrictive criterion is followed: only
locations with at least 8 years in the data series, as in the chapter 14 of the ASHRAE
Handbook of Fundamentals [42] and with less than 10 % of wrong/missing data for
each variable and each year are considered to develop a TRYEN.
11
2.3 Analysis of the representativeness of the reference year
The analysis is carried out following the steps outlined below which are aimed at
studying the weather parameters, the energy results and the effects on the energy ratings
for the buildings in the sample.
a Weather variables
The ability of the TRYEN to represent the whole dataset is analysed comparing monthly
average values of dry bulb temperature, daily horizontal solar radiation and relative
humidity. Monthly average values for these variables of the reference year are
compared to the distributions of the averages in the multi-year series, which are
described by maximums, minimums, first and third quartiles and medians. The closer a
TRYEN average variable is to the median for a given month, the better. A
representativeness problem can be identified when a TRYEN monthly average variable is
outside the interquartile range, IQR.
b Building energy performances
The representativeness of the test reference year for the North Italy climates is studied
by carrying out different dynamic simulations with both TRYEN and multi-year data
series, according to the suggestion by Chan et al. [43] in assessing Hong Kong TMY.
The annual energy needs (both for cooling and heating) of a set of reference buildings
characterized by different insulation levels, thermal inertia, sizes and orientations of
windows and kind of glazing are analysed. This allows an estimation of the sensitivity
of the building energy performance to the variability of the considered climates by
changing the characteristics of the building itself. In this perspective, both buildings
expected to be characterized by higher heating energy demand (e.g., the poorly
12
insulated buildings) and buildings with higher cooling energy demand (e.g., buildings
with windows with high solar heat gain coefficient) are considered.
Starting from a base thermal zone, a set of 48 different simplified thermal zones is
developed in accordance with a full factorial plan. The base module consists of a single,
square thermal zone with an area of 100 m2 and a height of 3 m with the façades facing
the main cardinal directions. Thermal bridges are neglected and the floor is modelled
with a crawl space (i.e., without sun exposition and infrared thermal losses towards the
sky dome), instead of in thermal contact with the ground, whose sensitivity and
response to the variability of the external conditions are very low considering a limited
number of years because of its very high thermal inertia.
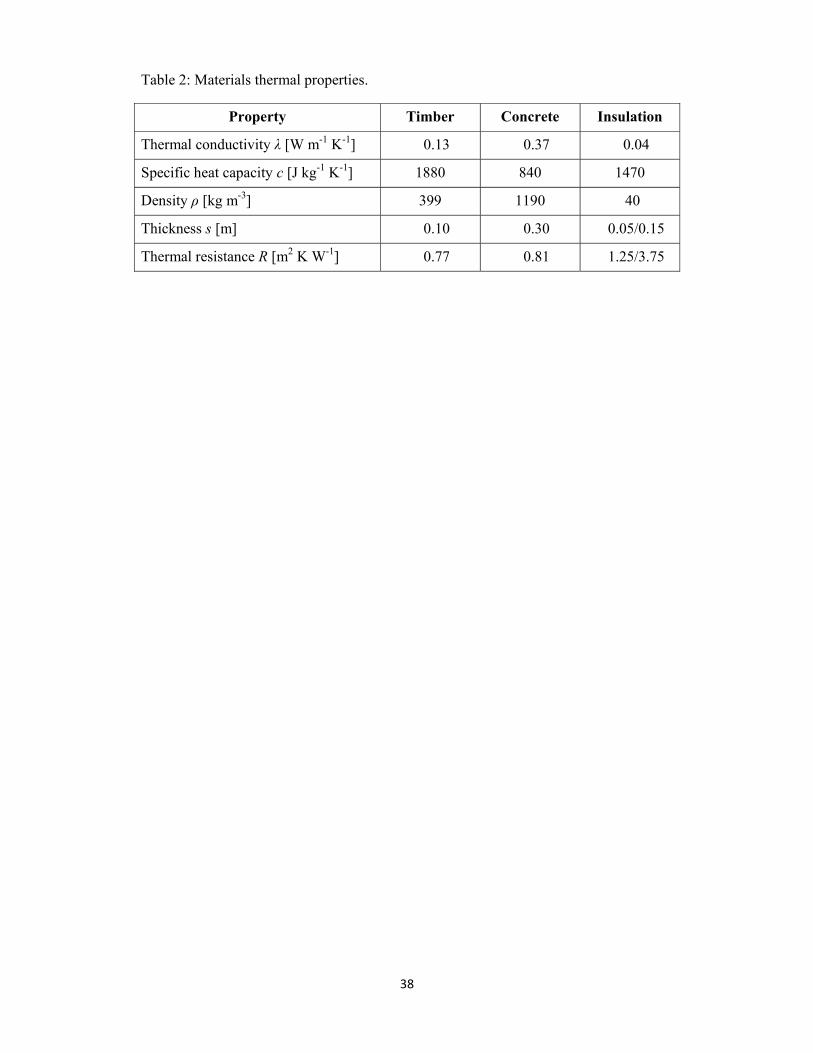
All opaque components are modelled as a two-layer structure with insulation on the
external side and a massive layer (timber or concrete) with a thermal resistance around
0.8 m2 K W-1. The solar absorptance is 0.3 for both sides of the vertical walls and for
the internal side of the roof, 0.6 for the external side of the roof and the internal side of
the floor and 0 for the external side of the floor. The thermal properties of the
considered materials are reported in Table 2.
The windows, positioned all on the same façade, consist of a double-pane glazing (Ugl =
1.1 W m-2 K-1) with a timber frame (Ufr = 1.2 W m-2 K-1) whose area is 20 % of the
whole window area. The internal gains are assumed equal to 4 W m-2, half radiative and
half convective, as indicated by the EN ISO 13790:2008 [44] for residential dwellings.
A constant ventilation rate of 0.3 ACH is considered, as suggested by the Italian
technical specification UNI/TS 11300-1:2008 [45].
The analysed variables can be assumed to have the most relevant effects on the building
envelope performance, and, with the only exception of the window orientation, each one
presents a high and a low level:
13
insulation thickness of the envelope components (5 cm or 15 cm of polystyrene)
which gives two levels of thermal transmittance (e.g., for the vertical walls, U =
0.45 W m-2 K-1 and U = 0.21 W m-2 K-1);
thermal inertia of the opaque elements (area specific heat capacity of the internal
layer equal to 75 kJ m-2 K-1 for the timber structure and equal to 300 kJ m-2 K-1
for the concrete);
solar heat gain coefficient (SHGC) of the glazing (0.35 or 0.61);
size of the windows (Awin = 14.56 m2 or 29.12 m2);
orientation of the windows (East, South or West).
The different configurations are simulated with TRNSYS, considering the following
assumptions:
the time-step is coherent with the hourly discretization of the weather data, in
order to avoid the interpolations influencing the results;
constant convection coefficients are selected, in accordance with the standard
EN ISO 6946:2007 [46];
the internal long wave radiation exchanges are considered according to the star
network approach in TRNSYS;
the heating and the cooling setpoints are imposed to 20 °C and 26 °C in
accordance with the UNI/TS 11300-1:2008 prescriptions for residential
buildings, but they are applied all year long, i.e. no specific heating and cooling
seasons are defined.
The annual heating and cooling energy needs simulated with TRNSYS, considering
both the developed reference year weather files and each one of the multi-year series,
are analysed for each combination of building configuration and location. In particular,
in order to discuss the representativeness problem under the energy perspective, the

14
TRYEN annual energy results are compared to the averages and to the multi-year results
for each case.
c Building performance energy rating
The effects of the deviations between the TRYEN annual energy needs and those of the
multi-year series on the building energy rating are discussed in order to study this
additional aspect of a weak representativeness. The classification currently used in Italy
and defined in the National Guidelines for the Energy Labelling of Buildings [47],
based on final uses for space heating during the heating season and for the domestic hot
water production, is not followed since the analysis is focused only on the envelope and
not on the systems. A specific classification is developed coherently with the procedure
described in the technical standard EN 15217:2007 [48] for the set of buildings in the
analysis.
In the technical standard EN 15217:2007, two reference values are defined: Rr is
representative of the requirements of energy performance for new buildings while Rs is
the energy performance reached by half of the national or regional building stock. The
simulated sample of buildings is not designed to be representative of the Italian
residential building stock neither to comply with the current minimum energy
requirements. Instead, the set of buildings is aimed to assess the effect of the variability
of weather parameters in multi-year series. Moreover, the reference values have to be
defined considering the final energy uses. Thus, the standard methodology is adapted to
the purposes of this work: two separate ratings are defined in order to distinguish
heating and cooling energy needs and the reference values are chosen for each location,
according to the annual results for the sample of buildings with the TRYEN. The
medians of the energy results are attributed to the Rs values while the first quartile Q1 to
15
the Rr values. According to the Annex B of the technical standard, 7 classes are defined,
as in Table 3.
As it can be seen, by associating the first quartile Q1 to the Rr value 25 % of the building
configurations belong to classes A and B which have the best energy performance. The
median distinguishes the classes D and E and so half of the sample belongs to the
classes E, F and G which have the worst energy performance.
Considering each of the years in the original weather data series, the energy
performance of a building configuration can be either better or worse than the rating
according to the TRYEN. A trend of higher or lower ratings in the multi-year series with
respect to the reference year can be identified if the TRYEN is not representative of the
original multi-year series. Moreover, the energy performances of some configurations
can be more sensitive to the weather variability and both years with higher and years
with lower ratings can be present. In this case the TRYEN ratings can be considered
representative if the number of upgrades and that of downgrades are close. In order to
take into account both issues, two criteria of analysis are considered:
Criterion A: in order to detect the trends, if the number of downgrades/upgrades
is larger than or equal to half of the years in the data series for a given building
configuration (e.g., 4 or 5 years), this building is accounted among those with a
representativeness problem;
Criterion B: in order to detect unbalanced behaviour for those configurations
more sensitive to weather variability, if the difference between the number of
downgrades and the one of upgrades is larger than or equal to 33 % of the years
in the data series (e.g., around 3 years), it is accounted among those with a
representativeness problem.
16
2.4 Sensitivity analysis of multi-year energy performances
The variability of the energy results is analysed in order to find correlations between
building envelope parameters and dispersion of the results.
The annual results with the TRYEN weather files are considered as a reference and the
deviations between the energy needs simulated in each year and the ones of the TRYEN
are calculated. The deviations are analysed by means of Spearman’s index. Since it is
expected that some envelope properties act in reducing both the positive and negative
deviations with respect to the reference year results and because of the monotonic
definition of Spearman’s index, the analysis is performed distinguishing positive and
negative differences. The considered variables are divided into those describing the
envelope characteristics and those related to the external weather conditions.
For the energy need deviations, in this analysis we assess:
the variables descriptive of the dynamic behaviour of the opaque envelope, such
as the area-weighted average periodic thermal transmittance Yie,env [W m-2 K-1],
the area-weighted average time shift Δtie,env [h], and the total internal heat
capacity ki∙Atot [kJ K-1], defined in the EN ISO 13786:2007 [49];
the area-weighted average thermal transmittance of the opaque envelope Uenv [W
m-2 K-1];
the solar heat gain coefficient of the glazing SHGC [-];
the glazing area Agl [m2];
In order to take into account the variability of the weather conditions, the deviations of
the area-weighted equivalent Heating/Cooling Degree Days [K d] are calculated for
both opaque and transparent envelope. In particular, the HDDsol-air,env, CDDsol-air,env,
HDDsol-air,gl and CDDsol-air,gl are determined for each orientation considering,
17
respectively, the sol-air temperature for the opaque components and the equivalent sol-
air temperature for the transparent ones, according to the Eq. (4) and (5):
se
eskyr,skyenvsol-air, e h
)θ(θhIαθθ
(4)
se
eskyskyr,
glegl air,-sol h
)θ(θh
UISHGC
θθ
(5)
In order to have aggregated variables, area-weighted heating/cooling degree days are
calculated for each year and location of the weather series and used for determining the
deviations ΔHDDsol-air,env, ΔCDDsol-air,env, ΔHDDsol-air,gl and ΔCDDsol-air,gl with respect to
the equivalent degree days of the reference year.
3. Results
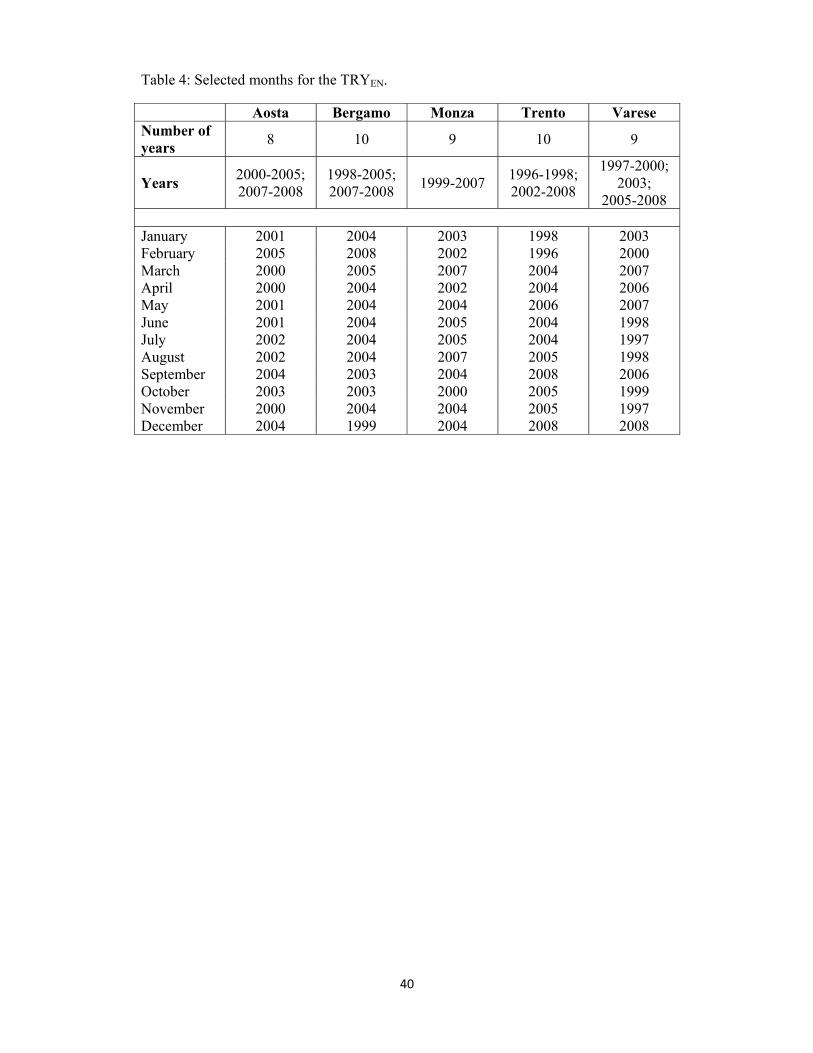
The selection procedure and the chosen criteria led to the identification of 5 cities:
Aosta (with 8 available years), Bergamo (10 years), Monza (9 years), Trento (10 years)
and Varese (9 years). The details of the considered years in the multi-year series and the
chosen months for the test reference years are reported in Table 4.
3.1 Representativeness of the reference year
a Weather variables
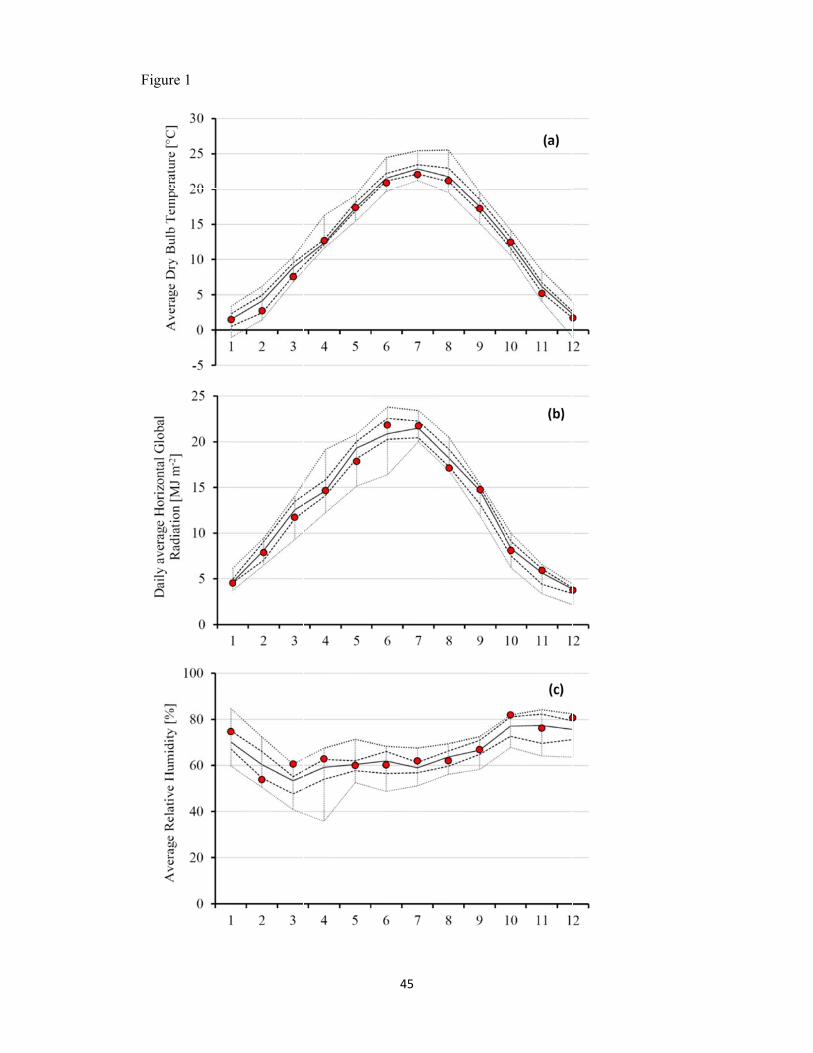
The monthly values of average dry bulb temperature, daily horizontal solar radiation
and relative humidity of the different years and TRYEN were calculated and compared.
In Figure 1 the monthly average weather variables are showed for the location of
Trento.
The red dots represent the TRYEN monthly averages while the distributions of the
monthly averages of the multi-year series are described by lines: the external dotted
18
lines are the maximum and the minimum, the internal dotted lines the first and the third
quartiles (Q1 and Q3) and the continuous line the medians.
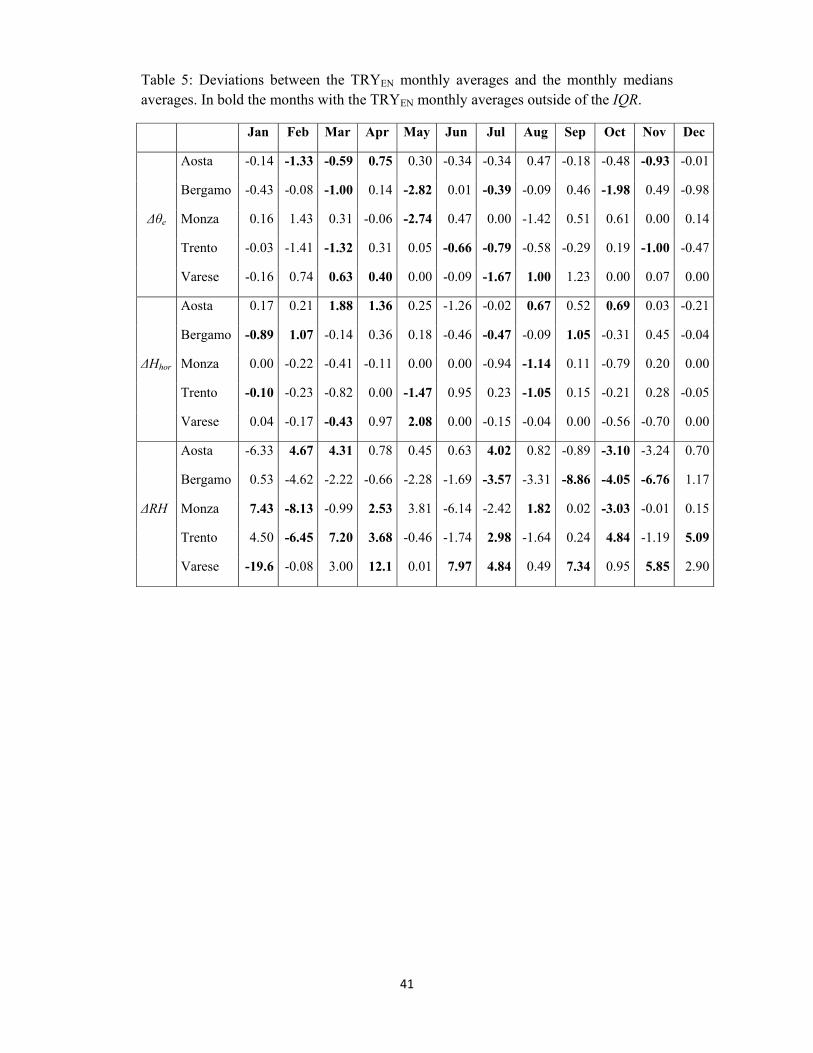
Table 5 presents the deviations between the TRYEN monthly averages and the medians
of the average value distributions in the multi-year period. Those months outside the
IQR are typed in bold. As regards the average dry bulb temperatures, TRYEN values are
outside IQR for 4 months for all localities with the exception of Monza, where the
critical month is only 1. Some representativeness problems are present for the global
horizontal radiation in 4 months for Aosta and Bergamo reference years, in 3 for Trento,
in 2 for Varese and only in August for Monza. For what concerns the relative humidity,
the number of cases outside IQR is generally higher: 6 for Varese and Trento, 5 for
Monza and 4 for the other cities. The identification of months with low
representativeness is important to understand discrepancies between building energy
performance calculated using TRYEN and multi-year data.
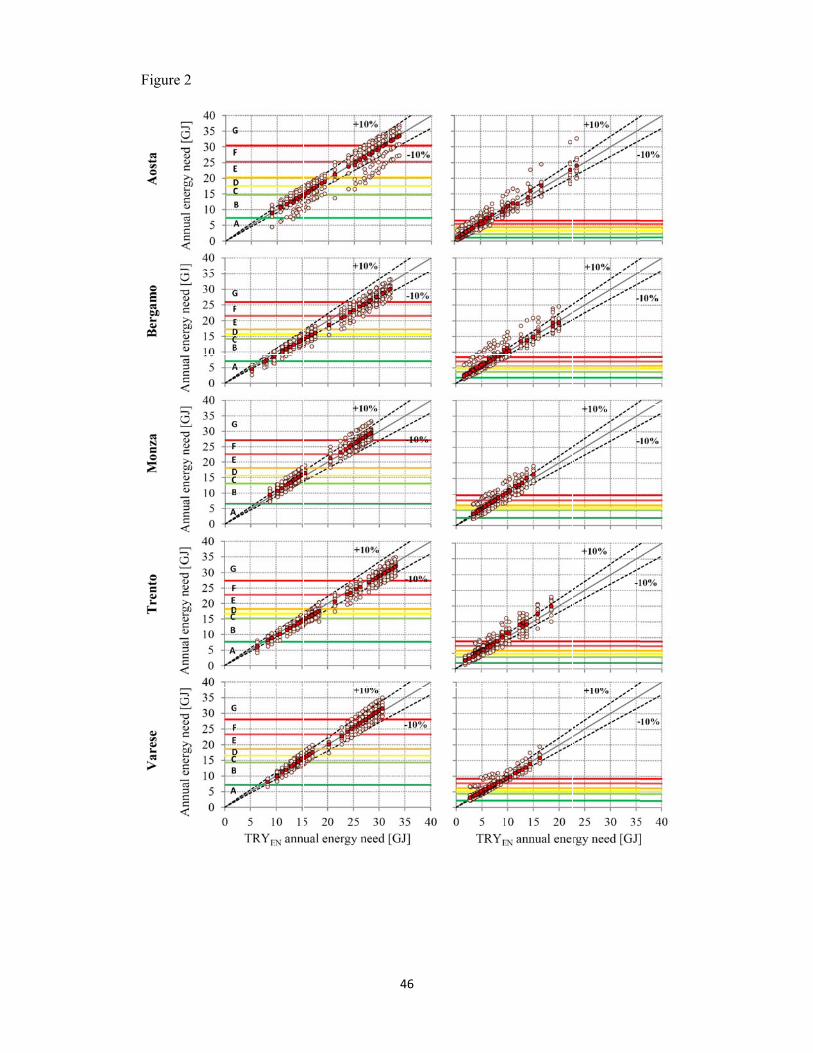
b Building energy performances
Figure 2 presents annual heating and cooling energy needs for each building
configuration in the sample. In the graphs, the annual energy needs simulated using a
test reference year as weather file are reported in the horizontal axis while the annual
energy needs and the averages of the multi-year series are indicated on the vertical axis.
As regards the ranges of the annual results of the buildings sample simulated with the
reference years, the heating energy needs are between 5 and 35 GJ per year (i.e.,
between 13.9 and 97.2 kWh m-2 yr-1) while the cooling energy needs are less than 20 GJ
(i.e., 55.6 kWh m-2 yr-1), with most of cases under 10 GJ (i.e., 27.8 kWh m-2 yr-1). Some
differences can be found among the ranges for the different localities but they are
negligible and the ranges remain comparable. Moreover, the dispersion of the results for
19
the different locations and building configurations can be observed in the graphs.
Considering the standard deviations normalized with respect to the means for each
combination of climate and building configuration, for the heating needs the average of
the buildings sample is equal to 13.8 % for Aosta, 8.6 % for Bergamo, 8.3 % for Monza,
7.4 % for Trento and 7.1 % for Varese. As concerns the cooling needs, it is 33.4 % for
Aosta, 23.1 % for Bergamo, 20.5 % for Monza, 19.5 % for Trento and 18.8 % for
Varese.
A good alignment between multi-year average results and TRYEN results indicates a
good representativeness of the energy performance evaluated by means of the reference
year with respect to the multi-year series:
for the annual heating needs the trend deviations between the TRYEN results and
the averages are +1.6 % for Aosta, +7.2 % for Bergamo, -4.0 % for Monza, +4.3
% for Trento and -1.9 % for Varese;
for the annual cooling needs the trend deviations between the TRYEN results and
the averages are -5.3 % for Aosta, -4.4 % for Bergamo, -7.4 % for Monza, -10.7
% for Trento and +3.8 % for Varese.
c Energy performance rating
The horizontal lines in Figure 2 divide the different rating classes for each locality and
kind of energy need: the dark green line distinguishes classes A and B, the light green B
and C, the yellow line separates C and D, the orange D and E, the light red E and F and,
finally, the dark red distinguishes class F from class G.
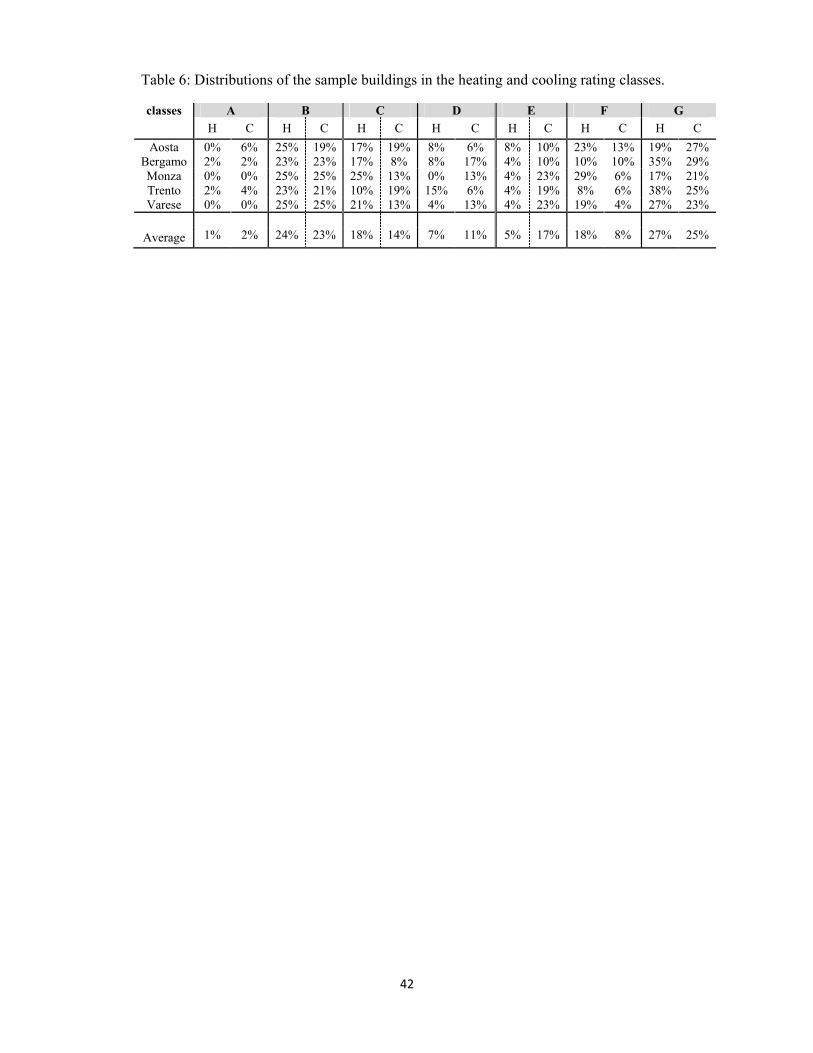
In Tables 6, 7 and 8 both heating and cooling energy ratings are analysed for the sample
of buildings. In Table 6 the distributions in the different classes of the building
configurations according to the TRYEN weather file are reported for each climate. In the
20
first two classes 25 % of the building sample configurations are present but most of
them are in class B for both heating and cooling need ratings. Referring to the 25 % of
cases belonging to classes C and D, most of configurations are in class C for the heating
need ratings and equally distributed in classes C and D for the cooling ratings. As
regards the last 50 % of configurations, most of them belong to classes F and G
according to the heating need ratings and to classes E and G according to the cooling
need ratings.
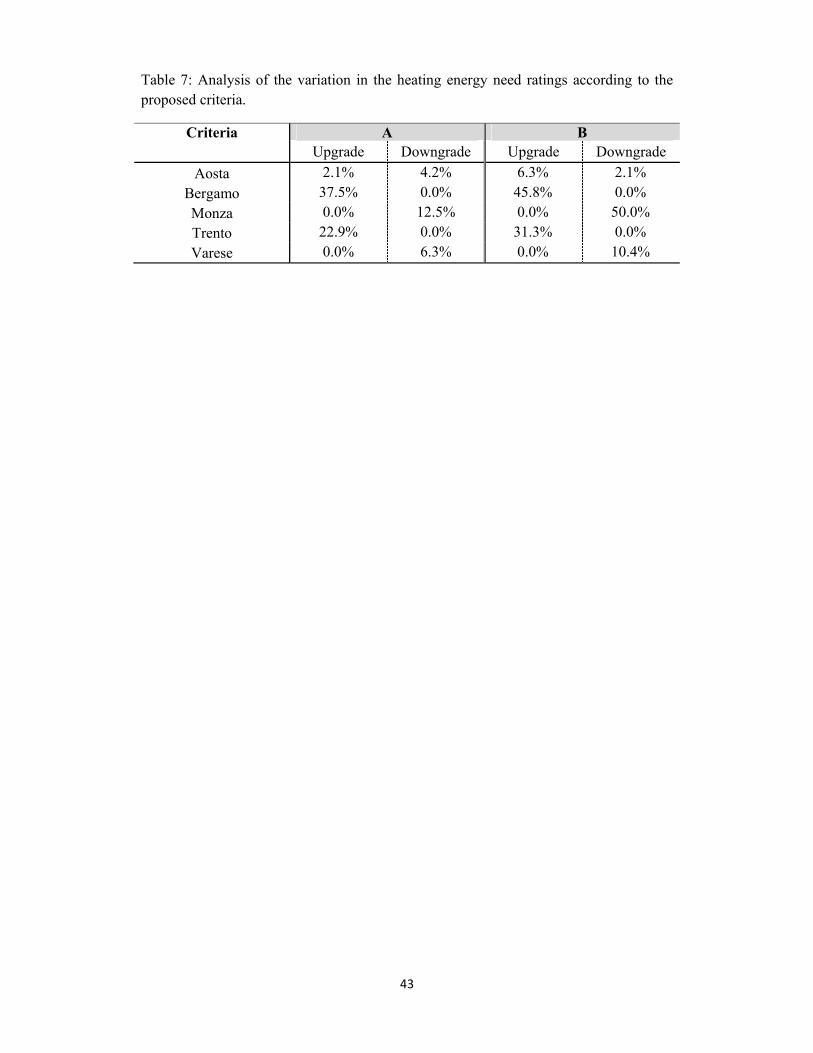
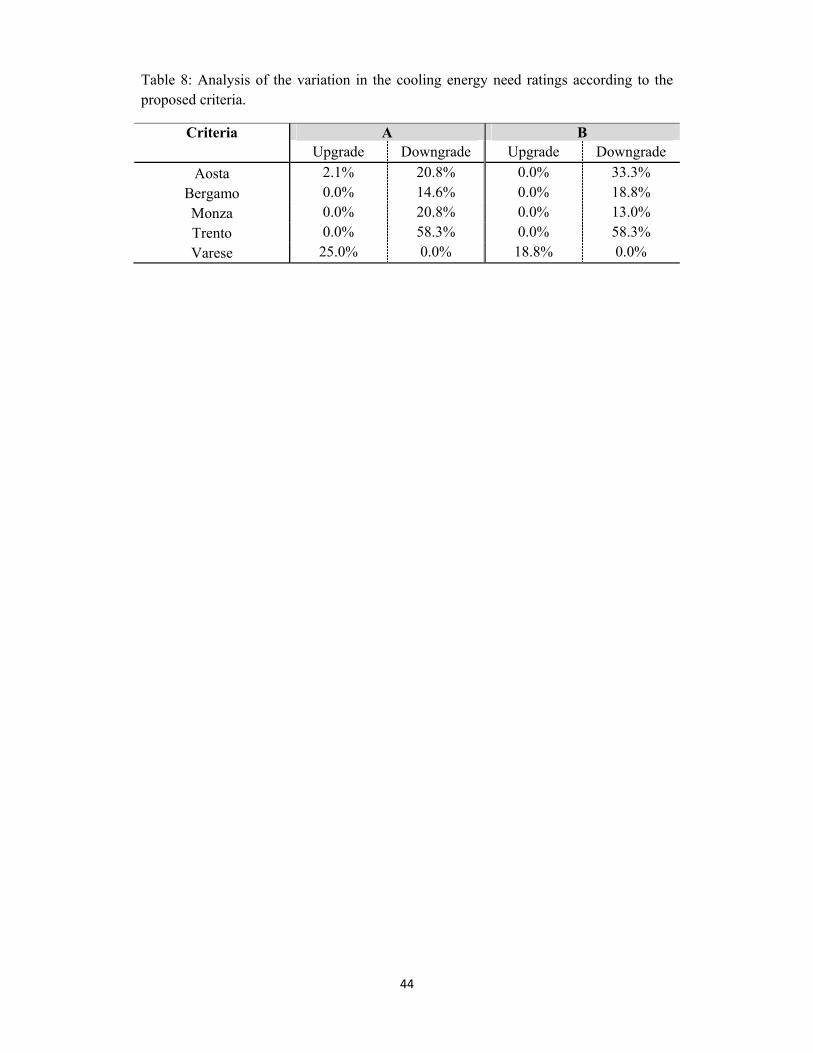
In Table 7 and Table 8 the variation of the ratings in the different years is analysed
according to the criteria described before. Looking at the first table about the heating
ratings, according to the criterion A (i.e., presence of a trend) there is a marked upgrade
for 37.5 % of configurations (i.e., 18 cases) in Bergamo and 22.9 % of configurations
(i.e., 11 cases) in Trento while there is a downgrade for 12.5 % of buildings in Monza,
6.3 % in Varese and 4.2 % in Aosta (respectively 6, 3 and 2 cases). Analysing the
results with the criterion B, the number of upgrades is significantly larger than that of
the downgrades for 45.8 % of cases (i.e., 22 buildings) in Bergamo and 31.3 % (i.e., 15
buildings) in Trento, while the opposite is true for 10.4 % of configurations in Varese
and 50 % in Monza (respectively, 5 and 24 buildings). As concerns the cooling ratings,
an upgrade trend can be identified for 25 % of cases (i.e., 12) in Varese while a trend of
downgrade can be seen for 20.8 % of buildings (i.e., 10) in Aosta and Monza, 14.6 %
(i.e., 7) in Bergamo and 58.3 % (i.e., 28 buildings) in Trento. According to the criterion
B, the building configurations with a number of upgrades much larger than that of
downgrade are 18.8 % in Varese (i.e., 9) while more downgrades occur in 33.3 % of
cases for Aosta, 18.8 % for Bergamo, 13 % for Monza and 58.3 % for Trento,
respectively 16, 9, 6 and 28 cases.

21
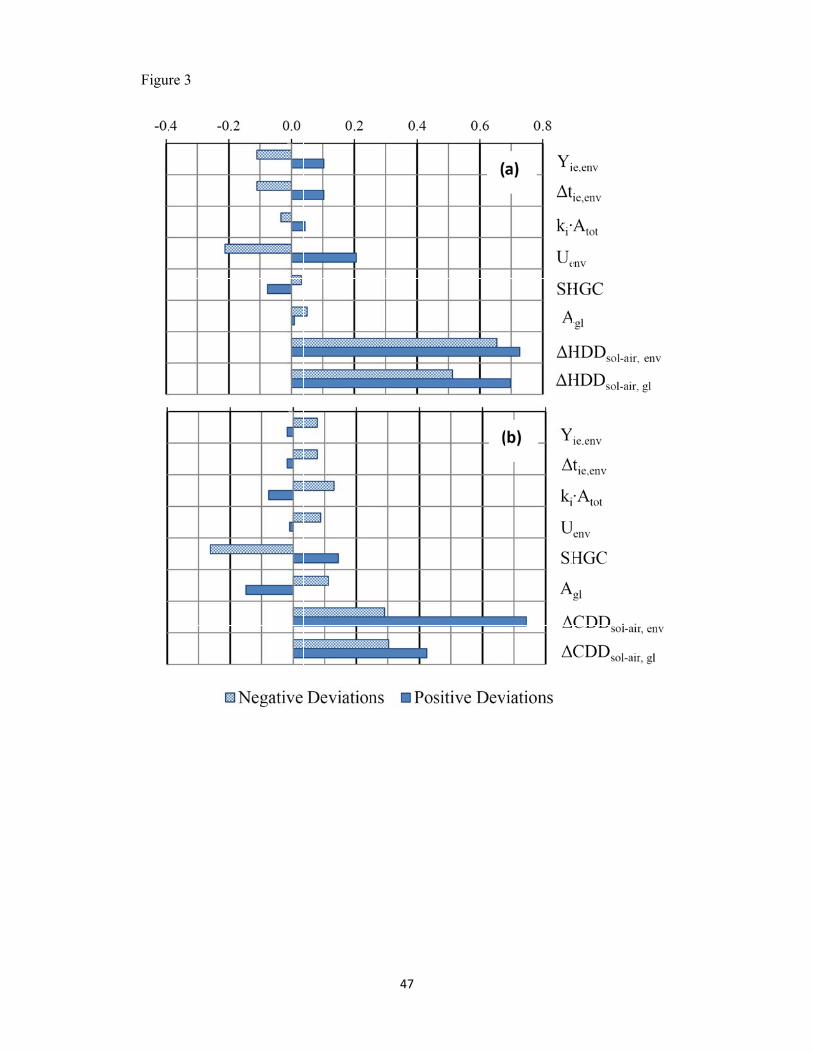
3.2 Sensitivity analysis of multi-year energy performances
The Spearman’s indexes were calculated in order to correlate the variability of the
energy results in the multi-year period to the characteristics of the building envelopes.
The indexes are reported in Figure 3.
4. Discussion
4.1 Representativeness of the reference year
a Weather variables
Analysing the weather variables in Figure 1 and in Table 5, it can be seen that the
TRYEN values are within the range between the first quartile Q1 and the third quartile Q3
in most of cases, indicating that the overall representativeness of TRYEN is good, but
different behaviours and levels of agreement can be observed when different months
and locations are considered. In some cases the TRYEN mean dry bulb temperatures are
far from the median values of the multi-year period, as it can be seen in Figure 1 for
Trento, for instance for February, March and November. The same is true of the daily
global solar radiation of Trento for May, June and August and the relative humidity for
February, March, October and December. The relative humidity, in particular, has
representativeness problems for a larger number of combinations of months and
locations than the dry bulb temperature and the horizontal solar radiation. Furthermore,
the TRYEN averages are rarely close to the medians for the three climatic parameters at
the same time and the number of critical months is different for each variable and
locality. In this context, the statistical properties of the data series are crucial in order to
correctly develop the typical year. Even if the lengths of the collected series are
22
comparable for the 5 localities, it is possible to see that the results are different. For
instance, considering the solar radiation, in Monza only August is critical while in Aosta
and Bergamo there are 4 months outside the interquartile ranges. Data series of 10
years, as suggested in the EN ISO 15927-4:2005, may not be enough for climates with a
large variability of the weather conditions year after year or in the presence of
anomalous years, which can affect the TRYEN selection procedure.
According to the central limit theorem, the effects of outliers can be mitigated by
increasing the number of entities in the analysed sample but, until the number of
collected years will not be high enough, the development of the reference year has to be
optimized considering its final use. In this work we focused on the building envelope
energy performance, so attention has to be paid, in particular, to the effects of
temperature and solar radiation. On this respect, the relative humidity has a marginal
role in the evaluation of the fictitious sky temperature in order to simulate the infrared
heat flow towards the sky-dome according to the model implemented in TRNSYS [50].
Since constant ventilation rates and convective coefficients were used, the effect of the
wind speed was completely neglected.
b Building energy performances
Both for heating and cooling annual energy needs, the error provided by the TRYEN
weather data is in average under 10 % (Figure 2), as observed for Chinese climates by
Yang et al. [7]. This does not represent the global error but just the effect of the
inaccuracy in the modelling of the weather data and it has to be summed to the
uncertainties of all other inputs and to the effects of the modelling assumptions. The
general trend of the heating deviation is not the same in all locations: in Bergamo and in
Trento there are overestimations of the heating energy needs while in Monza the TRYEN

23
leads to an underestimation. This is consistent with the dry bulb temperatures in Table
5: in Bergamo the monthly averages of January, March, October and December, as well
as February, March, November and December in Trento, are significantly lower than
the medians while in Monza the monthly averages of February and October are higher.
As concerns the annual cooling energy needs, there are underestimations in Aosta,
Bergamo, Monza and, in particular, Trento. As it can be noticed in Table 5, for these
localities the summer months of the reference year are generally colder than the
medians and in some cases with less daily solar radiation (e.g., May and August for
Trento, July and August for Monza, June and July for Bergamo and June for Aosta).
While for the heating needs the discrepancies are ascribable to dry bulb temperature
differences, for the cooling needs they depend on the combined effects of temperature
and solar radiation.
c Energy performance ratings
For many configurations the performances are not in the same rating class (e.g., for a
colder year we can see a downgrade in the annual heating needs while for a warmer year
an upgrade). Looking at the variability of the ratings in Table 7 and Table 8, some
considerations about the effects of some representativeness issues can be drawn.
According to both criterion A and B, we saw a trend of upgrade for a relevant number
of configurations in Bergamo and in Trento in the classification of the heating energy
performances. The criterion B also underlined an imbalance between the downgrades
and the upgrades for the heating ratings in Monza. Analysing the cooling ratings, both
criteria highlighted relevant numbers of upgrades in Varese and of downgrades in
Aosta, Bergamo, Monza and, especially, Trento. The analysis about the energy ratings
confirms the representativeness issues identified in the evaluations of the energy needs:
24
for Bergamo, Monza and Trento as concerns the heating needs and for all locations as
concerns the cooling needs. Even if there is a light overestimation trend of the cooling
needs in Varese (around 3 %), a significant number of cases present a trend of upgrades.
4.2 Sensitivity analysis of multi-year energy performances
The standard deviation of the energy needs simulated by using the different years in
each historic series is between 7 % and 8 % for the heating needs and around 20 % for
the cooling. Aosta, being affected by the anomalous year 2007, presents standard
deviations more than 50 % larger than the other localities. Referring to the heating
needs, the values are coherent with other studies in the literature, even if their focus was
on the final energy uses and not on the energy needs. The cooling needs, instead, have a
much larger variability but they are not particularly relevant for the considered climates,
which are dominated by the heating demands. In Figure 3 it is possible to identify the
parameters whose correlations with the variability of the energy needs are more
significant. As it can be seen in graph (a), the most relevant correlations are with the
deviations of the annual heating equivalent degree days and, for what concerns the
envelope properties, with the opaque envelope thermal transmittance, periodic thermal
transmittance and time shift. All their correlation indexes have a p-value lower than 1 %
(i.e., statistically significant with respect to a 1 % significance level). Looking at the
correlation indexes for the cooling needs in graph (b), the most correlated parameters
are the deviations in the equivalent cooling degree days as well as the SHGC and area of
the glazing. Also for the cooling need variability, these indexes have a p-value lower
than 1 %.
From these indexes we can conclude that buildings with more efficient opaque
envelopes (i.e., insulated walls, with a low periodic thermal transmittance and high time
25
shift) and with a low SHGC of the glazing (or, generally speaking, of a control of the
entering solar radiation) are more robust to the changes of the weather conditions. These
results can be useful to:
identify configurations of the existing building stock more sensitive to the
weather variability and the interventions to choose not only for the reduction of
the energy consumption but also to make building envelopes less sensitive to the
external variability;
give some indications about the strategies to follow in the design of new
buildings robust to climate changes.
5. Conclusions
In this work the EN ISO 15927-4:2005 method for the development of test reference
year has been implemented in 5 North Italy climates, considering a number of years
close to the limit suggested by the technical standard itself and without attributing
different weights to the weather variables. The representativeness of EN ISO 15927-
4:2005 reference years has been assessed by studying both the weather files and the
annual energy needs of a set of 48 simplified buildings simulated with TRNSYS. The
reference year weather variables have been compared to those of the multi-year
distributions, as well as the energy needs of the reference years to the averages of the
whole series. Moreover, the variability of the building energy ratings with respect to the
reference year ones has been studied, in order to assess the influence of the typical
weather data on the energy labelling.
We observed that:
26
1. With a low number of years in the dataset for the development of the TRYEN, the
representativeness - both of weather variables and energy needs, can vary
significantly in the different locations.
2. The variability of the heating needs is in agreement with the results in the
literature. For the cooling needs, instead, the variability is larger but it should be
considered that little variations in the weather conditions can lead to large
percentage differences in the analysed climates due to the low cooling energy
needs.
3. If the TRYEN is not very representative of the historic weather conditions,
misleading information can be provided in the building energy labelling,
especially for cases that are more sensitive to the weather variability.
4. The characteristics of these less robust configurations were identified: building
envelopes with low insulation level and poor dynamic performances (e.g., high
periodic thermal transmittance, low time shift) are more susceptible to heating
needs variability and those with high SHGC and large glazing are more
susceptible to cooling needs variability.
We can conclude that, in case of low number of recorded years in the historic weather
data series and climates with large variability – such as the Italian ones, specific
reference years should preferably be developed, depending on the analysis purposes:
for the evaluation of the annual heating needs, the representativeness of the
external temperature should be optimized;
for the assessment of the cooling needs, instead, the solar radiation should be
well represented.

27
The use of representative weather inputs will improve the accuracy of energy need
evaluation and rating, especially for those configurations more sensitive to the climate
variability and so more affected by errors in the reference year characterization.
Acknowledgement
The authors want to thank the ARPAs and the Meteorological Services of Emilia-
Romagna, Lombardia, Trentino-Alto Adige / Südtirol and Valle d’Aosta for the raw
weather data.

28
Nomenclature
Symbols
α solar absorptance (-) Δ parameter deviation with respect to the reference values computed by means
of TRYEN θ temperature (K)
thermal conductivity (W m-1 K-1)
ρ density (kg m-3) Φ cumulative distribution function of variable daily means within the whole
historic series of the calendar months (-) A surface (m2) CDD cooling degree days (K d) c specific heat (J kg-1 K-1) EP energy performance of the building envelope (GJ) F cumulative distribution function of variable daily means within the whole
days of the calendar month of a specific year (-) FS Finkelstein-Schafer statistics (-) HDD heating degree days (K d) H solar radiation (MJ m-2) h heat transfer surface coefficient (W m-2 K-1) I solar irradiance (W m-2) IQR interquartile range J rank order of variable daily means within the month of a specific year (-) K rank order of variable daily means for a calendar month within all years of the
series (-) k areal heat capacitance of an envelope components (kJ m-2 K-1) m specific calendar month analyzed in the TRYEN calculation procedure (-) N total number of days for a specific calendar month within the whole historic
series (-) n number of days for a specific calendar month (-) p weather variable used in the TRYEN calculation procedure (-) Q1/3 first or third quartile R thermal resistance (m2 K W-1) RR maximum energy performance for new construction in a specific climate zone
(GJ yr-1) RS national or regional average of building stock heating demand (GJ yr-1) RH relative humidity (%) s thickness (m) SHGC solar heat gain coefficient (-) TRY test reference year (-) t time shift of the envelope components (h) U thermal transmittance (W m-2 K-1)
29
Y periodic thermal transmittance of an envelope component (W m-2 K-1) y select year of the historical series
Subscripts
EN calculation procedure of European standard EN ISO 15927-4:2005 e external surface of the envelope or external environment env area weighted average of a variable fr referred to window frame gl referred to window glazing plane hor horizontal surface i internal surface of the envelope se envelope external surface sol-air referred to sol-air temperature sky referred to sky dome win referred to window
References
[1] S. Attia, E. Gratia, A. De Herde and J. L. M. Hensen, Simulation-based decision
support tool for early stages of zero-energy building design, Energy and Buildings 49
(2012) 2-15.
[2] Ente Nazionale Italiano di Normazione (UNI), UNI 10349:1994 - Riscaldamento
e raffrescamento degli edifici. Dati climatici (Heating and cooling of buildings.
Climatic Data), 1994.
[3] C. S. Barnaby and D. B. Crawley, Weather data for building performance
simulation, in: J. L. M. Hensen and R. Lamberts, Building Performance Simulation for
Design and Operation, Taylor & Francis Group, New York, 2011, pp. 37-55.
[4] E. Keeble, Availability of UK climatic data for use in simulation - BEPAC
Technical Note 90/1, Building Research Establishment (1990).
[5] C. Struck, P. de Wilde, J. Evers, J. L. M. Hensen and W. Plokker, On selecting
weather data sets to estimate a building design's robustness to climate variations,
Proceedings of the 11th IBPSA Building Simulation Conference (2009) 513-520.
30
[6] L. Adelard, H. Boyer, F. Garde and J.-C. Gatina, A detailed weather data
generator for building simulations, Energy and Buildings 31 (2000) 75–88.
[7] L. Yang, J. C. Lam, J. Liu and C. Tsang, Building energy simulation using multi-
years and typical meteorological years in different climates, Energy Conversion and
Management 49 (2008) 113–124.
[8] L. Wang, P. Mathew and X. Pang, Uncertainties in energy consumption
introduced by building operations and weather for a medium-size office building,
Energy and Buildings 53 (2012) 152–158.
[9] M. Bhandari, S. Shrestha and J. New, Evaluation of weather datasets for
building energy simulation, Energy and Buildings 49 (2012) 109–118.
[10] J. C. Lam, K. K. W. Wan, S. L. Wong and T. N. T. Lam, Principal component
analysis and long-term building energy simulation correlation, Energy Conversion and
Management 51 (2010) 135–139.
[11] National Climatic Data Center, Test Reference Year (TRY) - Tape Reference
Manual TD-9706, 1976.
[12] D. B. Crawley, Which weather data should you use for energy simulations of
commercial buildings?, ASHRAE Transactions 104 Part 2 (1998) 1-18.
[13] I. J. Hall, R. Prairie, H. Anderson and E. Boes, Generation of a typical
meteorological year for 26 SOLMET stations. Technical Report SAND -78- 1601,
Sandia Laboratories, 1978.
[14] H. Lund, The "Reference Year", a set of climatic data for environmental
engineering, Proceedings of the 2nd symposium on the use of computers for
environmental engineering related to buildings, 1974.
[15] H. Lund, "Test Reference Year", weather data for Environmental Engineering
and Energy Consumption in Buildings, CIB-S-17 meeting, 1975.
31
[16] H. Lund, The Design Reference Year, Proceedings of the 3rd IBPSA Conference,
1991.
[17] H. Lund and S. Eidorff, Selection methods for production of test reference years:
Final report (Report EUR 7306 EN), Commission of the European Communities, 1981.
[18] L. Guan, Preparation of future weather data to study the impact of climate
change on buildings, Building and Environment 44 (2009) 793–800.
[19] T. T. Chow, A. L. S. Chan, K. F. Fong and Z. Lin, Some perceptions on typical
weather year-from the observations of Hong Kong and Macau, Solar Energy 80 (2006)
459-467.
[20] L. Harriman, D. Colliver and H. Quinn, New weather data for energy
calculations, ASHRAE Journal 41 (1999) 31-38.
[21] J. M. Finkelstein and R. E. Schafer, Improved goodness-of-fit tests, Biometrik 58
(1971) 641-645.
[22] R. Festa and C. F. Ratto, Proposal of a numerical procedure to select reference
years, Solar Energy 50 (1993) 9-17.
[23] A. Argiriou, S. Lykoudis, S. Kontoyiannidis, C. A. Balaras, D. Asimakopoulos,
M. Petrakis and P. Kassomenos, Comparison of methodologies for TMY generation
using 20 years data for Athens, Greece, Solar Energy 66 (1999) 33–45.
[24] B. Andersen, S. Eidorff, L. Hallgreen, H. Lund, E. Pedersen, S. Rosenorn and O.
Valbjorn, Danish Test Reference Year, TRY - Meteorological Data for HVAC and
Energy - Report 174, 1986.
[25] J. L. M. Hensen, Simulation of building energy and indoor environmental
quality - some weather data issues, in Proceedings of the International Workshop on
Climate data and their applications in engineering, 1999.
32
[26] T. L. Freeman, Evaluation of the "Typical Meteorological Years" for solar
heating and cooling system studies - Final report, Solar Energy Research Institute,
1979.
[27] R. A. Gansler, S. A. Klein and W. A. Beckman, Assessment of accuracy of
generated meteorological data for use in solar energy simulation studies, Solar Energy
53 (1994) 279-287.
[28] J. Bilbao, A. Miguel, J. A. Franco and A. Ayuso, Test Reference Year
Generation and evaluation methods in the continental Mediterranean area, Journal of
Applied Meteorology 43 (2004) 390-400.
[29] K. Skeiker and B. A. Ghani, Advanced software tool for the creation of a typical
meteorological year, Energy Conversion and Management 49 (2008) 2581–2587.
[30] S. Janjai and P. Deeyai, Comparison of methods for generating typical
meteorological year using meteorological data from a tropical environment, Applied
Energy 86 (2009) 528–537.
[31] I. A. Rahman and J. Dewsbury, Selection of typical weather data (test reference
years) for Subang, Malaysia, Building and Environment 42 (2007) 3636–3641.
[32] G. Sorrentino, G. Scaccianoce, M. Morale and V. Franzitta, The importance of
reliable climatic data in the energy evaluation, Energy 48 (2012) 74-79.
[33] European Committee for Standardization (CEN), EN ISO 15927-4:2005 -
Hygrothermal performance of buildings - Calculation and presentation of climatic data
- Part 4: Hourly data for assessing the annual energy use for heating and cooling,
2005.
[34] A. L. S. Chan, Developing a modified typical meteorological year weather file
for Hong Kong taking into account the urban heat island effect, Building and
Environment 46 (2011) 2434-2441.
33
[35] H. Radhi, A comparison of the accuracy of building energy analysis in Bahrain
using data from different weather periods, Renewable Energy 34 (2009) 869–875.
[36] P. Baggio, V. Corrado, G. Murano and G. Riva, Definizione degli anni tipo
climatici delle province del Nord Italia (Definition of the typical weather years in the
North Italy provinces), La Termotecnica – 9 (2010) 61-68.
[37] K. Lee, H. Yoo and G. J. Levermore, Generation of typical weather data using
the ISO Test Reference Year (TRY) method for major cities of South Korea, Building
and Environment 45 (2010) 956–963.
[38] T. Kalamees, K. Jylhä, H. Tietäväinen, J. Jokisalo, S. Ilomets, R. Hyvönen and
S. Saku, Development of weighting factors for climate variables for selecting the energy
reference year according to the EN ISO 15927-4 standard, Energy and Buildings 47
(2012) 53-60.
[39] G. Antonacci and I. Todeschini, Derivation of meteorological reference year
with hourly interval for Italy, in Proceedings of Building Simulation Application - 1st
IBPSA-Italy conference, 2013.
[40] World Meteorological Organization, Guide to Meteorological Instruments and
Methods of Observation - WMO-No. 8, Geneva, 2008.
[41] A. Prada, Energy performance of buildings: modeling of dynamic summer
behavior, PhD Thesis, University of Trento 2012.
[42] ASHRAE, Handbook of Fundamentals, Atlanta, 2009.
[43] A. L. S. Chan, T. T. Chow, S. K. F. Fong and J. Z. Lin, Generation of a typical
meteorological year for Hong Kong, Energy Conversion and Management 47 (2006)
87–96.
34
[44] European Committee for Standardization (CEN), EN ISO 13790:2008 - Energy
performance of buildings - Calculation of energy use for space heating and cooling,
2008.
[45] Ente Nazionale Italiano di Normazione (UNI), UNI/TS 11300-1:2008 - Energy
performance of buildings Part 1: Evaluation of energy need for space heating and
cooling, 2008.
[46] European Committee for Standardization (CEN), EN ISO 6946:2007 - Building
components and building elements. Thermal resistance and thermal transmittance.
Calculation methods, 2007.
[47] Italian Government, Minister Decree 26/06/2009 - National guidelines for
buildings energy labelling. Gazzetta Ufficiale 2009.
[48] European Committee for Standardization (CEN), EN 15217:2007 - Energy
performance of buildings - Methods for expressing energy performance and for energy
certification of buildings, 2007.
[49] European Committee for Standardization (CEN), EN ISO 13786 - Thermal
performance of building components dynamic thermal characteristics - Calculation
method, 2007.
[50] M. Martin and P. Berdahl, Characteristics of infrared sky radiation in the United
States, Solar Energy 33 (1984) 321-336.

35
Figures captions
Figure 1: (a) Average monthly temperature (b) average daily horizontal global radiation and (c) average monthly relative humidity for Trento. The red dots represent the TRYEN monthly averages while the distributions of monthly averages of the multi-year series are described by lines: the external dotted lines are the maximum and the minimum, the internal dotted lines the first and the third quartiles (Q1 and Q3) and the continuous line the medians.
Figure 2: Heating (left) and cooling (right) energy needs: average energy needs (dark red dots) and annual results (light red dots) in the multi-year series respect to the TRYEN values. The horizontal lines divide the different rating classes for each locality and energy need: the dark green line distinguishes classes A and B, the light green B and C, the yellow line separates C and D, the orange D and E, the light red E and F and, finally, the dark red distinguishes class F from class G.
Figure 3: Correlations of the building envelope characteristics and the deviations of the annual heating energy needs (a) and annual cooling energy needs (b), evaluated by means of Spearman's index.
36
Highlights
The EN ISO 15927-4:2005 reference year is assessed in North Italy climates
We compare heating and cooling needs with reference and multi-year simulations
The representativeness of the reference year weather file is investigated
The building envelope energy ratings are studied with a proposed classification
We identify building envelope characteristics sensitive to weather variability

37
Table 1: Selection criteria for the identification of the outliers in the weather variables.
Weather variables Selection criteria
Dry bulb temperature
o values exceeding the 50% of the 99th percentile o data with a derivative larger than ± 4 K h-1 o periods with constant values for more than 5 h
Horizontal global solar radiation
o values exceeding the solar constant o positive values during the night-time
Relative humidity
o values exceeding 100% or null o periods with constant values for more than 5 h (if lower
than the 75th percentile)
Wind velocity
o values exceeding the 50% of the 99th percentile or negative
o periods with constant values for more than 5 h (if the registered speed is larger than the anemometer minimum speed)
38
Table 2: Materials thermal properties.
Property Timber Concrete Insulation
Thermal conductivity λ [W m-1 K-1] 0.13 0.37 0.04
Specific heat capacity c [J kg-1 K-1] 1880 840 1470
Density ρ [kg m-3] 399 1190 40
Thickness s [m] 0.10 0.30 0.05/0.15
Thermal resistance R [m2 K W-1] 0.77 0.81 1.25/3.75

39
Table 3: Criteria for the classification of heating and cooling energy needs (EP).
Classes Criteria
A EP < 0.5 ∙ Rr
B 0.5 ∙ Rr ≤ EP < Rr
C Rr ≤ EP < 0.5 ∙ (Rr + Rs)
D 0.5 ∙ (Rr + Rs) ≤ EP < Rs
E Rs ≤ EP < 1.25 ∙ Rs
F 1.25 ∙ Rs ≤ EP < 1.5 ∙ Rs
G EP ≥ 1. 5 ∙ Rs
40
Table 4: Selected months for the TRYEN.
Aosta Bergamo Monza Trento Varese Number of years
8 10 9 10 9
Years 2000-2005; 2007-2008
1998-2005; 2007-2008
1999-2007 1996-1998; 2002-2008
1997-2000; 2003;
2005-2008 January 2001 2004 2003 1998 2003 February 2005 2008 2002 1996 2000 March 2000 2005 2007 2004 2007 April 2000 2004 2002 2004 2006 May 2001 2004 2004 2006 2007 June 2001 2004 2005 2004 1998 July 2002 2004 2005 2004 1997 August 2002 2004 2007 2005 1998 September 2004 2003 2004 2008 2006 October 2003 2003 2000 2005 1999 November 2000 2004 2004 2005 1997 December 2004 1999 2004 2008 2008
41
Table 5: Deviations between the TRYEN monthly averages and the monthly medians averages. In bold the months with the TRYEN monthly averages outside of the IQR.
Jan Feb Mar Apr May Jun Jul Aug Sep Oct Nov Dec
Δθe
Aosta -0.14 -1.33 -0.59 0.75 0.30 -0.34 -0.34 0.47 -0.18 -0.48 -0.93 -0.01
Bergamo -0.43 -0.08 -1.00 0.14 -2.82 0.01 -0.39 -0.09 0.46 -1.98 0.49 -0.98
Monza 0.16 1.43 0.31 -0.06 -2.74 0.47 0.00 -1.42 0.51 0.61 0.00 0.14
Trento -0.03 -1.41 -1.32 0.31 0.05 -0.66 -0.79 -0.58 -0.29 0.19 -1.00 -0.47
Varese -0.16 0.74 0.63 0.40 0.00 -0.09 -1.67 1.00 1.23 0.00 0.07 0.00
ΔHhor
Aosta 0.17 0.21 1.88 1.36 0.25 -1.26 -0.02 0.67 0.52 0.69 0.03 -0.21
Bergamo -0.89 1.07 -0.14 0.36 0.18 -0.46 -0.47 -0.09 1.05 -0.31 0.45 -0.04
Monza 0.00 -0.22 -0.41 -0.11 0.00 0.00 -0.94 -1.14 0.11 -0.79 0.20 0.00
Trento -0.10 -0.23 -0.82 0.00 -1.47 0.95 0.23 -1.05 0.15 -0.21 0.28 -0.05
Varese 0.04 -0.17 -0.43 0.97 2.08 0.00 -0.15 -0.04 0.00 -0.56 -0.70 0.00
ΔRH
Aosta -6.33 4.67 4.31 0.78 0.45 0.63 4.02 0.82 -0.89 -3.10 -3.24 0.70
Bergamo 0.53 -4.62 -2.22 -0.66 -2.28 -1.69 -3.57 -3.31 -8.86 -4.05 -6.76 1.17
Monza 7.43 -8.13 -0.99 2.53 3.81 -6.14 -2.42 1.82 0.02 -3.03 -0.01 0.15
Trento 4.50 -6.45 7.20 3.68 -0.46 -1.74 2.98 -1.64 0.24 4.84 -1.19 5.09
Varese -19.6 -0.08 3.00 12.1 0.01 7.97 4.84 0.49 7.34 0.95 5.85 2.90
42
Table 6: Distributions of the sample buildings in the heating and cooling rating classes.
classes A B C D E F G
H C H C H C H C H C H C H C
Aosta 0% 6% 25% 19% 17% 19% 8% 6% 8% 10% 23% 13% 19% 27% Bergamo 2% 2% 23% 23% 17% 8% 8% 17% 4% 10% 10% 10% 35% 29% Monza 0% 0% 25% 25% 25% 13% 0% 13% 4% 23% 29% 6% 17% 21% Trento 2% 4% 23% 21% 10% 19% 15% 6% 4% 19% 8% 6% 38% 25% Varese 0% 0% 25% 25% 21% 13% 4% 13% 4% 23% 19% 4% 27% 23%
Average 1% 2% 24% 23% 18% 14% 7% 11% 5% 17% 18% 8% 27% 25%
43
Table 7: Analysis of the variation in the heating energy need ratings according to the proposed criteria.
Criteria A B Upgrade Downgrade Upgrade Downgrade
Aosta 2.1% 4.2% 6.3% 2.1%
Bergamo 37.5% 0.0% 45.8% 0.0%
Monza 0.0% 12.5% 0.0% 50.0%
Trento 22.9% 0.0% 31.3% 0.0%
Varese 0.0% 6.3% 0.0% 10.4%
44
Table 8: Analysis of the variation in the cooling energy need ratings according to the proposed criteria.
Criteria A B Upgrade Downgrade Upgrade Downgrade
Aosta 2.1% 20.8% 0.0% 33.3%
Bergamo 0.0% 14.6% 0.0% 18.8%
Monza 0.0% 20.8% 0.0% 13.0%
Trento 0.0% 58.3% 0.0% 58.3%
Varese 25.0% 0.0% 18.8% 0.0%
Figurre 1
45
Figur
re 2
46
Figur
re 3
47
Grap
phical abstraact
48