Embed Size (px)
Citation preview
MULTI-SENSOR BASED AMBIENTASSISTED LIVING SYSTEM
a thesis
submitted to the department of electrical and
electronics engineering
and the graduate school of engineering and science
of bilkent university
in partial fulfillment of the requirements
for the degree of
master of science
By
Ahmet Yazar
July, 2013

I certify that I have read this thesis and that in my opinion it is fully adequate,
in scope and in quality, as a thesis for the degree of Master of Science.
Prof. Dr. A. Enis Cetin (Advisor)
I certify that I have read this thesis and that in my opinion it is fully adequate,
in scope and in quality, as a thesis for the degree of Master of Science.
Prof. Dr. Billur Barshan
I certify that I have read this thesis and that in my opinion it is fully adequate,
in scope and in quality, as a thesis for the degree of Master of Science.
Assoc. Prof. Dr. Ibrahim Korpeoglu
Approved for the Graduate School of Engineering and Science:
Prof. Dr. Levent OnuralDirector of the Graduate School
ii
ABSTRACT
MULTI-SENSOR BASED AMBIENT ASSISTED LIVINGSYSTEM
Ahmet Yazar
M.S. in Electrical and Electronics Engineering
Supervisor: Prof. Dr. A. Enis Cetin
July, 2013
An important goal of Ambient Assisted Living (AAL) research is to contribute
to the quality of life of the elderly and handicapped people and help them to
maintain an independent lifestyle with the use of sensors, signal processing and
the available telecommunications infrastructure. From this perspective, detection
of unusual human activities such as falling person detection has practical applica-
tions. In this thesis, a low-cost AAL system using vibration and passive infrared
(PIR) sensors is proposed for falling person detection, human footstep detec-
tion, human motion detection, unusual inactivity detection, and indoor flooding
detection applications. For the vibration sensor signal processing, various fre-
quency analysis methods which consist of the discrete Fourier transform (DFT),
mel-frequency cepstral coefficients (MFCC), discrete wavelet transform (DWT)
with different filter-banks, dual-tree complex wavelet transform (DT-CWT), and
single-tree complex wavelet transform (ST-CWT) are compared to each other to
obtain the best possible classification result in our dataset. Adaptive-threshold
based Markov model (MM) classifier is preferred for the human footstep detec-
tion. Vibration sensor based falling person detection system employs Euclidean
distance and support vector machine (SVM) classifiers and these classifiers are
compared to each other. PIR sensors are also used for falling person detection
and this system employs two PIR sensors. To achieve the most reliable system, a
multi-sensor based falling person detection system which employs one vibration
and two PIR sensors is developed. PIR sensor based system has also the capabil-
ity of detecting uncontrolled flames and this system is integrated to the overall
system. The proposed AAL system works in real-time on a standard personal
computer or chipKIT Uno32 microprocessors without computers. A network is
setup for the communication of the Uno32 boards which are connected to dif-
ferent sensors. The main processor gives final decisions and emergency alarms
are transmitted to outside of the smart home using the auto-dial alarm system
iii
iv
via telephone lines. The resulting AAL system is a low-cost and privacy-friendly
system thanks to the types of sensors used.
Keywords: Ambient assisted living, vibration sensor, passive infrared sensor, com-
plex wavelet transform, support vector machines, falling person detection, Markov
models, human footstep detection, unusual inactivity detection, indoor flooding
detection.
OZET
COKLU ALGILAYICI TABANLI CEVRE DESTEKLIYASAM SISTEMI
Ahmet Yazar
Elektronik ve Elektronik Muhendisligi, Yuksek Lisans
Tez Yoneticisi: Prof. Dr. A. Enis Cetin
Temmuz, 2013
Cevre destekli yasam arastırmalarının amacı, yaslı ve bakıma muhtac kisilerin
yasam kalitelerine katkıda bulunabilmektir. Algılayıcıların, isaret isleme
yontemlerinin ve halihazırdaki iletisim altyapısının kullanılmasıyla bu kisiler icin
ozgur bir yasam bicimi saglanabilecektir. Bu bakıs acısıyla, dusen kisi ornegi
gibi olagandısı insan hareketlerinin tespit edilebilmesinin kullanıslı uygulamaları
bulunmaktadır. Bu tezde, titresim ve pasif kızılberisi algılayıcıları kullanılarak
dusuk maliyetli bir cevre destekli yasam sistemi onerilmistir. Alt sistemler; dusen
kisi tespiti, insan adımı tespiti, hareket/hareketsizlik tespiti ve bina ici su taskını
tespiti uygulamalarından olusmaktadır. Titresim algılayıcının frekans iceriginden
oznitelik cıkarımı yapabilmek icin ayrık Fourier donusumu, mel-frekansı kepstral
katsayıları, ayrık dalgacık donusumu, cift agac karmasık dalgacık donusumu ve
tek agac karmasık dalgacık donusumu yontemleri veri kumemiz uzerinde en iyi
sınıflandırma sonucunu saglayabilmek icin birbirleriyle karsılastırılmıstır. Insan
adımı tespiti icin, uyarlanabilir esik degerli Markov modelleri sınıflandırıcısı
tercih edilmistir. Titresim algılayıcı tabanlı dusen kisi tespiti uygulamasında
Euclidean uzaklıgı ve destek vektor makineleri sınıflandırıcıları kullanılmıstır.
Bu sınıflandırıcı yontemlerinin aralarında karsılastırma yapılmıstır. Iki tane
pasif kızılberisi algılayıcı aynı anda kullanılarak farklı bir dusen kisi tespiti
yaklasımı gelistirilmistir. Sonrasında, titresim algılayıcı ve iki tane pasif kızılberisi
algıyacısının birlikte kullanıldıgı daha guvenilir bir dusen kisi tespiti uygulaması
tanıtılmıstır. Daha onceki calısmalardan olan kontrolsuz alev tespiti sistemi,
cevre destekli akıllı ev tasarımına dahil edilmistir. Onerilen sistem gercek zamanlı
olarak standart bir bilgisayarda ya da chipKIT Uno32 mikroislemciler uzerinde
calısabilmektedir. Her bir algılayıcıya baglı Uno32 islemciler icin bir ag kurularak
islemcilerin haberlesmeleri saglanmıstır. Ana islemci tum kararları birlestirerek
sonucta olusacak muhtemel bir acil durum alarmını telefon hatları uzerinden evin
v

vi
dısındaki istenen bir merkeze iletebilmektedir. Bu amacla otomatik aramalı alarm
sistemi gelistirilmistir.
Anahtar sozcukler : Cevre destekli yasam, titresim algılayıcı, pasif kızılberisi
algılayıcı, karmasık dalgacık donusumu, destek vektor makineleri, dusen kisi
tespiti, Markov modelleri, insan adımı tespiti, hareketsizlik tespiti, bina ici su
taskını tespiti.

Acknowledgement
I would like to express my gratitude to my supervisor Prof. Dr. A. Enis Cetin
for his guidance, encouragement, and useful comments and remarks throughout
the development of this thesis.
Furthermore, I would like to offer my special thanks to Prof. Dr. Billur
Barshan and Assoc. Prof. Dr. Ibrahim Korpeoglu for accepting to read and
review this thesis.
I wish to thank Osman Gunay for his great help in solving many problems.
Thanks to Furkan Keskin for sharing his ST-CWT works and his friendship.
I would also like to thank Kıvanc Kose who have willingly shared his precious
time whenever I need to consult him. I would also like to thank Ihsan Inac for
sharing his knowledge about the hardwares used in this work.
My thanks are extended to Onur Yorulmaz, Serdar Cakır, Oguzcan Dobrucalı,
Necip Gurler, Akın Sevimli, and Alexander Suhre for their collaboration and
constructive friendship.
I would like to specially thank Hasan Huseyin Erkaya who supported me all
the way through my undergraduate years at Eskisehir. He has become and is
more than a teacher for me.
I would like to acknowledge valuable support of my mother whose warm-
hearted and encouraging spirit always refreshed me, and my father whose I feel
his firm support always with me.
Besides, I am grateful that Information and Communication Technologies
Authority has given me opportunity to complete this thesis.
I would also like to express my appreciation to TUBITAK for providing schol-
arship (BIDEB-2210) throughout my graduate study.
This work was supported by Turk Telekom under Grant Number 3015-03.
vii
Contents
1 Introduction 1
1.1 Related Work . . . . . . . . . . . . . . . . . . . . . . . . . . . . . 2
1.2 Contribution . . . . . . . . . . . . . . . . . . . . . . . . . . . . . . 4
1.3 Thesis Outline . . . . . . . . . . . . . . . . . . . . . . . . . . . . . 5
2 Hardware Implementations 6
2.1 Arduino Prototyping Platform . . . . . . . . . . . . . . . . . . . . 7
2.2 The Vibration Sensor . . . . . . . . . . . . . . . . . . . . . . . . . 9
2.2.1 Sensor Properties . . . . . . . . . . . . . . . . . . . . . . . 9
2.2.2 Related Work . . . . . . . . . . . . . . . . . . . . . . . . . 10
2.2.3 Sensor Signal Processing . . . . . . . . . . . . . . . . . . . 11
2.3 The PIR Sensor . . . . . . . . . . . . . . . . . . . . . . . . . . . . 12
2.3.1 Sensor Properties . . . . . . . . . . . . . . . . . . . . . . . 13
2.3.2 Related Work . . . . . . . . . . . . . . . . . . . . . . . . . 15
2.3.3 Sensor Signal Processing . . . . . . . . . . . . . . . . . . . 16
viii
CONTENTS ix
2.4 Auto-Dial Alarm System . . . . . . . . . . . . . . . . . . . . . . . 17
2.5 Summary . . . . . . . . . . . . . . . . . . . . . . . . . . . . . . . 19
3 Feature Extraction from One-Dimensional Signals 20
3.1 Classical Signal Analysis Methods . . . . . . . . . . . . . . . . . . 21
3.1.1 Discrete Fourier Transform . . . . . . . . . . . . . . . . . . 22
3.1.2 Mel-Frequency Cepstral Coefficients . . . . . . . . . . . . . 23
3.1.3 Discrete Wavelet Transform . . . . . . . . . . . . . . . . . 23
3.1.4 Dual-Tree Complex Wavelet Transform . . . . . . . . . . . 24
3.2 Single-Tree Complex Wavelet Transform . . . . . . . . . . . . . . 27
3.3 Shift-Invariance Property Based Comparison . . . . . . . . . . . . 31
3.4 Computational Complexity Based Comparison . . . . . . . . . . . 39
3.5 Summary . . . . . . . . . . . . . . . . . . . . . . . . . . . . . . . 40
4 Ambient Assisted Living System Using Different Sensors 41
4.1 Datasets . . . . . . . . . . . . . . . . . . . . . . . . . . . . . . . . 42
4.2 Human Motion and Unusual Inactivity Detection . . . . . . . . . 44
4.2.1 PIR Sensor Based Detection Algorithms . . . . . . . . . . 44
4.2.2 Vibration Sensor Based Human Footstep Detection . . . . 47
4.3 Falling Person Detection . . . . . . . . . . . . . . . . . . . . . . . 51
4.3.1 Vibration Sensor Based Detection Algorithm . . . . . . . . 52
4.3.2 Two-PIR-Sensor Based Detection Algorithm . . . . . . . . 59

CONTENTS x
4.3.3 Multi-Sensor Based Detection Algorithm . . . . . . . . . . 64
4.4 Indoor Flooding Detection . . . . . . . . . . . . . . . . . . . . . . 66
4.5 Stand-Alone Sensor Fusion Application . . . . . . . . . . . . . . . 67
4.6 Summary . . . . . . . . . . . . . . . . . . . . . . . . . . . . . . . 73
5 Conclusion and Future Work 74
Bibliography 76
List of Figures
2.1 chipKIT Uno32 board. . . . . . . . . . . . . . . . . . . . . . . . . 8
2.2 Schematics presentations of internal structures of different vibra-
tion sensors. . . . . . . . . . . . . . . . . . . . . . . . . . . . . . . 10
2.3 Stages of the vibration sensor signal processing. . . . . . . . . . . 11
2.4 10-second-long vibration sensor signal sample corresponding to a
walking event. . . . . . . . . . . . . . . . . . . . . . . . . . . . . . 12
2.5 Schematics illustration of internal structure of the PIR sensor
which contains two reverse-connected pyroelectric sensing elements. 12
2.6 An example illustration to describe working mechanism of the PIR
sensor. . . . . . . . . . . . . . . . . . . . . . . . . . . . . . . . . . 13
2.7 Paradox Pro Plus 476+ (a) and schematics illustration of the Fres-
nel lens on the detector box (b). . . . . . . . . . . . . . . . . . . . 14
2.8 Top and side views of the range of PIR sensor, taken from Paradox
476+ datasheet. . . . . . . . . . . . . . . . . . . . . . . . . . . . . 15
2.9 Stages of the PIR sensor signal processing. . . . . . . . . . . . . . 16
2.10 10-second-long PIR sensor signal sample corresponding to a walk-
ing event. . . . . . . . . . . . . . . . . . . . . . . . . . . . . . . . 17
xi

LIST OF FIGURES xii
2.11 Application circuit for the HT9200A DTMF tone generator (a)
and illustration of the auto-dial alarm system (b). . . . . . . . . . 18
2.12 Auto-dial alarm system circuit board. . . . . . . . . . . . . . . . . 19
3.1 DFT of a two-second-long vibration sensor signal record of a falling
person and boundary values of the related frequency sub-bands. . 22
3.2 Seven-level wavelet tree. . . . . . . . . . . . . . . . . . . . . . . . 24
3.3 Seven-level complex wavelet tree. . . . . . . . . . . . . . . . . . . 25
3.4 Time-varying lifting scheme for the ST-CWT. . . . . . . . . . . . 27
3.5 A unit step signal, and its four-sample and five-sample shifted
versions. . . . . . . . . . . . . . . . . . . . . . . . . . . . . . . . . 32
3.6 Third level wavelet coefficients of a unit step signal and its shifted
versions for the Haar wavelet. . . . . . . . . . . . . . . . . . . . . 33
3.7 Third level wavelet coefficients of a unit step signal and its shifted
versions for the Daubechies-2 wavelet. . . . . . . . . . . . . . . . . 34
3.8 Third level wavelet coefficients of a unit step signal and its shifted
versions for the Daubechies-4 wavelet. . . . . . . . . . . . . . . . . 35
3.9 Third level wavelet coefficients of a unit step signal and its shifted
versions for the Biorthogonal-3.3 wavelet. . . . . . . . . . . . . . . 36
3.10 Third level wavelet coefficients of a unit step signal and its shifted
versions for the DT-CWT wavelet. . . . . . . . . . . . . . . . . . 37
3.11 Third level wavelet coefficients of a unit step signal and its shifted
versions for the ST-CWT wavelet. . . . . . . . . . . . . . . . . . . 38
4.1 Flowchart of the PIR sensor based human motion detection algo-
rithm. . . . . . . . . . . . . . . . . . . . . . . . . . . . . . . . . . 45
LIST OF FIGURES xiii
4.2 Flowchart of the PIR sensor based unusual inactivity detection
algorithm. . . . . . . . . . . . . . . . . . . . . . . . . . . . . . . . 46
4.3 Flowchart of the vibration sensor based human footstep detection
algorithm. . . . . . . . . . . . . . . . . . . . . . . . . . . . . . . . 49
4.4 Flowchart of the vibration sensor based falling person detection
algorithm. . . . . . . . . . . . . . . . . . . . . . . . . . . . . . . . 53
4.5 A walking man illustration to describe working mechanism of the
two-PIR-sensor based falling person detection system. . . . . . . . 60
4.6 A falling man illustration to describe working mechanism of the
two-PIR-sensor based falling person detection system. . . . . . . . 60
4.7 Flowchart of the two-PIR-sensor based falling person detection al-
gorithm. . . . . . . . . . . . . . . . . . . . . . . . . . . . . . . . . 61
4.8 A sitting man illustration to describe working mechanism of the
two-PIR-sensor based falling person detection system. . . . . . . . 63
4.9 A sleeping man illustration to describe working mechanism of the
two-PIR-sensor based falling person detection system. . . . . . . . 63
4.10 Flowchart of the multi-sensor based falling person detection algo-
rithm. . . . . . . . . . . . . . . . . . . . . . . . . . . . . . . . . . 65
4.11 Flowchart for the vibration sensor based activity-output relation
using three bits of data. . . . . . . . . . . . . . . . . . . . . . . . 68
4.12 Flowchart for the two-PIR-sensor based activity-output relation
using three bits of data. . . . . . . . . . . . . . . . . . . . . . . . 69
4.13 Illustration for the dataflow between Uno32 boards using three bits
of data. . . . . . . . . . . . . . . . . . . . . . . . . . . . . . . . . 71

LIST OF FIGURES xiv
4.14 An example smart home environment which has two vibration sen-
sors, eight pair PIR sensors, and three flooding detector circuits. . 72
List of Tables
3.1 Impulse response of Kingsbury’s eighth order q-shift analysis filters
for the DT-CWT. They are normalized so that∑n
h0[n] = 1. . . . 26
3.2 The exact number of real multiplications in the feature extraction
methods we used. N = 1024 is the number of signal samples in
each window; M = 8 is the number of the frequency sub-bands; p
is the number of nonzero filter coefficients, and r = 7 is the number
of the levels in a wavelet-tree. . . . . . . . . . . . . . . . . . . . . 40
4.1 Transition matrix for the human-footstep sourced signals. . . . . . 47
4.2 Transition matrix for the other signal sources. . . . . . . . . . . . 47
4.3 Confusion matrix for the human footstep detection system using
testing dataset. . . . . . . . . . . . . . . . . . . . . . . . . . . . . 50
4.4 Confusion matrix for the human footstep detection system using
all dataset. . . . . . . . . . . . . . . . . . . . . . . . . . . . . . . . 50
4.5 Numbers of “true detection” versus “false alarm” for 1024-sample-
long windows, using the Euclidean distance classifier. . . . . . . . 54
4.6 Numbers of “true detection” versus “false alarm” for 1024-sample-
long windows, using the SVM classifier. . . . . . . . . . . . . . . . 54
xv
LIST OF TABLES xvi
4.7 Numbers of the different classifications between the original sig-
nals and 64-sample shifted version of the original signals for 1024-
sample-long vibration sensor signal windows, using the Euclidean
distance classifier. . . . . . . . . . . . . . . . . . . . . . . . . . . . 56
4.8 Numbers of the different classifications between the original sig-
nals and 64-sample shifted version of the original signals for 1024-
sample-long vibration sensor signal windows, using the SVM clas-
sifier. . . . . . . . . . . . . . . . . . . . . . . . . . . . . . . . . . . 56
4.9 Change amounts in the energy of the fourth level wavelet coeffi-
cients or the corresponding frequency sub-band while shifting the
1024-sample-long vibration sensor signal windows. Lower num-
bers mean that shift-invariance is provided better by the related
frequency analysis methods. Experiment is repeated for 1000 dif-
ferent signal windows and average values are given. . . . . . . . . 57
4.10 Confusion matrix for the vibration sensor based falling person de-
tection system using the second dataset. This dataset is composed
of one-minute-long records which correspond to the one sample for
every one minute. . . . . . . . . . . . . . . . . . . . . . . . . . . . 58
4.11 Confusion matrix for the two-PIR-sensor based falling person de-
tection system using the second dataset. This dataset is composed
of one-minute-long records which correspond to the one sample for
every one minute. . . . . . . . . . . . . . . . . . . . . . . . . . . . 62
4.12 Confusion matrix for the multi-sensor based falling person detec-
tion system using the second dataset. This dataset is composed of
one-minute-long records which correspond to the one sample for
every one minute. . . . . . . . . . . . . . . . . . . . . . . . . . . . 64
4.13 Confusion matrix for the vibration sensor based indoor flooding
detection system. . . . . . . . . . . . . . . . . . . . . . . . . . . . 66
Chapter 1
Introduction
Most European countries including Turkey will face a large increase in the number
of elderly people in the near future. The development of intelligent homes will
improve the quality of life of seniors and the handicapped people. As a result, a
lot of studies are introduced to improve intelligent homes in the last ten years. It
is possible to use different sensors to improve the quality of the elderly people’s
lives.
It is reported that unexpected falling is a major problem and about one-third
of people over 65 falls unexpectedly each year [1]. Fall related health and injury
costs are on the order of billions of dollars worldwide. Additionally, unusual
inactivity detection is also very important because of the sudden diseases like
heart attacks. As a result, we focus on the falling person detection systems and
decided that an ambient assisted living (AAL) system can be designed using
vibration and PIR sensors for this purpose. This thesis presents a multi-sensor
based AAL system which has the capability of falling person detection, human
footstep detection, human motion detection, unusual inactivity detection, indoor
flooding detection and uncontrolled flame detection. Correspondingly, various
frequency analysis methods, different classifiers, and novel algorithms related with
the subsystems are described. The main aim of the overall system is to transmit
an alarm whenever an emergency situation happens in the elderly person’s house.
1
1.1 Related Work
There are several different types of smart home designs in the literature [2].
Computer vision systems can be used to track the person and classify his/her
movements in a house [3], [4]. In recent years, the number of the Kinect sensor
based systems continue to increase for the smart home implementations [5], [6].
Wearable devices are often used in similar applications [7], [8], [9], [10]. There
are also several different types of sensor network based systems in the literature
[11], [12], [13], [14].
The available smart home applications can be categorized in two main groups:
Ambient assisted systems and wearable systems. Ambient systems include com-
puter vision based systems, Kinect sensor based systems, and different types of
sensor network based systems [15]. Wearable systems are based on accelerom-
eters, miniature inertial and magnet sensors [7], [8], [9], [10]. Computer vision
based systems have generally low miss-detection rates and high number of false
alarms because of the abundance of information in video processing. However,
most people find having a camera in their houses invasion of their privacy, even
if the video and sound recordings are not transmitted elsewhere. Also, the com-
puter vision based systems need high computational power of processors and
large number of cameras to handle blind spots. Additionally, there is a certain
installation cost of the computer vision based system so the overall system can
be defined as a high-cost system. Kinect sensor based systems have almost the
same conditions with the computer vision based systems [4], [6], [15]. They are
thought as more privacy friendly systems than the computer vision based systems
but they are not completely privacy-friendly systems.
Currently, there are many available commercial products which are based on
the wearable devices. The wearable systems have remarkable advantages. For
example, these systems do not need any installation cost and there is only one
module which is placed on the person. However, the main disadvantage of these
systems is that wearing and/or carrying them is not convenient all the time and
elderly people may simply forget to put on these sensors.
2
Lastly, advantages and disadvantages of the sensor network based systems can
vary accordingly to the sensor types and the number of the used sensors. Our
vibration sensor and PIR sensor based system’s advantages are privacy-friendly,
unnoticeable system to the person, only one-dimensional signal processing, and
the system does not have a wearable component. The large number of the sensors
and the certain installation cost can be considered as the disadvantages of our
sensor network based system.
There are many other studies in the subsystem areas of our AAL system.
The related works are examined for each of the detection systems one by one.
As a start, a survey paper about principles and approaches for the falling person
detection is published last year [15]. It is accepted that fall detection systems help
elderly people to maintain an independent way of life [16], [17]. Currently, the
commercially available fall detection systems feature body-worn sensors which
are connected to a wireless network [18], [9]. There are other recent studies
which turn a mobile phone into a fall detector [19]. Computer vision and Kinect
sensor based fall detectors are studied in various works [4], [6], [15]. Vibration
sensor based fall detection systems are proposed in two studies so far [20], [21].
However, pattern recognition algorithms for fall detection are not described in
the mentioned articles. Without a recognition algorithm the resulting system
will not be a robust and practical system. There are also multi-PIR-sensor based
fall detectors which use generally more than four PIR sensors [22], [23].
Human footstep or walking person detection is another application studied
using different hardwares. Computer vision based systems can be used in mobile
systems like pedestrian detection by a camera system in the car [24]. Vibra-
tion sensor or seismic sensor based systems are used indoor and outdoor widely
[25], [26]. Also, human footstep detection systems can be employed in the mili-
tary applications [27]. Detection of the daily physical activities using a tri-axial
accelerometer is another working area for the similar subjects [28]. Addition-
ally, unusual inactivity detection systems are implemented using computer vision
based and belt-worn kinematic sensor based systems [29], [30]. As a last subsys-
tem, indoor flooding detection applications generally use simple low-cost sensors
however there are also some computer vision based systems [31].
3
In the theoretical part of the thesis, various frequency analysis methods in-
cluding the discrete wavelet transform (DWT) and the dual-tree complex wavelet
transform (DT-CWT) are studied. The DT-CWT has recently emerged as a
promising alternative to the classical DWT [32]. The DT-CWT has desirable
properties such as shift-invariance and lack of aliasing however it still suffers from
increased data rate in the transform domain. Several versions of the DT-CWT
are proposed in the literature for reducing the computational complexity of the
transform [33]. In [34], rational coefficient filters are designed and employed in lat-
tice and lifting structures for efficient implementation of the DT-CWT however,
dual-tree structure is retained. In [35], the authors propose a single-tree com-
plex wavelet transform utilizing complex-valued filter-banks in the tree for face
recognition, but this approach introduces complex arithmetic and it increases the
amount of data as in the DT-CWT.
1.2 Contribution
One of the contributions of this thesis is the design of a real single-tree lifting-
based wavelet transform that possesses complex wavelet-like characteristics, such
as near shift-invariance and lack of aliasing. Unlike [34] in which dual-tree ap-
proach is used, we design a single-tree lifting-based complex wavelet transform.
Our filter-bank has time-varying update and prediction filters for lifting structures
in the single-tree context. Time-varying nature of the proposed filters enables the
implementation of half-sample delayed filters in a single tree in an interchangeable
manner.
Our system is different from the currently available AAL systems. We propose
to install both vibration and PIR sensors to an intelligent home to realize a robust
system. These two different types of sensors complement each other and daily
activities of seniors can be monitored without producing false alarms and unusual
events like falling can be reliably detected. The resulting AAL system will be a
low-cost and privacy-friendly system thanks to the types of sensors used.
4
Human footstep detection is succeed by using the adaptive-threshold based
Markov model (MM) classifier. More importantly, three separate falling person
detection algorithms are introduced in this thesis, and all of these falling person
detection algorithms are novel. Also, the stand-alone AAL system using the
vibration and two PIR sensors is described as an original study.
1.3 Thesis Outline
In Chapter 2, the microprocessor unit for the real-time system, the vibration
sensor, the PIR sensor and the auto-dial alarm system via telephone lines are
described. Various frequency analysis methods which consist of the DFT, MFCC,
DWT, DT-CWT, and ST-CWT are introduced in Chapter 3. In Chapter 4, the
subsystems of our AAL system, classification methods and experimental setups
are described. Chapter 5 is the last chapter that concludes the thesis by providing
an overall summary of the results and gives some ideas for the future works.
5
Chapter 2
Hardware Implementations
Sensor-based AAL systems can contain different equipments. These equipments
may have various advantages and disadvantages. For a multi-sensor based smart
home application, the system designer should take into account the characteristics
of these individual components meticulously. In this chapter, sensors and other
complementary components which we employed in the AAL system are described.
In Section 2.1, the microprocessor unit for the real-time system is intro-
duced. Analog-to-digital conversion and other processes are all done on these
microprocessor units. Vibration sensor and an analog-front-end circuit are de-
scribed in Section 2.2. One-axis vibration sensor is used to sense vibrations on the
floor. The PIR sensor and a modified sensor circuit are described in Section 2.3.
PIR sensors are generally used in human motion detection based applications.
Microcontroller-compatible auto-dial alarm system is presented in Section 2.4.
Our auto-dial alarm system transmits the desired emergency alarms to a call
center or to an operator via telephone lines.
6
2.1 Arduino Prototyping Platform
Arduino is a prototyping platform based on easy-to-use hardware and software
[36]. All of the hardware and software are open-source for the Arduino protoyping
platforms. There are several Arduino boards for different purposes. One of the
modest one is Arduino Uno board. This electronics board is modernized by
Digilent Inc. and chipKIT Uno32 board is developed as an Arduino-compatible
platform. The Uno32 combines Arduino compatibility with the Microchip PIC32
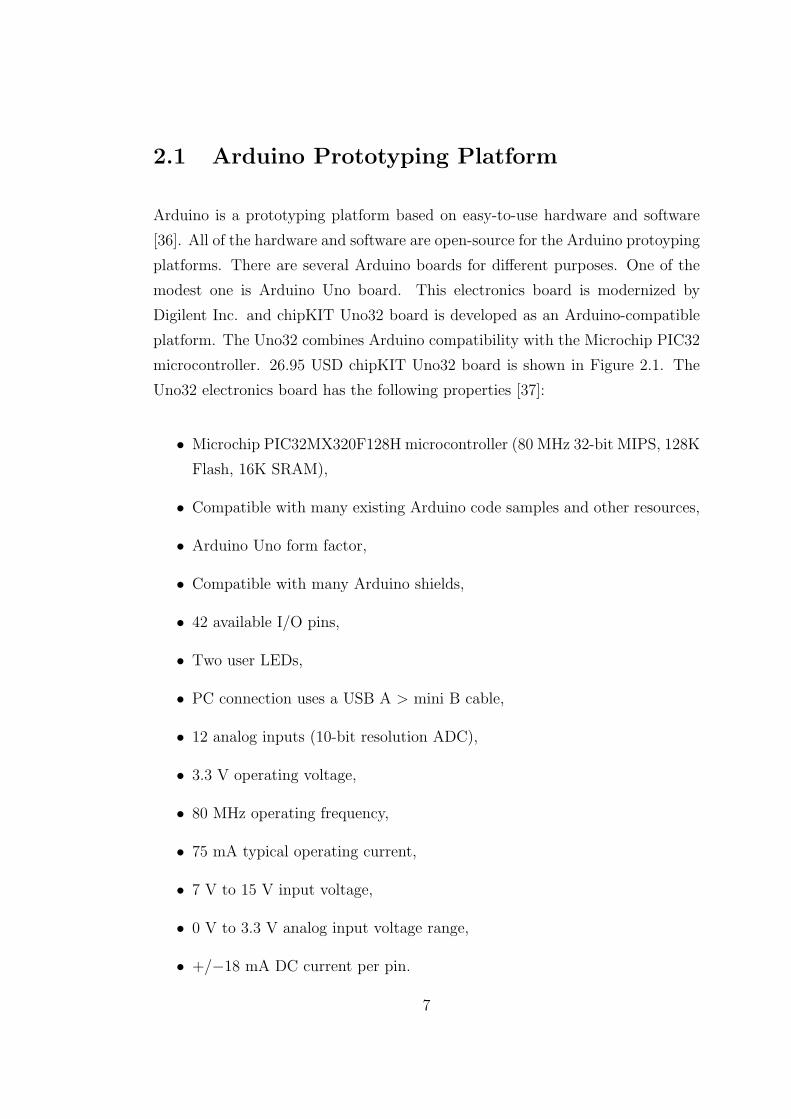
microcontroller. 26.95 USD chipKIT Uno32 board is shown in Figure 2.1. The
Uno32 electronics board has the following properties [37]:
• Microchip PIC32MX320F128H microcontroller (80 MHz 32-bit MIPS, 128K
Flash, 16K SRAM),
• Compatible with many existing Arduino code samples and other resources,
• Arduino Uno form factor,
• Compatible with many Arduino shields,
• 42 available I/O pins,
• Two user LEDs,
• PC connection uses a USB A > mini B cable,
• 12 analog inputs (10-bit resolution ADC),
• 3.3 V operating voltage,
• 80 MHz operating frequency,
• 75 mA typical operating current,
• 7 V to 15 V input voltage,
• 0 V to 3.3 V analog input voltage range,
• +/−18 mA DC current per pin.
7
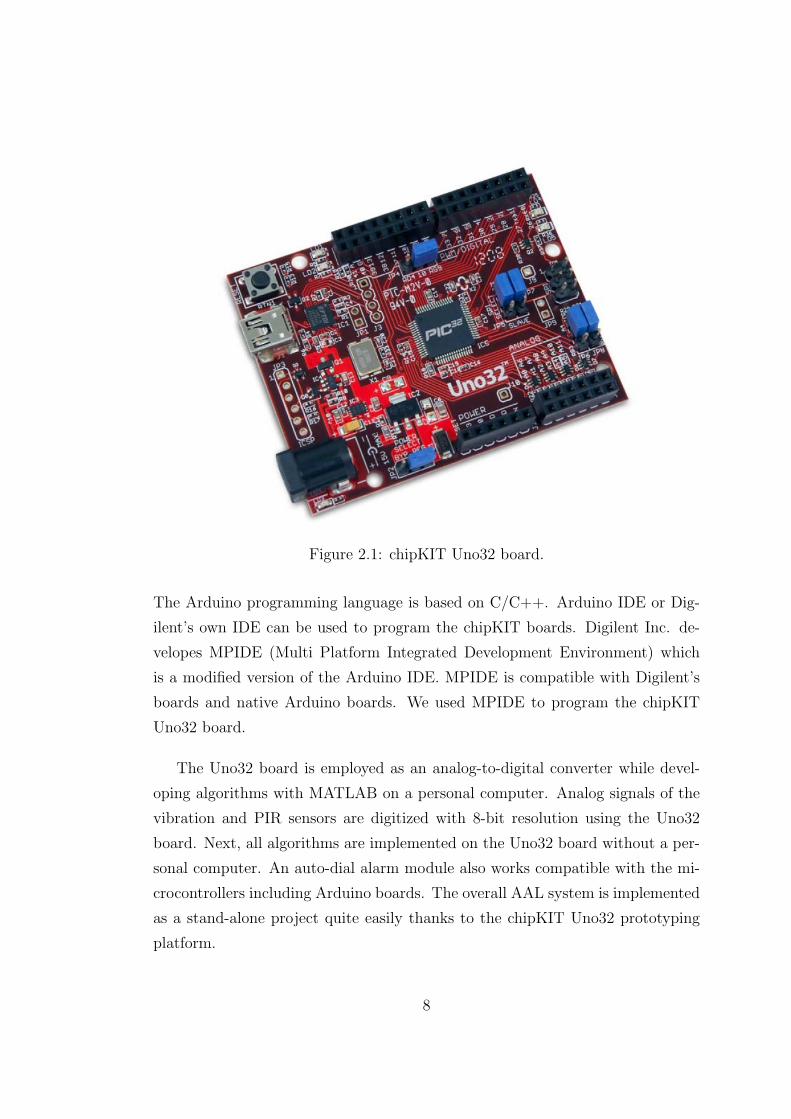
Figure 2.1: chipKIT Uno32 board.
The Arduino programming language is based on C/C++. Arduino IDE or Dig-
ilent’s own IDE can be used to program the chipKIT boards. Digilent Inc. de-
velopes MPIDE (Multi Platform Integrated Development Environment) which
is a modified version of the Arduino IDE. MPIDE is compatible with Digilent’s
boards and native Arduino boards. We used MPIDE to program the chipKIT
Uno32 board.
The Uno32 board is employed as an analog-to-digital converter while devel-
oping algorithms with MATLAB on a personal computer. Analog signals of the
vibration and PIR sensors are digitized with 8-bit resolution using the Uno32
board. Next, all algorithms are implemented on the Uno32 board without a per-
sonal computer. An auto-dial alarm module also works compatible with the mi-
crocontrollers including Arduino boards. The overall AAL system is implemented
as a stand-alone project quite easily thanks to the chipKIT Uno32 prototyping
platform.
8
2.2 The Vibration Sensor
Vibration sensors are also called as a seismic sensor, seismometer or geophone. In
literature, “seismic” and “geophone” words are generally used in the geophysics-
related articles. In this thesis, we prefer “vibration” instead of “seismic” and
“geophone” to prevent possible misunderstandings.
We employ the vibration sensor with the aim of sensing the vibrations on the
floor. The vibration sensor converts vibrations into electrical signals depending
on the intensity of the vibration waves in the axis of the vibration sensor.
Vibration sensors can be categorized into two groups based on the number
of their axes: One-axis and three-axis sensor types. We used one-axis vibration
sensor in this thesis to analyze vibrations in up-down axis.
2.2.1 Sensor Properties
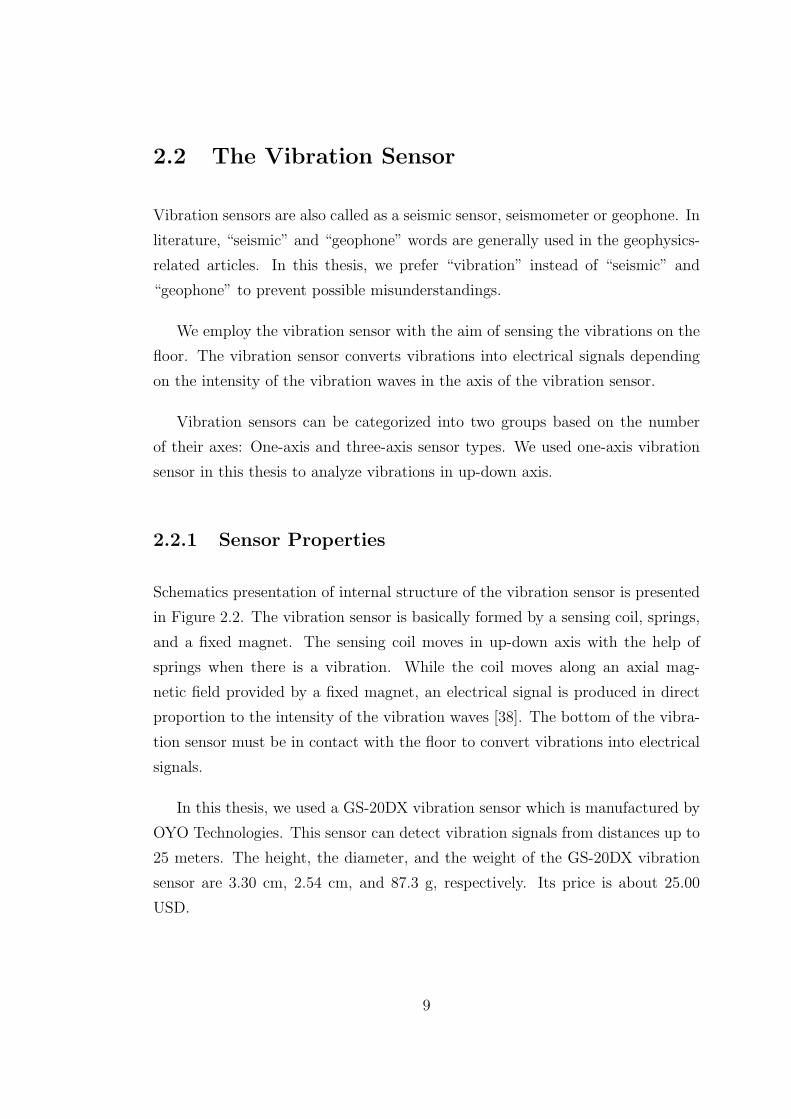
Schematics presentation of internal structure of the vibration sensor is presented
in Figure 2.2. The vibration sensor is basically formed by a sensing coil, springs,
and a fixed magnet. The sensing coil moves in up-down axis with the help of
springs when there is a vibration. While the coil moves along an axial mag-
netic field provided by a fixed magnet, an electrical signal is produced in direct
proportion to the intensity of the vibration waves [38]. The bottom of the vibra-
tion sensor must be in contact with the floor to convert vibrations into electrical
signals.
In this thesis, we used a GS-20DX vibration sensor which is manufactured by
OYO Technologies. This sensor can detect vibration signals from distances up to
25 meters. The height, the diameter, and the weight of the GS-20DX vibration
sensor are 3.30 cm, 2.54 cm, and 87.3 g, respectively. Its price is about 25.00
USD.
9
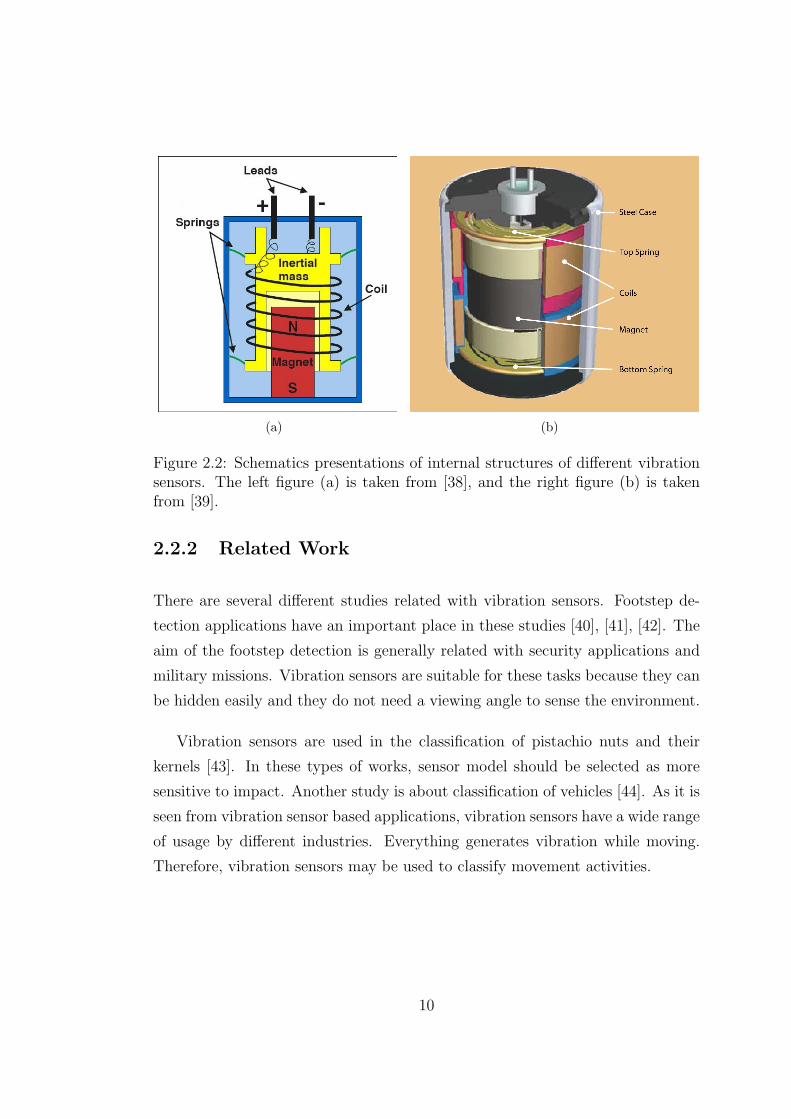
(a) (b)
Figure 2.2: Schematics presentations of internal structures of different vibrationsensors. The left figure (a) is taken from [38], and the right figure (b) is takenfrom [39].
2.2.2 Related Work
There are several different studies related with vibration sensors. Footstep de-
tection applications have an important place in these studies [40], [41], [42]. The
aim of the footstep detection is generally related with security applications and
military missions. Vibration sensors are suitable for these tasks because they can
be hidden easily and they do not need a viewing angle to sense the environment.
Vibration sensors are used in the classification of pistachio nuts and their
kernels [43]. In these types of works, sensor model should be selected as more
sensitive to impact. Another study is about classification of vehicles [44]. As it is
seen from vibration sensor based applications, vibration sensors have a wide range
of usage by different industries. Everything generates vibration while moving.
Therefore, vibration sensors may be used to classify movement activities.
10
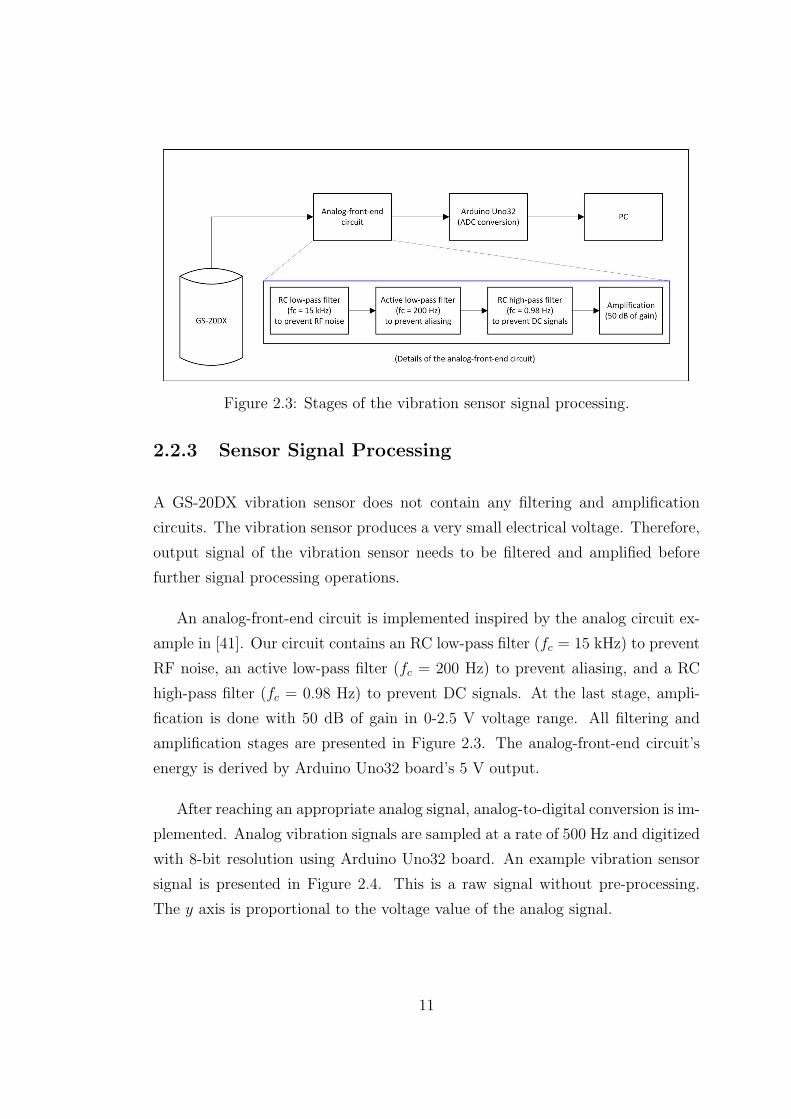
Figure 2.3: Stages of the vibration sensor signal processing.
2.2.3 Sensor Signal Processing
A GS-20DX vibration sensor does not contain any filtering and amplification
circuits. The vibration sensor produces a very small electrical voltage. Therefore,
output signal of the vibration sensor needs to be filtered and amplified before
further signal processing operations.
An analog-front-end circuit is implemented inspired by the analog circuit ex-
ample in [41]. Our circuit contains an RC low-pass filter (fc = 15 kHz) to prevent
RF noise, an active low-pass filter (fc = 200 Hz) to prevent aliasing, and a RC
high-pass filter (fc = 0.98 Hz) to prevent DC signals. At the last stage, ampli-
fication is done with 50 dB of gain in 0-2.5 V voltage range. All filtering and
amplification stages are presented in Figure 2.3. The analog-front-end circuit’s
energy is derived by Arduino Uno32 board’s 5 V output.
After reaching an appropriate analog signal, analog-to-digital conversion is im-
plemented. Analog vibration signals are sampled at a rate of 500 Hz and digitized
with 8-bit resolution using Arduino Uno32 board. An example vibration sensor
signal is presented in Figure 2.4. This is a raw signal without pre-processing.
The y axis is proportional to the voltage value of the analog signal.
11
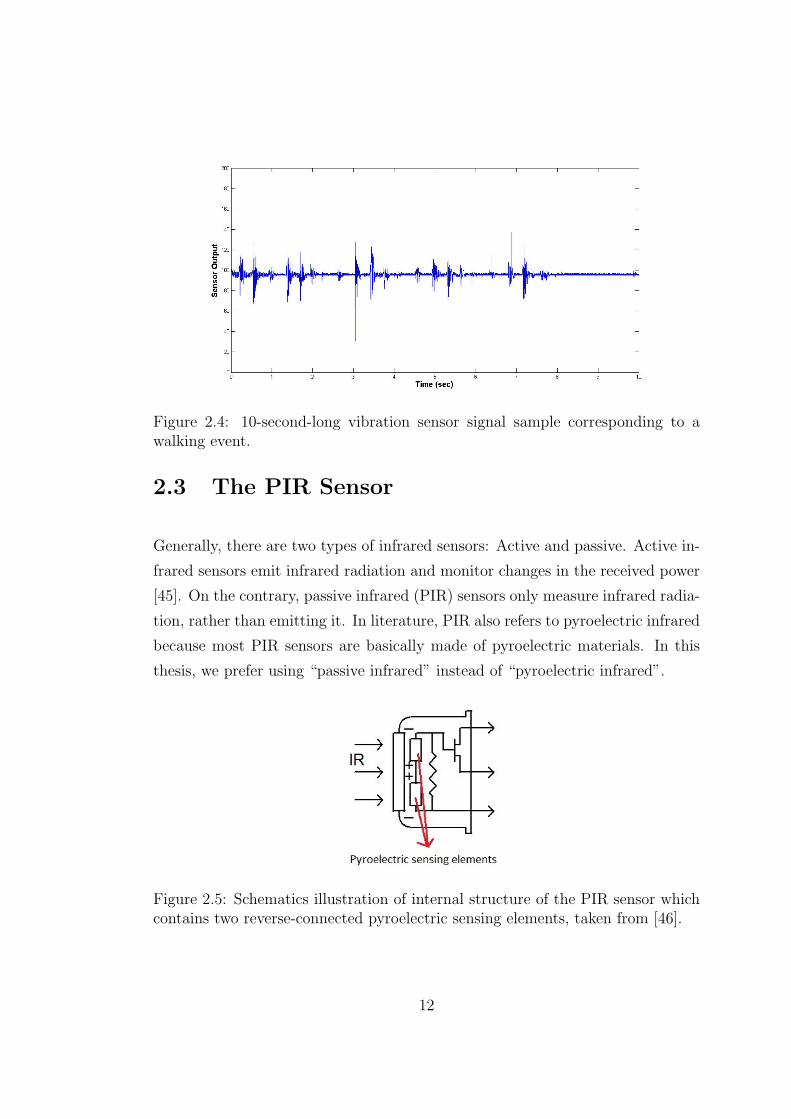
Figure 2.4: 10-second-long vibration sensor signal sample corresponding to awalking event.
2.3 The PIR Sensor
Generally, there are two types of infrared sensors: Active and passive. Active in-
frared sensors emit infrared radiation and monitor changes in the received power
[45]. On the contrary, passive infrared (PIR) sensors only measure infrared radia-
tion, rather than emitting it. In literature, PIR also refers to pyroelectric infrared
because most PIR sensors are basically made of pyroelectric materials. In this
thesis, we prefer using “passive infrared” instead of “pyroelectric infrared”.
Figure 2.5: Schematics illustration of internal structure of the PIR sensor whichcontains two reverse-connected pyroelectric sensing elements, taken from [46].
12
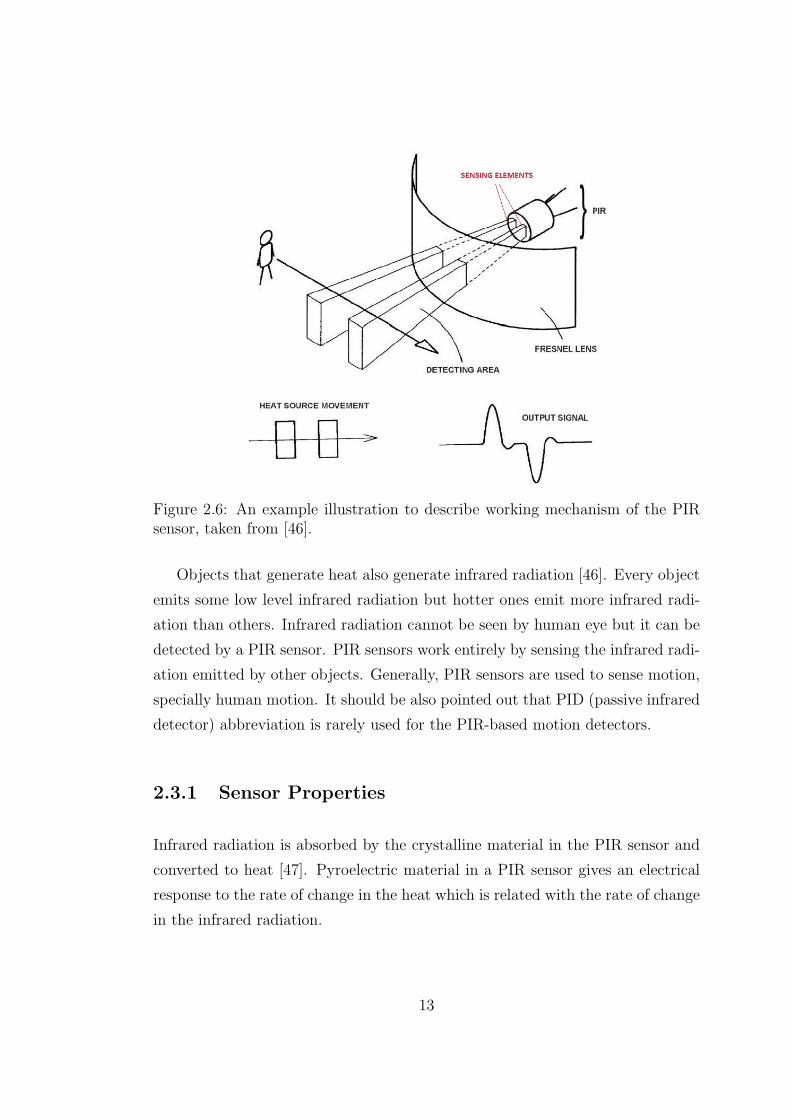
Figure 2.6: An example illustration to describe working mechanism of the PIRsensor, taken from [46].
Objects that generate heat also generate infrared radiation [46]. Every object
emits some low level infrared radiation but hotter ones emit more infrared radi-
ation than others. Infrared radiation cannot be seen by human eye but it can be
detected by a PIR sensor. PIR sensors work entirely by sensing the infrared radi-
ation emitted by other objects. Generally, PIR sensors are used to sense motion,
specially human motion. It should be also pointed out that PID (passive infrared
detector) abbreviation is rarely used for the PIR-based motion detectors.
2.3.1 Sensor Properties
Infrared radiation is absorbed by the crystalline material in the PIR sensor and
converted to heat [47]. Pyroelectric material in a PIR sensor gives an electrical
response to the rate of change in the heat which is related with the rate of change
in the infrared radiation.
13
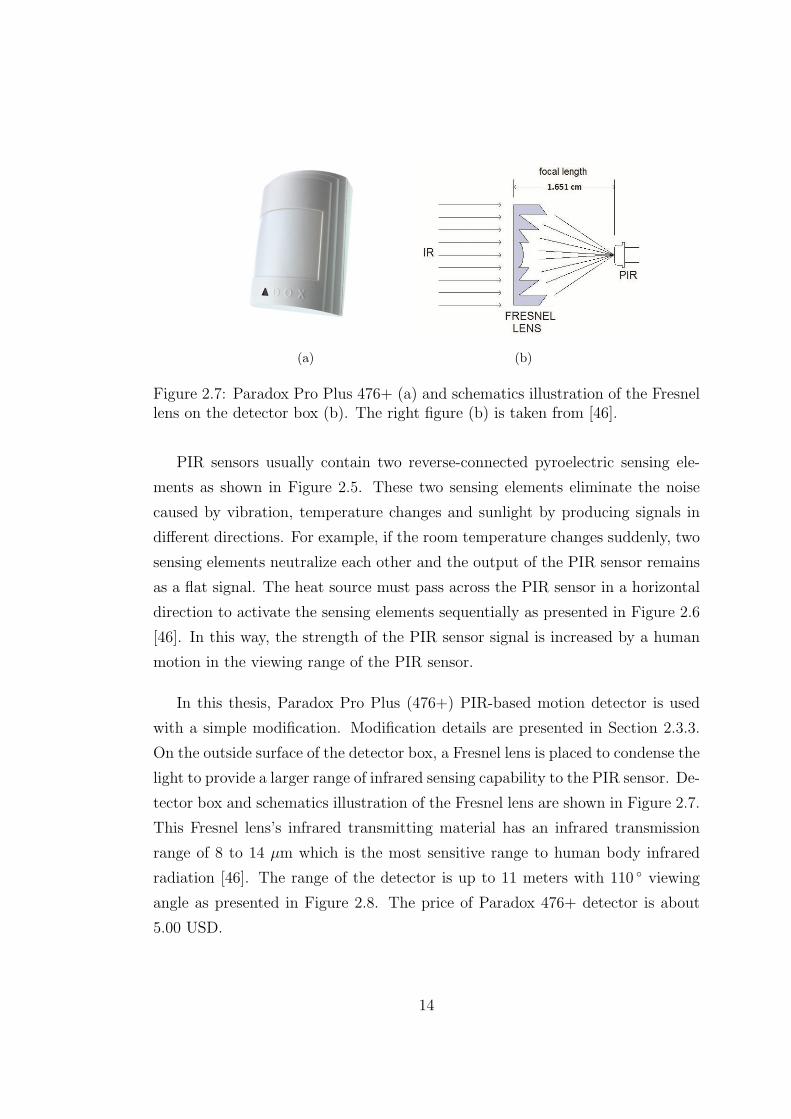
(a) (b)
Figure 2.7: Paradox Pro Plus 476+ (a) and schematics illustration of the Fresnellens on the detector box (b). The right figure (b) is taken from [46].
PIR sensors usually contain two reverse-connected pyroelectric sensing ele-
ments as shown in Figure 2.5. These two sensing elements eliminate the noise
caused by vibration, temperature changes and sunlight by producing signals in
different directions. For example, if the room temperature changes suddenly, two
sensing elements neutralize each other and the output of the PIR sensor remains
as a flat signal. The heat source must pass across the PIR sensor in a horizontal
direction to activate the sensing elements sequentially as presented in Figure 2.6
[46]. In this way, the strength of the PIR sensor signal is increased by a human
motion in the viewing range of the PIR sensor.
In this thesis, Paradox Pro Plus (476+) PIR-based motion detector is used
with a simple modification. Modification details are presented in Section 2.3.3.
On the outside surface of the detector box, a Fresnel lens is placed to condense the
light to provide a larger range of infrared sensing capability to the PIR sensor. De-
tector box and schematics illustration of the Fresnel lens are shown in Figure 2.7.
This Fresnel lens’s infrared transmitting material has an infrared transmission
range of 8 to 14 µm which is the most sensitive range to human body infrared
radiation [46]. The range of the detector is up to 11 meters with 110 ◦ viewing
angle as presented in Figure 2.8. The price of Paradox 476+ detector is about
5.00 USD.
14
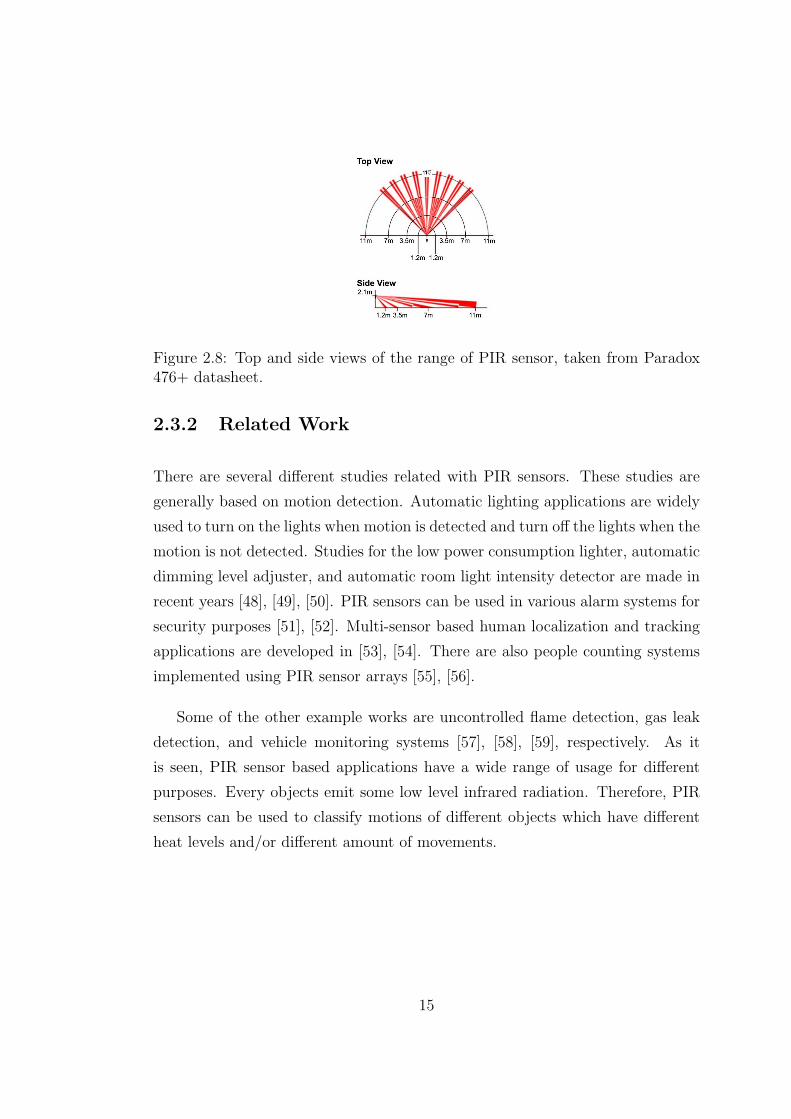
Figure 2.8: Top and side views of the range of PIR sensor, taken from Paradox476+ datasheet.
2.3.2 Related Work
There are several different studies related with PIR sensors. These studies are
generally based on motion detection. Automatic lighting applications are widely
used to turn on the lights when motion is detected and turn off the lights when the
motion is not detected. Studies for the low power consumption lighter, automatic
dimming level adjuster, and automatic room light intensity detector are made in
recent years [48], [49], [50]. PIR sensors can be used in various alarm systems for
security purposes [51], [52]. Multi-sensor based human localization and tracking
applications are developed in [53], [54]. There are also people counting systems
implemented using PIR sensor arrays [55], [56].
Some of the other example works are uncontrolled flame detection, gas leak
detection, and vehicle monitoring systems [57], [58], [59], respectively. As it
is seen, PIR sensor based applications have a wide range of usage for different
purposes. Every objects emit some low level infrared radiation. Therefore, PIR
sensors can be used to classify motions of different objects which have different
heat levels and/or different amount of movements.
15
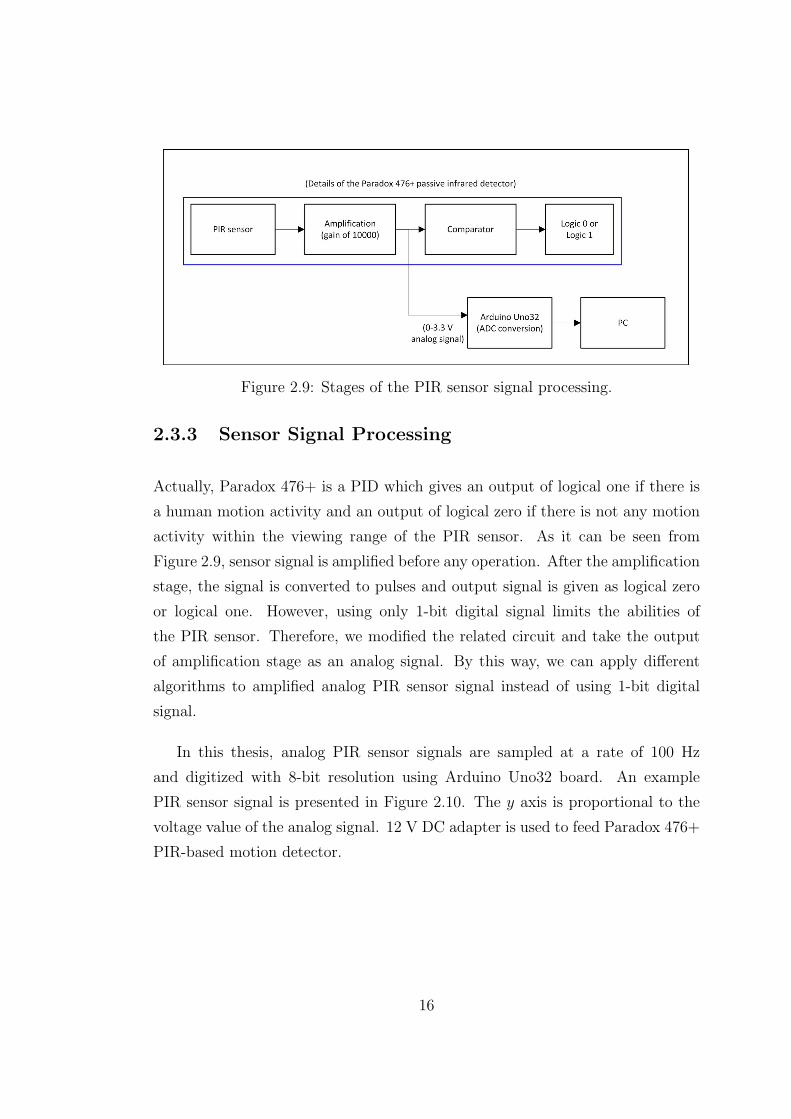
Figure 2.9: Stages of the PIR sensor signal processing.
2.3.3 Sensor Signal Processing
Actually, Paradox 476+ is a PID which gives an output of logical one if there is
a human motion activity and an output of logical zero if there is not any motion
activity within the viewing range of the PIR sensor. As it can be seen from
Figure 2.9, sensor signal is amplified before any operation. After the amplification
stage, the signal is converted to pulses and output signal is given as logical zero
or logical one. However, using only 1-bit digital signal limits the abilities of
the PIR sensor. Therefore, we modified the related circuit and take the output
of amplification stage as an analog signal. By this way, we can apply different
algorithms to amplified analog PIR sensor signal instead of using 1-bit digital
signal.
In this thesis, analog PIR sensor signals are sampled at a rate of 100 Hz
and digitized with 8-bit resolution using Arduino Uno32 board. An example
PIR sensor signal is presented in Figure 2.10. The y axis is proportional to the
voltage value of the analog signal. 12 V DC adapter is used to feed Paradox 476+
PIR-based motion detector.
16
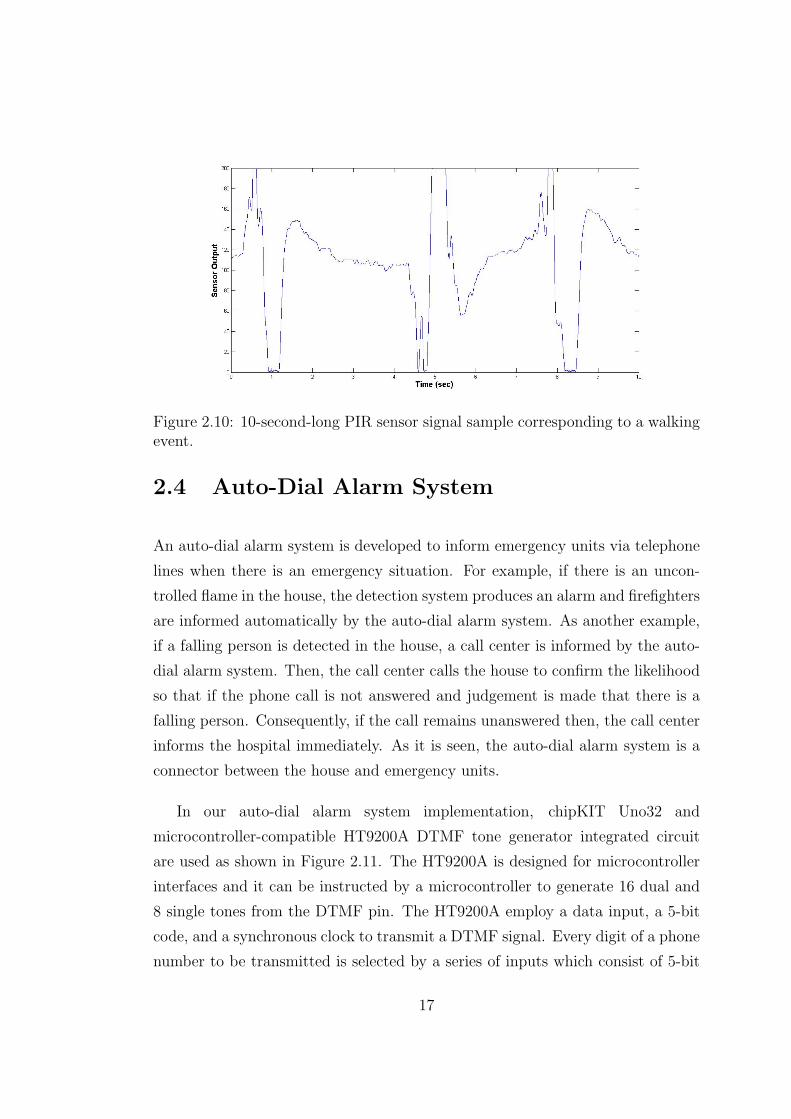
Figure 2.10: 10-second-long PIR sensor signal sample corresponding to a walkingevent.
2.4 Auto-Dial Alarm System
An auto-dial alarm system is developed to inform emergency units via telephone
lines when there is an emergency situation. For example, if there is an uncon-
trolled flame in the house, the detection system produces an alarm and firefighters
are informed automatically by the auto-dial alarm system. As another example,
if a falling person is detected in the house, a call center is informed by the auto-
dial alarm system. Then, the call center calls the house to confirm the likelihood
so that if the phone call is not answered and judgement is made that there is a
falling person. Consequently, if the call remains unanswered then, the call center
informs the hospital immediately. As it is seen, the auto-dial alarm system is a
connector between the house and emergency units.
In our auto-dial alarm system implementation, chipKIT Uno32 and
microcontroller-compatible HT9200A DTMF tone generator integrated circuit
are used as shown in Figure 2.11. The HT9200A is designed for microcontroller
interfaces and it can be instructed by a microcontroller to generate 16 dual and
8 single tones from the DTMF pin. The HT9200A employ a data input, a 5-bit
code, and a synchronous clock to transmit a DTMF signal. Every digit of a phone
number to be transmitted is selected by a series of inputs which consist of 5-bit
17
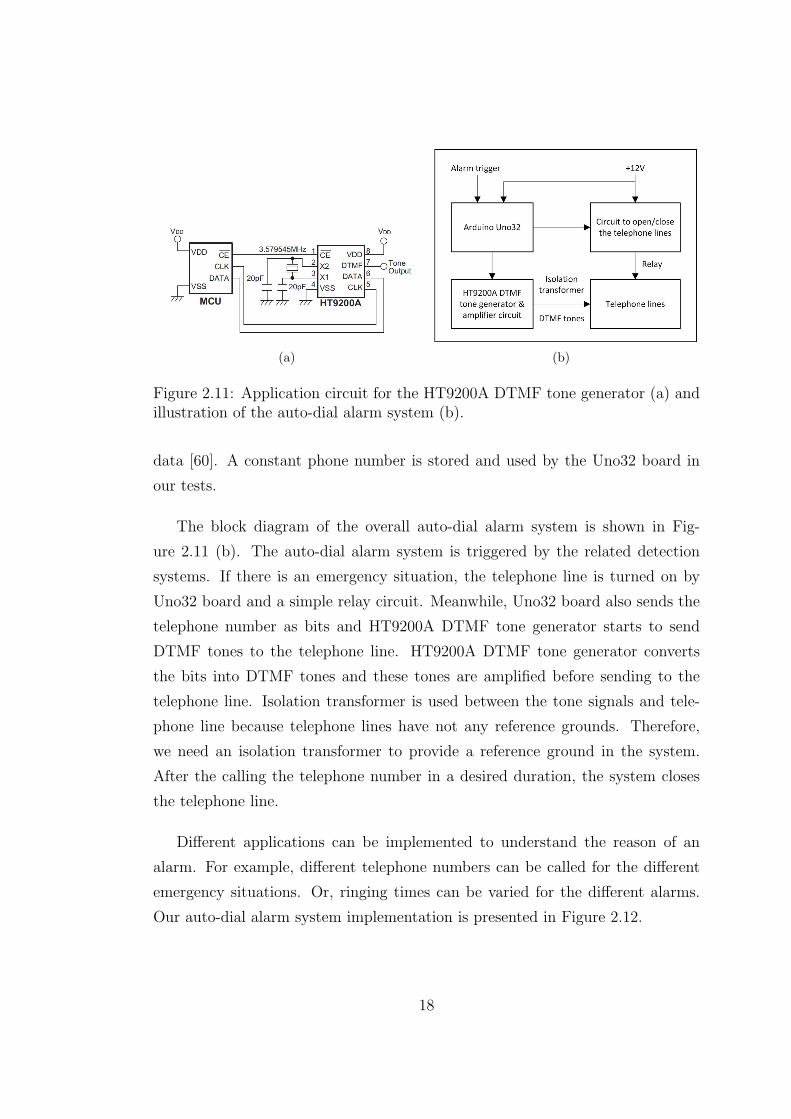
(a) (b)
Figure 2.11: Application circuit for the HT9200A DTMF tone generator (a) andillustration of the auto-dial alarm system (b).
data [60]. A constant phone number is stored and used by the Uno32 board in
our tests.
The block diagram of the overall auto-dial alarm system is shown in Fig-
ure 2.11 (b). The auto-dial alarm system is triggered by the related detection
systems. If there is an emergency situation, the telephone line is turned on by
Uno32 board and a simple relay circuit. Meanwhile, Uno32 board also sends the
telephone number as bits and HT9200A DTMF tone generator starts to send
DTMF tones to the telephone line. HT9200A DTMF tone generator converts
the bits into DTMF tones and these tones are amplified before sending to the
telephone line. Isolation transformer is used between the tone signals and tele-
phone line because telephone lines have not any reference grounds. Therefore,
we need an isolation transformer to provide a reference ground in the system.
After the calling the telephone number in a desired duration, the system closes
the telephone line.
Different applications can be implemented to understand the reason of an
alarm. For example, different telephone numbers can be called for the different
emergency situations. Or, ringing times can be varied for the different alarms.
Our auto-dial alarm system implementation is presented in Figure 2.12.
18
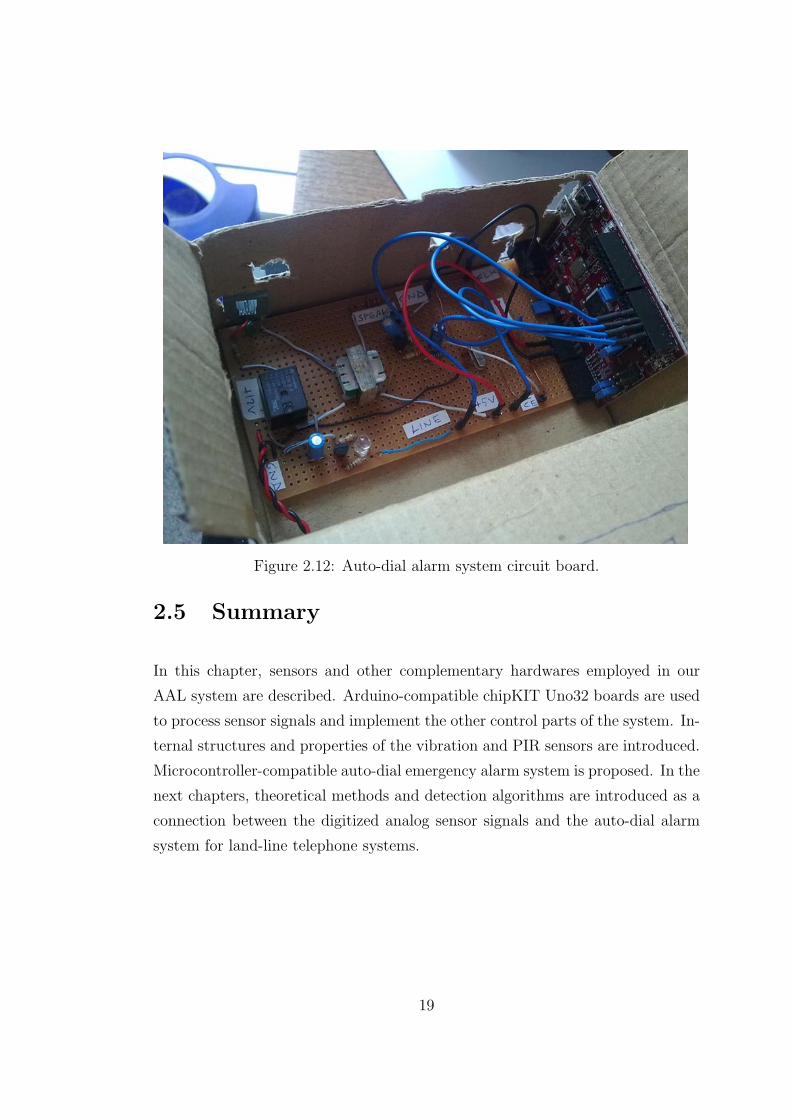
Figure 2.12: Auto-dial alarm system circuit board.
2.5 Summary
In this chapter, sensors and other complementary hardwares employed in our
AAL system are described. Arduino-compatible chipKIT Uno32 boards are used
to process sensor signals and implement the other control parts of the system. In-
ternal structures and properties of the vibration and PIR sensors are introduced.
Microcontroller-compatible auto-dial emergency alarm system is proposed. In the
next chapters, theoretical methods and detection algorithms are introduced as a
connection between the digitized analog sensor signals and the auto-dial alarm
system for land-line telephone systems.
19
Chapter 3
Feature Extraction from
One-Dimensional Signals
In this chapter, different frequency analysis methods from one-dimensional signals
are studied and compared to each other. These frequency analysis methods are
employed for the vibration sensor signal processing in the next chapter. Discrete
Fourier transform (DFT), mel-frequency cepstral coefficients (MFCC), discrete
wavelet transform (DWT), and dual-tree complex wavelet transform (DT-CWT)
based feature extraction methods are reviewed in Section 3.1. We use C instead
of C for the complex number symbol because C is generally used in the meaning
of “continuous” for the CWT abbreviation [61]. In Section 3.2, single-tree com-
plex wavelet transform (ST-CWT) method using time-varying lifting structure is
described and compared with the classical methods reviewed in Section 3.1. At
the same time, two-second-long vibration sensor signal windows are examined to
extract features using these signal analysis methods.
For the DT-CWT, two different filter-banks are executed in parallel to ana-
lyze a given input signal, which increases the amount of data after analysis. In
the proposed ST-CWT structure, filters of the lifting filter-bank switch back and
forth between the two analysis filters of the DT-CWT. This approach does not
20
increase the amount of output data as the time-varying lifting structure is a criti-
cally sampled transform and it has the desirable properties of the DT-CWT such
as shift-invariance and lack of aliasing. Shift-invariance properties of the signal
analysis methods are compared to each other in Section 3.3. In Section 3.4, com-
putational complexity based comparison between the frequency analysis methods
is presented.
3.1 Classical Signal Analysis Methods
Classical frequency analysis methods; DFT, MFCC, DWT, and DT-CWT are
employed to analyze frequency content of the vibration sensor signal.
A sample of two-second-long sensor signal and the frequency sub-bands of
this signal are presented in Figure 3.1. In this thesis, eight frequency sub-bands
are used for the all frequency analysis methods. Boundary frequencies of these
sub-bands are fs/256, fs/128, fs/64, fs/32, fs/16, fs/8, fs/4, and fs/2 which
correspond to 1.95, 3.91, 7.81, 15.63, 31.25, 62.5, 125, and 250 Hz, respectively,
with the sampling frequency fs = 500 Hz. Sub-band energies of the eight fre-
quency sub-bands are computed and used as eight feature parameters for the
classification purposes.
It is observed that most of the vibration sensor signal energy is concentrated
in low-frequency bands. Hence, more emphasis is given to lower frequencies by
assigning more sub-bands to them. For the all frequency analysis methods, the
same frequency boundaries are used for the sub-bands so that comparison between
the frequency analysis methods can be done more appropriately. Shift-invariance
property based comparison and computational complexity based comparison are
made between the classical frequency analysis methods and the ST-CWT method
in Section 3.3 and 3.4, respectively.
21
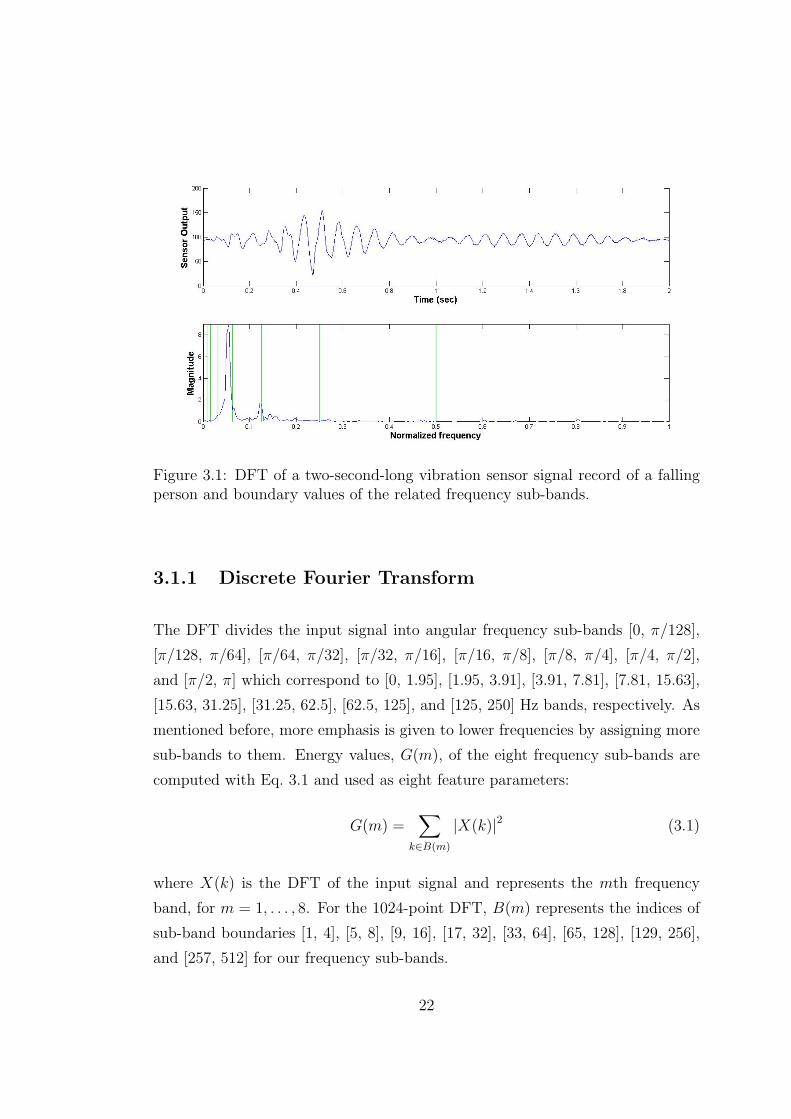
Figure 3.1: DFT of a two-second-long vibration sensor signal record of a fallingperson and boundary values of the related frequency sub-bands.
3.1.1 Discrete Fourier Transform
The DFT divides the input signal into angular frequency sub-bands [0, π/128],
[π/128, π/64], [π/64, π/32], [π/32, π/16], [π/16, π/8], [π/8, π/4], [π/4, π/2],
and [π/2, π] which correspond to [0, 1.95], [1.95, 3.91], [3.91, 7.81], [7.81, 15.63],
[15.63, 31.25], [31.25, 62.5], [62.5, 125], and [125, 250] Hz bands, respectively. As
mentioned before, more emphasis is given to lower frequencies by assigning more
sub-bands to them. Energy values, G(m), of the eight frequency sub-bands are
computed with Eq. 3.1 and used as eight feature parameters:
G(m) =∑
k∈B(m)
|X(k)|2 (3.1)
where X(k) is the DFT of the input signal and represents the mth frequency
band, for m = 1, . . . , 8. For the 1024-point DFT, B(m) represents the indices of
sub-band boundaries [1, 4], [5, 8], [9, 16], [17, 32], [33, 64], [65, 128], [129, 256],
and [257, 512] for our frequency sub-bands.
22
3.1.2 Mel-Frequency Cepstral Coefficients
Mel-cepstrum is widely used in speech and image processing [62], [63], [64]. Most
of the vibration sensor signal energy is concentrated in low-frequency sub-bands
therefore MFCC can be considered as an appropriate candidate for feature ex-
traction from vibration sensor signal because the frequency decomposition of the
MFCC is logarithmic giving more emphasis to lower frequencies compared to
higher frequencies.
As pointed out in Section 3.1.1 after computation of the DFT of the input
signal window, energies of the frequency sub-bands are calculated with Eq. 3.1.
Eight feature parameters are extracted by finding eight mel-frequency cepstral
coefficients, C(u), with the following formula using the discrete cosine transform
(DCT):
C(u) = DCT−1 {log (G(m))} , u = 1, . . . , 8 (3.2)
The eight mel-frequency cepstral coefficients are used as eight feature parameters
for the classification purposes.
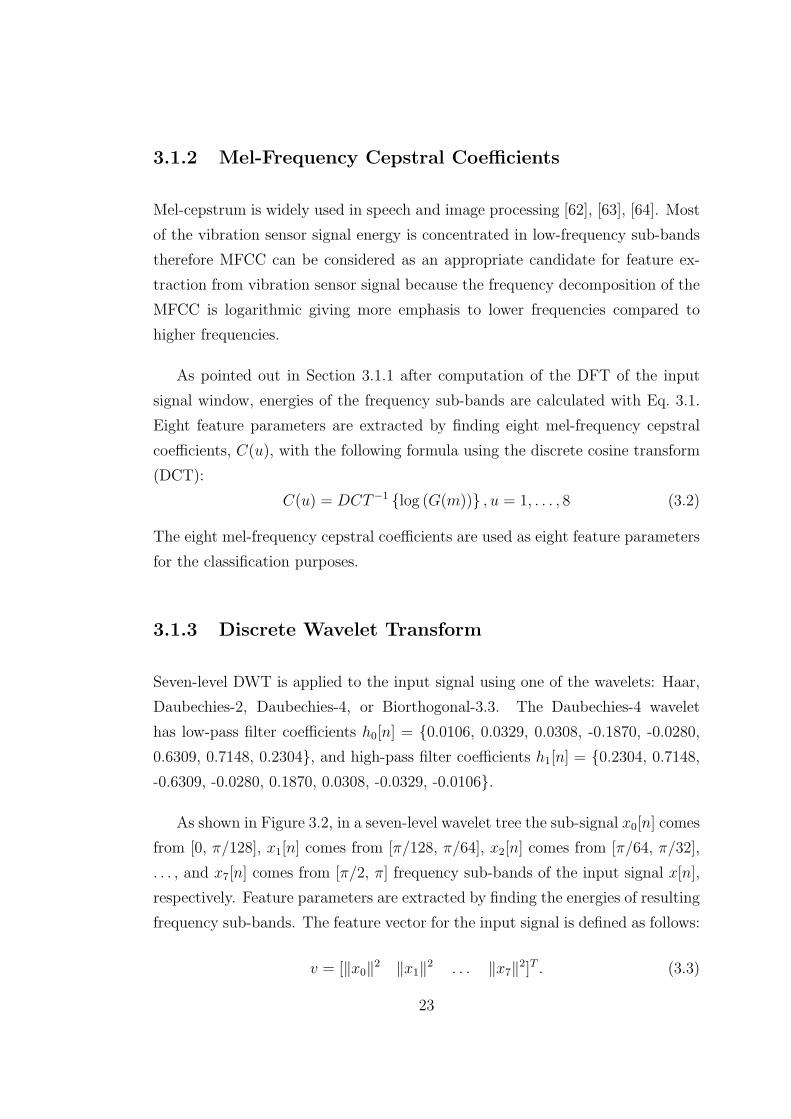
3.1.3 Discrete Wavelet Transform
Seven-level DWT is applied to the input signal using one of the wavelets: Haar,
Daubechies-2, Daubechies-4, or Biorthogonal-3.3. The Daubechies-4 wavelet
has low-pass filter coefficients h0[n] = {0.0106, 0.0329, 0.0308, -0.1870, -0.0280,0.6309, 0.7148, 0.2304}, and high-pass filter coefficients h1[n] = {0.2304, 0.7148,-0.6309, -0.0280, 0.1870, 0.0308, -0.0329, -0.0106}.
As shown in Figure 3.2, in a seven-level wavelet tree the sub-signal x0[n] comes
from [0, π/128], x1[n] comes from [π/128, π/64], x2[n] comes from [π/64, π/32],
. . . , and x7[n] comes from [π/2, π] frequency sub-bands of the input signal x[n],
respectively. Feature parameters are extracted by finding the energies of resulting
frequency sub-bands. The feature vector for the input signal is defined as follows:
v = [∥x0∥2 ∥x1∥2 . . . ∥x7∥2]T . (3.3)
23
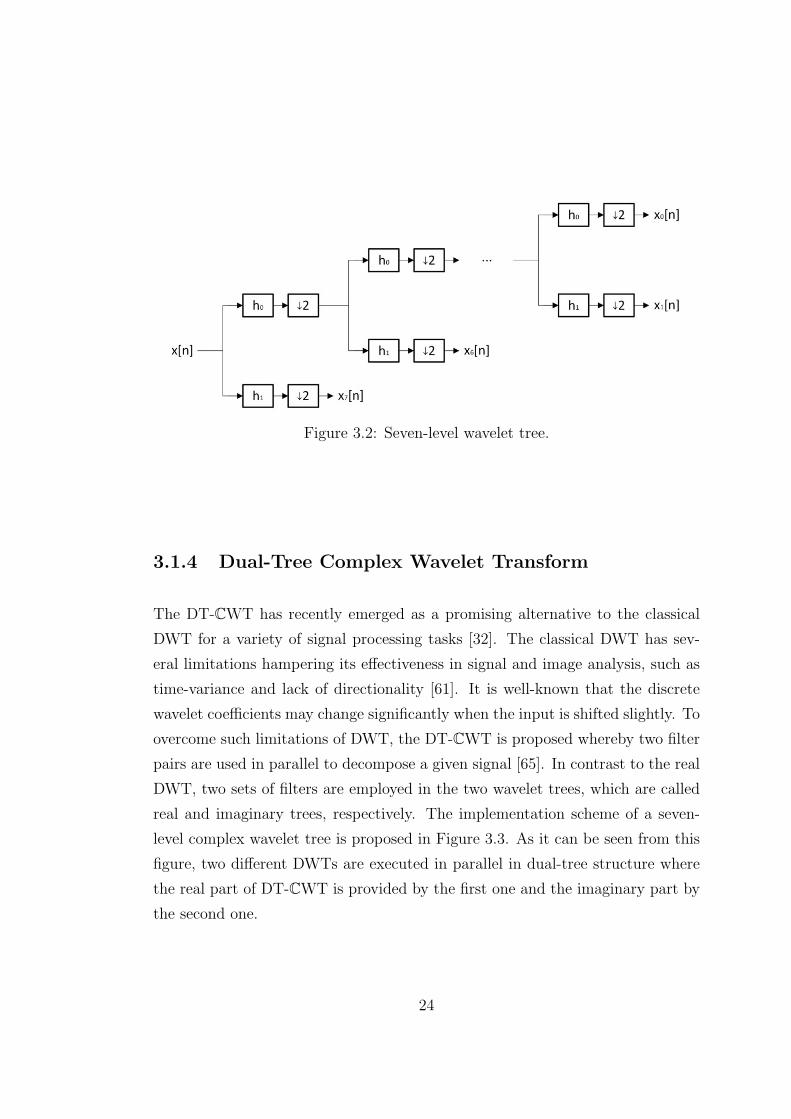
Figure 3.2: Seven-level wavelet tree.
3.1.4 Dual-Tree Complex Wavelet Transform
The DT-CWT has recently emerged as a promising alternative to the classical
DWT for a variety of signal processing tasks [32]. The classical DWT has sev-
eral limitations hampering its effectiveness in signal and image analysis, such as
time-variance and lack of directionality [61]. It is well-known that the discrete
wavelet coefficients may change significantly when the input is shifted slightly. To
overcome such limitations of DWT, the DT-CWT is proposed whereby two filter
pairs are used in parallel to decompose a given signal [65]. In contrast to the real
DWT, two sets of filters are employed in the two wavelet trees, which are called
real and imaginary trees, respectively. The implementation scheme of a seven-
level complex wavelet tree is proposed in Figure 3.3. As it can be seen from this
figure, two different DWTs are executed in parallel in dual-tree structure where
the real part of DT-CWT is provided by the first one and the imaginary part by
the second one.
24
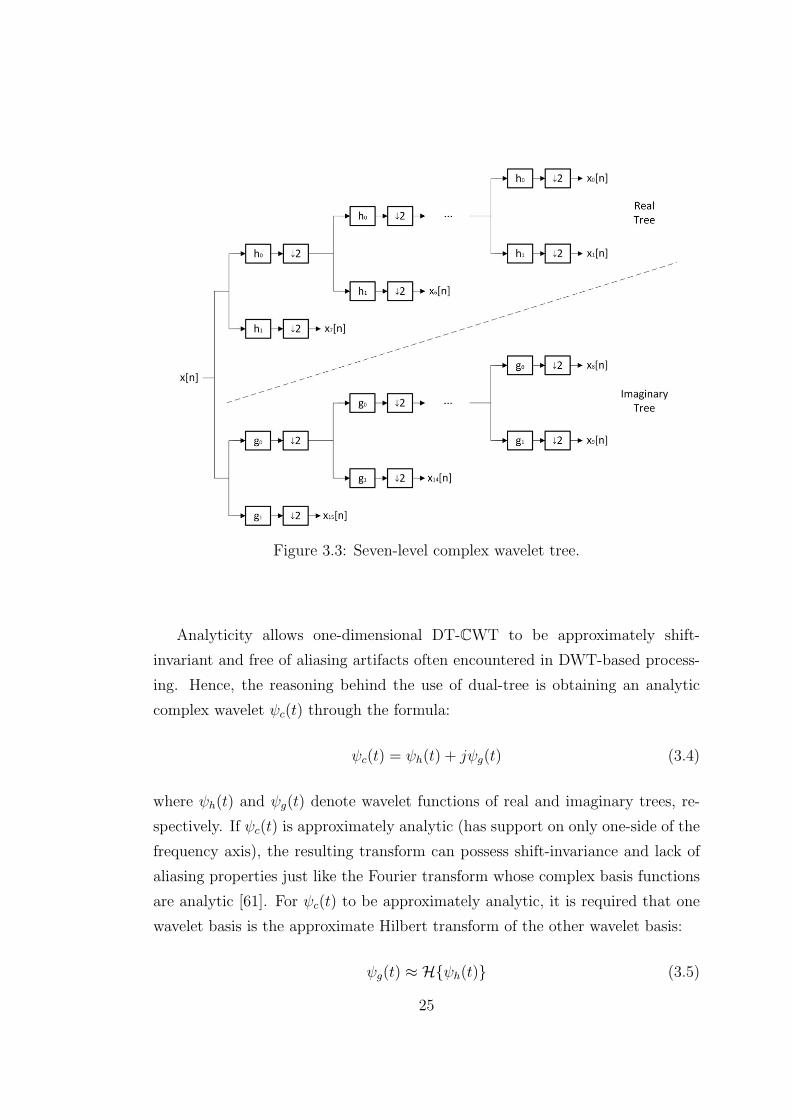
Figure 3.3: Seven-level complex wavelet tree.
Analyticity allows one-dimensional DT-CWT to be approximately shift-
invariant and free of aliasing artifacts often encountered in DWT-based process-
ing. Hence, the reasoning behind the use of dual-tree is obtaining an analytic
complex wavelet ψc(t) through the formula:
ψc(t) = ψh(t) + jψg(t) (3.4)
where ψh(t) and ψg(t) denote wavelet functions of real and imaginary trees, re-
spectively. If ψc(t) is approximately analytic (has support on only one-side of the
frequency axis), the resulting transform can possess shift-invariance and lack of
aliasing properties just like the Fourier transform whose complex basis functions
are analytic [61]. For ψc(t) to be approximately analytic, it is required that one
wavelet basis is the approximate Hilbert transform of the other wavelet basis:
ψg(t) ≈ H{ψh(t)} (3.5)
25
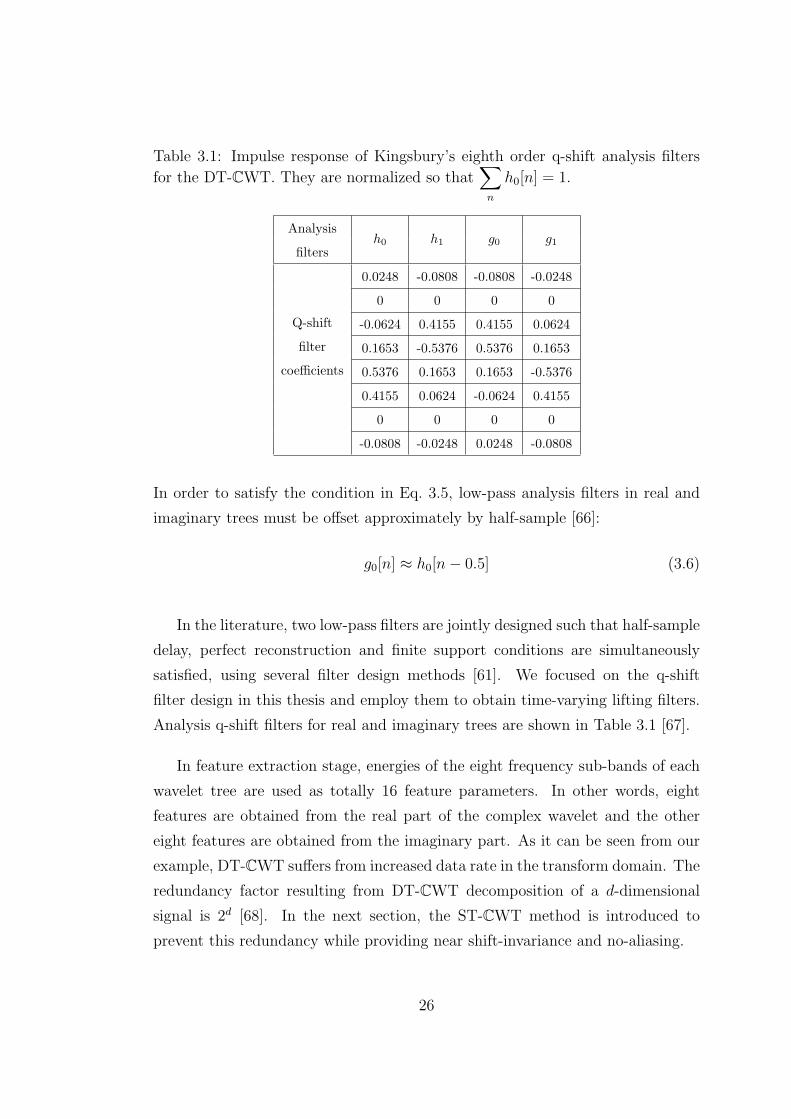
Table 3.1: Impulse response of Kingsbury’s eighth order q-shift analysis filters
for the DT-CWT. They are normalized so that∑n
h0[n] = 1.
Analysish0 h1 g0 g1
filters
Q-shift
0.0248 -0.0808 -0.0808 -0.0248
0 0 0 0
filter
-0.0624 0.4155 0.4155 0.0624
coefficients
0.1653 -0.5376 0.5376 0.1653
0.5376 0.1653 0.1653 -0.5376
0.4155 0.0624 -0.0624 0.4155
0 0 0 0
-0.0808 -0.0248 0.0248 -0.0808
In order to satisfy the condition in Eq. 3.5, low-pass analysis filters in real and
imaginary trees must be offset approximately by half-sample [66]:
g0[n] ≈ h0[n− 0.5] (3.6)
In the literature, two low-pass filters are jointly designed such that half-sample
delay, perfect reconstruction and finite support conditions are simultaneously
satisfied, using several filter design methods [61]. We focused on the q-shift
filter design in this thesis and employ them to obtain time-varying lifting filters.
Analysis q-shift filters for real and imaginary trees are shown in Table 3.1 [67].
In feature extraction stage, energies of the eight frequency sub-bands of each
wavelet tree are used as totally 16 feature parameters. In other words, eight
features are obtained from the real part of the complex wavelet and the other
eight features are obtained from the imaginary part. As it can be seen from our
example, DT-CWT suffers from increased data rate in the transform domain. The
redundancy factor resulting from DT-CWT decomposition of a d-dimensional
signal is 2d [68]. In the next section, the ST-CWT method is introduced to
prevent this redundancy while providing near shift-invariance and no-aliasing.
26
x[n]
z-1
2
2
+
+
Lxx [n]^
Hx [n]x
Lxx [n]
Hx [n]x
1U1 2U P 1 2P
- -
0.5
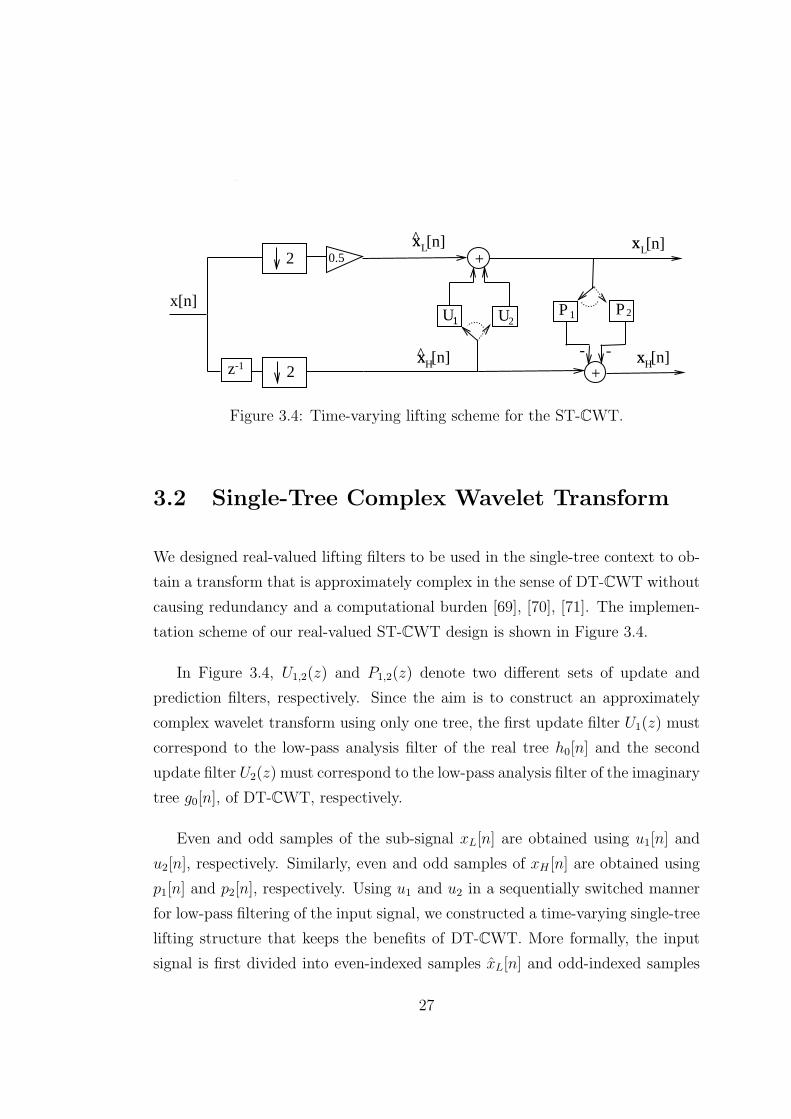
Figure 3.4: Time-varying lifting scheme for the ST-CWT.
3.2 Single-Tree Complex Wavelet Transform
We designed real-valued lifting filters to be used in the single-tree context to ob-
tain a transform that is approximately complex in the sense of DT-CWT without
causing redundancy and a computational burden [69], [70], [71]. The implemen-
tation scheme of our real-valued ST-CWT design is shown in Figure 3.4.
In Figure 3.4, U1,2(z) and P1,2(z) denote two different sets of update and
prediction filters, respectively. Since the aim is to construct an approximately
complex wavelet transform using only one tree, the first update filter U1(z) must
correspond to the low-pass analysis filter of the real tree h0[n] and the second
update filter U2(z) must correspond to the low-pass analysis filter of the imaginary
tree g0[n], of DT-CWT, respectively.
Even and odd samples of the sub-signal xL[n] are obtained using u1[n] and
u2[n], respectively. Similarly, even and odd samples of xH [n] are obtained using
p1[n] and p2[n], respectively. Using u1 and u2 in a sequentially switched manner
for low-pass filtering of the input signal, we constructed a time-varying single-tree
lifting structure that keeps the benefits of DT-CWT. More formally, the input
signal is first divided into even-indexed samples xL[n] and odd-indexed samples
27
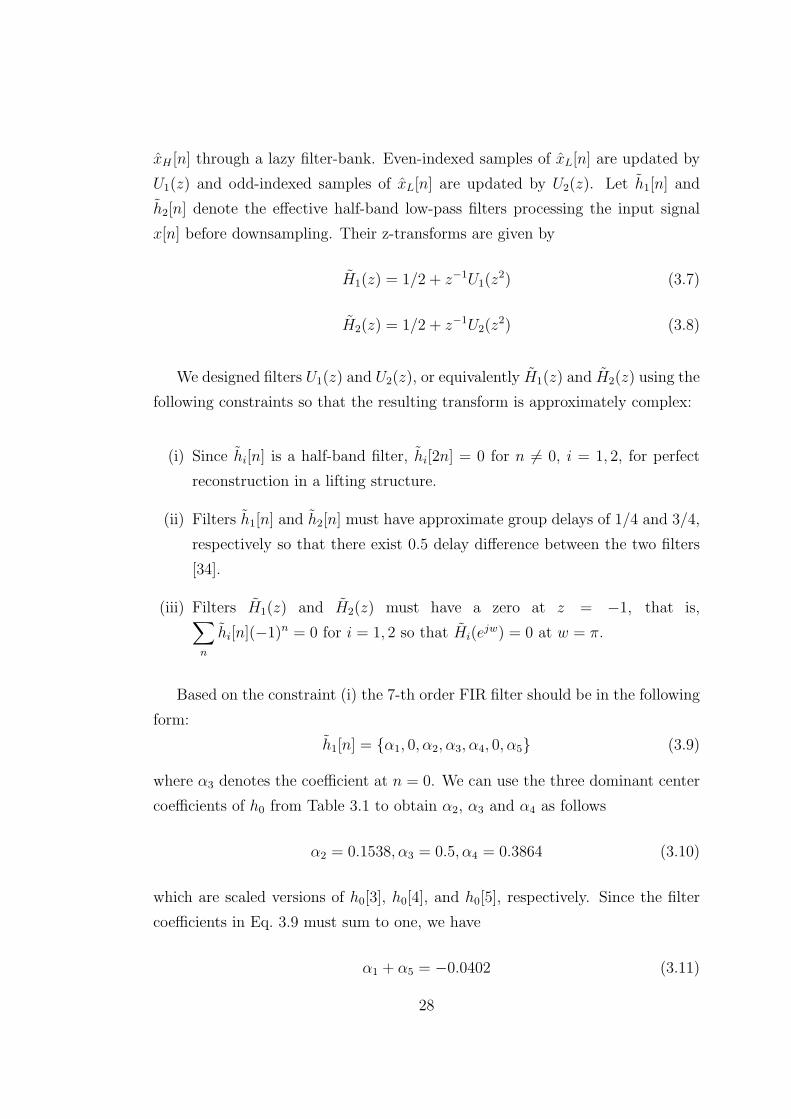
xH [n] through a lazy filter-bank. Even-indexed samples of xL[n] are updated by
U1(z) and odd-indexed samples of xL[n] are updated by U2(z). Let h1[n] and
h2[n] denote the effective half-band low-pass filters processing the input signal
x[n] before downsampling. Their z-transforms are given by
H1(z) = 1/2 + z−1U1(z2) (3.7)
H2(z) = 1/2 + z−1U2(z2) (3.8)
We designed filters U1(z) and U2(z), or equivalently H1(z) and H2(z) using the
following constraints so that the resulting transform is approximately complex:
(i) Since hi[n] is a half-band filter, hi[2n] = 0 for n = 0, i = 1, 2, for perfect
reconstruction in a lifting structure.
(ii) Filters h1[n] and h2[n] must have approximate group delays of 1/4 and 3/4,
respectively so that there exist 0.5 delay difference between the two filters
[34].
(iii) Filters H1(z) and H2(z) must have a zero at z = −1, that is,∑n
hi[n](−1)n = 0 for i = 1, 2 so that Hi(ejw) = 0 at w = π.
Based on the constraint (i) the 7-th order FIR filter should be in the following
form:
h1[n] = {α1, 0, α2, α3, α4, 0, α5} (3.9)
where α3 denotes the coefficient at n = 0. We can use the three dominant center
coefficients of h0 from Table 3.1 to obtain α2, α3 and α4 as follows
α2 = 0.1538, α3 = 0.5, α4 = 0.3864 (3.10)
which are scaled versions of h0[3], h0[4], and h0[5], respectively. Since the filter
coefficients in Eq. 3.9 must sum to one, we have
α1 + α5 = −0.0402 (3.11)
28
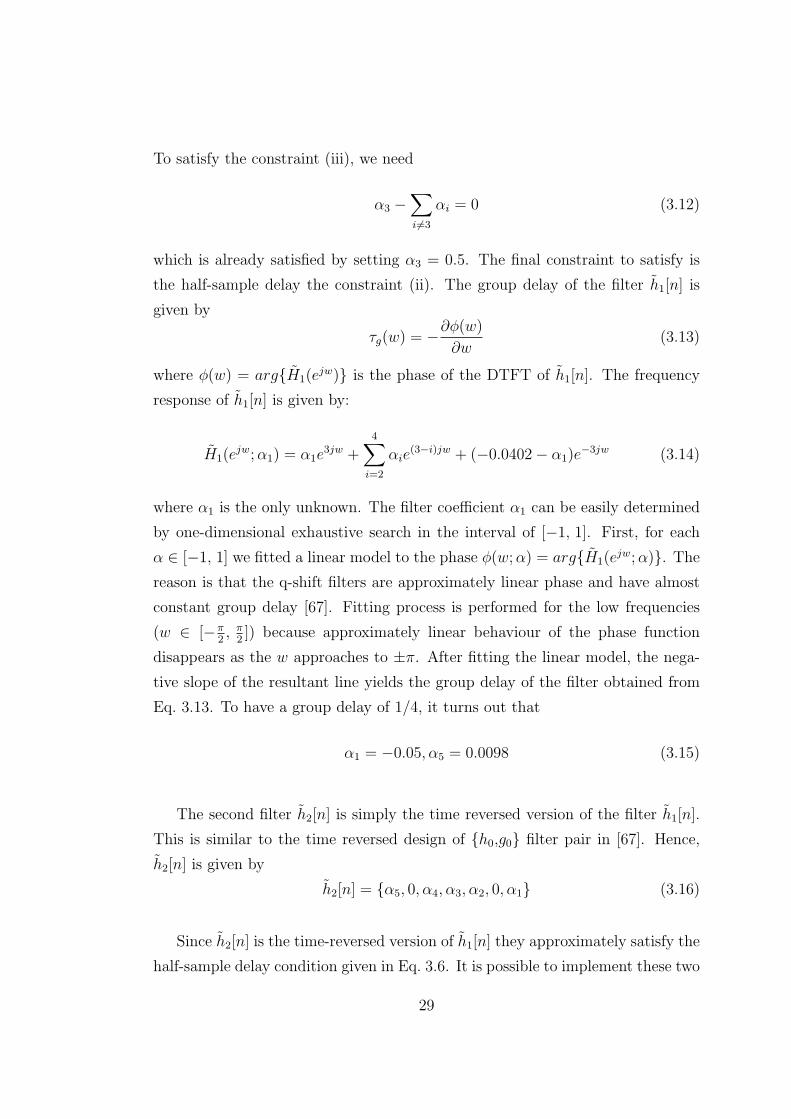
To satisfy the constraint (iii), we need
α3 −∑i=3
αi = 0 (3.12)
which is already satisfied by setting α3 = 0.5. The final constraint to satisfy is
the half-sample delay the constraint (ii). The group delay of the filter h1[n] is
given by
τg(w) = −∂ϕ(w)∂w
(3.13)
where ϕ(w) = arg{H1(ejw)} is the phase of the DTFT of h1[n]. The frequency
response of h1[n] is given by:
H1(ejw;α1) = α1e
3jw +4∑
i=2
αie(3−i)jw + (−0.0402− α1)e
−3jw (3.14)
where α1 is the only unknown. The filter coefficient α1 can be easily determined
by one-dimensional exhaustive search in the interval of [−1, 1]. First, for each
α ∈ [−1, 1] we fitted a linear model to the phase ϕ(w;α) = arg{H1(ejw;α)}. The
reason is that the q-shift filters are approximately linear phase and have almost
constant group delay [67]. Fitting process is performed for the low frequencies
(w ∈ [−π2, π
2]) because approximately linear behaviour of the phase function
disappears as the w approaches to ±π. After fitting the linear model, the nega-
tive slope of the resultant line yields the group delay of the filter obtained from
Eq. 3.13. To have a group delay of 1/4, it turns out that
α1 = −0.05, α5 = 0.0098 (3.15)
The second filter h2[n] is simply the time reversed version of the filter h1[n].
This is similar to the time reversed design of {h0,g0} filter pair in [67]. Hence,
h2[n] is given by
h2[n] = {α5, 0, α4, α3, α2, 0, α1} (3.16)
Since h2[n] is the time-reversed version of h1[n] they approximately satisfy the
half-sample delay condition given in Eq. 3.6. It is possible to implement these two
29
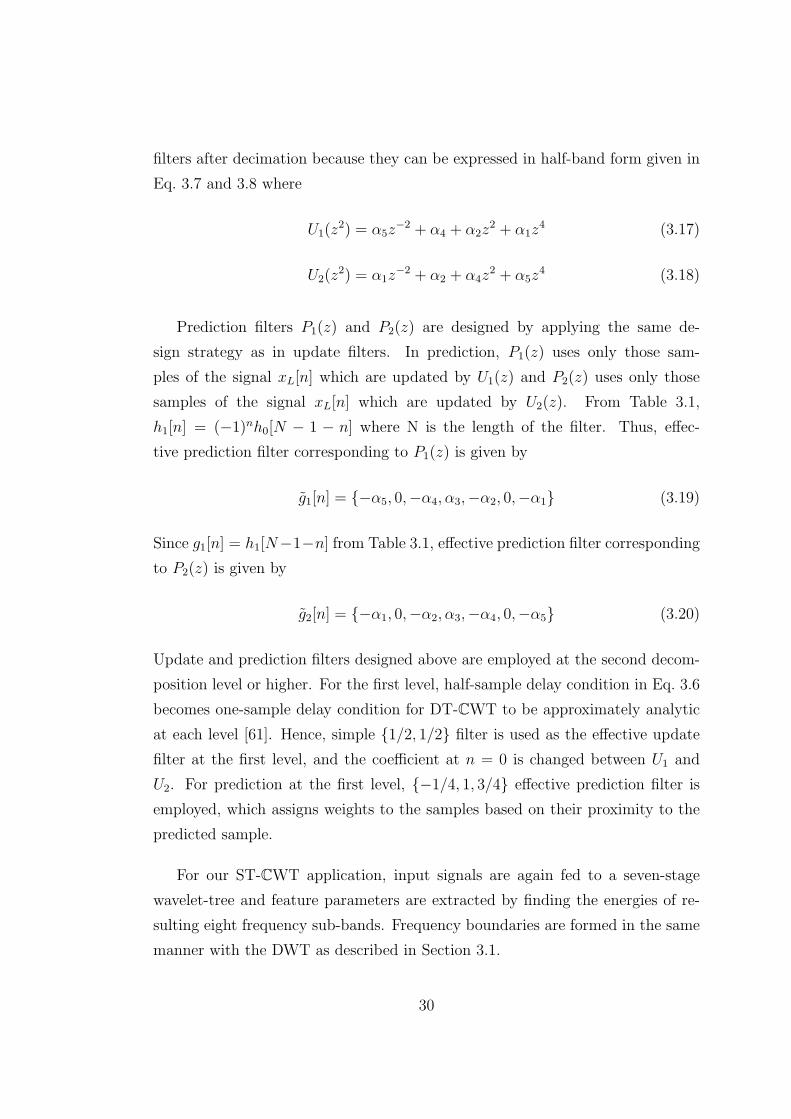
filters after decimation because they can be expressed in half-band form given in
Eq. 3.7 and 3.8 where
U1(z2) = α5z
−2 + α4 + α2z2 + α1z
4 (3.17)
U2(z2) = α1z
−2 + α2 + α4z2 + α5z
4 (3.18)
Prediction filters P1(z) and P2(z) are designed by applying the same de-
sign strategy as in update filters. In prediction, P1(z) uses only those sam-
ples of the signal xL[n] which are updated by U1(z) and P2(z) uses only those
samples of the signal xL[n] which are updated by U2(z). From Table 3.1,
h1[n] = (−1)nh0[N − 1 − n] where N is the length of the filter. Thus, effec-
tive prediction filter corresponding to P1(z) is given by
g1[n] = {−α5, 0,−α4, α3,−α2, 0,−α1} (3.19)
Since g1[n] = h1[N−1−n] from Table 3.1, effective prediction filter corresponding
to P2(z) is given by
g2[n] = {−α1, 0,−α2, α3,−α4, 0,−α5} (3.20)
Update and prediction filters designed above are employed at the second decom-
position level or higher. For the first level, half-sample delay condition in Eq. 3.6
becomes one-sample delay condition for DT-CWT to be approximately analytic
at each level [61]. Hence, simple {1/2, 1/2} filter is used as the effective update
filter at the first level, and the coefficient at n = 0 is changed between U1 and
U2. For prediction at the first level, {−1/4, 1, 3/4} effective prediction filter is
employed, which assigns weights to the samples based on their proximity to the
predicted sample.
For our ST-CWT application, input signals are again fed to a seven-stage
wavelet-tree and feature parameters are extracted by finding the energies of re-
sulting eight frequency sub-bands. Frequency boundaries are formed in the same
manner with the DWT as described in Section 3.1.
30
3.3 Shift-Invariance Property Based Compari-
son
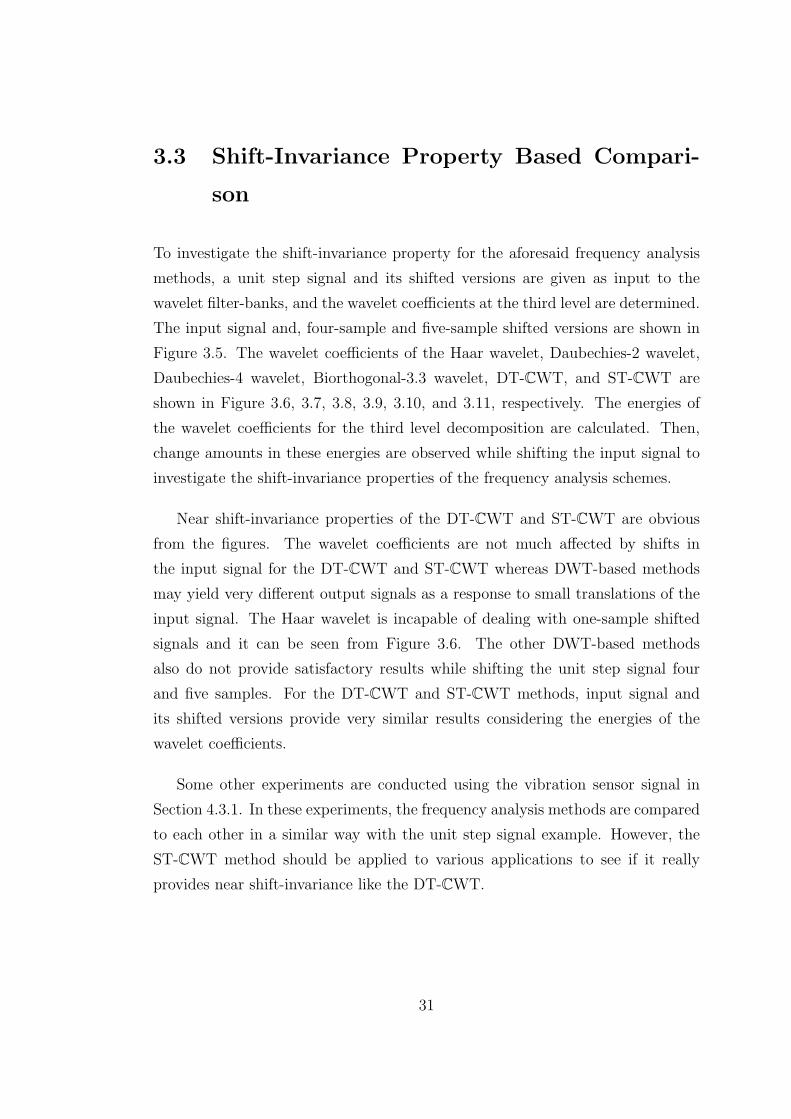
To investigate the shift-invariance property for the aforesaid frequency analysis
methods, a unit step signal and its shifted versions are given as input to the
wavelet filter-banks, and the wavelet coefficients at the third level are determined.
The input signal and, four-sample and five-sample shifted versions are shown in
Figure 3.5. The wavelet coefficients of the Haar wavelet, Daubechies-2 wavelet,
Daubechies-4 wavelet, Biorthogonal-3.3 wavelet, DT-CWT, and ST-CWT are
shown in Figure 3.6, 3.7, 3.8, 3.9, 3.10, and 3.11, respectively. The energies of
the wavelet coefficients for the third level decomposition are calculated. Then,
change amounts in these energies are observed while shifting the input signal to
investigate the shift-invariance properties of the frequency analysis schemes.
Near shift-invariance properties of the DT-CWT and ST-CWT are obvious
from the figures. The wavelet coefficients are not much affected by shifts in
the input signal for the DT-CWT and ST-CWT whereas DWT-based methods
may yield very different output signals as a response to small translations of the
input signal. The Haar wavelet is incapable of dealing with one-sample shifted
signals and it can be seen from Figure 3.6. The other DWT-based methods
also do not provide satisfactory results while shifting the unit step signal four
and five samples. For the DT-CWT and ST-CWT methods, input signal and
its shifted versions provide very similar results considering the energies of the
wavelet coefficients.
Some other experiments are conducted using the vibration sensor signal in
Section 4.3.1. In these experiments, the frequency analysis methods are compared
to each other in a similar way with the unit step signal example. However, the
ST-CWT method should be applied to various applications to see if it really
provides near shift-invariance like the DT-CWT.
31
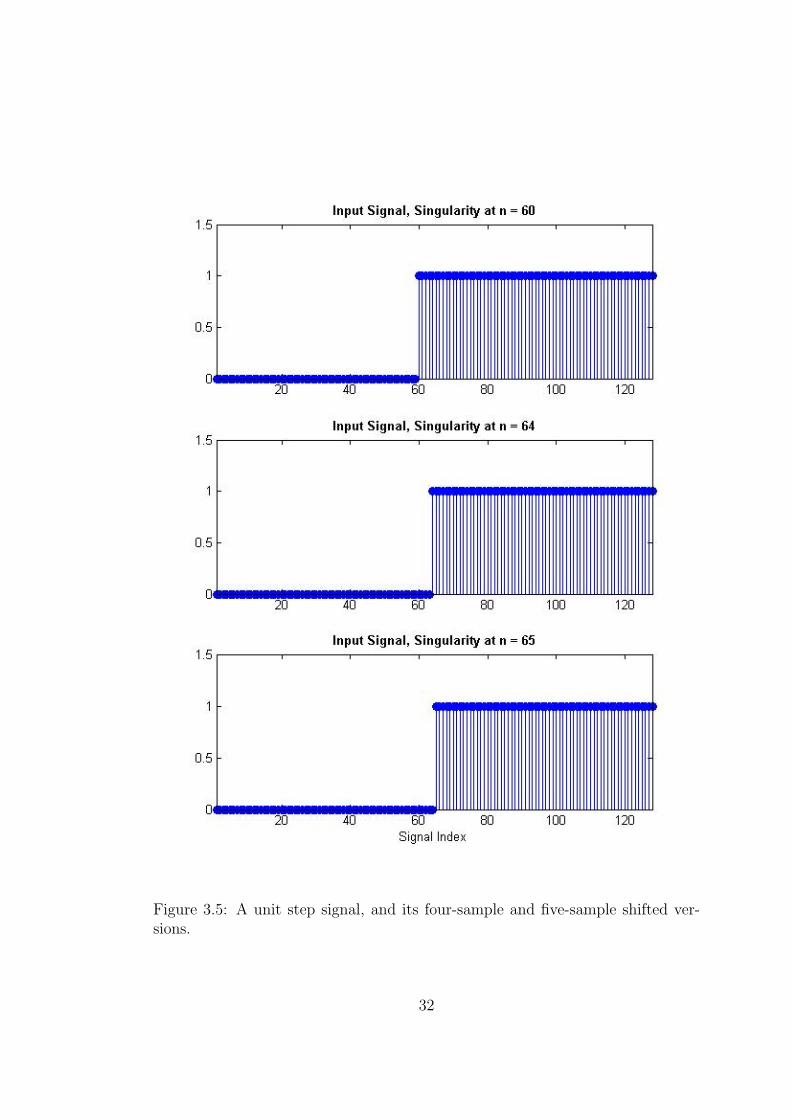
Figure 3.5: A unit step signal, and its four-sample and five-sample shifted ver-sions.
32
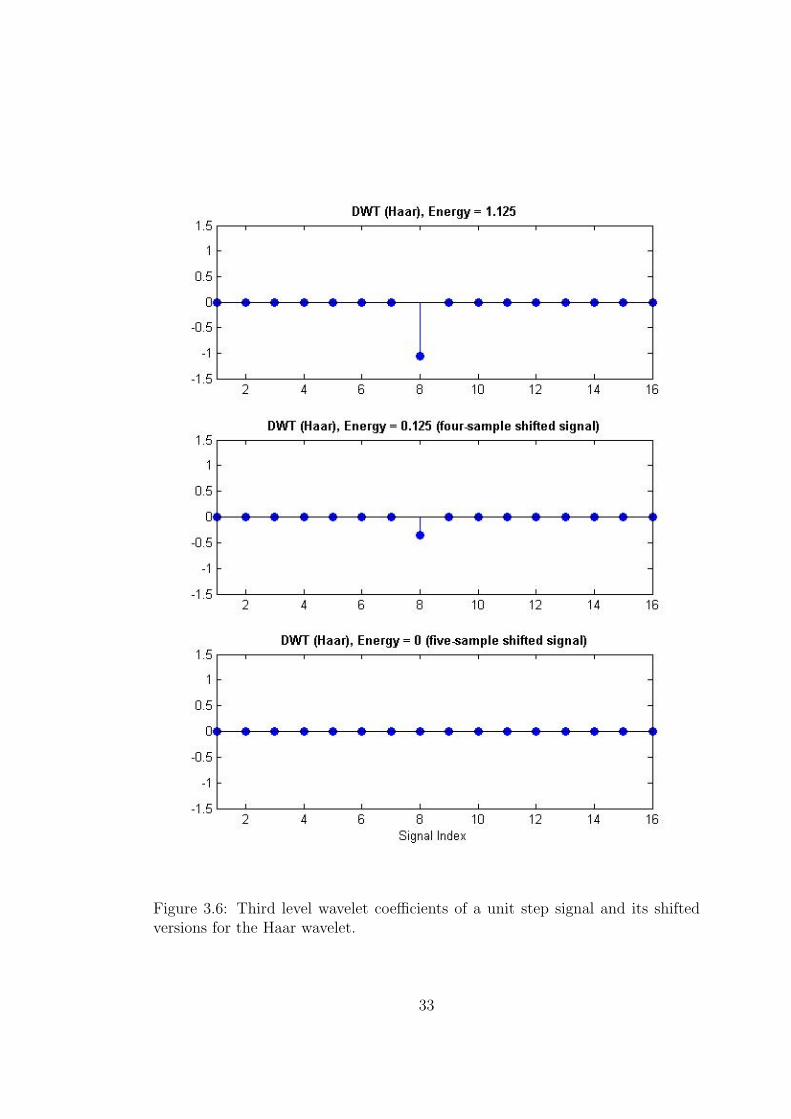
Figure 3.6: Third level wavelet coefficients of a unit step signal and its shiftedversions for the Haar wavelet.
33
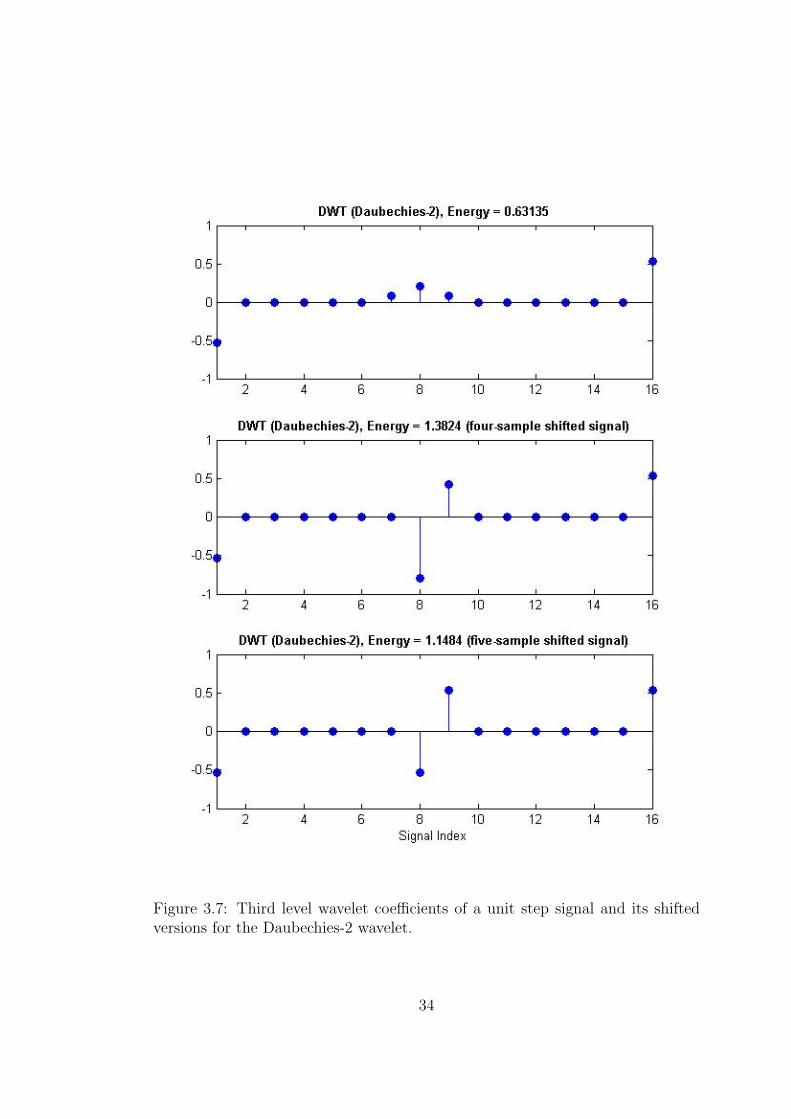
Figure 3.7: Third level wavelet coefficients of a unit step signal and its shiftedversions for the Daubechies-2 wavelet.
34
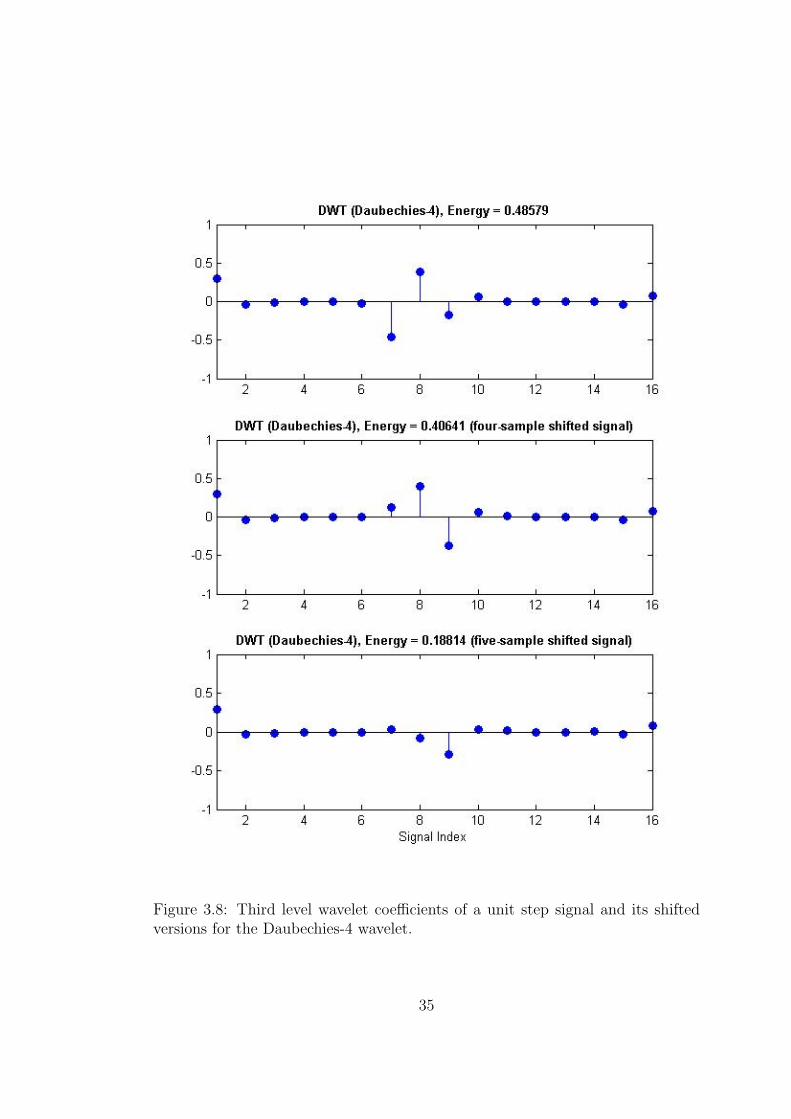
Figure 3.8: Third level wavelet coefficients of a unit step signal and its shiftedversions for the Daubechies-4 wavelet.
35
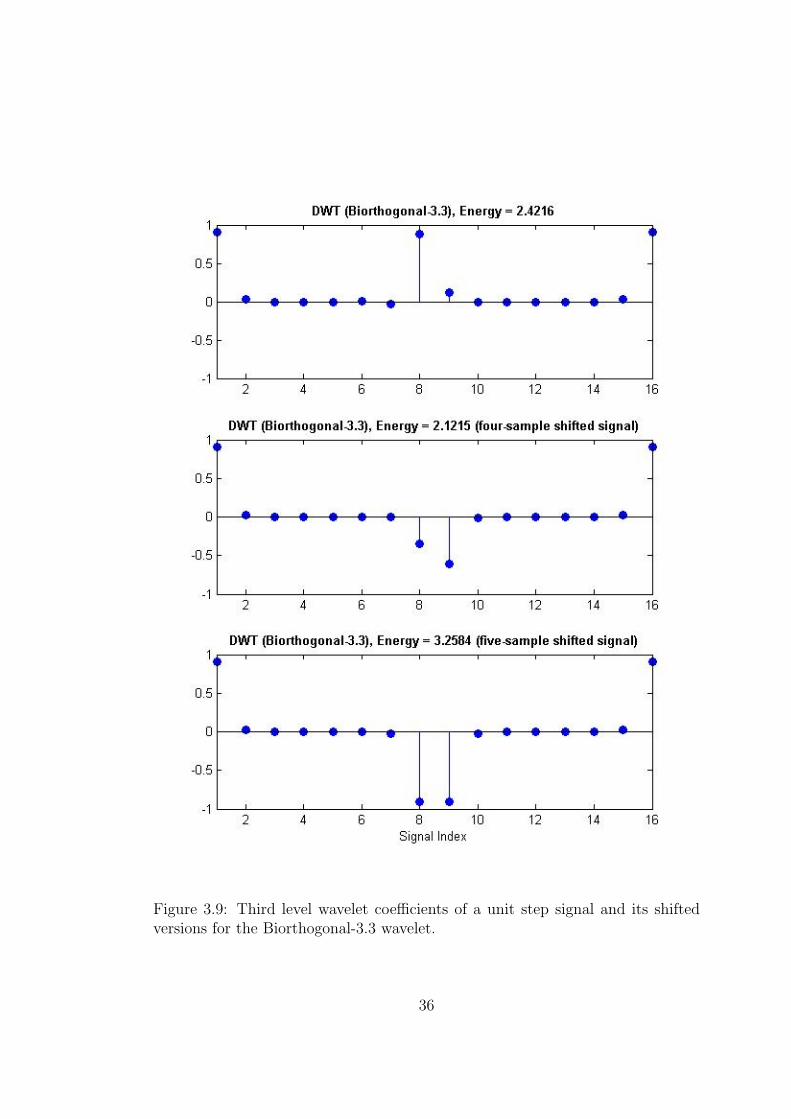
Figure 3.9: Third level wavelet coefficients of a unit step signal and its shiftedversions for the Biorthogonal-3.3 wavelet.
36
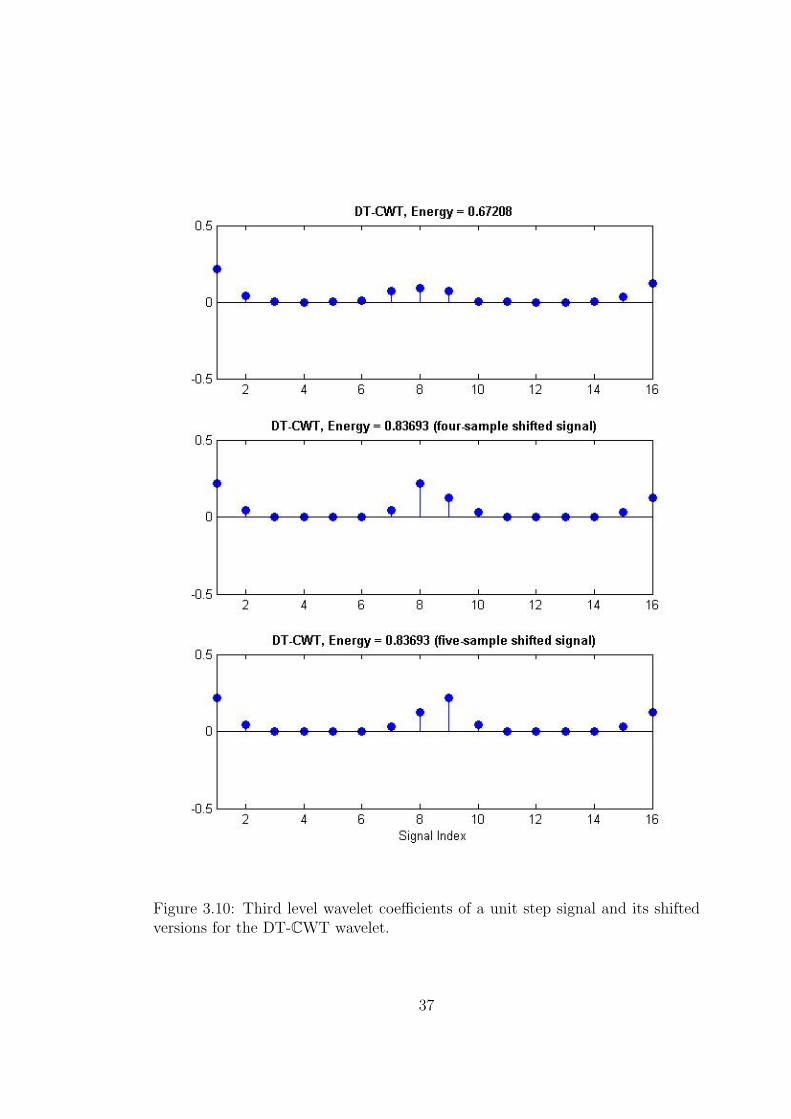
Figure 3.10: Third level wavelet coefficients of a unit step signal and its shiftedversions for the DT-CWT wavelet.
37
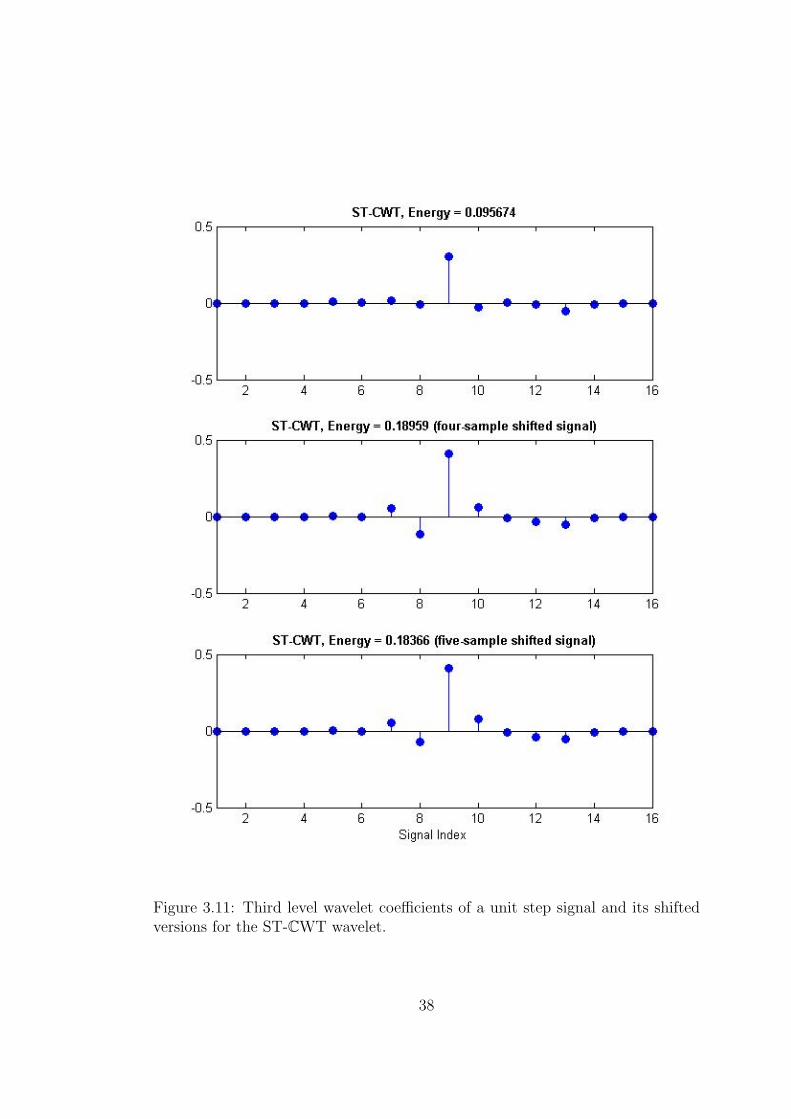
Figure 3.11: Third level wavelet coefficients of a unit step signal and its shiftedversions for the ST-CWT wavelet.
38
3.4 Computational Complexity Based Compar-
ison
The DFT, MFCC, DWT, DT-CWT and ST-CWT are compared to each other
in terms of computational complexity. For the numerical examples, number of
the signal samples over one signal window, N , is taken 1024, and number of the
frequency sub-bands, M , is taken 8.
Fast Fourier transform (FFT) is utilized instead of the DFT in the tests. The
N -point FFT requires N log2N complex multiplications and additions. Besides,
N real multiplications are needed to calculate the energies of the frequency sub-
bands. Therefore, computational complexity of the DFT based feature extraction
method is on the order of O(N log2N).
The mel-cepstrum based feature extraction scheme needs an extra M log2M
real multiplications and additions to carry out the inverse discrete cosine trans-
form, where M is the number of mel-frequency cepstral coefficients and also the
number of frequency sub-bands. Therefore, the computational complexity of the
MFCC method is O(N log2N) + O(M log2M). If N >> M , it can be used
as O(N log2N). In addition, M look-up operations are needed because the log
operation is performed by a look-up table.
The computational cost of the DT-CWT is twice that of ordinary DWT which
can be implemented in O(N), where N is the number of samples in the signal
[72]. The computational complexity of the ST-CWT is equivalent to the ordi-
nary DWT. In each branch of wavelet-tree, the computational cost is equivalent
to a discrete convolution operation. If it is a r-level wavelet-tree, 2r convolu-
tional operations are needed. Also, if the number of nonzero filter coefficients
is p, the number of the real multiplications is also p to get one convolutional
output. Totally 2pN(1 − 1/2r) real multiplications are required to execute the
ST-CWT. In additionally, the energy values of the frequency sub-bands are com-
puted with N(1 − 1/2r) + (r + 1) real multiplications. The exact number of all
real multiplications is given in Table 3.2.
39
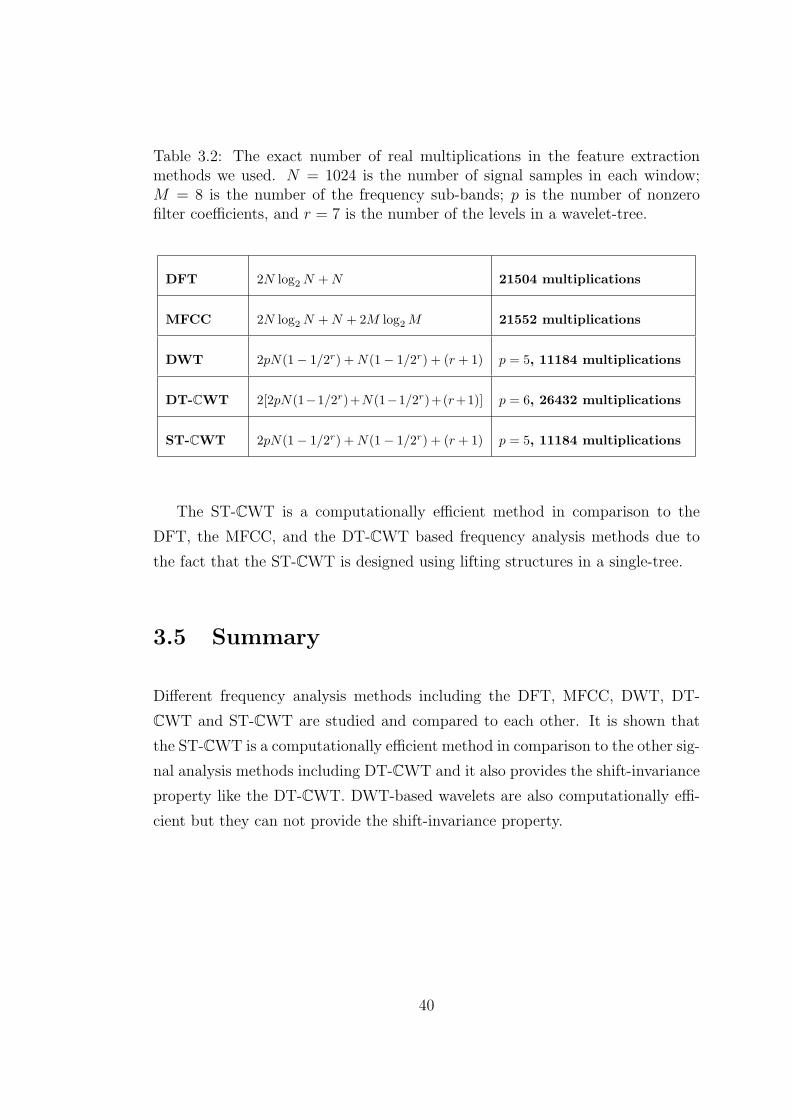
Table 3.2: The exact number of real multiplications in the feature extractionmethods we used. N = 1024 is the number of signal samples in each window;M = 8 is the number of the frequency sub-bands; p is the number of nonzerofilter coefficients, and r = 7 is the number of the levels in a wavelet-tree.
DFT 2N log2 N +N 21504 multiplications
MFCC 2N log2 N +N + 2M log2 M 21552 multiplications
DWT 2pN(1− 1/2r) +N(1− 1/2r) + (r + 1) p = 5, 11184 multiplications
DT-CWT 2[2pN(1−1/2r)+N(1−1/2r)+(r+1)] p = 6, 26432 multiplications
ST-CWT 2pN(1− 1/2r) +N(1− 1/2r) + (r + 1) p = 5, 11184 multiplications
The ST-CWT is a computationally efficient method in comparison to the
DFT, the MFCC, and the DT-CWT based frequency analysis methods due to
the fact that the ST-CWT is designed using lifting structures in a single-tree.
3.5 Summary
Different frequency analysis methods including the DFT, MFCC, DWT, DT-
CWT and ST-CWT are studied and compared to each other. It is shown that
the ST-CWT is a computationally efficient method in comparison to the other sig-
nal analysis methods including DT-CWT and it also provides the shift-invariance
property like the DT-CWT. DWT-based wavelets are also computationally effi-
cient but they can not provide the shift-invariance property.
40
Chapter 4
Ambient Assisted Living System
Using Different Sensors
In this chapter, an AAL system is described using the components introduced in
Chapter 2, and the theoretical methods reviewed in Chapter 3. Various detection
algorithms and classifiers are employed to implement the AAL system. Human
footstep detection, falling person detection, human motion detection, unusual
inactivity detection, indoor flooding detection, uncontrolled flame detection, gas
leak detection, and pet movement detection are the current capabilities of our
systems. It is assumed that only one person lives in a smart home while developing
our detection algorithms because the aim of this study is to improve the quality
of life of the elderly and handicapped people living alone.
The vibration sensor is employed in human footstep detection, falling person
detection, and indoor flooding detection applications. The PIR sensor is employed
in human motion detection, unusual inactivity detection, falling person detection,
uncontrolled flame detection, gas leak detection, and pet movement detection
applications. Uncontrolled flame detection, gas leak detection, and pet movement
detection systems were studied before in [57], [58], [73]. Among the previous
works, only the uncontrolled flame detection application is integrated to our AAL
system for the time being.
41
In Section 4.1, datasets related with our detection systems are proposed. Hu-
man motion and unusual inactivity detection systems are described in Section 4.2.
In the same section, walking intensity of the person in a certain time period is
calculated through the human footstep detection system. As the most important
implementations in this thesis, various falling person detection systems are intro-
duced in Section 4.3. One falling person detection system is implemented using a
vibration sensor, and the other one is implemented using two PIR sensors. There
is also a multi-sensor based falling person detection system which employs one
vibration sensor and two PIR sensors. As a final application, the indoor flooding
detection methods are discussed in Section 4.4.
Stand-alone sensor fusion application is introduced in Section 4.5 and all de-
tection systems are used in this multi-sensor application. chipKIT Uno32 boards
are employed for each sensor and the auto-dial alarm system is connected to the
main Uno32 board which determines final decisions for the emergency situations.
Uno32 boards communicate using Cat 5 cables in our implementation. The other
design details are given in Section 4.5.
4.1 Datasets
In the experiments, the GS-20DX vibration sensor signal is sampled at a rate
of 500 Hz, and the Paradox 476+ PIR sensor signal is sampled at a rate of
100 Hz. Sensor signal records are taken in different experimental environments
to analyze the effects of different environments. Third floor of a new building
which has a concrete floor, second floor of a old building which has a hardwood
floor, and fourth floor of a new building which has a hardwood floor are used for
the experiments while recording the vibration sensor signals.
For the PIR sensor based detection algorithms, 20-hour-long signal record is
used to detect the human motion and unusual inactivity situations. This dataset
is employed in Section 4.2.1. The vibration sensor based human footstep detection
system uses an another dataset which contains a total of 10-minute-long record
42
consisting of walking and no-activity events. Five-minute-long part of this record
is used to train a MM classifier, and the other five-minute-long part of the record
is used to test the classifier. This dataset is used in Section 4.2.2.
Falling person detection experiments are performed on two different datasets.
The first of these datasets contain only vibration sensor signals. To implement
a two-PIR-sensor based falling person detection system, a new dataset becomes
necessary because there was not any PIR sensor signal records in the first dataset.
The second dataset is formed by recording the vibration and the PIR sensor
signals synchronously.
A typical falling event lasts about two seconds. Therefore, the first dataset
for the falling person detection system contains 1024-sample-long signals corre-
sponding to the following number of incident records: 126 falling, 3937 walk-
ing/running, 2600 sitting, 117 fallen book, and 32 slammed door. Among these
incident records; 53 falling, 1617 walking/running, 1295 sitting, 11 fallen book,
and 44 slammed door cases are used for training classifiers. The remaining records
are used as the test dataset. Falling, walking, running, and sitting records are ob-
tained from 10 different people. These people have different weights and heights.
The second dataset for the falling person detection system is composed of to-
tally one-hour-long record containing activities such as falling, walking, running,
sitting, and bending. In this dataset, one minute record contains only one falling
event because before and after of the event need to be known for the two-PIR-
sensor based falling person detection system. That is to say, the two-PIR-sensor
based system does not detect the falling person immediately, the system needs to
analyze a period of time. Therefore, the second dataset contains 20 falling events
(20 minutes) and 40-minute-long no-falling events.
The final dataset is related with the indoor flooding detection. In this dataset,
the vibration sensor signals are recorded while water is flowing from the sink to
the floor. During this recording, there is not any human-sourced vibrations on
the floor. This dataset contains 47 flooding and 76 no-activity records which are
formed in two-second-long signals and taken in the bathroom.
43
4.2 Human Motion and Unusual Inactivity De-
tection
Smart homes for the elderly and handicapped people need to be designed to
monitor their daily activities. The person may not stand up from his/her bed or
may faint on where he/she is sitting. Hence, if there is not any human motion for
a while, detection of this situation becomes crucial. The PIR sensor is a suitable
device for the motion detection tasks. If there is a human motion in a room, all
of the motion activities can be detected using the PIR sensor. Similarly, instant
human motions can be detected and if there is not any motion in a certain time
period, the system can also sense this unusual inactivity situation.
Instant human motion detection can be done using the PIR sensor but there
can not be made a classification between a walking person and a waving person.
In other words, the PIR sensor based system only sense a human motion, it can
not make a decision about which type of human motion activity is occurred. If the
daily walking intensity of the person is measured, it may be helpful information for
the smart home application. Therefore, a measurement of the walking intensity
of the person in a certain time period is calculated through the human footstep
detection system which uses the vibration sensor instead of the PIR sensor.
4.2.1 PIR Sensor Based Detection Algorithms
Human motion detection using the PIR sensor is not a complex task. Various
simple algorithms can be used to sense the human motion. In this thesis, variance
of the PIR sensor signal window is compared with a threshold value to make a
decision about human motion. Threshold value is determined as 25 by analyzing
the variances of two-second-long PIR sensor signal windows. The PIR sensor
signal is almost free of noise and by using this threshold-based method human
motion can be detected in a room with 100% accuracy. Flowchart of the PIR
sensor based human motion detection algorithm is presented in Figure 4.1. Also
different algorithms may give the similar results for the human motion detection.
44
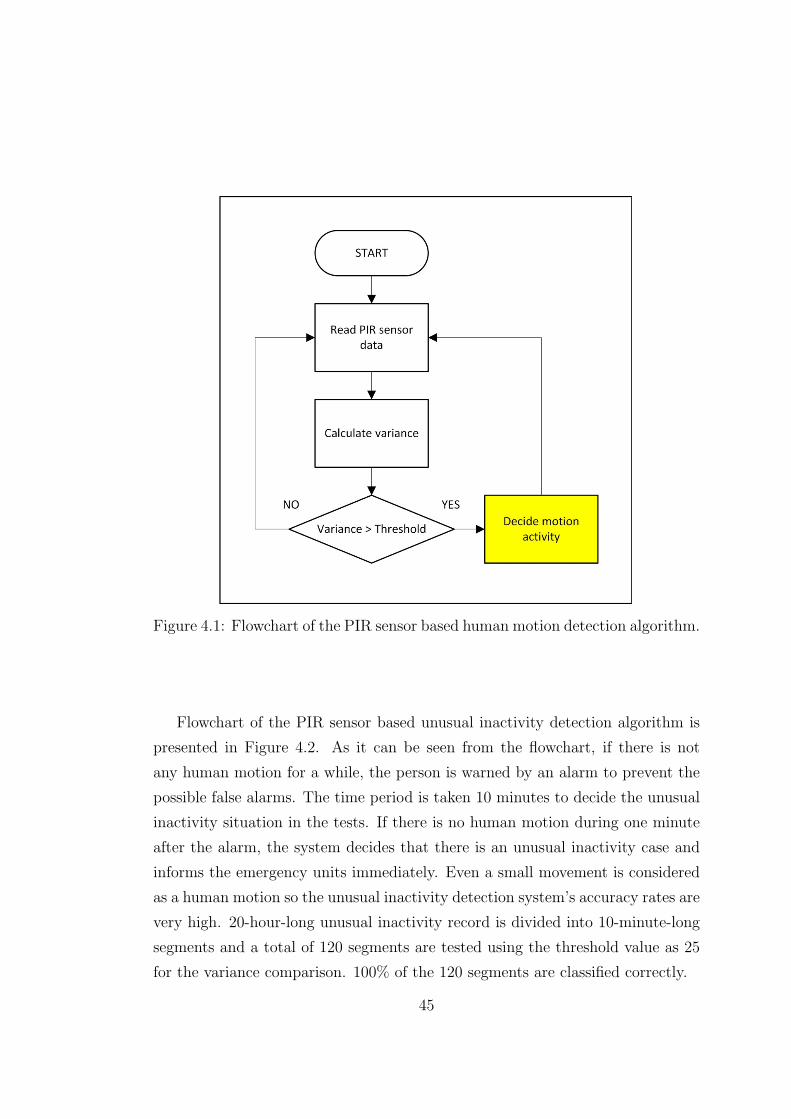
Figure 4.1: Flowchart of the PIR sensor based human motion detection algorithm.
Flowchart of the PIR sensor based unusual inactivity detection algorithm is
presented in Figure 4.2. As it can be seen from the flowchart, if there is not
any human motion for a while, the person is warned by an alarm to prevent the
possible false alarms. The time period is taken 10 minutes to decide the unusual
inactivity situation in the tests. If there is no human motion during one minute
after the alarm, the system decides that there is an unusual inactivity case and
informs the emergency units immediately. Even a small movement is considered
as a human motion so the unusual inactivity detection system’s accuracy rates are
very high. 20-hour-long unusual inactivity record is divided into 10-minute-long
segments and a total of 120 segments are tested using the threshold value as 25
for the variance comparison. 100% of the 120 segments are classified correctly.
45
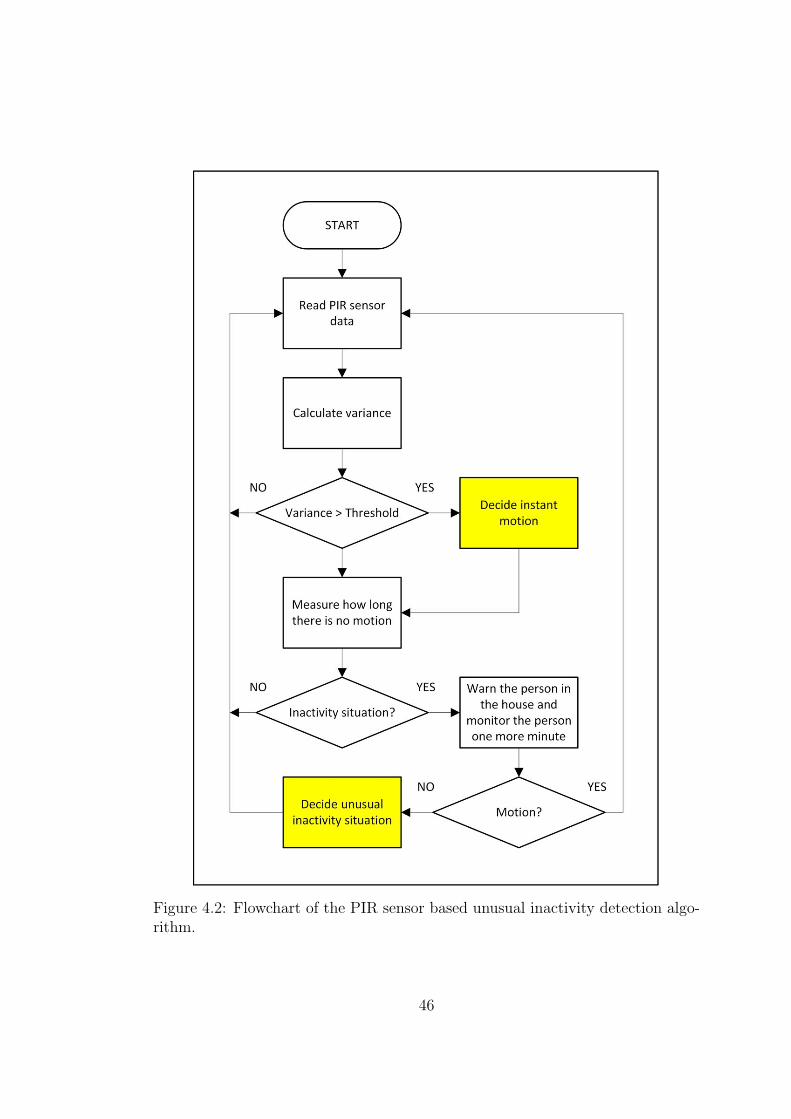
Figure 4.2: Flowchart of the PIR sensor based unusual inactivity detection algo-rithm.
46
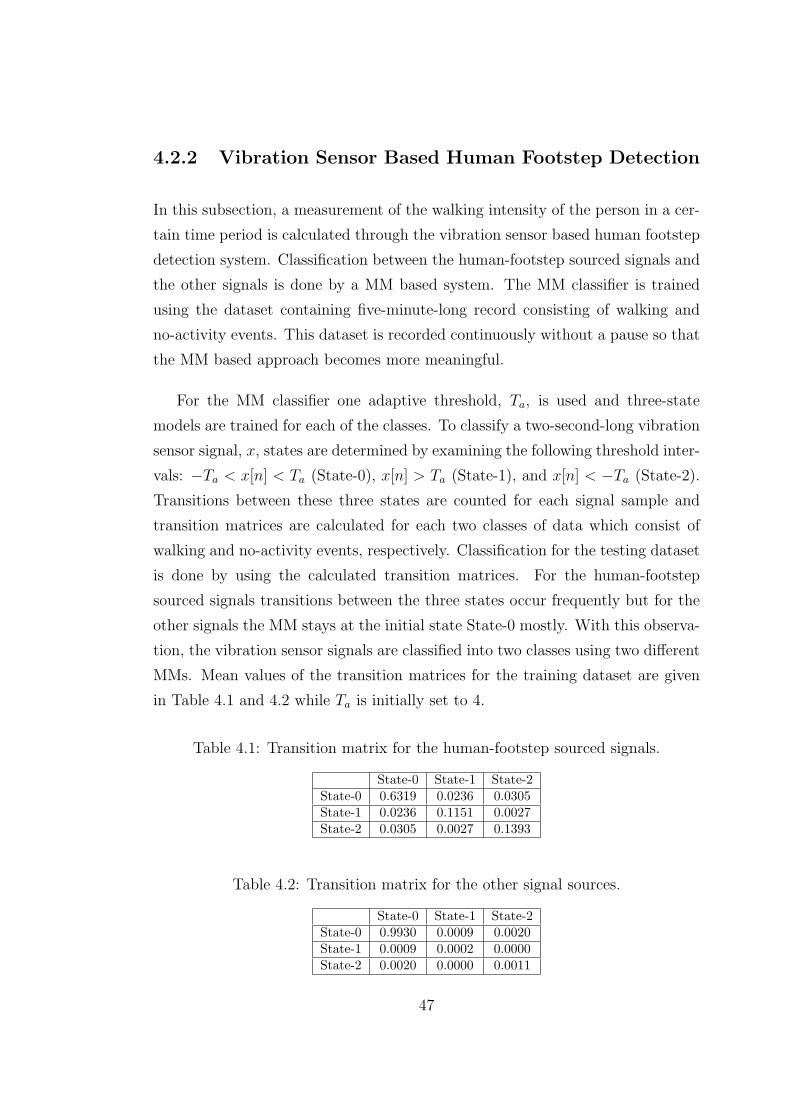
4.2.2 Vibration Sensor Based Human Footstep Detection
In this subsection, a measurement of the walking intensity of the person in a cer-
tain time period is calculated through the vibration sensor based human footstep
detection system. Classification between the human-footstep sourced signals and
the other signals is done by a MM based system. The MM classifier is trained
using the dataset containing five-minute-long record consisting of walking and
no-activity events. This dataset is recorded continuously without a pause so that
the MM based approach becomes more meaningful.
For the MM classifier one adaptive threshold, Ta, is used and three-state
models are trained for each of the classes. To classify a two-second-long vibration
sensor signal, x, states are determined by examining the following threshold inter-
vals: −Ta < x[n] < Ta (State-0), x[n] > Ta (State-1), and x[n] < −Ta (State-2).
Transitions between these three states are counted for each signal sample and
transition matrices are calculated for each two classes of data which consist of
walking and no-activity events, respectively. Classification for the testing dataset
is done by using the calculated transition matrices. For the human-footstep
sourced signals transitions between the three states occur frequently but for the
other signals the MM stays at the initial state State-0 mostly. With this observa-
tion, the vibration sensor signals are classified into two classes using two different
MMs. Mean values of the transition matrices for the training dataset are given
in Table 4.1 and 4.2 while Ta is initially set to 4.
Table 4.1: Transition matrix for the human-footstep sourced signals.
State-0 State-1 State-2State-0 0.6319 0.0236 0.0305State-1 0.0236 0.1151 0.0027State-2 0.0305 0.0027 0.1393
Table 4.2: Transition matrix for the other signal sources.
State-0 State-1 State-2State-0 0.9930 0.0009 0.0020State-1 0.0009 0.0002 0.0000State-2 0.0020 0.0000 0.0011
47
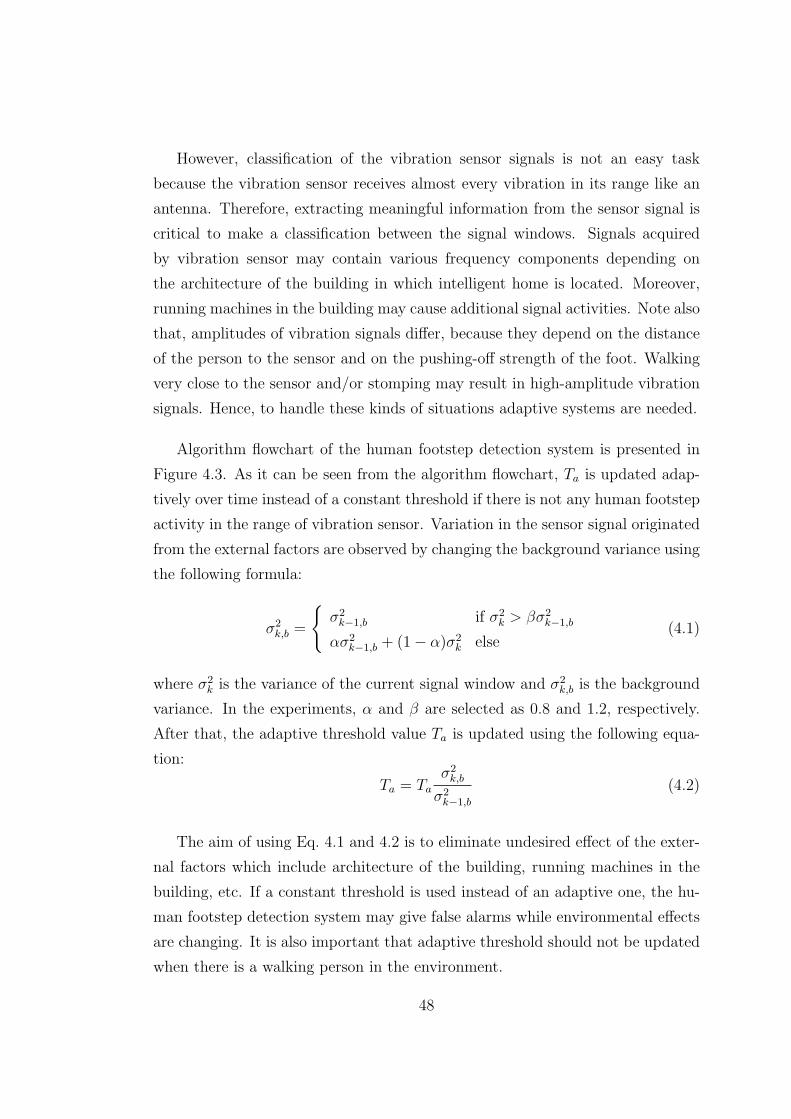
However, classification of the vibration sensor signals is not an easy task
because the vibration sensor receives almost every vibration in its range like an
antenna. Therefore, extracting meaningful information from the sensor signal is
critical to make a classification between the signal windows. Signals acquired
by vibration sensor may contain various frequency components depending on
the architecture of the building in which intelligent home is located. Moreover,
running machines in the building may cause additional signal activities. Note also
that, amplitudes of vibration signals differ, because they depend on the distance
of the person to the sensor and on the pushing-off strength of the foot. Walking
very close to the sensor and/or stomping may result in high-amplitude vibration
signals. Hence, to handle these kinds of situations adaptive systems are needed.
Algorithm flowchart of the human footstep detection system is presented in
Figure 4.3. As it can be seen from the algorithm flowchart, Ta is updated adap-
tively over time instead of a constant threshold if there is not any human footstep
activity in the range of vibration sensor. Variation in the sensor signal originated
from the external factors are observed by changing the background variance using
the following formula:
σ2k,b =
{σ2k−1,b if σ2
k > βσ2k−1,b
ασ2k−1,b + (1− α)σ2
k else(4.1)
where σ2k is the variance of the current signal window and σ2
k,b is the background
variance. In the experiments, α and β are selected as 0.8 and 1.2, respectively.
After that, the adaptive threshold value Ta is updated using the following equa-
tion:
Ta = Taσ2k,b
σ2k−1,b
(4.2)
The aim of using Eq. 4.1 and 4.2 is to eliminate undesired effect of the exter-
nal factors which include architecture of the building, running machines in the
building, etc. If a constant threshold is used instead of an adaptive one, the hu-
man footstep detection system may give false alarms while environmental effects
are changing. It is also important that adaptive threshold should not be updated
when there is a walking person in the environment.
48
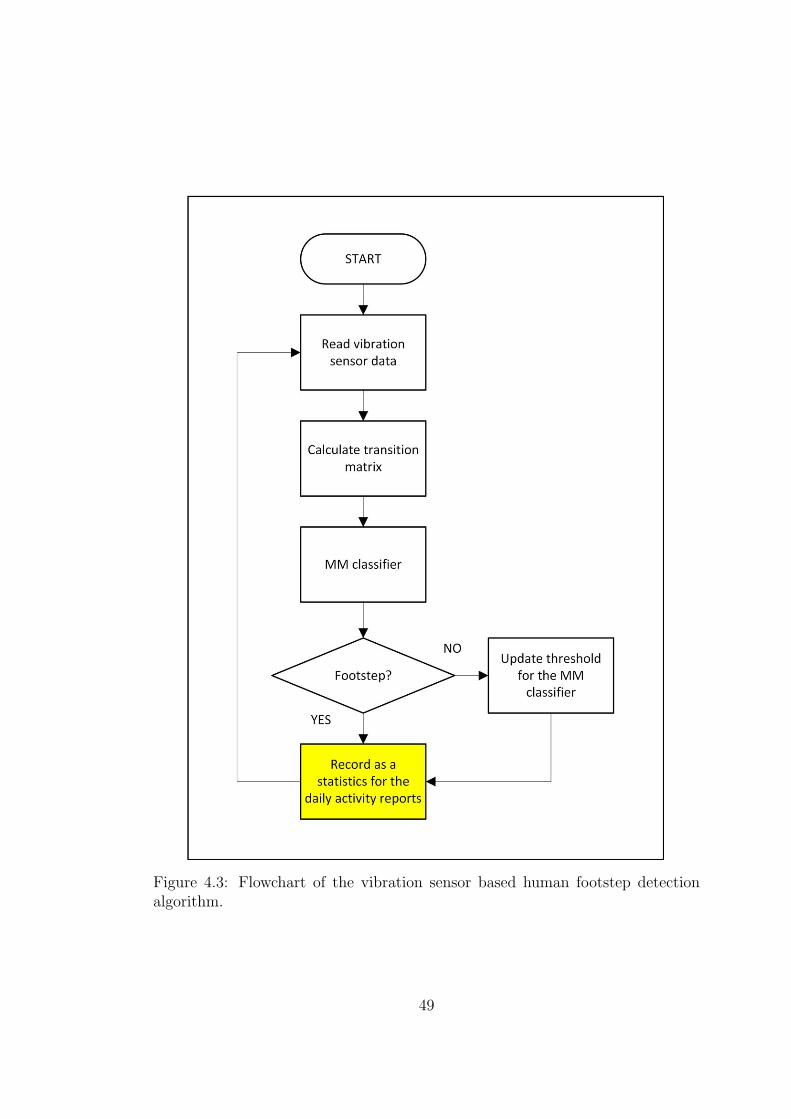
Figure 4.3: Flowchart of the vibration sensor based human footstep detectionalgorithm.
49
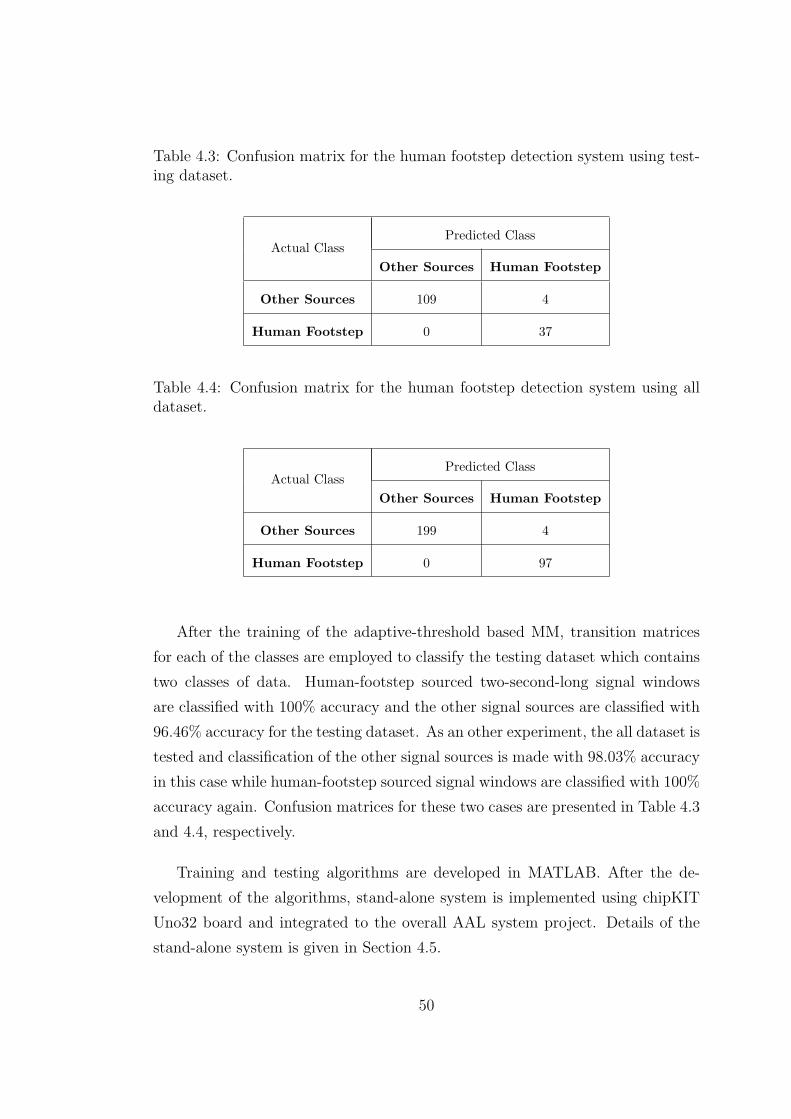
Table 4.3: Confusion matrix for the human footstep detection system using test-ing dataset.
Actual ClassPredicted Class
Other Sources Human Footstep
Other Sources 109 4
Human Footstep 0 37
Table 4.4: Confusion matrix for the human footstep detection system using alldataset.
Actual ClassPredicted Class
Other Sources Human Footstep
Other Sources 199 4
Human Footstep 0 97
After the training of the adaptive-threshold based MM, transition matrices
for each of the classes are employed to classify the testing dataset which contains
two classes of data. Human-footstep sourced two-second-long signal windows
are classified with 100% accuracy and the other signal sources are classified with
96.46% accuracy for the testing dataset. As an other experiment, the all dataset is
tested and classification of the other signal sources is made with 98.03% accuracy
in this case while human-footstep sourced signal windows are classified with 100%
accuracy again. Confusion matrices for these two cases are presented in Table 4.3
and 4.4, respectively.
Training and testing algorithms are developed in MATLAB. After the de-
velopment of the algorithms, stand-alone system is implemented using chipKIT
Uno32 board and integrated to the overall AAL system project. Details of the
stand-alone system is given in Section 4.5.
50
4.3 Falling Person Detection
In this section, various falling person detection applications are introduced.
Firstly, a vibration sensor based falling person detection system was developed
in our studies [69], [74]. This system uses the theoretical works introduced in
Chapter 3 and classifiers which consist of the Euclidean distance and the sup-
port vector machine (SVM) classifiers. The experimental setup and statistical
results are presented in Section 4.3.1. The vibration sensor based falling person
detection system succeeds for many falling situations however it is observed that
this system may not detect slow fallings which do not cause a sufficient vibration
on the floor. Zero miss-detection rate is crucial for the falling person detection
systems and the slow fallings increases miss-detection rates. Hence, a different
type of a system is needed to prevent these miss-detections.
In our second system, two PIR sensors are employed concurrently and a novel
algorithm is developed to detect a falling person [75]. Details of the two-PIR-
sensor based falling person detection system is described in Section 4.3.2. By
using this system, the falling event can be analyzed before and after the falling.
Therefore, slow fallings also can be detected and the system does not affected by
the person or the environment thanks to the PIR sensors. As emphasized before,
decreasing the number of false alarms is important but zero miss-detection rate is
more important in the falling person detection applications. The two-PIR-sensor
based system decreases miss-detection rates as expected.
As a third and last detection system for the falling event, the vibration sensor
and two PIR sensors are employed together. This multi-sensor based falling per-
son detection system take advantages of both the vibration sensor based detector
and the two-PIR-sensor based detector. For an example, vibration sensor based
system can not sense the activities after falling (e.g. standing up) but the two-
PIR-sensor based system can analyze the human motions before and after the
falling. However, if a person falls fast and stays motionless, the two-PIR-sensor
based system finds no way out. In this situations, falling event can be detected
instantly using the vibration sensor based system. The other details of the multi-
sensor based falling person detection system is presented in Section 4.3.3.
51
4.3.1 Vibration Sensor Based Detection Algorithm
A typical falling event lasts about two seconds and frequency content of the two-
second-long vibration sensor signal window contains useful informations for the
classification purposes. Falling person detection system based only on the signal
strength may produce false alarms because other signal sources like a falling object
situation or a slamming door situation can cause similar vibrations on the floor.
To prevent these possible false alarms, duration of the activity and frequency
content of the signal window should be taken into account as well as the signal
strength.
Our system checks the strength of the vibration sensor signal before ana-
lyzing the frequency content of the sensor signal. Signal windows with high
deviations from the average value are chosen as candidate fall regions. An exper-
imentally determined value of 50 is used as the threshold. Let M = max |x(n)|and m = min |x(n)| within an analysis window of length 1024 samples. When
the difference M -m is larger than the threshold, this window of data is further
processed by various feature extraction schemes for the falling person detection.
If M -m does not exceed the threshold, the human footstep detection system is
employed. Flowchart of the vibration sensor based falling person detection algo-
rithm is presented in Figure 4.4.
Candidate fall regions are examined through various frequency analysis meth-
ods described in Chapter 3. The DFT, MFCC, DWT with different filter-banks,
DT-CWT and ST-CWT are employed to extract features from the 1024-sample-
long vibration sensor signals. After the feature extraction, classification for the
vibration sensor signals is done between “falling” and “other activities”. For
this purpose, the Euclidean distance classifier and the SVM classifier are used
and compared to each other for the first falling-related dataset introduced in
Section 4.1. Comparative results on the detection performance for the feature
extraction methods are presented in Table 4.5 and 4.6 according to the Euclidean
distance and SVM classifiers, respectively. The results are obtained using the
records in the testing dataset.
52
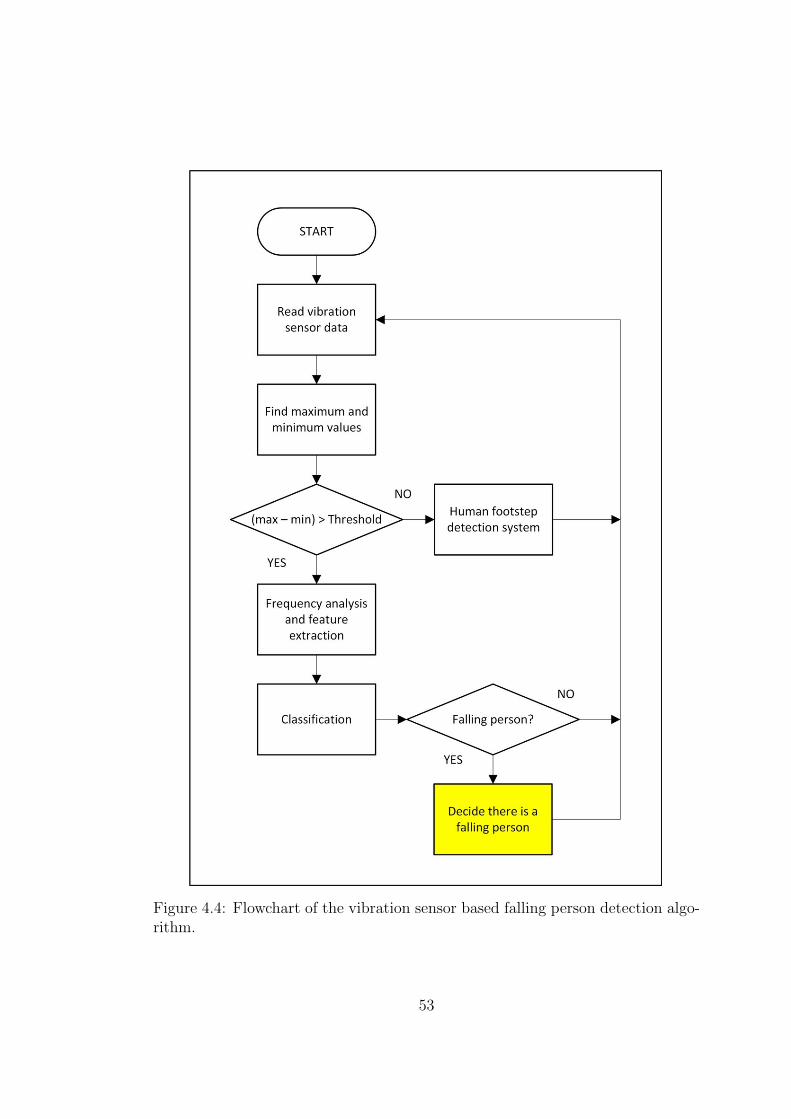
Figure 4.4: Flowchart of the vibration sensor based falling person detection algo-rithm.
53
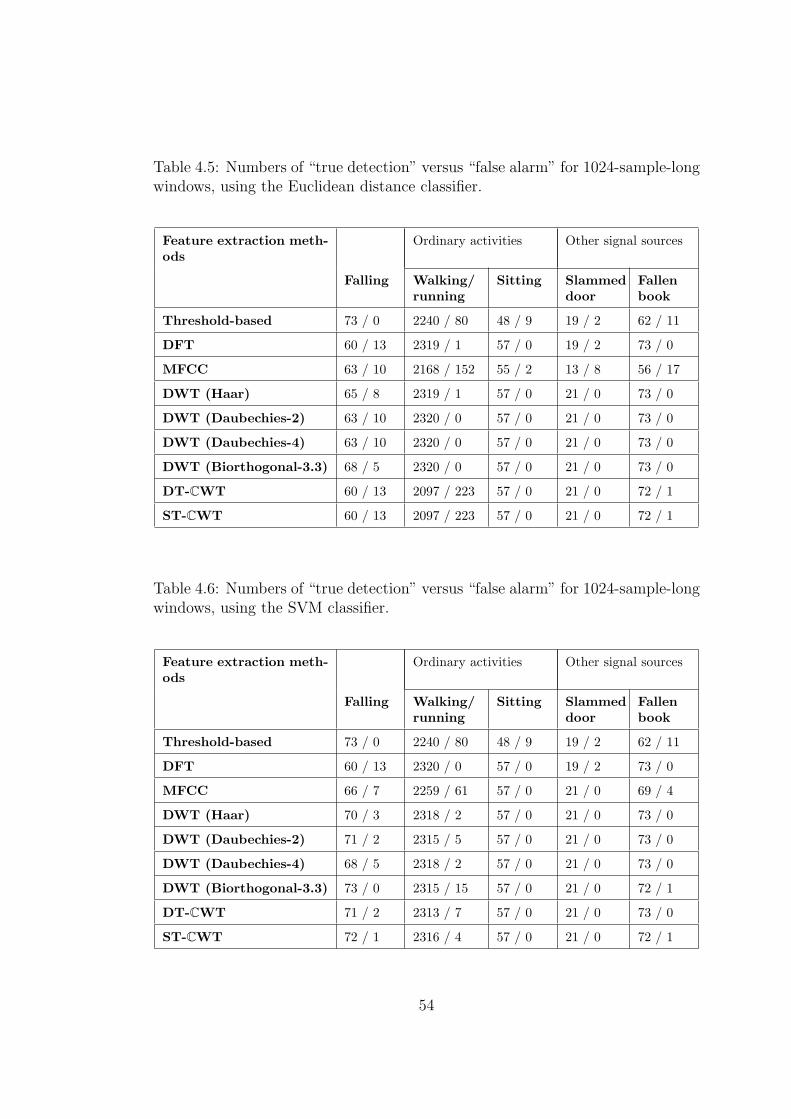
Table 4.5: Numbers of “true detection” versus “false alarm” for 1024-sample-longwindows, using the Euclidean distance classifier.
Feature extraction meth-ods
Ordinary activities Other signal sources
Falling Walking/running
Sitting Slammeddoor
Fallenbook
Threshold-based 73 / 0 2240 / 80 48 / 9 19 / 2 62 / 11
DFT 60 / 13 2319 / 1 57 / 0 19 / 2 73 / 0
MFCC 63 / 10 2168 / 152 55 / 2 13 / 8 56 / 17
DWT (Haar) 65 / 8 2319 / 1 57 / 0 21 / 0 73 / 0
DWT (Daubechies-2) 63 / 10 2320 / 0 57 / 0 21 / 0 73 / 0
DWT (Daubechies-4) 63 / 10 2320 / 0 57 / 0 21 / 0 73 / 0
DWT (Biorthogonal-3.3) 68 / 5 2320 / 0 57 / 0 21 / 0 73 / 0
DT-CWT 60 / 13 2097 / 223 57 / 0 21 / 0 72 / 1
ST-CWT 60 / 13 2097 / 223 57 / 0 21 / 0 72 / 1
Table 4.6: Numbers of “true detection” versus “false alarm” for 1024-sample-longwindows, using the SVM classifier.
Feature extraction meth-ods
Ordinary activities Other signal sources
Falling Walking/running
Sitting Slammeddoor
Fallenbook
Threshold-based 73 / 0 2240 / 80 48 / 9 19 / 2 62 / 11
DFT 60 / 13 2320 / 0 57 / 0 19 / 2 73 / 0
MFCC 66 / 7 2259 / 61 57 / 0 21 / 0 69 / 4
DWT (Haar) 70 / 3 2318 / 2 57 / 0 21 / 0 73 / 0
DWT (Daubechies-2) 71 / 2 2315 / 5 57 / 0 21 / 0 73 / 0
DWT (Daubechies-4) 68 / 5 2318 / 2 57 / 0 21 / 0 73 / 0
DWT (Biorthogonal-3.3) 73 / 0 2315 / 15 57 / 0 21 / 0 72 / 1
DT-CWT 71 / 2 2313 / 7 57 / 0 21 / 0 73 / 0
ST-CWT 72 / 1 2316 / 4 57 / 0 21 / 0 72 / 1
54
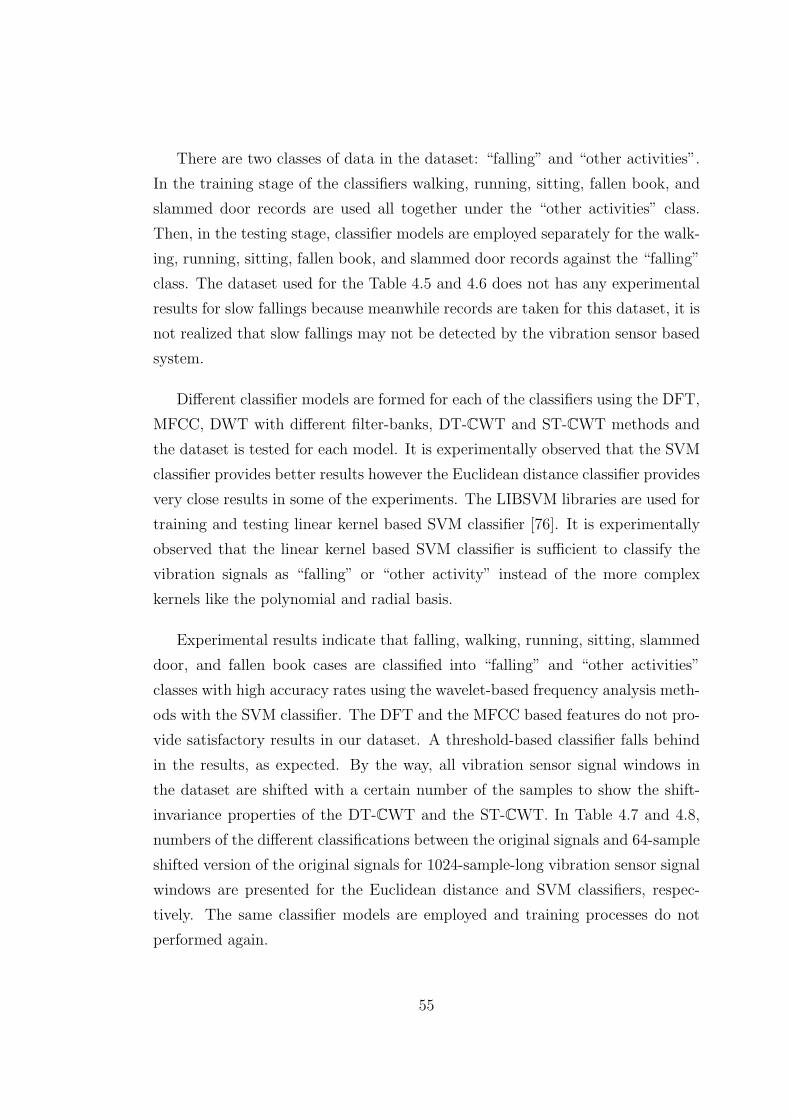
There are two classes of data in the dataset: “falling” and “other activities”.
In the training stage of the classifiers walking, running, sitting, fallen book, and
slammed door records are used all together under the “other activities” class.
Then, in the testing stage, classifier models are employed separately for the walk-
ing, running, sitting, fallen book, and slammed door records against the “falling”
class. The dataset used for the Table 4.5 and 4.6 does not has any experimental
results for slow fallings because meanwhile records are taken for this dataset, it is
not realized that slow fallings may not be detected by the vibration sensor based
system.
Different classifier models are formed for each of the classifiers using the DFT,
MFCC, DWT with different filter-banks, DT-CWT and ST-CWT methods and
the dataset is tested for each model. It is experimentally observed that the SVM
classifier provides better results however the Euclidean distance classifier provides
very close results in some of the experiments. The LIBSVM libraries are used for
training and testing linear kernel based SVM classifier [76]. It is experimentally
observed that the linear kernel based SVM classifier is sufficient to classify the
vibration signals as “falling” or “other activity” instead of the more complex
kernels like the polynomial and radial basis.
Experimental results indicate that falling, walking, running, sitting, slammed
door, and fallen book cases are classified into “falling” and “other activities”
classes with high accuracy rates using the wavelet-based frequency analysis meth-
ods with the SVM classifier. The DFT and the MFCC based features do not pro-
vide satisfactory results in our dataset. A threshold-based classifier falls behind
in the results, as expected. By the way, all vibration sensor signal windows in
the dataset are shifted with a certain number of the samples to show the shift-
invariance properties of the DT-CWT and the ST-CWT. In Table 4.7 and 4.8,
numbers of the different classifications between the original signals and 64-sample
shifted version of the original signals for 1024-sample-long vibration sensor signal
windows are presented for the Euclidean distance and SVM classifiers, respec-
tively. The same classifier models are employed and training processes do not
performed again.
55
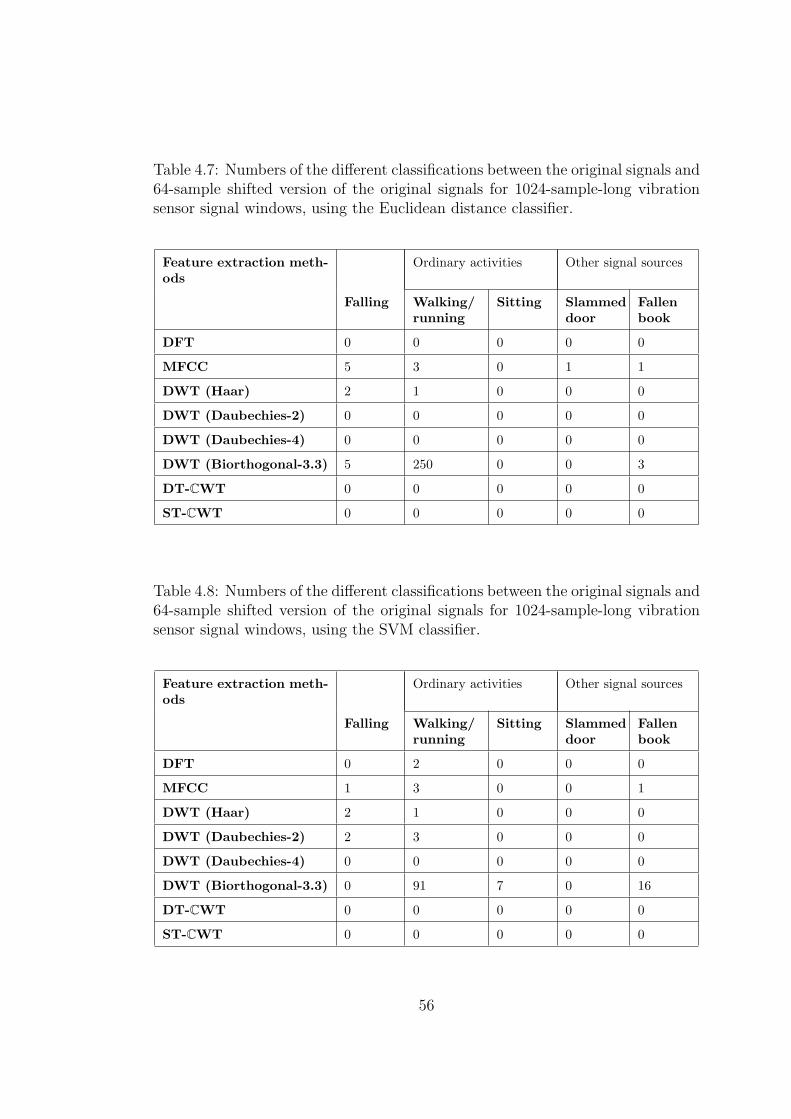
Table 4.7: Numbers of the different classifications between the original signals and64-sample shifted version of the original signals for 1024-sample-long vibrationsensor signal windows, using the Euclidean distance classifier.
Feature extraction meth-ods
Ordinary activities Other signal sources
Falling Walking/running
Sitting Slammeddoor
Fallenbook
DFT 0 0 0 0 0
MFCC 5 3 0 1 1
DWT (Haar) 2 1 0 0 0
DWT (Daubechies-2) 0 0 0 0 0
DWT (Daubechies-4) 0 0 0 0 0
DWT (Biorthogonal-3.3) 5 250 0 0 3
DT-CWT 0 0 0 0 0
ST-CWT 0 0 0 0 0
Table 4.8: Numbers of the different classifications between the original signals and64-sample shifted version of the original signals for 1024-sample-long vibrationsensor signal windows, using the SVM classifier.
Feature extraction meth-ods
Ordinary activities Other signal sources
Falling Walking/running
Sitting Slammeddoor
Fallenbook
DFT 0 2 0 0 0
MFCC 1 3 0 0 1
DWT (Haar) 2 1 0 0 0
DWT (Daubechies-2) 2 3 0 0 0
DWT (Daubechies-4) 0 0 0 0 0
DWT (Biorthogonal-3.3) 0 91 7 0 16
DT-CWT 0 0 0 0 0
ST-CWT 0 0 0 0 0
56
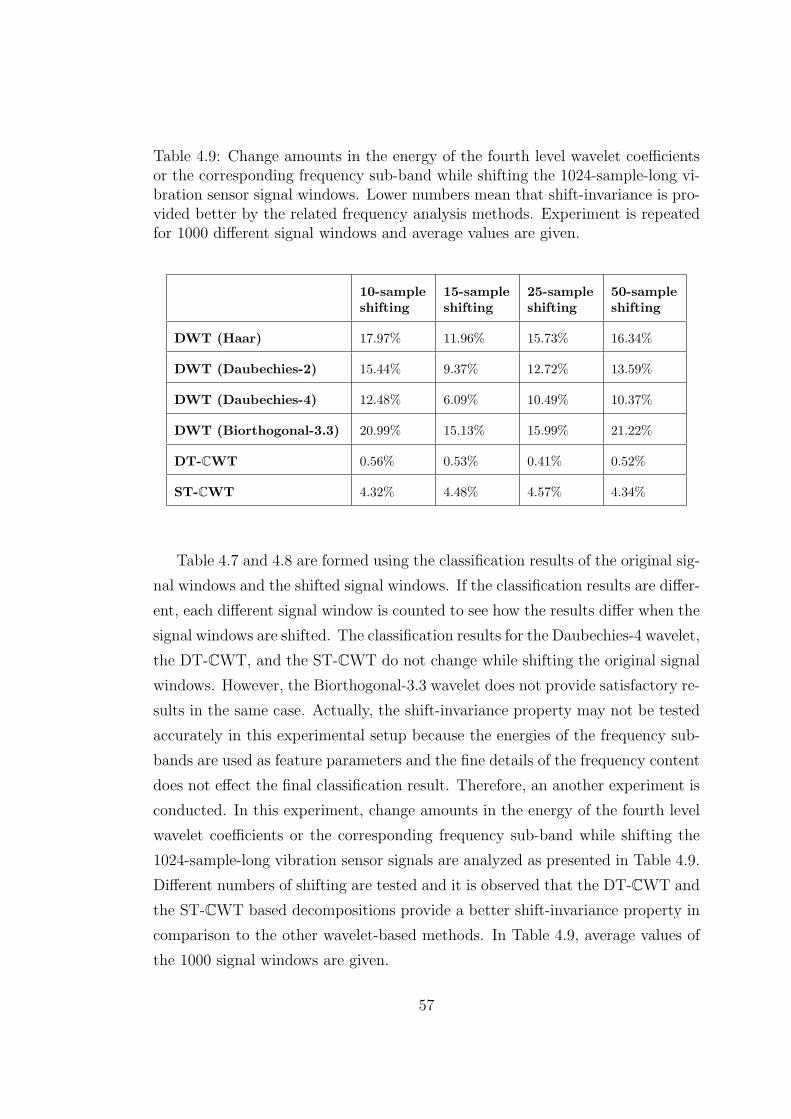
Table 4.9: Change amounts in the energy of the fourth level wavelet coefficientsor the corresponding frequency sub-band while shifting the 1024-sample-long vi-bration sensor signal windows. Lower numbers mean that shift-invariance is pro-vided better by the related frequency analysis methods. Experiment is repeatedfor 1000 different signal windows and average values are given.
10-sampleshifting
15-sampleshifting
25-sampleshifting
50-sampleshifting
DWT (Haar) 17.97% 11.96% 15.73% 16.34%
DWT (Daubechies-2) 15.44% 9.37% 12.72% 13.59%
DWT (Daubechies-4) 12.48% 6.09% 10.49% 10.37%
DWT (Biorthogonal-3.3) 20.99% 15.13% 15.99% 21.22%
DT-CWT 0.56% 0.53% 0.41% 0.52%
ST-CWT 4.32% 4.48% 4.57% 4.34%
Table 4.7 and 4.8 are formed using the classification results of the original sig-
nal windows and the shifted signal windows. If the classification results are differ-
ent, each different signal window is counted to see how the results differ when the
signal windows are shifted. The classification results for the Daubechies-4 wavelet,
the DT-CWT, and the ST-CWT do not change while shifting the original signal
windows. However, the Biorthogonal-3.3 wavelet does not provide satisfactory re-
sults in the same case. Actually, the shift-invariance property may not be tested
accurately in this experimental setup because the energies of the frequency sub-
bands are used as feature parameters and the fine details of the frequency content
does not effect the final classification result. Therefore, an another experiment is
conducted. In this experiment, change amounts in the energy of the fourth level
wavelet coefficients or the corresponding frequency sub-band while shifting the
1024-sample-long vibration sensor signals are analyzed as presented in Table 4.9.
Different numbers of shifting are tested and it is observed that the DT-CWT and
the ST-CWT based decompositions provide a better shift-invariance property in
comparison to the other wavelet-based methods. In Table 4.9, average values of
the 1000 signal windows are given.
57
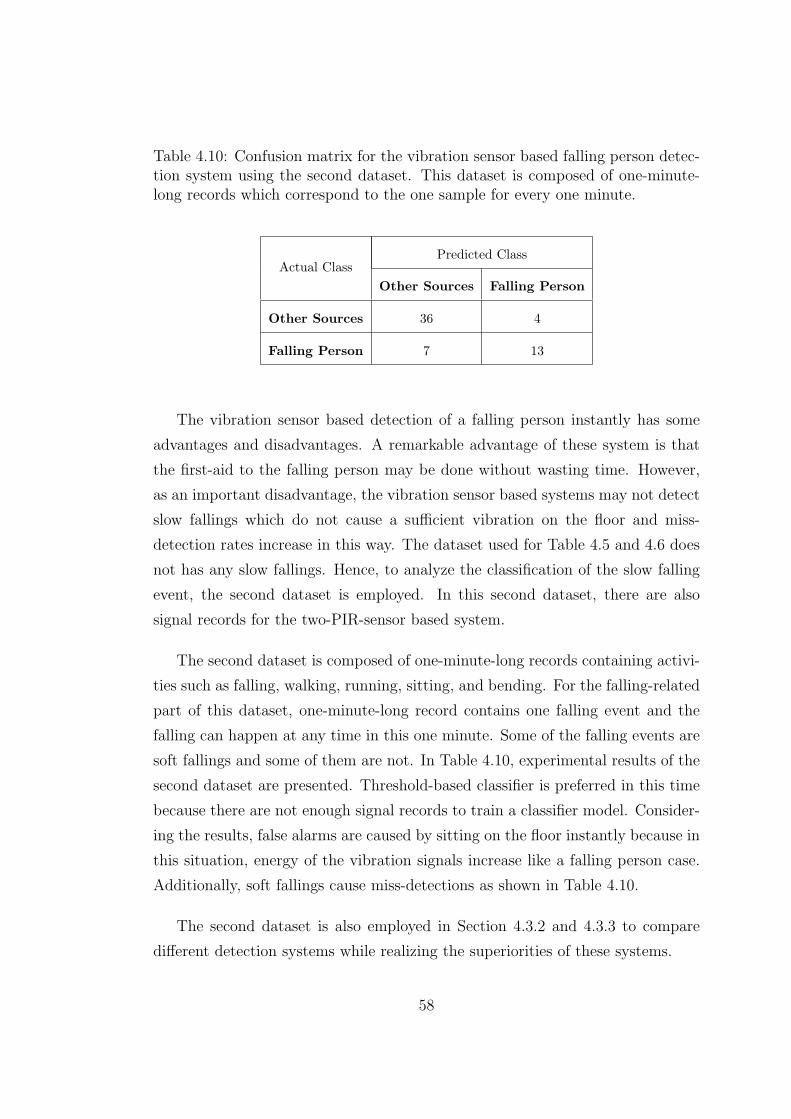
Table 4.10: Confusion matrix for the vibration sensor based falling person detec-tion system using the second dataset. This dataset is composed of one-minute-long records which correspond to the one sample for every one minute.
Actual ClassPredicted Class
Other Sources Falling Person
Other Sources 36 4
Falling Person 7 13
The vibration sensor based detection of a falling person instantly has some
advantages and disadvantages. A remarkable advantage of these system is that
the first-aid to the falling person may be done without wasting time. However,
as an important disadvantage, the vibration sensor based systems may not detect
slow fallings which do not cause a sufficient vibration on the floor and miss-
detection rates increase in this way. The dataset used for Table 4.5 and 4.6 does
not has any slow fallings. Hence, to analyze the classification of the slow falling
event, the second dataset is employed. In this second dataset, there are also
signal records for the two-PIR-sensor based system.
The second dataset is composed of one-minute-long records containing activi-
ties such as falling, walking, running, sitting, and bending. For the falling-related
part of this dataset, one-minute-long record contains one falling event and the
falling can happen at any time in this one minute. Some of the falling events are
soft fallings and some of them are not. In Table 4.10, experimental results of the
second dataset are presented. Threshold-based classifier is preferred in this time
because there are not enough signal records to train a classifier model. Consider-
ing the results, false alarms are caused by sitting on the floor instantly because in
this situation, energy of the vibration signals increase like a falling person case.
Additionally, soft fallings cause miss-detections as shown in Table 4.10.
The second dataset is also employed in Section 4.3.2 and 4.3.3 to compare
different detection systems while realizing the superiorities of these systems.
58
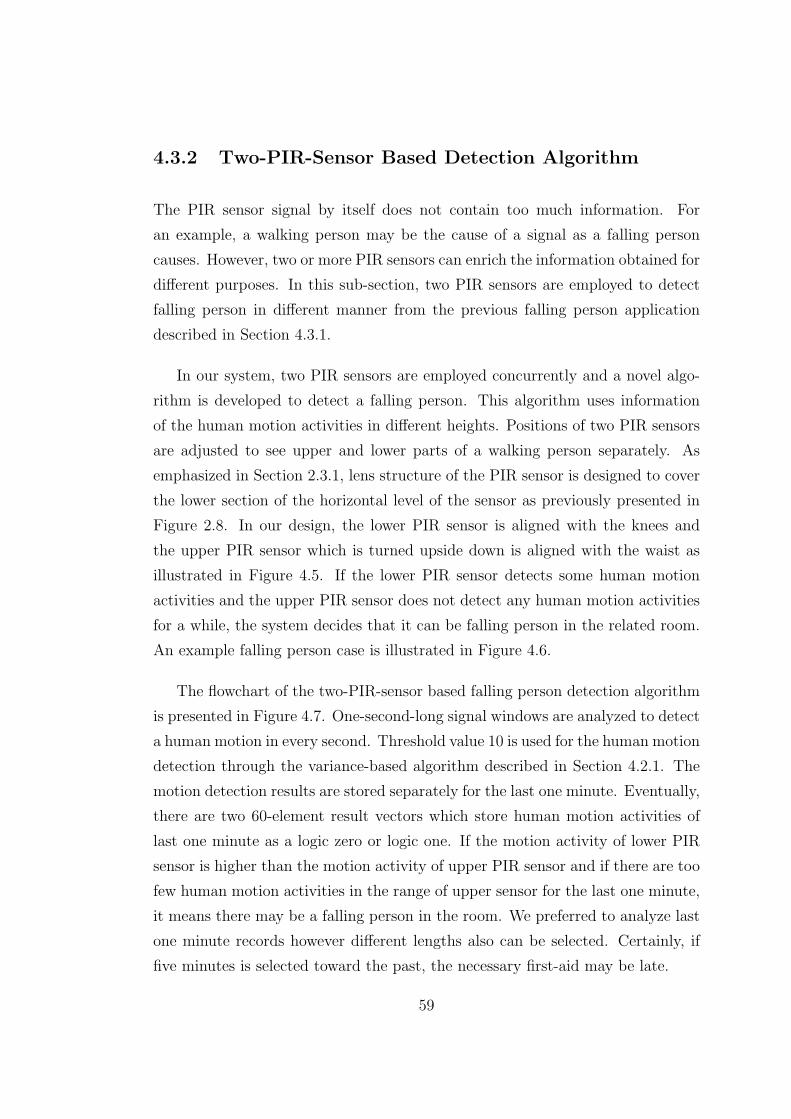
4.3.2 Two-PIR-Sensor Based Detection Algorithm
The PIR sensor signal by itself does not contain too much information. For
an example, a walking person may be the cause of a signal as a falling person
causes. However, two or more PIR sensors can enrich the information obtained for
different purposes. In this sub-section, two PIR sensors are employed to detect
falling person in different manner from the previous falling person application
described in Section 4.3.1.
In our system, two PIR sensors are employed concurrently and a novel algo-
rithm is developed to detect a falling person. This algorithm uses information
of the human motion activities in different heights. Positions of two PIR sensors
are adjusted to see upper and lower parts of a walking person separately. As
emphasized in Section 2.3.1, lens structure of the PIR sensor is designed to cover
the lower section of the horizontal level of the sensor as previously presented in
Figure 2.8. In our design, the lower PIR sensor is aligned with the knees and
the upper PIR sensor which is turned upside down is aligned with the waist as
illustrated in Figure 4.5. If the lower PIR sensor detects some human motion
activities and the upper PIR sensor does not detect any human motion activities
for a while, the system decides that it can be falling person in the related room.
An example falling person case is illustrated in Figure 4.6.
The flowchart of the two-PIR-sensor based falling person detection algorithm
is presented in Figure 4.7. One-second-long signal windows are analyzed to detect
a human motion in every second. Threshold value 10 is used for the human motion
detection through the variance-based algorithm described in Section 4.2.1. The
motion detection results are stored separately for the last one minute. Eventually,
there are two 60-element result vectors which store human motion activities of
last one minute as a logic zero or logic one. If the motion activity of lower PIR
sensor is higher than the motion activity of upper PIR sensor and if there are too
few human motion activities in the range of upper sensor for the last one minute,
it means there may be a falling person in the room. We preferred to analyze last
one minute records however different lengths also can be selected. Certainly, if
five minutes is selected toward the past, the necessary first-aid may be late.
59
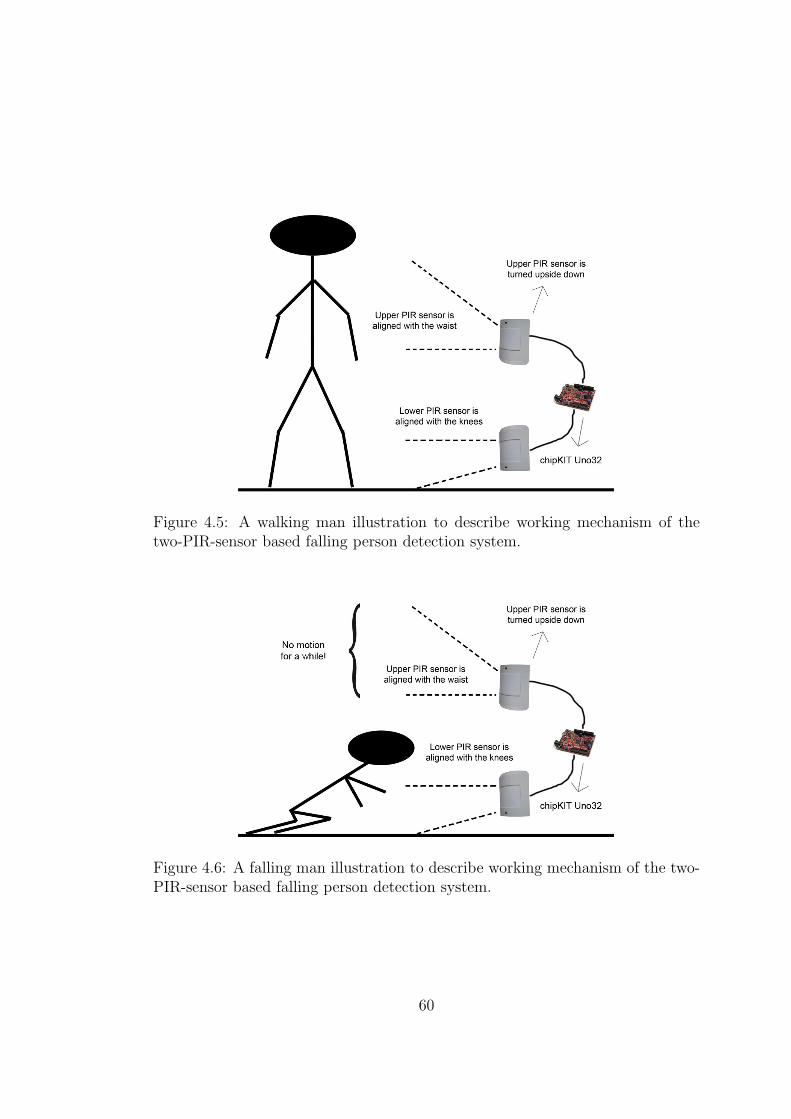
Figure 4.5: A walking man illustration to describe working mechanism of thetwo-PIR-sensor based falling person detection system.
Figure 4.6: A falling man illustration to describe working mechanism of the two-PIR-sensor based falling person detection system.
60
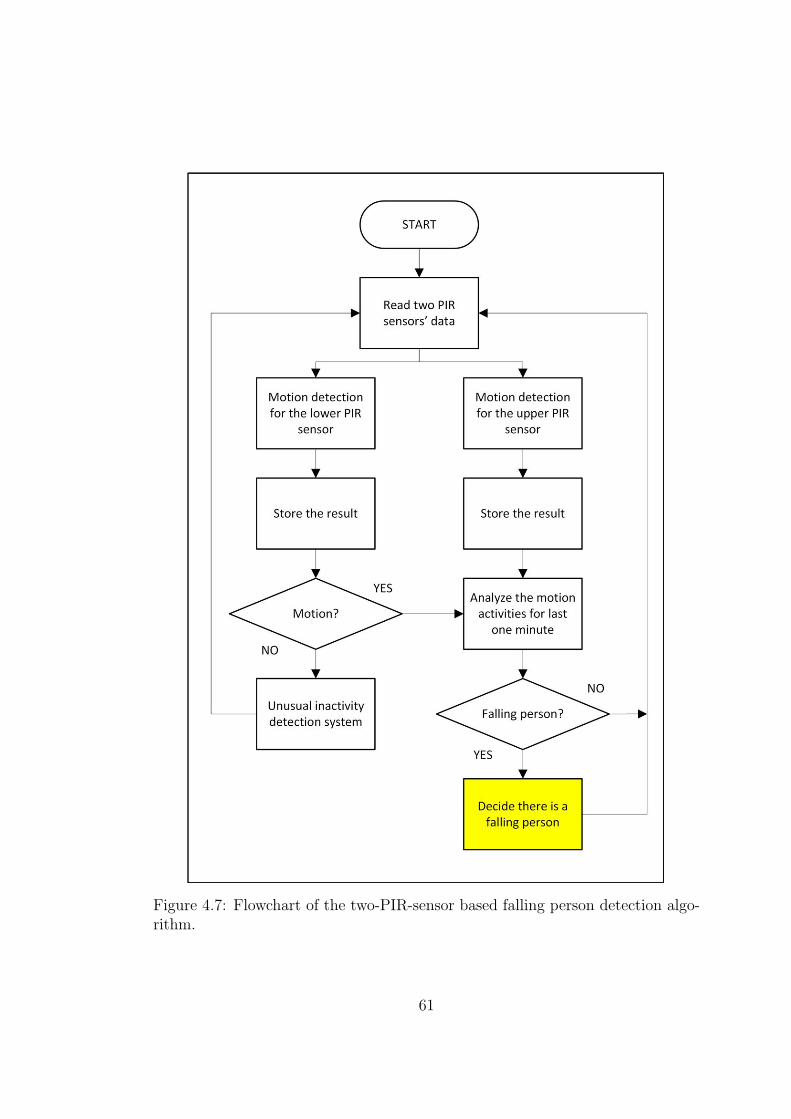
Figure 4.7: Flowchart of the two-PIR-sensor based falling person detection algo-rithm.
61
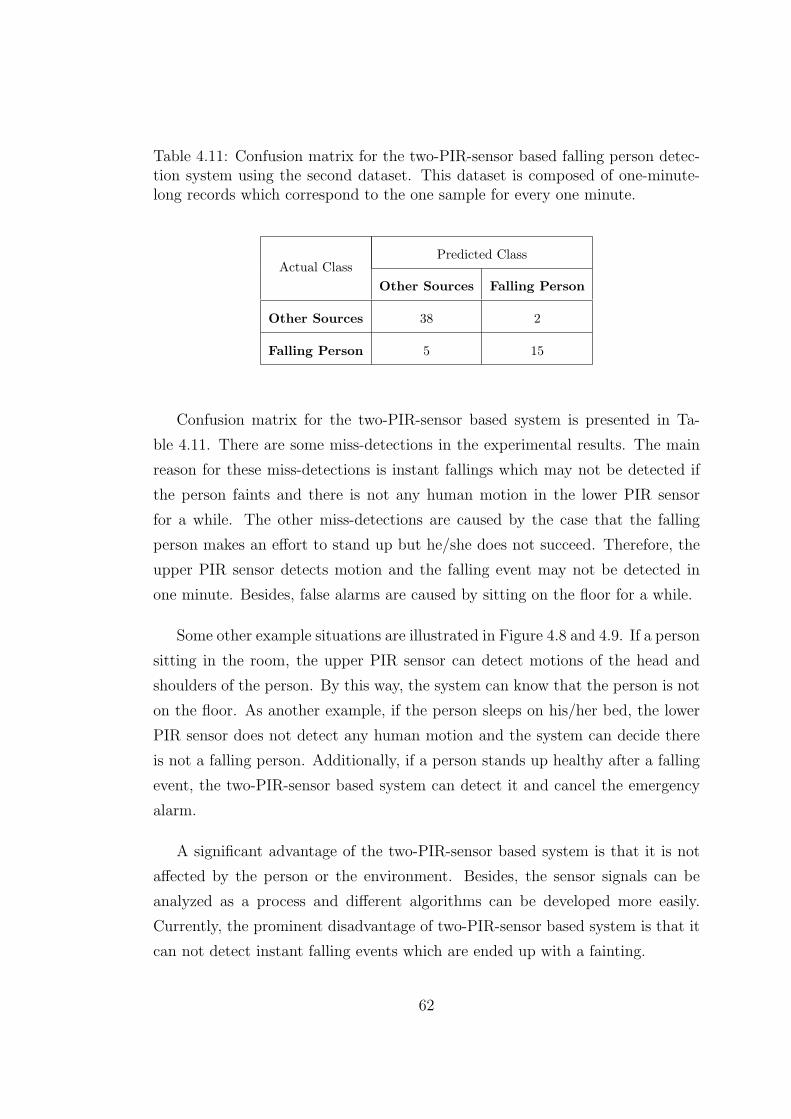
Table 4.11: Confusion matrix for the two-PIR-sensor based falling person detec-tion system using the second dataset. This dataset is composed of one-minute-long records which correspond to the one sample for every one minute.
Actual ClassPredicted Class
Other Sources Falling Person
Other Sources 38 2
Falling Person 5 15
Confusion matrix for the two-PIR-sensor based system is presented in Ta-
ble 4.11. There are some miss-detections in the experimental results. The main
reason for these miss-detections is instant fallings which may not be detected if
the person faints and there is not any human motion in the lower PIR sensor
for a while. The other miss-detections are caused by the case that the falling
person makes an effort to stand up but he/she does not succeed. Therefore, the
upper PIR sensor detects motion and the falling event may not be detected in
one minute. Besides, false alarms are caused by sitting on the floor for a while.
Some other example situations are illustrated in Figure 4.8 and 4.9. If a person
sitting in the room, the upper PIR sensor can detect motions of the head and
shoulders of the person. By this way, the system can know that the person is not
on the floor. As another example, if the person sleeps on his/her bed, the lower
PIR sensor does not detect any human motion and the system can decide there
is not a falling person. Additionally, if a person stands up healthy after a falling
event, the two-PIR-sensor based system can detect it and cancel the emergency
alarm.
A significant advantage of the two-PIR-sensor based system is that it is not
affected by the person or the environment. Besides, the sensor signals can be
analyzed as a process and different algorithms can be developed more easily.
Currently, the prominent disadvantage of two-PIR-sensor based system is that it
can not detect instant falling events which are ended up with a fainting.
62
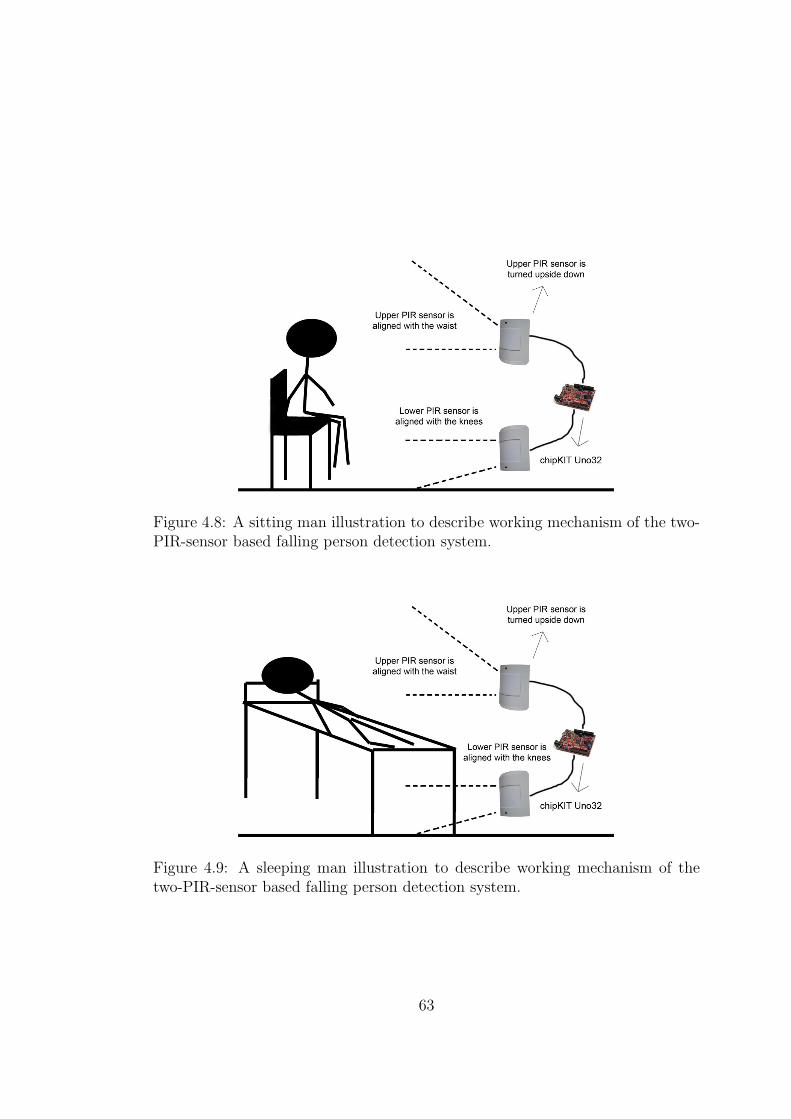
Figure 4.8: A sitting man illustration to describe working mechanism of the two-PIR-sensor based falling person detection system.
Figure 4.9: A sleeping man illustration to describe working mechanism of thetwo-PIR-sensor based falling person detection system.
63
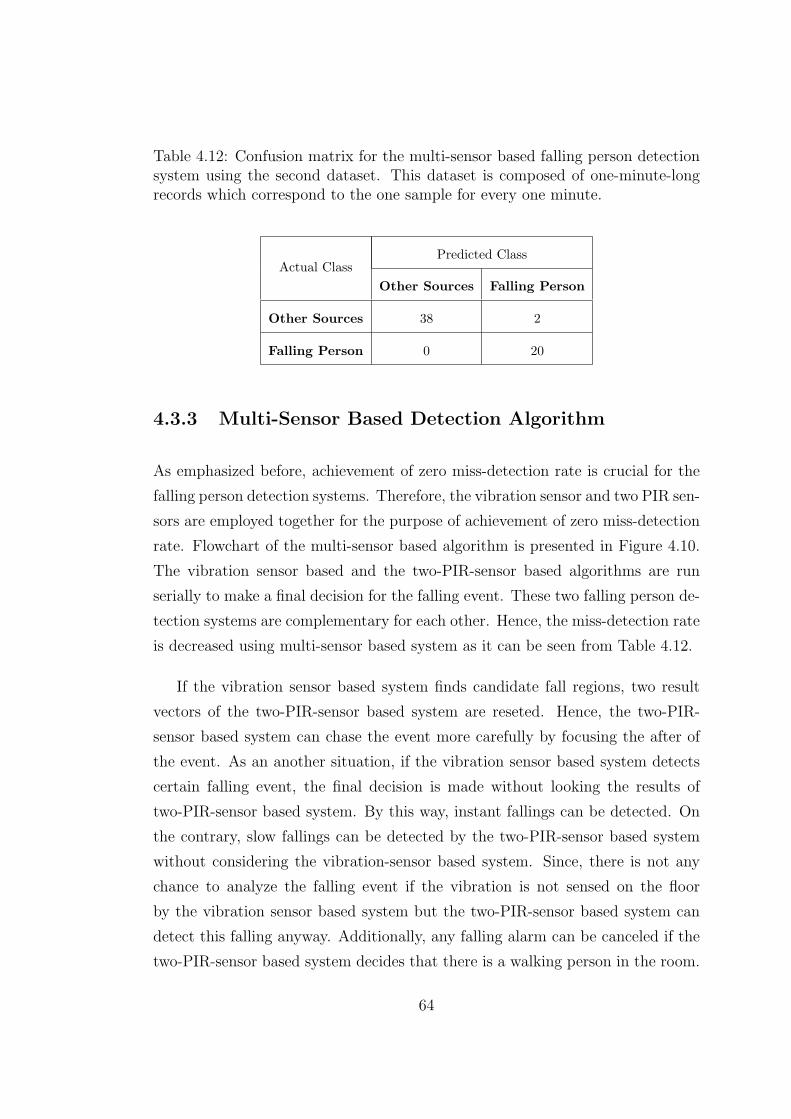
Table 4.12: Confusion matrix for the multi-sensor based falling person detectionsystem using the second dataset. This dataset is composed of one-minute-longrecords which correspond to the one sample for every one minute.
Actual ClassPredicted Class
Other Sources Falling Person
Other Sources 38 2
Falling Person 0 20
4.3.3 Multi-Sensor Based Detection Algorithm
As emphasized before, achievement of zero miss-detection rate is crucial for the
falling person detection systems. Therefore, the vibration sensor and two PIR sen-
sors are employed together for the purpose of achievement of zero miss-detection
rate. Flowchart of the multi-sensor based algorithm is presented in Figure 4.10.
The vibration sensor based and the two-PIR-sensor based algorithms are run
serially to make a final decision for the falling event. These two falling person de-
tection systems are complementary for each other. Hence, the miss-detection rate
is decreased using multi-sensor based system as it can be seen from Table 4.12.
If the vibration sensor based system finds candidate fall regions, two result
vectors of the two-PIR-sensor based system are reseted. Hence, the two-PIR-
sensor based system can chase the event more carefully by focusing the after of
the event. As an another situation, if the vibration sensor based system detects
certain falling event, the final decision is made without looking the results of
two-PIR-sensor based system. By this way, instant fallings can be detected. On
the contrary, slow fallings can be detected by the two-PIR-sensor based system
without considering the vibration-sensor based system. Since, there is not any
chance to analyze the falling event if the vibration is not sensed on the floor
by the vibration sensor based system but the two-PIR-sensor based system can
detect this falling anyway. Additionally, any falling alarm can be canceled if the
two-PIR-sensor based system decides that there is a walking person in the room.
64
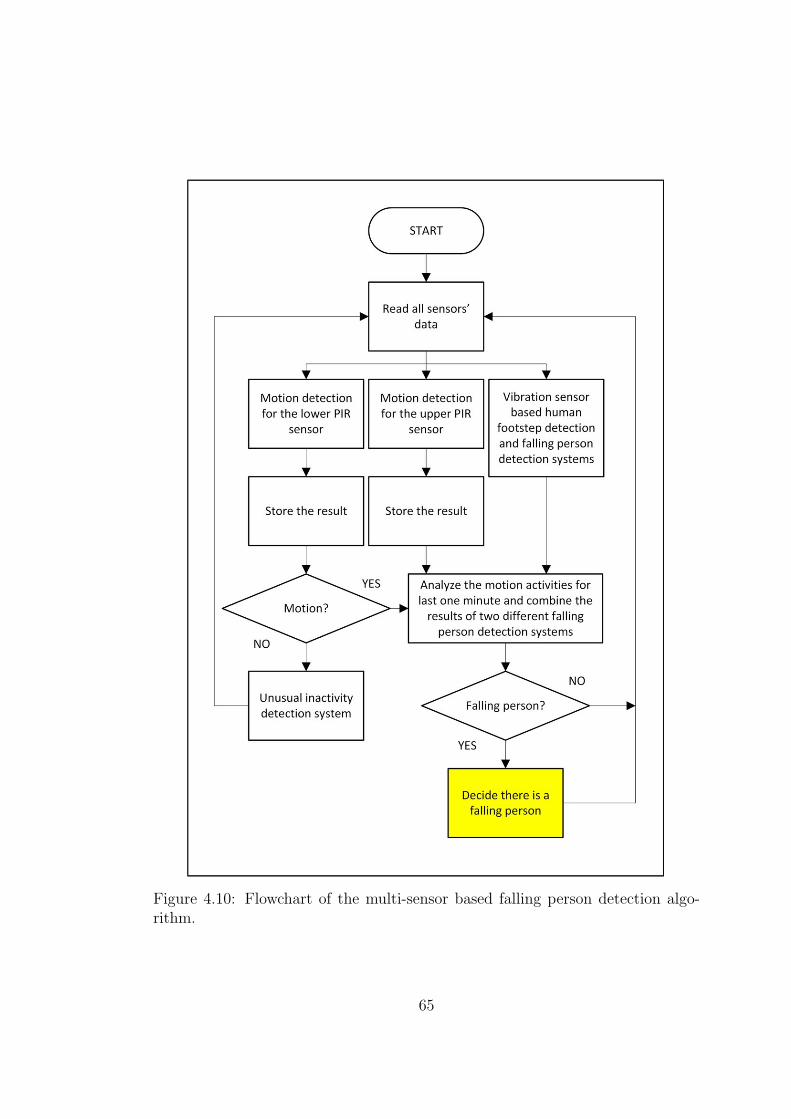
Figure 4.10: Flowchart of the multi-sensor based falling person detection algo-rithm.
65
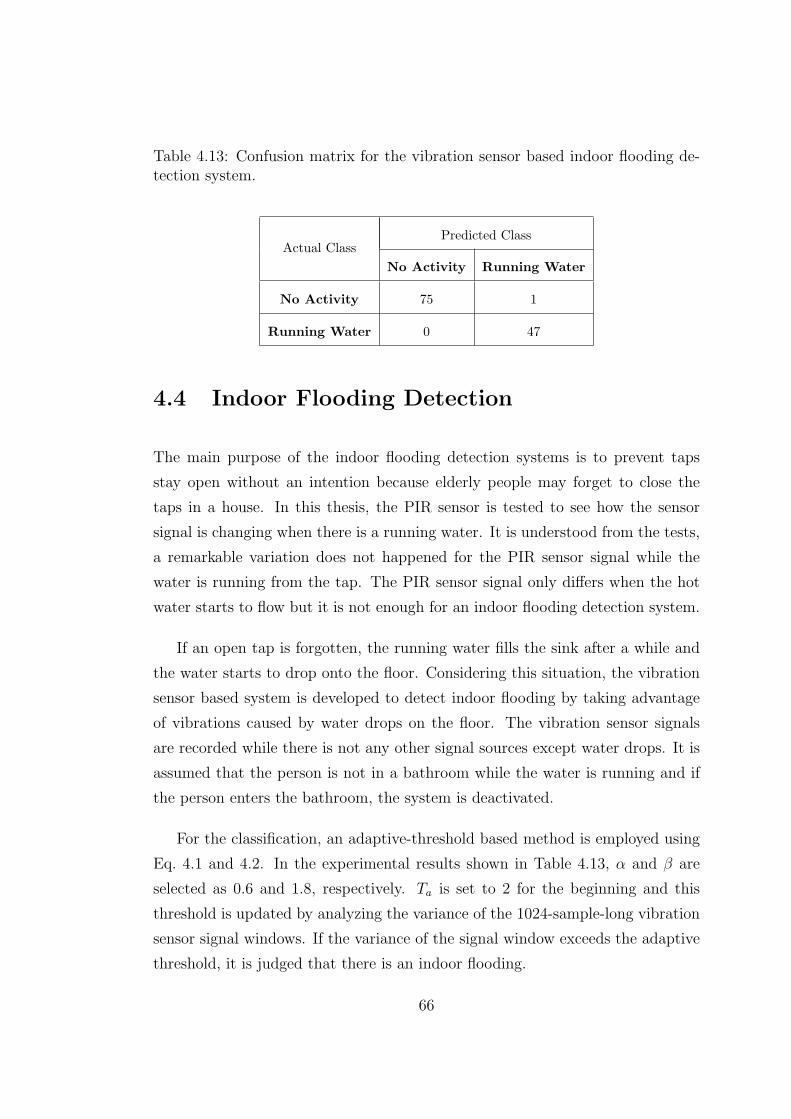
Table 4.13: Confusion matrix for the vibration sensor based indoor flooding de-tection system.
Actual ClassPredicted Class
No Activity Running Water
No Activity 75 1
Running Water 0 47
4.4 Indoor Flooding Detection
The main purpose of the indoor flooding detection systems is to prevent taps
stay open without an intention because elderly people may forget to close the
taps in a house. In this thesis, the PIR sensor is tested to see how the sensor
signal is changing when there is a running water. It is understood from the tests,
a remarkable variation does not happened for the PIR sensor signal while the
water is running from the tap. The PIR sensor signal only differs when the hot
water starts to flow but it is not enough for an indoor flooding detection system.
If an open tap is forgotten, the running water fills the sink after a while and
the water starts to drop onto the floor. Considering this situation, the vibration
sensor based system is developed to detect indoor flooding by taking advantage
of vibrations caused by water drops on the floor. The vibration sensor signals
are recorded while there is not any other signal sources except water drops. It is
assumed that the person is not in a bathroom while the water is running and if
the person enters the bathroom, the system is deactivated.
For the classification, an adaptive-threshold based method is employed using
Eq. 4.1 and 4.2. In the experimental results shown in Table 4.13, α and β are
selected as 0.6 and 1.8, respectively. Ta is set to 2 for the beginning and this
threshold is updated by analyzing the variance of the 1024-sample-long vibration
sensor signal windows. If the variance of the signal window exceeds the adaptive
threshold, it is judged that there is an indoor flooding.
66
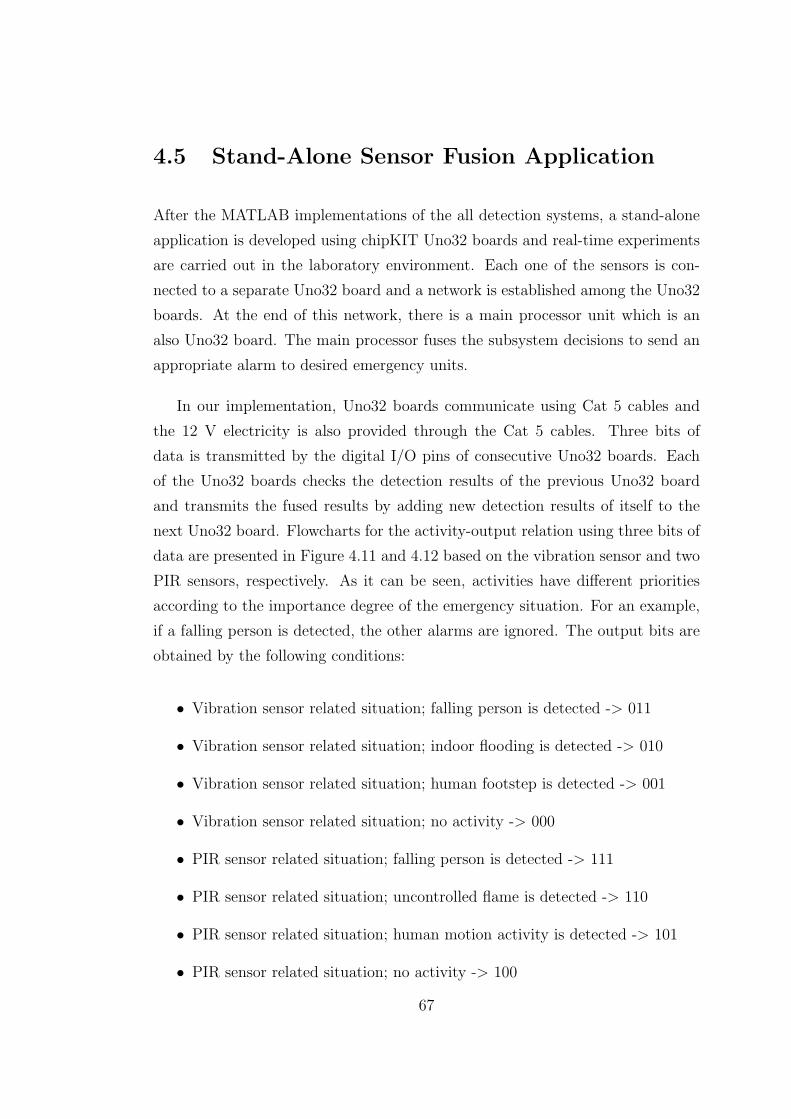
4.5 Stand-Alone Sensor Fusion Application
After the MATLAB implementations of the all detection systems, a stand-alone
application is developed using chipKIT Uno32 boards and real-time experiments
are carried out in the laboratory environment. Each one of the sensors is con-
nected to a separate Uno32 board and a network is established among the Uno32
boards. At the end of this network, there is a main processor unit which is an
also Uno32 board. The main processor fuses the subsystem decisions to send an
appropriate alarm to desired emergency units.
In our implementation, Uno32 boards communicate using Cat 5 cables and
the 12 V electricity is also provided through the Cat 5 cables. Three bits of
data is transmitted by the digital I/O pins of consecutive Uno32 boards. Each
of the Uno32 boards checks the detection results of the previous Uno32 board
and transmits the fused results by adding new detection results of itself to the
next Uno32 board. Flowcharts for the activity-output relation using three bits of
data are presented in Figure 4.11 and 4.12 based on the vibration sensor and two
PIR sensors, respectively. As it can be seen, activities have different priorities
according to the importance degree of the emergency situation. For an example,
if a falling person is detected, the other alarms are ignored. The output bits are
obtained by the following conditions:
• Vibration sensor related situation; falling person is detected -> 011
• Vibration sensor related situation; indoor flooding is detected -> 010
• Vibration sensor related situation; human footstep is detected -> 001
• Vibration sensor related situation; no activity -> 000
• PIR sensor related situation; falling person is detected -> 111
• PIR sensor related situation; uncontrolled flame is detected -> 110
• PIR sensor related situation; human motion activity is detected -> 101
• PIR sensor related situation; no activity -> 100
67
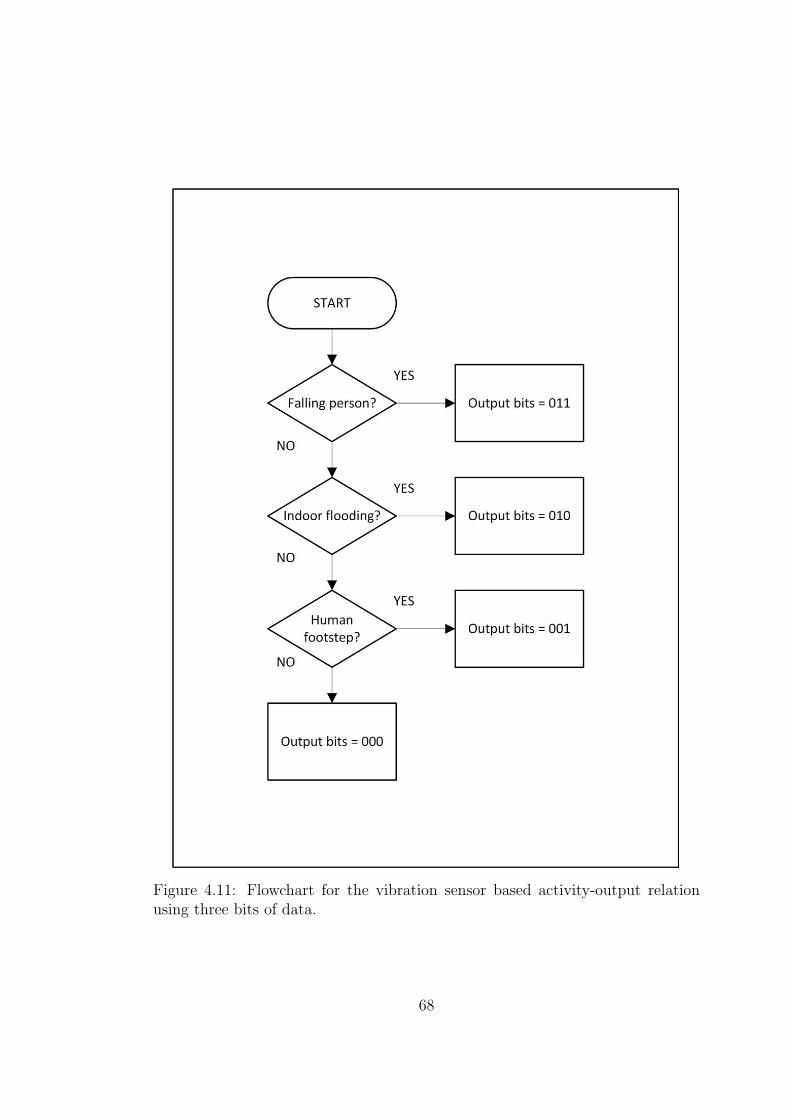
Figure 4.11: Flowchart for the vibration sensor based activity-output relationusing three bits of data.
68
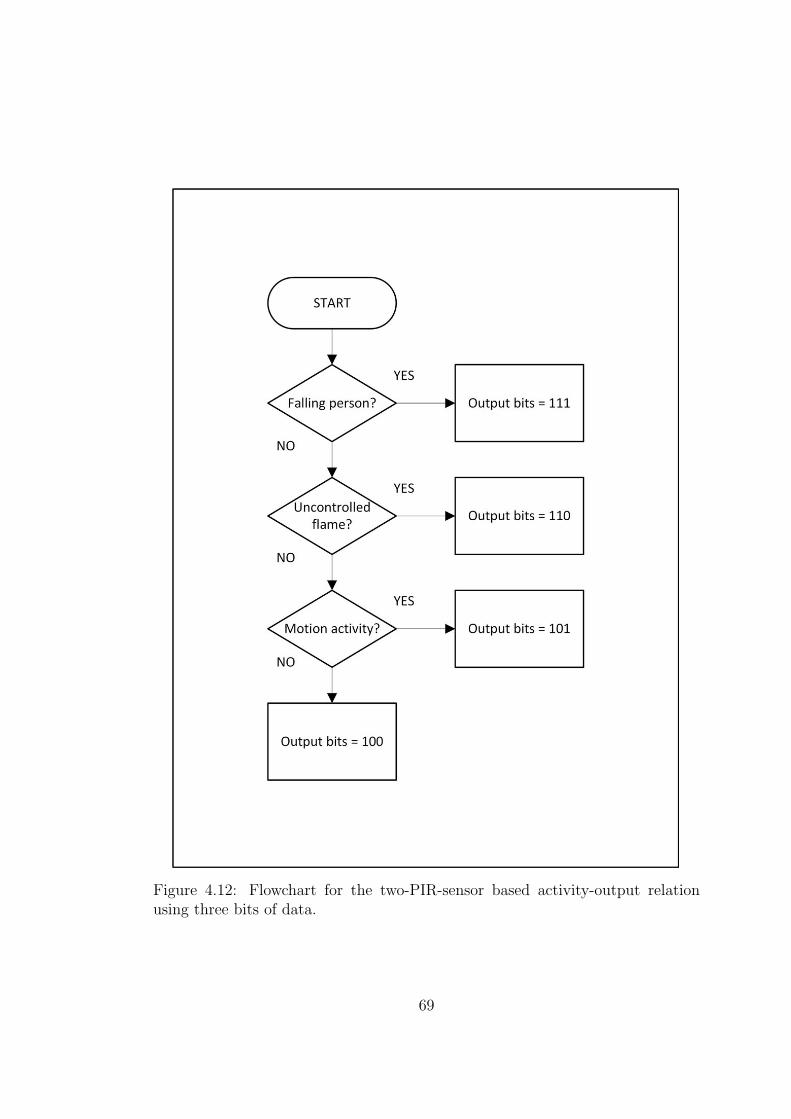
Figure 4.12: Flowchart for the two-PIR-sensor based activity-output relationusing three bits of data.
69
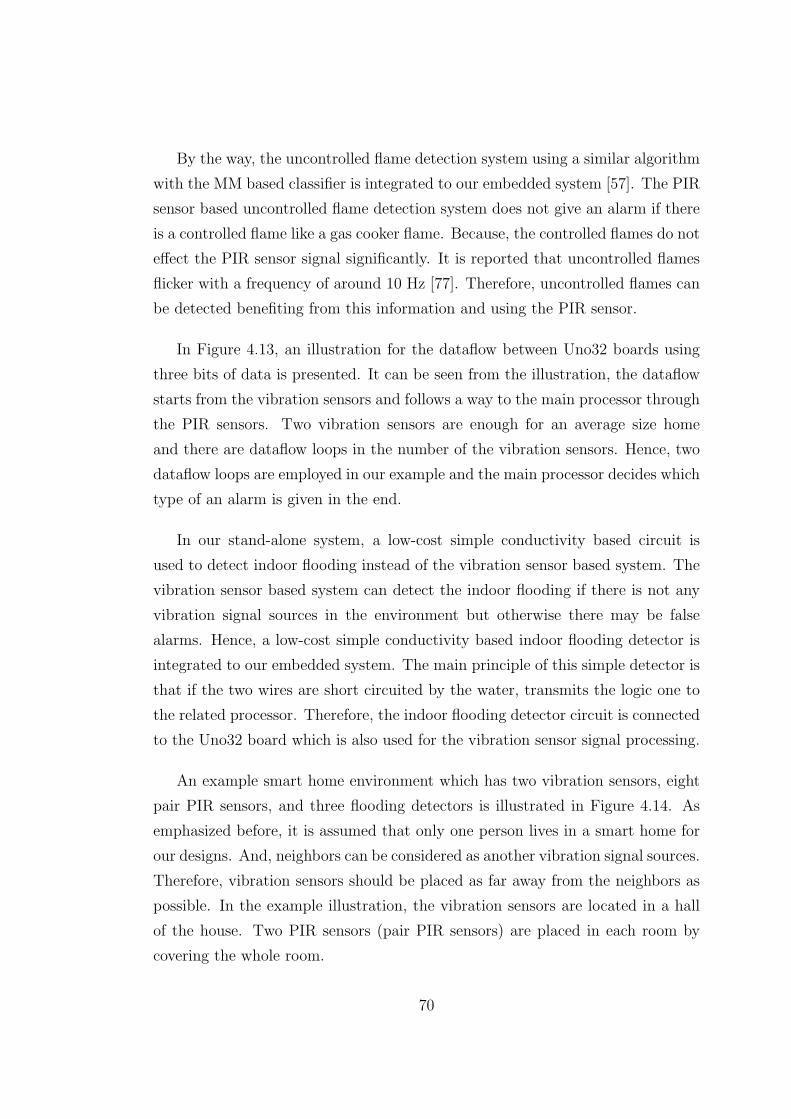
By the way, the uncontrolled flame detection system using a similar algorithm
with the MM based classifier is integrated to our embedded system [57]. The PIR
sensor based uncontrolled flame detection system does not give an alarm if there
is a controlled flame like a gas cooker flame. Because, the controlled flames do not
effect the PIR sensor signal significantly. It is reported that uncontrolled flames
flicker with a frequency of around 10 Hz [77]. Therefore, uncontrolled flames can
be detected benefiting from this information and using the PIR sensor.
In Figure 4.13, an illustration for the dataflow between Uno32 boards using
three bits of data is presented. It can be seen from the illustration, the dataflow
starts from the vibration sensors and follows a way to the main processor through
the PIR sensors. Two vibration sensors are enough for an average size home
and there are dataflow loops in the number of the vibration sensors. Hence, two
dataflow loops are employed in our example and the main processor decides which
type of an alarm is given in the end.
In our stand-alone system, a low-cost simple conductivity based circuit is
used to detect indoor flooding instead of the vibration sensor based system. The
vibration sensor based system can detect the indoor flooding if there is not any
vibration signal sources in the environment but otherwise there may be false
alarms. Hence, a low-cost simple conductivity based indoor flooding detector is
integrated to our embedded system. The main principle of this simple detector is
that if the two wires are short circuited by the water, transmits the logic one to
the related processor. Therefore, the indoor flooding detector circuit is connected
to the Uno32 board which is also used for the vibration sensor signal processing.
An example smart home environment which has two vibration sensors, eight
pair PIR sensors, and three flooding detectors is illustrated in Figure 4.14. As
emphasized before, it is assumed that only one person lives in a smart home for
our designs. And, neighbors can be considered as another vibration signal sources.
Therefore, vibration sensors should be placed as far away from the neighbors as
possible. In the example illustration, the vibration sensors are located in a hall
of the house. Two PIR sensors (pair PIR sensors) are placed in each room by
covering the whole room.
70
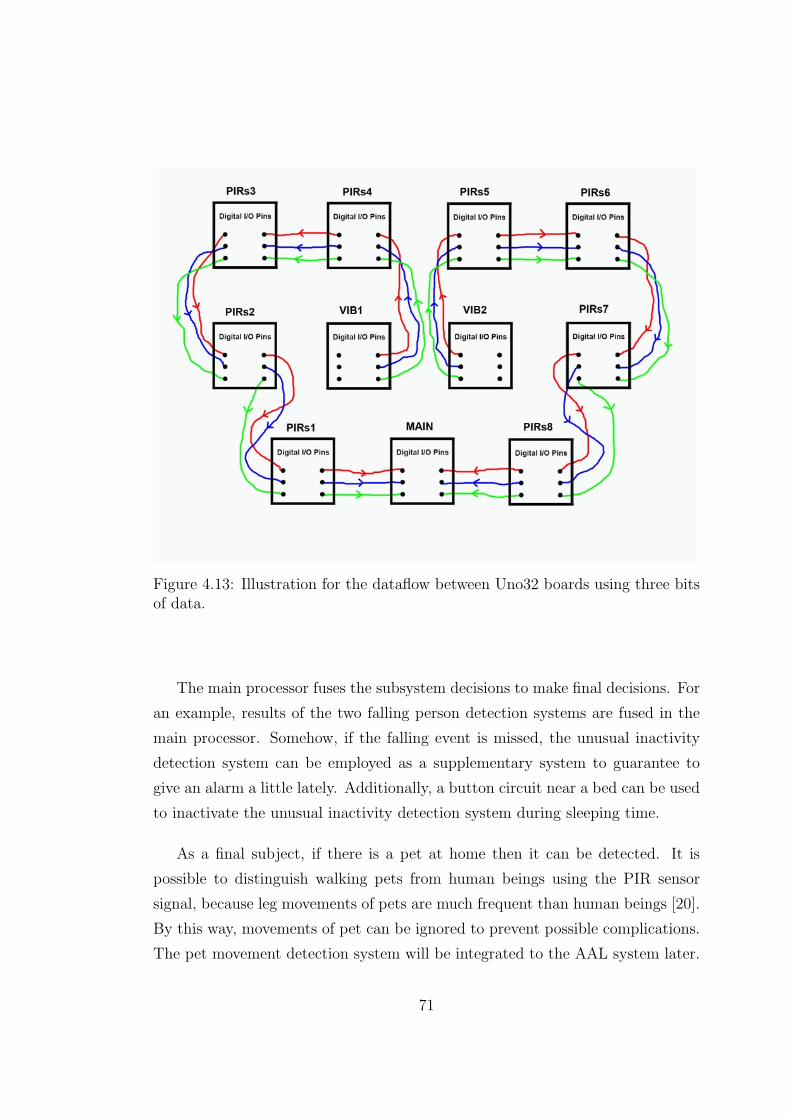
Figure 4.13: Illustration for the dataflow between Uno32 boards using three bitsof data.
The main processor fuses the subsystem decisions to make final decisions. For
an example, results of the two falling person detection systems are fused in the
main processor. Somehow, if the falling event is missed, the unusual inactivity
detection system can be employed as a supplementary system to guarantee to
give an alarm a little lately. Additionally, a button circuit near a bed can be used
to inactivate the unusual inactivity detection system during sleeping time.
As a final subject, if there is a pet at home then it can be detected. It is
possible to distinguish walking pets from human beings using the PIR sensor
signal, because leg movements of pets are much frequent than human beings [20].
By this way, movements of pet can be ignored to prevent possible complications.
The pet movement detection system will be integrated to the AAL system later.
71
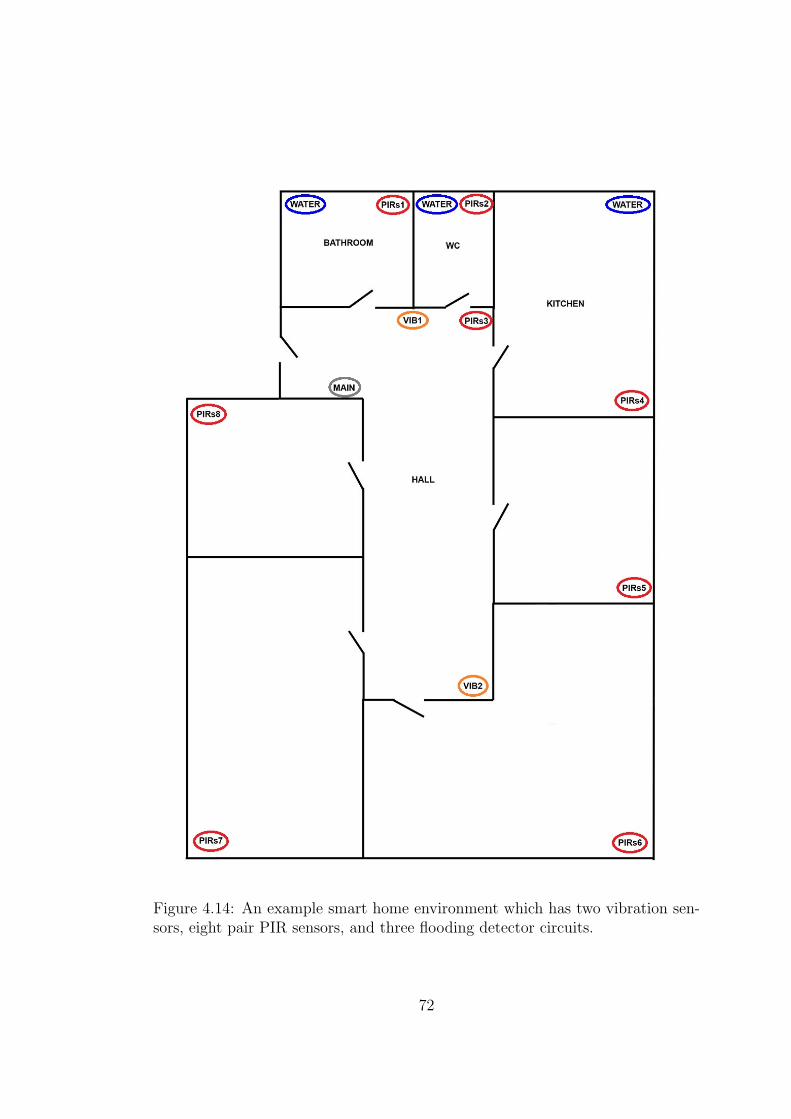
Figure 4.14: An example smart home environment which has two vibration sen-sors, eight pair PIR sensors, and three flooding detector circuits.
72
4.6 Summary
Our vibration sensor based falling person detection application may not be an
appropriate example to show the desirable properties of the DT-CWT and the
ST-CWT such as shift-invariance and lack of aliasing. Because, the energies of
the frequency sub-bands are used as feature parameters and the fine details of the
frequency content does not effect the overall sub-band energies. However, it is
experimentally observed that the ST-CWT method can be applied to vibration
sensor signal processing applications instead of the computationally expensive
DT-CWT.
An AAL system using the vibration and two PIR sensors is developed in a
stand-alone structure. The vibration sensor is employed for the falling person
detection, human footstep detection, and indoor flooding detection. Two PIR
sensors are employed for the falling person detection, human motion detection,
unusual inactivity detection, and uncontrolled flame detection. Pet movement
detection and gas leak detection systems will be integrated to our embedded
system in the future. The emergency alarms are transmitted to the emergency
units through the auto-dial alarm system which is connected to the stand-alone
system.
Some novel algorithms are developed for the detection systems and our theo-
retical studies are employed in these detection systems. Different feature extrac-
tion methods, different classifiers, and different algorithms can be tested for the
aforesaid detection systems. As an example, our simple two-PIR-sensor based
falling person detection algorithm can be improved in many ways and a better
system can be designed without making a big effort. Besides, different hardwares
also can be tested. For an another example, we used Uno32 boards however
cheaper PIC microcontrollers also can be employed for a similar stand-alone sys-
tem design. In additionally, our stand-alone system can be modernized using
wireless modules and rechargeable batteries in the future.
73
Chapter 5
Conclusion and Future Work
In this thesis, an AAL system application which employs vibration and PIR
sensors is presented. The goal is to design an AAL system for elderly and hand-
icapped people.
Various frequency analysis methods which consist of the DFT, MFCC, DWT
with different filter-banks, DT-CWT and ST-CWT are studied for vibration sen-
sor signal processing. Different datasets are formed using the sensors. Feature
extraction and classification methods for the human footstep detection, falling
person detection, and indoor flooding detection using the vibration sensor are
proposed. One PIR sensor is employed to detect human motion and unusual in-
activity detection, and two PIR sensors are employed in falling person detection.
The multi-sensor based falling person detection system is also designed using the
vibration and two PIR sensors. Some novel algorithms are introduced in these
detection algorithms. The PIR sensor based uncontrolled flame detection system
is integrated to the overall system. The prototype AAL system is constructed
using Uno32 boards instead of personal computers to reduce costs. A network is
setup for the communication of the Uno32 boards which are connected to differ-
ent sensors. The main processor gives final decisions, and emergency alarms are
transmitted to a call center or to another telephone number using the auto-dial
alarm system.
74
As a future work, there may be several studies that include hardware related,
theoretical, and application related studies. For the hardware related studies, dif-
ferent vibration sensors can be tested to see which one is more appropriate to use
in a house. Besides, the existing hard-wired networking system can be converted
to a wireless one using ZigBee modules. Additionally, rechargeable batteries can
be placed alongside the Uno32 boards and different processor units also can be
selected instead of the Uno32 boards. Power consumption may be calculated and
energy-efficient systems can be designed for the overall AAL system.
The ST-CWT filter coefficients are computed considering the perfect recon-
struction conditions. However, perfect reconstruction examples are not examined
for the ST-CWT and perfect reconstruction based comparison is not included
in this thesis. Therefore, reconstruction experiments can be conducted to test
the lack of aliasing property for the wavelet-based signal analysis methods in the
future.
For the future applications, a larger dataset is essential. This dataset should
include various records which contain different human activities from many people
and houses. It will be also desirable to have data from handicapped people
using wheelchairs and canes. Additionally, analyzing motion activities of sleeping
people is an important study to handle possible problems.
Different adaptive systems for the vibration sensor signal is an another sub-
ject to study. More sensitive human footstep detection systems can be developed.
Various feature extraction and classification methods can be applied and com-
pared to each other in all subsystems. Optimization of the signal windows’ lengths
for the detection systems can be a useful study. Developing different algorithms
can be a solution for the false alarm sources. Lastly, previous studies about pet
movement detection and gas leak detection subsystems will be integrated to the
overall AAL system in the future.
75
Bibliography
[1] J. M. Hausdorff, D. A. Rios, and H. K. Edelberg, “Gait variability and fall
risk in community-living older adults: A 1-year prospective study,” Archives
of Physical Medicine and Rehabilitation, vol. 82, pp. 1050–1056, Aug. 2001.
[2] V. Ricquebourg, D. Menga, D. Durand, B. Marhic, L. Delahoche, and
C. Loge, “The smart home concept: Our immediate future,” in IEEE 1st
International Conference on E-Learning in Industrial Electronics, pp. 23–
28, Dec. 2006.
[3] Q. C. Nguyen, D. Shin, D. Shin, and J. Kim, “Real-time human tracker based
on location and motion recognition of user for smart home,” in IEEE 3rd
International Conference on Multimedia and Ubiquitous Engineering (MUE-
2009), pp. 243–250, Jun. 2009.
[4] B. U. Toreyin, Y. Dedeoglu, and A. E. Cetin, “HMM based falling person de-
tection using both audio and video,” Computer Vision in Human-Computer
Interaction, Lecture Notes in Computer Science, vol. 3766, pp. 211–220, Oct.
2005.
[5] A. Ben Hadj Mohamed, T. Val, L. Andrieux, and A. Kachouri, “Using a
Kinect WSN for home monitoring: Principle, network and application eval-
uation,” in IEEE International Conference on Wireless Communications in
Unusual and Confined Areas (ICWCUCA-2012), pp. 1–5, Aug. 2012.
[6] G. Mastorakis and D. Makris, “Fall detection system using Kinect’s infrared
sensor,” Journal of Real-Time Image Processing, pp. 1–12, Mar. 2012.
76
[7] K. Altun, B. Barshan, and O. Tuncel, “Comparative study on classifying hu-
man activities with miniature inertial and magnetic sensors,” Pattern Recog-
nition, vol. 43, pp. 3605–3620, Oct. 2010.
[8] A. Yurtman and B. Barshan, “Investigation of personal variations in activity
recognition using miniature inertial sensors and magnetometers,” in IEEE
20th Signal Processing and Communications Applications Conference (SIU-
2012), pp. 1–4, Apr. 2012.
[9] M. N. Nyan, F. E. H. Tay, and E. Murugasu, “A wearable system for pre-
impact fall detection,” Journal of Biomechanics, vol. 41, pp. 3475–3481, Dec.
2008.
[10] G. R. Yavuz, H. Yalcin, L. Akarun, and C. Ersoy, “Wavelet transform based
fall detection,” in IEEE 19th Signal Processing and Communications Appli-
cations (SIU-2011), pp. 142–145, Apr. 2011.
[11] K. N. Ha, K. C. Lee, and S. Lee, “Development of pir sensor based indoor
location detection system for smart home,” in IEEE International Joint Con-
ference (SICE-ICASE-2006), pp. 2162–2167, Oct. 2006.
[12] M. Usman, V. Muthukkumarasamy, X.-W. Wu, and S. Khanum, “Wireless
smart home sensor networks: Mobile agent based anomaly detection,” in
Ubiquitous Intelligence Computing and IEEE 9th International Conference
on Autonomic and Trusted Computing (UIC/ATC-2012), pp. 322–329, Sept.
2012.
[13] H. Zheng, H. Wang, and N. Black, “Human activity detection in smart home
environment with self-adaptive neural networks,” in IEEE International
Conference on Networking, Sensing and Control (ICNSC-2008), pp. 1505–
1510, Apr. 2008.
[14] C. Zhang, M. Zhang, Y. Su, and W. Wang, “Smart home design based on
ZigBee wireless sensor network,” in IEEE 7th International ICST Conference
on Communications and Networking in China (CHINACOM-2012), pp. 463–
466, Aug. 2012.
77
[15] M. Mubashir, L. Shao, and L. Seed, “A survey on fall detection: Principles
and approaches,” Neurocomputing, Behaviours in Video, vol. 100, pp. 144–
152, Jan. 2013.
[16] F. Marquis-Faulkes, S. J. McKenna, P. Gregor, and A. F. Newell, “Scenario-
based drama as a tool for investigating user requirements with application
to home monitoring for elderly people,” in 10th International Conference on
Human-Computer Interaction (HCI-2003), pp. 512–516, Jun. 2003.
[17] H. Nait-Charif and S. J. McKenna, “Activity summarisation and fall detec-
tion in a supportive home environment,” in IEEE 17th International Con-
ference on Pattern Recognition (ICPR-2004), vol. 4, pp. 323–326, Aug. 2004.
[18] S. Brownsell, D. Bradley, F. Cardinaux, and M. Hawley, “Developing a sys-
tems and informatics based approach to lifestyle monitoring within eHealth:
Part i - technology and data management,” in IEEE 1st International Con-
ference on Healthcare Informatics, Imaging and Systems Biology (HISB-
2011), pp. 264–271, Jul. 2011.
[19] J. Dai, X. Bai, Z. Yang, Z. Shen, and D. Xuan, “Mobile phone-based perva-
sive fall detection,” Personal and Ubiquitous Computing, vol. 14, pp. 633–
643, Oct. 2010.
[20] B. U. Toreyin, E. B. Soyer, I. Onaran, and A. E. Cetin, “Falling person
detection using multi-sensor signal processing,” EURASIP Journal Advances
in Signal Processing, vol. 2008, pp. 1–7, Jan. 2008.
[21] M. Alwan, P. J. Rajendran, S. Kell, D. Mack, S. Dalal, M. Wolfe, and
R. Felder, “A smart and passive floor-vibration based fall detector for el-
derly,” in IEEE 2nd International Conference on Information and Commu-
nication Technologies: From Theory to Applications (ICTTA-2006), vol. 1,
pp. 1003–1007, Apr. 2006.
[22] X. Luo, T. Liu, J. Liu, X. Guo, and G. Wang, “Design and implementation
of a distributed fall detection system based on wireless sensor networks,”
EURASIP Journal on Wireless Communications and Networking, Mar. 2012.
78
[23] T. Liu, X. Guo, and G. Wang, “Elderly-falling detection using distributed
direction-sensitive pyroelectric infrared sensor arrays,” Multidimensional
Systems and Signal Processing, vol. 23, pp. 451–467, Dec. 2012.
[24] I. Bouchrika, J. Carter, M. Nixon, R. Morzinger, and G. Thallinger, “Using
gait features for improving walking people detection,” in IEEE 20th Inter-
national Conference on Pattern Recognition (ICPR-2010), pp. 3097–3100,
Aug. 2010.
[25] H.-F. Xing, F. Li, and Y.-L. Liu, “Wavelet denoising and feature extraction of
seismic signal for footstep detection,” in IEEE International Conference on
Wavelet Analysis and Pattern Recognition (ICWAPR-2007), vol. 1, pp. 218–
223, Nov. 2007.
[26] V. V. Reddy, V. Divya, A. W. H. Khong, and B. P. Ng, “Footstep detec-
tion and denoising using a single triaxial geophone,” in IEEE Asia Pacific
Conference on Circuits and Systems (APCCAS-2010), pp. 1171–1174, Dec.
2010.
[27] A. Pakhomov and T. Goldburt, “New seismic sensors for footstep detection
and other military applications,” Sensors, and Command, Control, Commu-
nications, and Intelligence (C3I) Technologies for Homeland Security and
Homeland Defense III, vol. 5403, pp. 463–468, 2004.
[28] M. Mathie, A. Coster, N. Lovell, and B. Celler, “Detection of daily physical
activities using a triaxial accelerometer,” Medical and Biological Engineering
and Computing, vol. 41, no. 3, pp. 296–301, 2003.
[29] S. Bouchafa, D. Aubert, and S. Bouzar, “Crowd motion estimation and
motionless detection in subway corridors by image processing,” in IEEE
Conference on Intelligent Transportation System (ITSC-1997), pp. 332–337,
Nov. 1997.
[30] S. Zhang, P. McCullagh, C. Nugent, and H. Zheng, “A theoretic algorithm
for fall and motionless detection,” in IEEE 3rd International Conference on
Pervasive Computing Technologies for Healthcare, (PervasiveHealth-2009),
pp. 1–6, Apr. 2009.
79
[31] B. Taati, J. Snoek, D. Giesbrecht, and A. Mihailidis, “Water flow detection
in a handwashing task,” in IEEE Canadian Conference on Computer and
Robot Vision (CRV-2010), pp. 175–182, Jun. 2010.
[32] W. Sweldens, “The lifting scheme: A new philosophy in biorthogonal wavelet
constructions,” in Wavelet Applications in Signal and Image Processing III,
pp. 68–79, Sept. 1995.
[33] M. F. Keskin, “Image processing methods for computer-aided interpretation
of microscopic images,” Master’s thesis, Bilkent University, 2012.
[34] A. Abbas and T. D. Tran, “Rational coefficient dual-tree complex wavelet
transform: Design and implementation,” IEEE Transactions on Signal Pro-
cessing, vol. 56, pp. 3523–3534, Aug. 2008.
[35] A. Eleyan, H. Ozkaramanli, and H. Demirel, “Complex wavelet transform-
based face recognition,” EURASIP Journal on Advances in Signal Process-
ing, vol. 2008, pp. 1–13, Jan. 2008.
[36] D. Mellis, M. Banzi, D. Cuartielles, and T. Igoe, “Arduino: An open electron-
ics prototyping platform,” in 25th Conference on Human Factors in Com-
puting (CHI-2007), 2007.
[37] Digilent Inc., “chipKIT Uno32 board reference manual,” Datasheet 502–209,
Digilent Inc., Revision: October 26, 2012.
[38] E. Clements, “Good vibrations at Fermilab,” The Newsletter of the Linear
Collider Community, August 9, 2007.
[39] ION Geophysical Corporation, “Geophones,” Datasheet 1–12, ION Geophys-
ical Corporation, 2006.
[40] K. M. Houston and D. P. McGaffigan, “Spectrum analysis techniques for
personnel detection using seismic sensors,” Unattended Ground Sensor Tech-
nologies and Applications V, vol. 5090, pp. 162–173, 2003.
[41] E. R. Ranger, “Demonstration system for a low-power seismic detector and
classifier,” Master’s thesis, Massachusetts Institute of Technology, 2003.
80
[42] A. Sundaresan, A. Subramanian, P. K. Varshney, and T. Damarla, “A
copula-based semi-parametric approach for footstep detection using seismic
sensor networks,” Multisensor, Multisource Information Fusion: Architec-
tures, Algorithms, and Applications, vol. 7710, pp. 1–12, 2010.
[43] R. Haff and T. Pearson, “Separating in-shell pistachio nuts from kernels using
impact vibration analysis,” Sensing and Instrumentation for Food Quality
and Safety, vol. 1, pp. 188–192, Aug. 2007.
[44] R. Bajwa, R. Rajagopal, P. Varaiya, and R. Kavaler, “In-pavement wireless
sensor network for vehicle classification,” in IEEE 10th International Confer-
ence on Information Processing in Sensor Networks (IPSN-2011), pp. 85–96,
Apr. 2011.
[45] D. Anderson, “Optical fiber sensors for perimeter and IT protection,” Ap-
plication Notes FSI TP 02, Fiber SenSys, 2012.
[46] Glolab Corporation, “How infrared motion detector components work,” Ap-
plication Notes, Glolab Corporation, NY, USA, 2013.
[47] T. M. Hussain, A. M. Baig, T. N. Saadawi, and S. A. Ahmed, “Infrared
pyroelectric sensor for detection of vehicular traffic using digital signal pro-
cessing techniques,” IEEE Transactions on Vehicular Technology, vol. 44,
no. 3, pp. 683–689, 1995.
[48] C.-H. Tsai, Y.-W. Bai, C.-A. Chu, C.-Y. Chung, and M.-B. Lin, “Pir-sensor-
based lighting device with ultra-low standby power consumption,” IEEE
Transactions on Consumer Electronics, vol. 57, no. 3, pp. 1157–1164, 2011.
[49] L.-W. Hung, H.-H. Lai, C.-L. Chuang, and C.-L. Lu, “An intelligent light-
ing system for exhibition applications,” in IEEE International Conference
on Consumer Electronics, Communications and Networks (CECNet-2011),
pp. 4748–4750, Apr. 2011.
[50] Y.-W. Bai and Y.-T. Ku, “Automatic room light intensity detection and
control using a microprocessor and light sensors,” IEEE Transactions on
Consumer Electronics, vol. 54, pp. 1173–1176, Aug. 2008.
81
[51] M. Moghavvemi and L. C. Seng, “Pyroelectric infrared sensor for intruder
detection,” in IEEE Region 10 Conference (TENCON-2004), vol. 4, pp. 656–
659, Nov. 2004.
[52] The SmartDetect WSN Team, “SmartDetect: An efficient WSN implemen-
tation for intrusion detection,” in IEEE 2nd International Conference on
Communication Systems and Networks (COMSNETS-2010), Jan. 2010.
[53] G. Feng, M. Liu, X. Guo, J. Zhang, and G. Wang, “Genetic algorithm based
optimal placement of PIR sensor arrays for human localization,” in IEEE
International Conference on Mechatronics and Automation (ICMA-2011),
pp. 1080–1084, Aug. 2011.
[54] Q. Hao, F. Hu, and J. Lu, “Distributed multiple human tracking with wire-
less binary pyroelectric infrared (PIR) sensor networks,” in IEEE Sensors,
pp. 946–950, Nov. 2010.
[55] F. Wahl, M. Milenkovic, and O. Amft, “A distributed pir-based approach for
estimating people count in office environments,” in IEEE/IFIP 10th Inter-
national Conference on Embedded and Ubiquitous Computing (EUC-2012),
pp. 640–647, Dec. 2012.
[56] T. Yokoishi, J. Mitsugi, O. Nakamura, and J. Murai, “Room occupancy
determination with particle filtering of networked pyroelectric infrared (PIR)
sensor data,” in IEEE Sensors, pp. 1–4, Oct. 2012.
[57] F. Erden, B. U. Toreyin, E. B. Soyer, I. Inac, O. Gunay, K. Kose, and A. E.
Cetin, “Wavelet based flame detection using differential PIR sensors,” in
IEEE 20th Signal Processing and Communications Applications Conference
(SIU-2012), pp. 1–4, Apr. 2012.
[58] F. Erden, E. B. Soyer, B. U. Toreyin, and A. E. Cetin, “VOC gas leak detec-
tion using pyro-electric infrared sensors,” in IEEE International Conference
on Acoustics Speech and Signal Processing (ICASSP-2010), pp. 1682–1685,
Mar. 2010.
82
[59] F. R. M. Rashidi, M. H. Ariff, and M. Z. Ibrahim, “Car monitoring using
bluetooth security system,” in IEEE International Conference on Electrical,
Control and Computer Engineering (INECCE-2011), pp. 424–428, Jun. 2011.
[60] Holtek Semiconductor Inc., “HT9200A/HT9200B DTMF generators,”
Datasheet Rev. 1.41, Holtek Semiconductor Inc., 2009.
[61] I. W. Selesnick, R. G. Baraniuk, and N. C. Kingsbury, “The dual-tree com-
plex wavelet transform,” IEEE Signal Processing Magazine, vol. 22, pp. 123–
151, Nov. 2005.
[62] F. Jabloun, A. E. Cetin, and E. Erzin, “Teager energy based feature param-
eters for speech recognition in car noise,” IEEE Signal Processing Letters,
vol. 6, pp. 259–261, Oct. 1999.
[63] S. Cakir and A. E. Cetin, “Mel-cepstral feature extraction methods for image
representation,” Optical Engineering, vol. 49, Sept. 2010.
[64] O. Yorulmaz, T. C. Pearson, and A. E. Cetin, “Detection of fungal dam-
aged popcorn using image property covariance features,” Computers and
Electronics in Agriculture, vol. 84, pp. 47–52, Jun. 2012.
[65] N. Kingsbury, “The dual-tree complex wavelet transform: A new technique
for shift invariance and directional filters,” in 8th IEEE DSP Workshop,
pp. 319–322, Aug. 1998.
[66] I. W. Selesnick, “Hilbert transform pairs of wavelet bases,” IEEE Signal
Processing Letters, vol. 8, pp. 170–173, Jun. 2001.
[67] N. Kingsbury, “A dual-tree complex wavelet transform with improved or-
thogonality and symmetry properties,” in International Conference on Im-
age Processing, vol. 2, pp. 375–378, Sept. 2000.
[68] N. Kingsbury, “Image processing with complex wavelets,” Philosophical
Transactions of the Royal Society of London, vol. 357, pp. 2543–2560, Sept.
1999.
83
[69] A. Yazar, F. Keskin, B. U. Toreyin, and A. E. Cetin, “Fall detection using
single-tree complex wavelet transform,” Pattern Recognition Letters, 2012.
Available online 28 December 2012.
[70] F. Keskin and A. E. Cetin, “Time-varying lifting structures for single-tree
complex wavelet transform,” in IEEE 20th Signal Processing and Commu-
nications Applications Conference (SIU-2012), Apr. 2012.
[71] F. Keskin, A. Suhre, and A. E. Cetin, “Single-tree complex wavelet trans-
form via time-varying lifting structures.” submitted to 20th European Signal
Processing Conference (EUSIPCO-2012), 2012.
[72] J. K. Romberg, H. Choi, R. G. Baraniuk, and N. Kingsbury, “A hidden
Markov tree model for the complex wavelet transform,” in IEEE Transac-
tions on Signal Processing, pp. 133–136, 2001.
[73] E. B. Soyer, “Pyroelectric infrared (PIR) sensor based event detection,” Mas-
ter’s thesis, Bilkent University, 2009.
[74] A. Yazar, B. U. Toreyin, and A. E. Cetin, “Human activity classification
using vibration and PIR sensors,” in IEEE 20th Signal Processing and Com-
munications Applications Conference (SIU-2012), pp. 1–4, Apr. 2012.
[75] A. Yazar and A. E. Cetin, “Ambient assisted smart home design using vibra-
tion and PIR sensors,” in IEEE 21st Signal Processing and Communications
Applications Conference (SIU-2013), pp. 1–4, Apr. 2013.
[76] C.-C. Chang and C.-J. Lin, “LIBSVM: A library for support vector ma-
chines,” ACM Transactions on Intelligent Systems and Technology, vol. 2,
no. 27, pp. 1–27, 2011.
[77] Fastcom Technology SA, “Method and device for detecting fires based on
image analysis,” Application Notes No. WO02/069292, PCT Publication,
2002.
84