Embed Size (px)
Citation preview
11th World Congress on Computational Mechanics (WCCM XI)5th European Conference on Computational Mechanics (ECCM V)
6th European Conference on Computational Fluid Dynamics (ECFD VI)E. Onate, J. Oliver and A. Huerta (Eds)
MULTI-SCALE CRACK PROPAGATION ANALYSISFOR STRENGH ASSESSMENT
OF POLYCRSTALINE MATERIALS
Y. Shintaku1, K. Terada2, J. Kato2, T. Kyoya1, S. Takase2 and S. Tsutsumi3
1 Department of Civil and Environmental EngineeringTohoku University
6-6 Aoba, Aramaki, Sendai 980-8579, JAPANe-mail: [email protected]
2 International Research Institute of Disaster ScienceTohoku University
6-6 Aoba, Aramaki, Sendai 980-8579, JAPAN
Jointing and Welding Research InstituteOsaka University
11-1 Mihogaoka, Ibaraki, Osaka 567-0047, JAPAN
Key words: Multi-scale analysis, Crack propagation, Crystal plasticity, Fatigue fracture,Chemical attack
Abstract. The objective of this study is to develop a method of multi-scale crack prop-agation analysis to assess the residual strength of the structure subjected to chemical at-tack. The macro-scale crack growth rate is determined by both the micro-scale crackingwith plastic deformations and the change of the hydrogen concentrations. The micro-scale crack propagation is simulated by the crystal plasticity model and the cohesive zonemodel induced by the change of the surface energy to account for the hydrogen effect. Apolycrystalline aggregate is regarded as a representative volume element (RVE) for micro-scale analyses and the macroscopic strength is estimated from this result. The macro-scalecrack growth simulation is conducted using the cohesive zone model with the parameterthe strength reflected the micro-scale analysis and the damage evolved by the fatigue.The proposed method enables us to simulate the crack propagation with the evaluationof fatigue and the effect of hydrogen.
1 INTRODUCTION
Cohesive zone model is widely utilized for the crack propagation analysis. The dif-ference from the linear fracture mechanics is that the cohesive zone model modifies the
1

Y. Shintaku, K. Terada, J. Kato, T. Kyoya, S. Takase and S. Tsutsumi
singular stress at crack tip to the more realistic nonlinear condition of material response.In this regard, Elliots [1] propose the original idea by the development of the Griffith the-ory [2] and introduces an attractive force per unit area between atomics. Barenblatt [4]presents more specific model to account for finite strength and then Dugdale [3] investi-gates the size of plastic size using a similar model, so-called strip-yield model. Needleman[5] introduces the cohesive element technique in the finite element framework for frac-ture study. Now the cohesive zone model becomes a popular tool for simulating fractureprocesses in materials and structures due to the computational convenience.
In a polycrystalline aggregate, micro crack propagation is simulated by the microscopiccohesive zone model. One of them is based on an atomic potential and provides the rela-tionship between binding energies and separation of materials. Rice and Wang [6] employuniversal binding energy proposed by Rose et al. [7] to derive their model. They introducethe surface energy in the frame work of Griffith theory and discuss the change of the in-tergranular fracture by the chemical effect. Rimoli and Ortiz [8] simulate the propagationof the intergranular hydrogen-assisted crack using the similar cohesive zone model andthe grain boundary diffusion of the hydrogen. Recently, the parameter of cohesive zonemodel is investigated actively using modular dynamics [9] and discrete dislocation model-ing [10]. On the other hand, numerous cohesive zone models are proposed in macro-scaleand various fracture process in various materials are simulated using them. For example,Hillerborg et al. [11] simulate quasi-brittle fracture in concrete using a linear softeningmodel. Jin et al. [12] propose a phenomenological traction-based cohesive zone model formetal-ceramic functionally graded materials. Fatigue fracture is studied by the introduc-tion of the damage model into cohesive zone model. Nugyen and Reppeto [13] proposethis kind of cohesive zone model and compare with the experimental data inside the Parisregime. The fracture process outside this regime is simulated, such as short cracks andoverloading. Bouvard and Chaboche et al. [14] develope the cohesive zone coupled withcreep fracture.
The present work provides multi-scale crack propagation analysis by the estimation ofmacroscopic fracture parameters from the micro-scale analysis. A polycrystalline aggre-gate is regarded as a representative volume element (RVE) for micro-scale analyses. Weutilize the cohesive zone model based on the atomic potential and introduce impurity-dependency according to the Griffith theory. The parameter of macroscopic one is inves-tigated from the microscopic analysis. Moreover, the damage variable is added to thismacroscopic cohesive zone model and the fatigue crack probation is simulated with theparameter.
2 CRYSTAL PLASTICITY MODEL
In this section, crystal plasticity model, which is utilized as the microscopic materialresponse, is explained.
2

Y. Shintaku, K. Terada, J. Kato, T. Kyoya, S. Takase and S. Tsutsumi
2.1 Multiplicative decomposition of deformation gradient: Elasticity andplasticity deformation
The total deformation gradient is assumed to be decomposed into the two parts asshown in eq. (1). One is the elastic deformation due to distortion of crystal lattices, andthe other is plastic deformation due to crystallographic slip,
F = F eF p, (1)
where F e is the elastic deformation gradient and F p is the plastic deformation gradient,respectively. The velocity gradient is expressed as the additive decomposition as follows:
l := F F−1 = le + lp, (2)
where the velocity gradients due to elastic deformation le and crystallographic slip and lp
have respectively been defined as{le := F eF e−1
lp := F eF pF p−1F e−1.(3)
Further, denoting the symmetric and antisymmetric components of the second-order ten-sor • respectively by sym[•] and skw[•], we decompose the rate-of-deformation tensor dand the spin tensor w additively into the corresponding elastic and plastic componentsas follows:
d := sym[l] = de + dp := sym[le] + sym[lp], (4)
w := skw[l] = we +wp := skw[le] + skw[lp]. (5)
2.2 Flow rule for crystallographic slip
Let s(α)0 be the unit vector that defines the slip direction and m
(α)0 be the unit vector
that defines the normal direction of the slip surfaces at the initial or reference configurationof a certain slip system α. On the assumption that the crystal lattice is not distorted bythe slip-deformations, the vectors of slip and normal directions, which are assumed to bemutually-perpendicular, are defined as follows:
s∗(α) = F eF ts(α)0 , m∗(α) = m
(α)0 F t−1F e−1. (6)
Also, the resolved shear stress on slip system α is defined as
τ (α) = (s∗(α) ⊗m∗(α)) : Jσ, (7)
3

Y. Shintaku, K. Terada, J. Kato, T. Kyoya, S. Takase and S. Tsutsumi
where σ is the Cauchy stress and J is the determinant of F . Since the overall plasticpower is equivalent to the summation of the plastic powers of all the slip systems, thefollowing relationship is postulated:
Jσ : lp =n∑
α=1
τ (α)γ(α) (8)
where n is the number of slip systems of the crystal lattice of a hcp metal, lp is the plasticdeformation gradient defined in eq. (2) and γ(α) is the slip rate in slip system α. By thesubstitution of eq. (7) to this identity, the plastic velocity gradient can be related to theslip rate as
lp =n∑
α=1
(s∗(α) ⊗m∗(α))γ(α), (9)
which is the flow rule for a crystal plasticity model. With this definition, the plasticrate-of-deformation tensor and the plastic spin tensor of the crystallographic slip can beexpressed as follows:
dp =n∑
α=1
µ(α)γ(α), wp =n∑
α=1
ω(α)γ(α). (10)
Here, µ(α) and ω(α) are the symmetric and anti-symmetric components of (s∗(α)⊗m∗(α)),which are defined as
µ(α) := sym[s∗(α) ⊗m∗(α)], ω(α) := skw[s∗(α) ⊗m∗(α)]. (11)
2.3 Slip rate
Although various models for crystallographic slip have been proposed in the litera-ture, the following visco-plastic evolution law of exponential form, which was originallypresented by Asaro et al. [15], is employed in this study:
γ(α) := a
∣∣∣∣τ (α)g(α)
∣∣∣∣nv
sign
(τ (α)
g(α)
),
(12)
where a is the reference slip rate, g(α) is the slip resistance of slip system α and nv aparameter that controls the strain rate dependency. The relevant hardening law, whichis the evolution equation of slip resistance g(α), is given as
g(α) :=n∑
β=1
hαβγ(β), (13)
4

Y. Shintaku, K. Terada, J. Kato, T. Kyoya, S. Takase and S. Tsutsumi
where hαβ represents the hardening moduli. In this study, we employ the following hard-ening function presented by Asaro et al. [15]: hαα := h0sech
2
∣∣∣∣ h0γ
τs − τ0
∣∣∣∣hαβ := qhαα (α = β),
(14)
where hαα (no sum) and hαβ are the self-hardening and latent hardening moduli with qbeing the ratio of the latter to the former. Also, h0, τ0 and τs are the initial hardeningmodulus, the initial CRSS and the stage-I (saturation) stress, respectively. Here, eachhardening modulus is assumed to be a function of the total amount of accumulated slip,defined as:
γ :=n∑
α=1
∫ t
0
|γ(α)|dt. (15)
3 COHESIVE ZNONE MODEL
In this section, micro-scale and macro-scale cohesive zone models are expressed re-spectively. Microscopic model is formulated from atomic potential and then the damagevariable is introduced to macroscopic model within the framework of thermodynamics.
3.1 Microscopic model
Rose et al. [7] gather numerous results of the first-principle calculations and analyzethe cohesive energy of various kinds of atomics, and then present the relationship of thebinding energy as a function of separation which is called universal binding energy Ψm asfollows,
Ψm = −(1 + l) exp(−l), (16)
where l is the scaled separation associated with the Thomas-Fermi screening length. Riceand Wang [6] propose the exponential type of cohesive zone model from this relationship.As the additional revision, Needleman [5] introduce the cohesive potential and expressesexponential potential model. We also assume that the cohesive potential is the exponentialfunction and it is defined by
Ψm = −Amδm,c
(1 +
δmδm,c
)exp
(− δmδm,c
),
(17)
where δm is the separation displacement, δm,c is the critical state of δm and Am is theinitial modulus. The normal traction to crack surface cohesive is given by the differentialequation of the potential,
Tm =∂Ψm
∂δm= Am
δmδm,c
exp
(− δmδm,c
).
(18)
5

Y. Shintaku, K. Terada, J. Kato, T. Kyoya, S. Takase and S. Tsutsumi
This interfacial cohesive traction Tm initially increases until the interface separation δmbecomes δm,c as shown in Fig. 3, and then it decreases asymptotically to zero. In theGriffith theory, the critical energy release rate Gc given by
Gc =
∫ ∞
0
Tmdδ = Amδc = 2ωc, (19)
where ωc is the critical energy per unit required to make new crack surface. Irwin andOrowan [17] assumed that ωc is devided into two parts, the surface energy ωs and theplastic work ωp (ωc = ωs+ωp). On the other hand, Jokl et al. [18] demonstrate these twoparts interact with each other; the increase of ωs involves the rapid increase of ωp. Riceet al. [6] and Rimoli et al. [8] allow the existence of ωp but ωp is neglected (ωc ≈ ωs), andwe also utilize same formulation.
Equation (19) is substituted in the cohesive potential (eq. (17)) and traction (eq.(18)) and these are expressed by the surface energy ωs. The potensial and traction canbe rewritten as
Ψm = −2ωs
(1 +
δmδm,c
)exp
(− δmδm,c
),
(20)
Tm =∂Ψm
∂δm=
2ωs
δm,c
(δmδm,c
)exp
(− δmδm,c
).
(21)
The surface energy ωs is changed by the chemical attack and the hydrogen in particularinvolves the decreases of ωs. Jiang et al. [19] investigate the influence of hydrogen andRimoli and Ortiz. [8] approximate this data by quadric equation as shown Fig. 2, and itgives,
ωs (θ) =(1− 1.0467θ + 0.1687θ2
)ωs0, (22)
where θ = Γ/Γs is the coverage, Γ is the surface concentration, Γs is the saturation value,and ωs0 is the surface energy when Γ = 0. By the decrease of the surface energy ωs,maximum value of the cohesive traction is decrease as shown in Fig. 1.
3.2 Macroscopic model
The various fracture process in each material is simulated by each cohesive zone modelbased on the phenomenological theory. One of the famous macroscopic cohesive zonemodels is the exponential type such as eq. (17) and (18). In the next section, we estimatethe macroscopic parameter of the cohesive zone model from the micro boundary valueproblem (BVP). Fatigue crack propagation is simulated using the cohesive zone modelwith the damage theory. In this study, we apply the damage variable D to the cohesivepotential eq. (17),
ΨM = − (1−D)AMδM,c
(1 +
δMδM,c
)exp
(− δMδM,c
).
(23)
6

Y. Shintaku, K. Terada, J. Kato, T. Kyoya, S. Takase and S. Tsutsumi
θ = 0.00
θ = 0.25
θ = 0.50
θ = 0.75
T
T
Tc
δδc
Figure 1: Comparison of the cohesive traction curves with hydrogen converge fraction
0 0.5 1
1
2
3
Embrittle data
Quadric !t
θ
γ [J/mm2]
Figure 2: Surface energy with hydrogen converge fraction
7

Y. Shintaku, K. Terada, J. Kato, T. Kyoya, S. Takase and S. Tsutsumi
where the lower index M indicates the variable at macroscopic level in this section. Themacroscopic cohesive traction is given by
TM =∂ΨM
∂δM= (1−D)AM
(δMδM,c
)exp
(− δMδM,c
).
(24)
The thermodynamic force Y associated with the damage variable can be written as thederivative of eq. (23) and means the dissipation of the cohesive potential by the damageprogress,
Y = −∂ΨM
∂D= −AMδM,c
(1 +
δMδM,c
)exp
(− δMδM,c
).
(25)
In this model, the damage begins after then Y exceeds the threshold value Yth and thedamage accumulates as crack opening increases under loading (Y ≥ 0),
D = C(1−D)m⟨√Y −
√Yth⟩n∥
˙δMδM,c
∥ (if Y ≥ 0), (26)
D = 0 (otherwise), (27)
where C,m, and n are the material constants. Fig. 3 shows a sketch for the macroscopicmodel response under cyclic loading. The cohesive traction TM goes back to the originwith linear path under unloading condition while it shows nonlinear path under reloading.
TTc
T
δδc
1
2
3
n
Linear unloading
Max. loadingMin. loading
σ
N
12 3 n
Max. loading
Min. loading
Figure 3: TM − δM cohesive traction under cyclic loading
8
Y. Shintaku, K. Terada, J. Kato, T. Kyoya, S. Takase and S. Tsutsumi
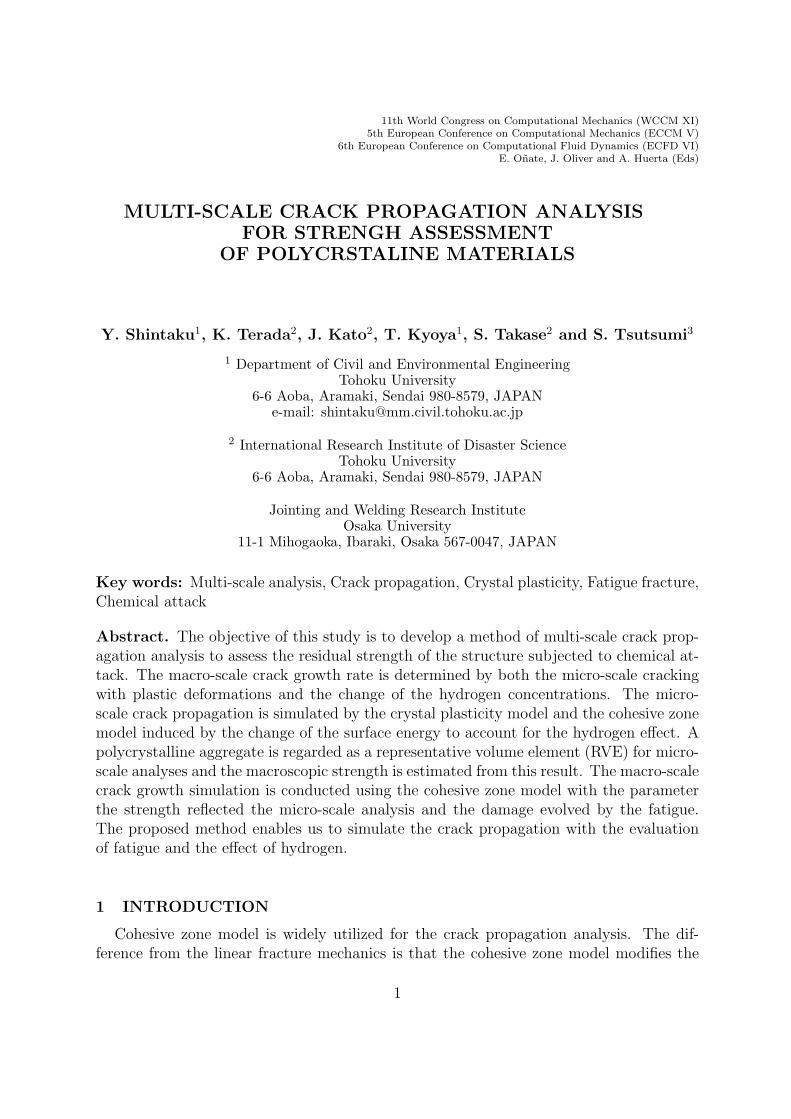
4 Numerical example
The RVE shown as Fig. 4 is used for the micro-scale analysis displacement is dis-tributed on the upper and lower edge of the plate and left side of the. The right side ofthe plate is fixed to x-direction and movable to y-direction. The RVE is assumed to bea stainless alloy, which consists of 14 crystal grains. The material properties are given inFig. 4. The cohesive zone is given in the crystal grain boundary and the parameter isassumed as δm,c = 0.003[mm]. The effect of the hydrogen is calculated as the followingratio of the surface concentration; θ = 0.0, 0.2, 0.4. Fig. 5 shows the relationship betweenthe traction and the displacement associated with the constrain point. The maximumtraction decreases by the effect of hydrogen and may be smaller than actual materialresponse because of the neglect of ωp. We assume that the whole response of the RVEis similar with the response of the macroscopic cohesive zone model. The macroscopicTM,c and δM,c are estimated from this load displacement curve using the renormalizationprocedure, such as Nuguyen and Ortiz [20].
The fatigue crack growth problem is analyzed through 1CT specimen under the as-sumption of the linear elastic condition. Considering the symmetry of the problem, thecomputational domain can be restricted to the quarter model as shown in Fig. 6. Theparameter of the fracture toughness is calculated from the micro-scale result and the fa-tigue parameter is estimated as shown Fig. 6. The relationship between crack growthlength and the number of cycles is shown as Fig. 7 and the crack growths rapidly by theeffect of the hydrogen.
ε = 1.0 [%]
Young’s modulus:
Poisson’s ratio:
Reference slip rate:
Strain rate dependency:
Initial hardening modulus:
Stage-I stress :
Initial CRSS :
Ratio of the hardening modulus:
30Yn =0.001a =ɺ
0 220h =
300[MPa]sτ =
0 93[MPa]τ =1qαβ =
206[GPa]E =
0.3ν =
xy
z
Figure 4: The micro-scale numerical model and conditions
9

Y. Shintaku, K. Terada, J. Kato, T. Kyoya, S. Takase and S. Tsutsumi
0 0.002 0.004 0.006
0
0.1
Displacement [mm]
Fo
rce
[N
]
θ= 0.2θ= 0.4
θ= 0.0
400
-400
σz [M
Pa]
1.0
0.0
εep[%]
Figure 5: Relationship between the transition and the displacement in the micro-scale analysis
xyz
Δε = 0.03[%]
Young’s modulus:
Poisson’s ratio:
Material constants of the damage:
100.0, 1.0, 0.1, 0.0thC m n Y= = = =
206[GPa]E =
0.3ν =
Figure 6: Macro-scale numerical model and conditions
5 CONCLUSIONS
- We estimated the macroscopic strengh of the polycrystalline structure material fromthe micro-scale analysis. The change of it was calculated from the decrease of thesurface energy because of the hydrogen, although we need to reconsider of the plasicwork ωp.
- The fatigue crack propagation considering the effect of hydrogen was simulated usingthe parameter evaluated from the micro-scale analysis.
10

Y. Shintaku, K. Terada, J. Kato, T. Kyoya, S. Takase and S. Tsutsumi
θ = 0.0
θ = 0.2
θ = 0.4
10
0
σz [M
Pa]
Figure 7: Crack growth lengh under cylcic loading
ACKNOWLEDGEMENT
I gratefully appreciate the Student Scholarship offered by International Association forComputational Mechanics (IACM).
REFERENCES
[1] Elliots, H.A. Analysis of the conditions for rupture due to griffith crack. Proc. Phys.Soc. (1947) 59: 208–223.
[2] Griffith, A.A. The Phenomena of Rupture and Flow in Solids. Phil. Trans. Roy. Soc.A(1920) 221: 163–198.
[3] Dugdale, D.S. Yield in Steel Sheets Containing Slits. J. Mech. Phys. Solids (1960)8: 100–104.
[4] Barenblatt, G.I. The Mathematical Theory of Equilibrium Cracks in Brittle Fracture.Adv. Appl. Mech. (1962) Vol. VII, Academics Press, 55–129.
[5] Needleman, A. A continuum model for void nucleation by inclusion debonding. J.Appl. Mech. (1987) 54: 525–531.
[6] Rice, J. and Wang, J. Embrittlement of interfaces by solute segregation. Mater. Sci.Eng. (1989) A102: 23–40.
[7] Rose, J.H. and Smith, J.R., Universal binding energy curves for metals and bimetallicinterfaces. Phys. Rev. Lett. (1981) 47: 675–678.
11

Y. Shintaku, K. Terada, J. Kato, T. Kyoya, S. Takase and S. Tsutsumi
[8] Rimoli, J.J. and Ortiz, M. A three dimensional multiscale model of intergranularhydogen-assisted cracking. Philos. Mag. (2010) 90: 2939–2963.
[9] Yamakov, V., Saether, E., Phillips, D.R. and Glaessgen, E.H. Molecular-dynamicssimulation-based cohesive zone representation of intergranular fracture processes inaluminum. J. Mech. Phys. Solids. (2006) 54: 1899–1928.
[10] Deshpande, V.S., Neddleman, A. and Van der Giessen, E. Discrete dislocation mod-eling of fatigue crack propagation. Acta. Materialia. (2002) 50: 831–846.
[11] Hillerborg, A., Modeer, M. and Petersson, P.E. Analysis of crack formation and crackgrowth in concrete by mean of fracture mechanics and finite element. Cem. Concr.RE. (1976) 6: 773–781.
[12] Jin, A.H., Paulino, G. H., and Dodds, R. H., Jr. Cohesive fracture modeling of elastic-plastic crack growth in functionally graded materials. Eng. Fract. Mech. (2003) 70:1885–1912.
[13] Nguyen, O., Reppeto, R. A., Ortiz, M., and Radovitzky R.A. A cohesive model offatigue crack growth. Int. J. Fatigue (2001) 110: 351–369.
[14] Bouvard, J.L., Chaboche, J.L., Feyel, F. and Gallerneau, F. A cohesive zone modelfor fatigue and creep-fatigue crack growth. Int. J. Fatigue (2009) 53: 1193–1196.
[15] Asaro, J.R. Crystal plasticity. J. Appl. Mech. (1983) 50, 921–934.
[16] Iwin, G.R. Fracture dynamics. Fract. Meta. (1948) ASM, Cleveland, OH, 147–166.
[17] Orowan, E. Fracture and Strength of Solids. Report on Progress in Physics (1483)Vol. XII, 185.
[18] Jokl, M.L., Viek, V. and McMahon Jr, C.J. Material rate dependence and localizeddeformation in crystalline solids. Acta. Metall. (1980) 28, 1479–1488.
[19] Jiang, E.A. and Carter, E.A. First principles assessment of ideal fracture energiesof materials with mobile implications for hydrogen embrittlement of metals. Acta.Meter. (2004) 52, 4801–4807.
[20] Nguyen, O. and Ortiz, M. Coarse-graining and renormalization of atomistic bindingrelations and universal macroscopic cohesive behavio. J. Mech. Phys. Solids. (2002)50: 1727–1741.
12


![LIST OF PUBLICATIONSfusion.k.u-tokyo.ac.jp/~takase/publications.pdfLIST OF REFEREED JOURNAL PUBLICATIONS Yuichi Takase [1] Lower hybrid heating in the Alcator A tokamak, J. J. Schuss,](https://img.pdfslide.us/doc/110x75/6000d1754c9e09199654e0f1/list-of-publicationsfusionku-tokyoacjptakase-list-of-refereed-journal-publications.jpg)