Embed Size (px)
Citation preview

Multi-scale Arctic prediction with MPAS-CESM
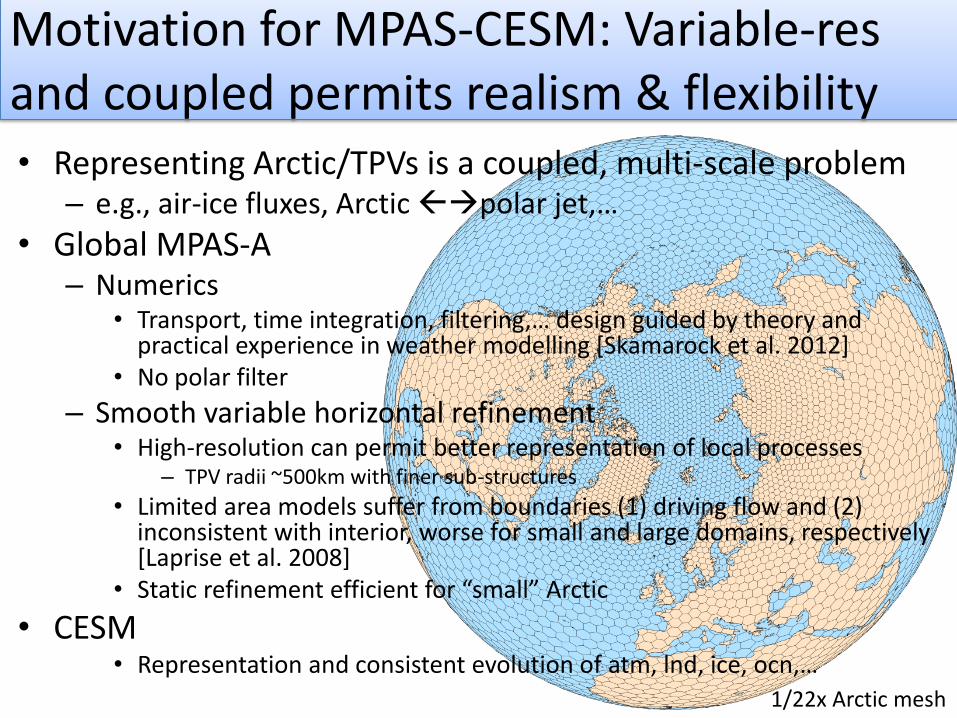
1/22x Arctic mesh
Nick Szapiro & Steven CavalloAaARG, University of Oklahoma
Bill SkamarockMMM, NCAR
CESM Workshop 2017PCWGBoulder, CO2017-06-21
Grateful for support from ONR, NCAR MPAS-A group, & CISL

Mass, momentum, & energy deeply coupled across boundary layer, latitudes, & strat-trop
MOSAiCScience Plan
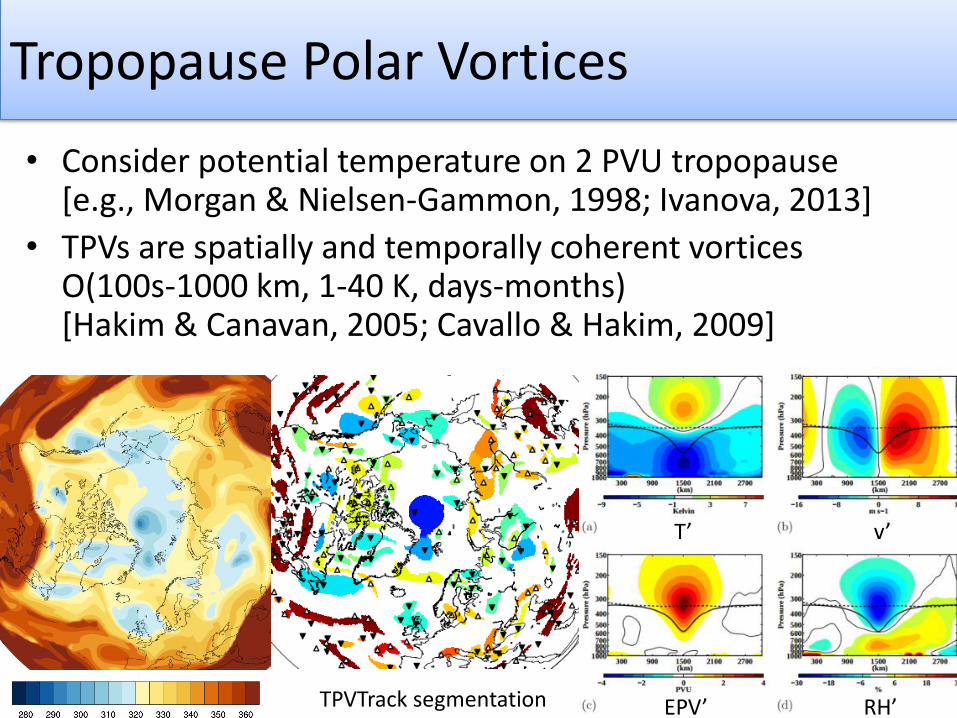
Tropopause Polar Vortices
• Consider potential temperature on 2 PVU tropopause [e.g., Morgan & Nielsen-Gammon, 1998; Ivanova, 2013]
• TPVs are spatially and temporally coherent vorticesO(100s-1000 km, 1-40 K, days-months) [Hakim & Canavan, 2005; Cavallo & Hakim, 2009]
TPVTrack segmentation
T’ v’
EPV’ RH’
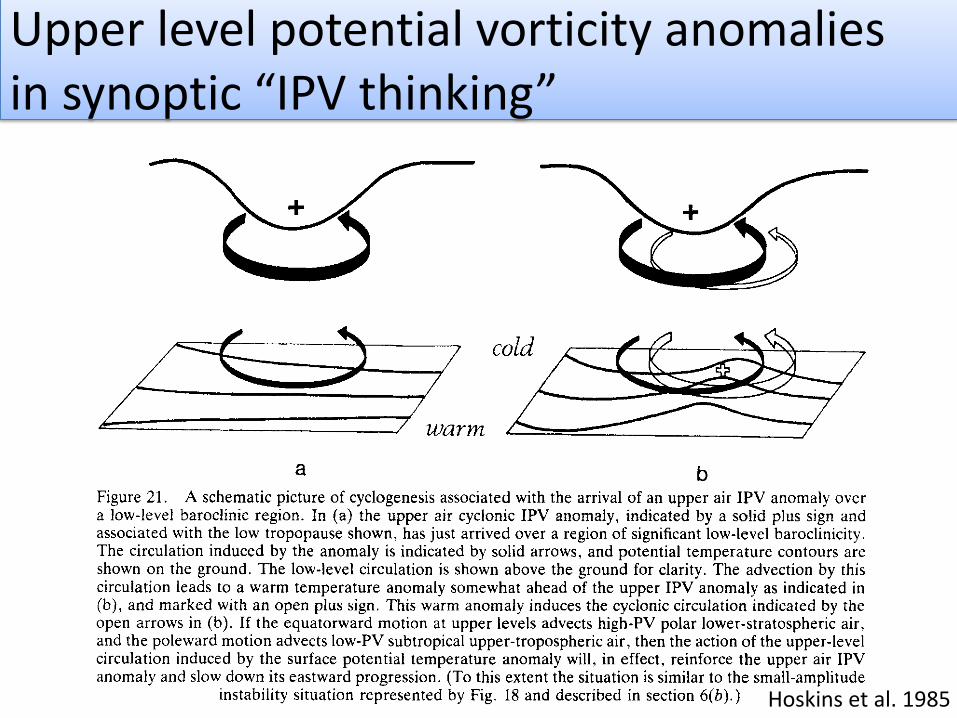
Upper level potential vorticity anomalies in synoptic “IPV thinking”
Hoskins et al. 1985

With a spectrum of scales w/in each component:How does model design impact processes? How do filters impact evolution, variability, & prediction?
MOSAiCScience Plan

Setup of CESM Large Ensemble [Kay et al. 2015]

Forced+internal variability in CESM-LE
• Greater sensitivity of thinner, younger ice [Maslanik et al. 2007; Kwok et al. 2013]
– With rapid ice loss events from anthro. forcing+growing intrinsic variability [Holland et al. 2008]
March-September Arctic sea ice area from 30 members of CESM-LE [Kay et al. 2015]
RCP8.5
Historical forcing

Sensible internal variability in CESM-LE:aice in 2021-09

Scales in CESM-LE:Power spectra of daily sea ice extent
FFT-based power spectrum:1. Daily SIE from aice .ge. 15%2. Blackman taper3. Mean PSD across members 1-30
NSIDC sea ice index1989-2016
CESM-LE extent1989-2016Mem 1-30w/ 95% Bootstrap C.I.
PSD smoothed w/ +/- 5 sample mean
(Are
a2)
(Are
a2)

What drives rapid ice loss?Compositing procedure for synoptic events
18d High-pass pan-Arctic SIE
NSIDC concentration
ERA-Interim
Initially REU project w/ Uriel Gutierrez

Top 1% Synoptic Rapid Ice Loss Events:Associated w/ surface lows + TPVsCounts of loss objects for
25 summer cases
Mean DT PT’ (color)and MSLP’ (contour)
Mean xice change
10 m wind
Composite mean in local reference frame w/ 10 m wind flowing to the right
Composite mean in local reference frame centered on TPV corew/ MSLP min to the right

August 2006 SRILE
Color: DT PT (K)Contour: MSLP .lt. 1000 hPa (∆=4 hPa)
AMSR-E

Color: RH (%)Contour: PT (K)
TPV-surface cyclone in WRF-ARW:Sensitivity to grid scale
120 km 90 km
24 km 3 km
Simulations:Chris Riedel

Polar filter affects TPV dynamics
• Increased damping of (Fourier) zonal wavenumberstowards pole for increased stability

Overview of Model for Prediction Across Scales (MPAS-A)
MPAS-A Tutorial (http://www2.mmm.ucar.edu/projects/mpas/tutorial/UK2015/slides/MPAS-overview.pdf)

MPAS-CESM 1.4.b7 (v2.0.b5 in testing)Dynamical, global, coupled, var-res (atmo)• Atmosphere: CAM5.3 with MPAS-A
dycore– Physics: 30min dt w/ dribbled
tendencies– Vertical levels as in CAM5: 30 levels
to 44.6km
• Land: CLM4 on ~1° FV grid– 30 min coupling to atm
• Ocean: POP2 on ~1°Greenland tri-pole– 1 day coupling to atm
• Sea ice: CICE4 on ~1°Greenland tri-pole– 30 min coupling to atm
• River: RTM– 3 hr coupling
• Coupling: CPL7 w/ atm* fluxes on atm grid
• Cost w/o optimization: ~1000 compute hrs/sim month
• ICs: analysis (atm) and CESM-LE analog (other components)
MPAS-A 2 CICE 4 N/A
N/A
POP 2RTMCLM 4
1/22x Arctic mesh

Refinement adds resolution in MPAS-CESM: f120h 500hPa rel. vertical vorticity
90-25 kmArctic
60 km
25 km
90 km
60 km
60 km

Use sensitivity experiments to quantify impacts of TPV intensity biases
• Localized tendency-based TPV modifications applied throughout integration– ID region; e.g., DT PT<300K North of 70N
– Apply modification; e.g., dθ/dt -= 10K/day [DT-10K,DT)

Central Arctic TPVs can impact surface cyclones and sea ice transport: f72h
Control
Ice velocity (cm/s)
Strengthened TPV
DT PT (K)

Stronger TPVs at mid-latitudes can amplify waviness: f28d
2006Control
IntensifyTPVs S of 65N

Stronger TPVs at mid-latitudes can impact sea ice motion: time-mean over 28d
2006Control
IntensifyTPVs S of 65N

Physical consistency
Stateaccuracy
Strongly coupled DA
Weakly coupled DA
Cold start from external analysis
CESM-LE analog
Forced by analysis
Climatological
Options for ICs
Analytical

Physical consistency
Stateaccuracy
Atm: Cold start from GFS FNL
Other components:CESM-LE analogfrom 2021
Initial conditions for 2017 Sea Ice Outlook
• SIO: Collection of June, July, and August 1 forecasts for September mean SIE for Arctic (, Alaska, and Antarctic)
Color: Sep. SIE in CESM-LE by member*linear extrapolation of Sep. Sea Ice Index
2017* SIE

2017 Sea Ice Outlook and summary
• TPVs can impact surface lows, wave amplification, seasonal circulation, and summer sea ice loss– Future: Linearity and dynamics of coupled response to TPV intensity
• MPAS-CESM as a dynamical tool for process and prediction studies– Future: Ensemble exploring model design and uncertainty
• Physics, mesh, numerics, coupling, stochastic physics,…• IC uncertainty: GEFS and CESM-LE analogs, ?
• June SIO (M km^2):
– Arctic: 4.1
– Alaska: 0.3
– Antarctic: 18.1

Extra slides

Outline
• Background on polar prediction– Coupled across BL, strat-trop, latitude
• Scale filters interactions
– CESM-LE• Forced+natural variability in extent• Coarse, polar filter, sea ice spectra
• MPAS-CESM description– What is MPAS-A?– Setup for MPAS-CESM
• Intrinsic predictability– Impacts of weak synoptic features
• TPV modifications
• Practical predictability– Forecast experiments
• 2017 SIO
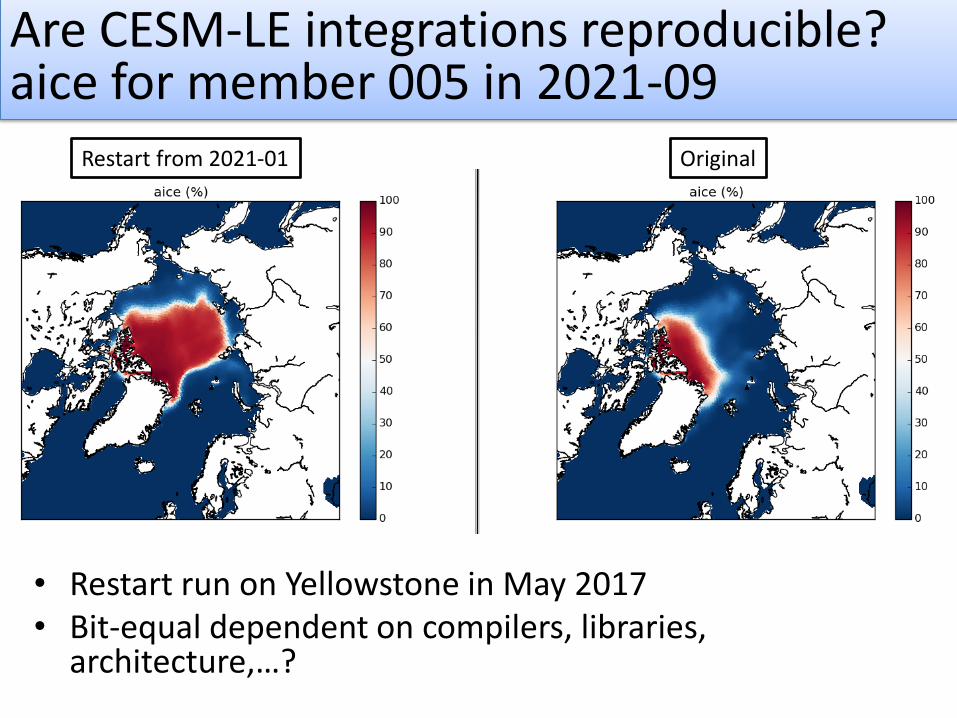
Are CESM-LE integrations reproducible?aice for member 005 in 2021-09
OriginalRestart from 2021-01
• Restart run on Yellowstone in May 2017• Bit-equal dependent on compilers, libraries,
architecture,…?

Transport > Diabatic > Frictional
TPV dynamics: Ertel’s Potential Vorticity
Cavallo & Hakim 2008,2010,2013

Intrinsic and practical TPV predictability in IFS EPS
Area of Θ’<10 K Min(Θ)
1/22x Arctic mesh
Motivation for MPAS-CESM: Variable-res and coupled permits realism & flexibility• Representing Arctic/TPVs is a coupled, multi-scale problem
– e.g., air-ice fluxes, Arctic polar jet,…
• Global MPAS-A– Numerics
• Transport, time integration, filtering,… design guided by theory and practical experience in weather modelling [Skamarock et al. 2012]
• No polar filter
– Smooth variable horizontal refinement• High-resolution can permit better representation of local processes
– TPV radii ~500km with finer sub-structures
• Limited area models suffer from boundaries (1) driving flow and (2) inconsistent with interior, worse for small and large domains, respectively [Laprise et al. 2008]
• Static refinement efficient for “small” Arctic
• CESM• Representation and consistent evolution of atm, lnd, ice, ocn,…