1
Multi Multi-scale Analysis and Prediction of the 8 May 2003 Oklahoma City Tornadic scale Analysis and Prediction of the 8 May 2003 Oklahoma City Tornadic Assimilating Radar and Surface Network Wind Observations using Assimilating Radar and Surface Network Wind Observations using Ting Lei Ting Lei 1 , Ming Xue , Ming Xue 1 Center for Analysis and Prediction of Storms Center for Analysis and Prediction of Storms 2 School of Meteorology School of Meteorology 3 School of Electronic and Computing Engineering School of Electronic and Computing Engineering University of Oklahoma University of Oklahoma Application Application of of Ensemble Ensemble Kalman Kalman filter filter (EnKF) (EnKF) using using real real radar radar data data is is a promising promising while while challenging challenging issue issue Up Up to to now, now, storm storm forecast forecast from from EnKF EnKF analysis analysis using using real real radar radar data data is is often often unsatisfactory unsatisfactory. In In the the real real world, world, when when mesoscale mesoscale forcing forcing is is involved involved with with convective convective storm storm initiation, initiation, relevant relevant atmospheric atmospheric processes processes span span multiple multiple spatial spatial-temporal temporal scales scales. The The multi multi-scale scale complexity complexity is is believed believed to to be be an an important important factor factor in in the the EnKF EnKF assimilation assimilation and and forecasting forecasting for for storms storms using using real real radar radar data data. To To address address this this multi multi-scale scale issue, issue, an an analysis analysis procedure procedure involving involving multiple multiple domains domains of of different different resolutions resolutions is is designed designed. EnKF EnKF using using radar radar data data is is run run on on the the finest finest (inner (inner-most) most) domain domain. The The analysis analysis of of non non-radar radar observations observations on on the the outer outer domains domains provide provide improved improved initial initial conditions conditions for for EnKF EnKF using using radar radar data data. EnKF EnKF using using high high-resolution resolution Mesonet Mesonet wind wind observations observations are are run run on on the the intermediate intermediate domain domain and and its its initial initial ensemble ensemble perturbations perturbations are are designed designed to to sample sample mesoscale mesoscale uncertainties uncertainties. With With additional additional convective convective scale scale perturbations perturbations introduced introduced to to the the convective convective analysis, analysis, multi multi-scale scale forecast forecast errors errors are are much much more more adequately adequately sampled sampled. For For a supercell supercell storm storm case case chosen chosen in in this this study, study, in in the the 65 65 min min forecast forecast from from the the mean mean analysis analysis using using radar, radar, the the supercell supercell storm storm movement movement is is captured captured well well and and the the forecast forecast of of hook hook echo echo and and low low level level vorticity vorticity is is reasonable reasonable. Besides Besides this this encouraging encouraging progress, progress, outstanding outstanding problems problems are are also also documented documented. Summary Summary: The The forecast forecast supercell supercell storm storm maintains maintains its its strength strength and and propagates propagates in in good good agreement agreement with with observations observations. The The forecast forecast hook hook echo echo appears appears at at about about 2200 2200 UTC UTC and and disappears disappears at at 2255 2255 UTC UTC. This This time time span span matches matches well well with with observed observed hook hook echo echo. The The existence existence of of low low level level vortex vortex couplet couplet straddling straddling the the hook hook echo echo in in the the forecast forecast is is consistent consistent with with conceptual conceptual models models (Straka (Straka et et al al. 2007 2007)) )). The The forecast forecast maximum maximum vertical vertical vorticity vorticity at at each each height height reasonably reasonably captures captures some some basic basic evolution evolution characteristics characteristics of of observation observation in in Burgess, Burgess, et et al al. (2004 2004), ), though though there there are are also also recognizable recognizable forecast forecast errors errors. An An obvious obvious shortcoming shortcoming is is the the continued continued development development of of the the south south storm storm in in the the forecast, forecast, which which decayed decayed at at about about 2250 2250UTC UTC in in reality reality. The The most most outer outer domain domain (D (D0) of of 9 km km horizontal horizontal resolution resolution covers covers the the whole whole North North America America and and the the inner inner two two domains domains (D (D0 and and D1) are are of of horizontal horizontal resolutions resolutions of of 3 km km and and 1 km km as as shown shown in in Fig Fig. 2. For For D1 (Panel (Panel A), A), hourly hourly analyses analyses between between 1800 1800 UTC, UTC, 8 May May and and 0000 0000 UTC UTC 9 May, May, 2003 2003 are are obtained obtained using using the the ARPS ARPS 3DVAR DVAR using using available available sounding sounding and and surface surface observations, observations, as as described described in in Hu Hu and and Xue Xue (2007 2007). They They provide provide unperturbed unperturbed lateral lateral boundary boundary conditions conditions (LBCs) (LBCs) to to the the 3 km km model model runs runs. As As shown shown in in Panel Panel B of of Fig Fig. 2, a single single pre pre-forecast forecast at at the the 3 km km horizontal horizontal resolution resolution is is first first performed performed from from 1800 1800 UTC, UTC, starting starting from from ARPS ARPS valid valid at at 2000 2000 UTC, UTC, is is used used as as the the background background to to initialize initialize 3 km km EnKF EnKF in in Panel Panel C. To To initialize initialize the the 3 km km ensemble ensemble at at 2000 2000 UTC, UTC, perturbations perturbations aimed aimed at at sampling sampling mesoscale mesoscale uncertainties uncertainties are are introduced introduced (Lei, (Lei, et et al al.,2009 2009). Starting Starting from from this this set set of of perturbed perturbed initial initial conditions conditions at at the the 3 km km grid grid at at 2000 2000 UTC, UTC, fifteen fifteen-minute minute-long long EnKF EnKF analysis analysis cycles cycles are are performed performed through through 2300 2300 UTC, UTC, analyzing analyzing Oklahoma Oklahoma Mesonet Mesonet wind wind observations observations. To To initialize initialize the the 1 km km EnKF EnKF analysis analysis cycles, cycles, the the 3 km km ensemble ensemble analyses analyses are are interpolated interpolated to to the the 1 km km grid grid at at 2100 2100 UTC UTC. Additional Additional convective convective perturbations perturbations are are added added to to these these 1 km km analyses, analyses, and and the the perturbations perturbations are are generated generated by by applying applying a smoothing smoothing procedure procedure on on random random perturbations, perturbations, as as described described in in Tong Tong and and Xue Xue (2008 2008). The The 1 km km EnKF EnKF analysis analysis cycles cycles using using radar radar data data are are then then started started from from 2105 2105 UTC UTC every every 5 minutes minutes. Multiscale issues in storm scale EnKF Multiscale analysis procdure Fig Fig.1. Tw Two nested nested domains domains.D1 is is the the domain domain of of horizontal horizontal resolution resolution 3 km km and and D2 the the domain domain of of 1 km km resolution resolution. Mesonet Mesonet stations stations and and KTLX KTLX and and KFDR KFDR radars radars are are also also labeled labeled. The The coordinates coordinates are are in in kilometer kilometer. Fig. 2.Diagram for the Fig. 2.Diagram for the multiscale multiscale analysis procedure analysis procedure Fig Fig. 3. The The grayscale grayscale map map of of vertical vertical velocity velocity in in the the 1 km km baseline baseline forecast forecast (see (see text) text) at at 7 km km MSL MSL from from 2100 2100-2300 2300 UTC UTC at at 30 30 min min intervals intervals in in the the 1 km km domain domain D2 with with coordinates coordinates in in kilometer kilometer. Only Only values values larger larger than than 5 m s-1 are are shown shown. The The grayscales grayscales of of the the shade shade at at two two consecutive consecutive times times are are different different. The The dotted dotted lines lines separate separate the the whole whole domain domain into into three three regions regions: I,II I,II and and III III. The The solid solid lines lines join join major major forecast forecast cells cells validate validate at at the the same same time time (tagged (tagged with with those those lines) lines) for for those those cells cells on on the the former former. The The cross cross signs signs tagged tagged with with S1 and and S2 indicate indicate position position of of soundings soundings generated generated at at 2100 2100 UTC UTC allowing allowing for for growing growing “thermal “thermal bubble bubble initialized” initialized” storms storms . Forecasts without Forecasts without EnKF EnKF radar analysis radar analysis Forecasts from Forecasts from EnKF EnKF radar analysis radar analysis Fig Fig. 4 (left) (left). Reflectivity Reflectivity at at 0.45 45° elevation elevation angle angle in in 1 km km domain domain D2 with with coordinate coordinate in in kilometer kilometer at at 2155 2155,2220 2220 2230 2230 and and 2300 2300 UTC UTC respectively respectively from from first first row row to to the the fourth fourth row row. The The left left column column is is for for observations observations by by KTLX, KTLX, and and the the right right for for projections projections from from the the ensemble ensemble analysis analysis mean mean (b) (b) and and subsequent subsequent forecast forecast (d,f (d,f and and h) h) in in the the control control run run. Fig Fig. 5. Time Time and and Height Height figure figure of of the the maximum maximum vertical vertical vorticity vorticity (s (s -1 ) associated associated with with the the main main storm storm (see (see text) text) multiplied multiplied by by 1000 1000 at at each each height height in in the the forecast forecast initialized initialized from from the the ensemble ensemble analysis analysis mean mean at at 2155 2155 UTC UTC in in Ectr_ Ectr_1km km to to 2300 2300 UTC UTC. The The vertical vertical coordinates coordinates are are height height above above the the ground ground in in kilometer kilometer. The The horizontal horizontal coordinates coordinates are are universal universal time time in in May May 8 th th 2003 2003. Performance of the mulsticale anlaysis procedure printed by www.postersession.com scale Analysis and Prediction of the 8 May 2003 Oklahoma City Tornadic scale Analysis and Prediction of the 8 May 2003 Oklahoma City Tornadic Supercell Supercell Storm Storm Assimilating Radar and Surface Network Wind Observations using Assimilating Radar and Surface Network Wind Observations using EnKF EnKF , Ming Xue , Ming Xue 1,2 1,2 and and Tianyou Tianyou Yu Yu 3 Center for Analysis and Prediction of Storms Center for Analysis and Prediction of Storms School of Meteorology School of Meteorology School of Electronic and Computing Engineering School of Electronic and Computing Engineering University of Oklahoma University of Oklahoma Reference Burgess, D. W. (2004). High resolution analyses of the 8 May 2003 Oklahoma City storm. Part I: Storm structure and evolution from radar data. Preprints,22nd Conf. Severe Local Storms,Hyannis, MA,Amer. Meteor. Soc., . Hu, M. &Xue, M. (2007b). Impact of configurations of rapid intermittent assimilation of WSR-88D radar data for the 8 May 2003 Oklahoma City tornadic thunderstorm case. Mon. Wea. Rev. 135: 507–525. Lei,T.,M. Xue and T. Yu,2009: Multi-scale analysis and prediction of the 8 May 2003 Oklahoma City tornadic supercell storm assimilating radar and surface network data using EnKF. Extended abstract, 13th Conf. of IOAS-AOLS, AMS Meetings 2008, Paper 6.4. Straka, J. M., E.N. Rasmussen, R.P. Davies-Jones, and P.M. Markowski (2007). An observational and idealized numerical examination of low-level conter-rotating vortices in the real flank of supercells. Electronic J. Severe Storms Meteor. 2(8): 22 Tong, M. &Xue, M. ,2008, Simultaneous estimation of microphysical parameters and atmospheric state with radar data and ensemble square-root Kalman filter. Part I: Sensitivity analysis and parameter identifiability. Mon. Wea. Rev. 136: 1630–1648. Zhou,Y., D. McLaughlin, D. Entekhabi, G. Ng ,2009:An ensemble multiscale filter for large nonlinear data assimilation problems. Mon. Wea. Rev., 136:2, 678-698 Acknowledgement: This research had been mainly supported by DOD-ONR N00014-06-1-0590 and NSF OCI-0905040.The ARPS EnKF system codes was first developed by Dr. M. Tong and Prof. M. Xue. Many factors, like model errors, can contribute to less satisfactory analysis of radar data retrieving dynamical processes responsible for supercell storm maintenance. Multiscale complexity is highlighted and addressed by the proposed multiscale analysis procedure in this work. The different performance between the control run and Em15min reveal: (1). A mechanism through which the multiscale analysis procedure are supposed to address and, hence, significantly improve the EnKF using radar data. (2) An indication of less than satisfactory ability of EnKF using radar in this Multiscale analysis procedure to deal with gross errors in its initial condition. . There are two important components in this multiscale analysis procedure. The first is the multiscale construction of ensembles. The second key component is the multiscale analyses (in 9 km and 3 km grids in this work) to improve representation of convection /storm initiation and, hence, better initial conditions for EnKF using radar data. Em15m also reveals how gross errors in initial deep convection positions can cause failure in the storm-scale EnKF analysis and subsequent forecast. Convection initiation (including storm initiation) is itself a challenging issue. Methods of its representation are not the focus of this work. The multiscale analysis procedure is designed to make use of the state of the art methods of convection initiation representation, and its’ performance depends on the later. Much work is to be done, including, for example, test and development of the surface observation operators used in high resolution models and schemes to use them in this multiscale analysis procedure. Also, in present configuration, the observations analyzed after the next level analysis (at finer grids) has begun are not considered to have any significant impact on the latter. Those analyses of those observations can be skipped to save a significant computation burden. Of course, study of use of those observations in the finest grid is also worthy. Studies on the reasons of unrealistically quickly decaying storm in the forecast from mean analysis of EnKFuing using radar data, like the forecast from 2155UTC in Em15m, will benefit much to this fields. A existing good forecast as the comparison, like the control run in this work, will be helpful. In current EnKF using radar data, the horizontal (vertical )covariance localization radius is 6 (4) km. That horizontal radius is less than expected when the covariance contains multiscale information about the forecast errors. But significantly larger radius (say, 12 km) will cause the member forecast unstable during the analysis cycles. Hence, multiscale methods dealing with the multiscale covariance, like Zhou,et al.,2006, are desirable. Discussion An illuminating Experiment (Em15m) The only difference is that the fields at 2045UTC are used at 2100UTCT to initialize the 1 km EnKF The only difference is that the fields at 2045UTC are used at 2100UTCT to initialize the 1 km EnKF with a 15 min with a 15 min -backward error. In the so generated initial condition at 2100UTC, the convection line backward error. In the so generated initial condition at 2100UTC, the convection line now is displaced to the west and outside of the observed radar echo. now is displaced to the west and outside of the observed radar echo. \ The following are a few comparisons between the control run and Em15m. Except for Fig. 6, the left is for The following are a few comparisons between the control run and Em15m. Except for Fig. 6, the left is for analysis mean of the control run and the right for Em15min at the final cycle at 2155UTC.. analysis mean of the control run and the right for Em15min at the final cycle at 2155UTC.. Analysis Analysis: 1. the the above above comparison comparison (Fig (Fig.6-10 10)show )show analysis analysis of of Em Em15 15min min at at 2155 2155UTC UTC is is apparently apparently similar similar to to the the control control run, run, while while many many supercell supercell characteristics characteristics are are retrieved retrieved. 2. Potentially Potentially significant significant difference difference exist, exist, including including weaker weaker downdraft,weaker downdraft,weaker cold cold pool pool and and less less organized organized vertical vertical vorticity vorticity at at the the region region near near 2-3 km km ABL ABL. Forecast Forecast: The The forecast forecast storm storm initialized initialized from from 2155 2155UTC UTC decays decays in in 30 30 min min in in Em Em15 15m. Through Through forecast forecast experiments experiments with with mutual mutual replacement replacement of of either either kinematic kinematic or or thermodynamic thermodynamic fields fields in in analyses analyses of of the the control control run run and and Em Em15 15, it’s it’s evident evident that that errors errors in in the the analyzed analyzed storm storm kinematic kinematic structures structures cause cause the the forecast forecast storm storm to to decay decay quickly quickly. Questions Questions: Is Is it it the the kinematic kinematic storm storm structure structure that that can’t can’t generate generate required required vertical vertical pressure pressure gradients gradients to to maintain maintain the the supercell supercell storm? storm? Does Does and and how how the the unrealistic unrealistic precipitation precipitation process process in in the the analysis analysis cycles(almost cycles(almost only only half half of of that that in in the the control control run, run, as as evident evident in in Fig Fig.11 11) contribute contribute to to errors errors in in the the analyzed analyzed storm storm kinematic kinematic structure? structure? The The forecast forecast storm storm initialized initialized from from 2230 2230UTC UTC decays decays after after 30 30 min min in in Em Em15 15m. It It apparently apparently indicates indicates that that EnKF EnKF using using radar radar is is reducing reducing the the relevant relevant errors errors existing existing at at 2155 2155UTC, UTC, though though not not enough enough. Fig.6, Innovation on radial velocity (left) and reflectivity (right) observed by KTLX. Solid lines are for analysis mean,dashed for forecast mean and black for the control run and the blue for Em15m. Fig.7. Analyzed reflectivity and stream lines at 1 km AGL Fig.8. the vertical voriticity at about 7.5 km AGL Fig.9. the vertical voriticity at about 3 km AGL Fig.10.Vertical velocity and stream lines at 10 m AGL. Fig.11. The accumulated precipitation during the radar data analysis cycles (2105-2155). The analyzed reflectivity mean at 10 m at 2155UTC are also overlapped.

Multi-scale Analysis and Prediction of the 8 May 2003 ...hfip.psu.edu/EDA2010/Lei.pdf · captured well and the forecast of hook echo and low level vorticity is reasonable. Besides

Embed Size (px)

Citation preview

MultiMulti--scale Analysis and Prediction of the 8 May 2003 Oklahoma City Tornadicscale Analysis and Prediction of the 8 May 2003 Oklahoma City TornadicAssimilating Radar and Surface Network Wind Observations usingAssimilating Radar and Surface Network Wind Observations using

Ting LeiTing Lei11, Ming Xue, Ming Xue11Center for Analysis and Prediction of StormsCenter for Analysis and Prediction of Storms

22School of MeteorologySchool of Meteorology33School of Electronic and Computing EngineeringSchool of Electronic and Computing Engineering

University of OklahomaUniversity of Oklahoma

ApplicationApplication ofof EnsembleEnsemble KalmanKalman filterfilter (EnKF)(EnKF) usingusing realreal radarradar datadata isis aa promisingpromising whilewhile challengingchallenging issueissueUpUp toto now,now, stormstorm forecastforecast fromfrom EnKFEnKF analysisanalysis usingusing realreal radarradar datadata isis oftenoften unsatisfactoryunsatisfactory.. InIn thethe realreal world,world,whenwhen mesoscalemesoscale forcingforcing isis involvedinvolved withwith convectiveconvective stormstorm initiation,initiation, relevantrelevant atmosphericatmospheric processesprocesses spanspanmultiplemultiple spatialspatial--temporaltemporal scalesscales.. TheThe multimulti--scalescale complexitycomplexity isis believedbelieved toto bebe anan importantimportant factorfactor inin thetheEnKFEnKF assimilationassimilation andand forecastingforecasting forfor stormsstorms usingusing realreal radarradar datadata.. ToTo addressaddress thisthis multimulti--scalescale issue,issue, anananalysisanalysis procedureprocedure involvinginvolving multiplemultiple domainsdomains ofof differentdifferent resolutionsresolutions isis designeddesigned.. EnKFEnKF usingusing radarradar datadata isisrunrun onon thethe finestfinest (inner(inner--most)most) domaindomain.. TheThe analysisanalysis ofof nonnon--radarradar observationsobservations onon thethe outerouter domainsdomains provideprovideimprovedimproved initialinitial conditionsconditions forfor EnKFEnKF usingusing radarradar datadata.. EnKFEnKF usingusing highhigh--resolutionresolution MesonetMesonet windwindobservationsobservations areare runrun onon thethe intermediateintermediate domaindomain andand itsits initialinitial ensembleensemble perturbationsperturbations areare designeddesigned toto samplesamplemesoscalemesoscale uncertaintiesuncertainties.. WithWith additionaladditional convectiveconvective scalescale perturbationsperturbations introducedintroduced toto thethe convectiveconvectiveanalysis,analysis, multimulti--scalescale forecastforecast errorserrors areare muchmuch moremore adequatelyadequately sampledsampled.. ForFor aa supercellsupercell stormstorm casecase chosenchosen ininthisthis study,study, inin thethe 6565 minmin forecastforecast fromfrom thethe meanmean analysisanalysis usingusing radar,radar, thethe supercellsupercell stormstorm movementmovement isiscapturedcaptured wellwell andand thethe forecastforecast ofof hookhook echoecho andand lowlow levellevel vorticityvorticity isis reasonablereasonable.. BesidesBesides thisthis encouragingencouragingprogress,progress, outstandingoutstanding problemsproblems areare alsoalso documenteddocumented..

SummarySummary:: TheThe forecastforecast supercellsupercell stormstorm maintainsmaintains itsits strengthstrength andand propagatespropagates inin goodgoodagreementagreement withwith observationsobservations.. TheThe forecastforecast hookhook echoecho appearsappears atat aboutabout 22002200 UTCUTC andanddisappearsdisappears atat 22552255 UTCUTC.. ThisThis timetime spanspan matchesmatches wellwell withwith observedobserved hookhook echoecho.. TheTheexistenceexistence ofof lowlow levellevel vortexvortex coupletcouplet straddlingstraddling thethe hookhook echoecho inin thethe forecastforecast isis consistentconsistentwithwith conceptualconceptual modelsmodels (Straka(Straka etet alal.. 20072007)))).. TheThe forecastforecast maximummaximum verticalvertical vorticityvorticity atateacheach heightheight reasonablyreasonably capturescaptures somesome basicbasic evolutionevolution characteristicscharacteristics ofof observationobservation ininBurgess,Burgess, etet alal.. ((20042004),), thoughthough therethere areare alsoalso recognizablerecognizable forecastforecast errorserrors.. AnAn obviousobviousshortcomingshortcoming isis thethe continuedcontinued developmentdevelopment ofof thethe southsouth stormstorm inin thethe forecast,forecast, whichwhich decayeddecayedatat aboutabout 22502250UTCUTC inin realityreality..

TheThe mostmost outerouter domaindomain (D(D00)) ofof 99 kmkm horizontalhorizontal resolutionresolution coverscovers thethe wholewhole NorthNorth AmericaAmerica andand thethe innerinner twotwo domainsdomains (D(D00 andand DD11)) areare ofof horizontalhorizontalresolutionsresolutions ofof 33 kmkm andand 11 kmkm asas shownshown inin FigFig.. 22.. ForFor DD11 (Panel(Panel A),A), hourlyhourly analysesanalyses betweenbetween 18001800 UTC,UTC, 88 MayMay andand 00000000 UTCUTC 99 May,May, 20032003 areare obtainedobtained usingusingthethe ARPSARPS 33DVARDVAR usingusing availableavailable soundingsounding andand surfacesurface observations,observations, asas describeddescribed inin HuHu andand XueXue ((20072007)).. TheyThey provideprovide unperturbedunperturbed laterallateral boundaryboundary conditionsconditions(LBCs)(LBCs) toto thethe 33 kmkm modelmodel runsruns.. AsAs shownshown inin PanelPanel BB ofof FigFig.. 22,, aa singlesingle prepre--forecastforecast atat thethe 33 kmkm horizontalhorizontal resolutionresolution isis firstfirst performedperformed fromfrom 18001800 UTC,UTC, startingstartingfromfrom ARPSARPS validvalid atat 20002000 UTC,UTC, isis usedused asas thethe backgroundbackground toto initializeinitialize 33 kmkm EnKFEnKF inin PanelPanel CC..

ToTo initializeinitialize thethe 33 kmkm ensembleensemble atat 20002000 UTC,UTC, perturbationsperturbations aimedaimed atat samplingsampling mesoscalemesoscale uncertaintiesuncertainties areare introducedintroduced (Lei,(Lei, etet alal..,,20092009)).. StartingStarting fromfrom thisthissetset ofof perturbedperturbed initialinitial conditionsconditions atat thethe 33 kmkm gridgrid atat 20002000 UTC,UTC, fifteenfifteen--minuteminute--longlong EnKFEnKF analysisanalysis cyclescycles areare performedperformed throughthrough 23002300 UTC,UTC, analyzinganalyzingOklahomaOklahoma MesonetMesonet windwind observationsobservations..

ToTo initializeinitialize thethe 11 kmkm EnKFEnKF analysisanalysis cycles,cycles, thethe 33 kmkm ensembleensemble analysesanalyses areare interpolatedinterpolated toto thethe 11 kmkm gridgrid atat 21002100 UTCUTC.. AdditionalAdditional convectiveconvective perturbationsperturbationsareare addedadded toto thesethese 11 kmkm analyses,analyses, andand thethe perturbationsperturbations areare generatedgenerated byby applyingapplying aa smoothingsmoothing procedureprocedure onon randomrandom perturbations,perturbations, asas describeddescribed inin TongTong andand XueXue((20082008)).. TheThe 11 kmkm EnKFEnKF analysisanalysis cyclescycles usingusing radarradar datadata areare thenthen startedstarted fromfrom 21052105 UTCUTC everyevery 55 minutesminutes..

Multiscale issues in storm scale EnKF

Multiscale analysis procdure

FigFig..11.. TwTwoo nestednested domainsdomains..DD11 isis thethedomaindomain ofof horizontalhorizontal resolutionresolution 33 kmkmandand DD22 thethe domaindomain ofof 11 kmkm resolutionresolution..MesonetMesonet stationsstations andand KTLXKTLX andandKFDRKFDR radarsradars areare alsoalso labeledlabeled.. TheThecoordinatescoordinates areare inin kilometerkilometer..

Fig. 2.Diagram for theFig. 2.Diagram for the multiscalemultiscale analysis procedureanalysis procedure

FigFig.. 33.. TheThe grayscalegrayscale mapmap ofof verticalvertical velocityvelocity inin thethe 11 kmkm baselinebaseline forecastforecast(see(see text)text) atat 77 kmkm MSLMSL fromfrom 21002100--23002300 UTCUTC atat 3030 minmin intervalsintervals inin thethe 11 kmkmdomaindomain DD22 withwith coordinatescoordinates inin kilometerkilometer.. OnlyOnly valuesvalues largerlarger thanthan 55 mm ss--11areare shownshown.. TheThe grayscalesgrayscales ofof thethe shadeshade atat twotwo consecutiveconsecutive timestimes arearedifferentdifferent.. TheThe dotteddotted lineslines separateseparate thethe wholewhole domaindomain intointo threethree regionsregions:: I,III,IIandand IIIIII.. TheThe solidsolid lineslines joinjoin majormajor forecastforecast cellscells validatevalidate atat thethe samesame timetime(tagged(tagged withwith thosethose lines)lines) forfor thosethose cellscells onon thethe formerformer.. TheThe crosscross signssignstaggedtagged withwith SS11 andand SS22 indicateindicate positionposition ofof soundingssoundings generatedgenerated atat 21002100UTCUTC allowingallowing forfor growinggrowing “thermal“thermal bubblebubble initialized”initialized” stormsstorms ..

Forecasts withoutForecasts without EnKFEnKF radar analysisradar analysis

Forecasts fromForecasts from EnKFEnKF radar analysisradar analysis

FigFig.. 44 (left)(left).. ReflectivityReflectivity atat 00..4545°° elevationelevation angleangle inin 11 kmkm domaindomain DD22 withwithcoordinatecoordinate inin kilometerkilometer atat 21552155,,22202220 22302230 andand 23002300 UTCUTC respectivelyrespectively fromfrom firstfirstrowrow toto thethe fourthfourth rowrow.. TheThe leftleft columncolumn isis forfor observationsobservations byby KTLX,KTLX, andand thethe rightrightforfor projectionsprojections fromfrom thethe ensembleensemble analysisanalysis meanmean (b)(b) andand subsequentsubsequent forecastforecast (d,f(d,fandand h)h) inin thethe controlcontrol runrun..

FigFig.. 55.. TimeTime andand HeightHeight figurefigure ofof thethe maximummaximum verticalvertical vorticityvorticity (s(s--11))associatedassociated withwith thethe mainmain stormstorm (see(see text)text) multipliedmultiplied byby 10001000 atat eacheach heightheight ininthethe forecastforecast initializedinitialized fromfrom thethe ensembleensemble analysisanalysis meanmean atat 21552155 UTCUTC ininEctr_Ectr_11kmkm toto 23002300 UTCUTC.. TheThe verticalvertical coordinatescoordinates areare heightheight aboveabove thethe groundgroundinin kilometerkilometer.. TheThe horizontalhorizontal coordinatescoordinates areare universaluniversal timetime inin MayMay 88thth 20032003..

Performance of the mulsticale anlaysis procedure

printed by

www.postersession.com

scale Analysis and Prediction of the 8 May 2003 Oklahoma City Tornadicscale Analysis and Prediction of the 8 May 2003 Oklahoma City Tornadic SupercellSupercell StormStormAssimilating Radar and Surface Network Wind Observations usingAssimilating Radar and Surface Network Wind Observations using EnKFEnKF

, Ming Xue, Ming Xue1,21,2 andand TianyouTianyou YuYu33

Center for Analysis and Prediction of StormsCenter for Analysis and Prediction of StormsSchool of MeteorologySchool of Meteorology

School of Electronic and Computing EngineeringSchool of Electronic and Computing EngineeringUniversity of OklahomaUniversity of Oklahoma

ReferenceBurgess, D. W. (2004). High resolution analyses of the 8 May 2003 Oklahoma City storm. Part I: Storm structure and evolution from radardata. Preprints,22nd Conf. Severe Local Storms,Hyannis, MA,Amer. Meteor. Soc., .Hu, M. &Xue, M. (2007b). Impact of configurations of rapid intermittent assimilation of WSR-88D radar data for the 8 May 2003Oklahoma City tornadic thunderstorm case. Mon. Wea. Rev. 135: 507–525.Lei,T.,M. Xue and T. Yu,2009: Multi-scale analysis and prediction of the 8 May 2003 Oklahoma City tornadic supercell storm assimilatingradar and surface network data using EnKF. Extended abstract, 13th Conf. of IOAS-AOLS, AMS Meetings 2008, Paper 6.4.Straka, J. M., E.N. Rasmussen, R.P. Davies-Jones, and P.M. Markowski (2007). An observational and idealized numerical examination oflow-level conter-rotating vortices in the real flank of supercells. Electronic J. Severe Storms Meteor. 2(8): 22Tong, M. &Xue, M. ,2008, Simultaneous estimation of microphysical parameters and atmospheric state with radar data and ensemblesquare-root Kalman filter. Part I: Sensitivity analysis and parameter identifiability. Mon. Wea. Rev. 136: 1630–1648.Zhou,Y., D. McLaughlin, D. Entekhabi, G. Ng ,2009:An ensemble multiscale filter for large nonlinear data assimilation problems. Mon.Wea. Rev., 136:2, 678-698Acknowledgement: This research had been mainly supported by DOD-ONR N00014-06-1-0590 and NSF OCI-0905040.The ARPS EnKFsystem codes was first developed by Dr. M. Tong and Prof. M. Xue.

Many factors, like model errors, can contribute to less satisfactory analysis of radar data retrievingdynamical processes responsible for supercell storm maintenance. Multiscale complexity is highlightedand addressed by the proposed multiscale analysis procedure in this work. The different performancebetween the control run and Em15min reveal: (1). A mechanism through which the multiscale analysisprocedure are supposed to address and, hence, significantly improve the EnKF using radar data. (2) Anindication of less than satisfactory ability of EnKF using radar in this Multiscale analysis procedure todeal with gross errors in its initial condition.. There are two important components in this multiscale analysis procedure. The first is the multiscaleconstruction of ensembles. The second key component is the multiscale analyses (in 9 km and 3 km gridsin this work) to improve representation of convection /storm initiation and, hence, better initialconditions for EnKF using radar data. Em15m also reveals how gross errors in initial deep convectionpositions can cause failure in the storm-scale EnKF analysis and subsequent forecast.

Convection initiation (including storm initiation) is itself a challenging issue. Methods of itsrepresentation are not the focus of this work. The multiscale analysis procedure is designed to make useof the state of the art methods of convection initiation representation, and its’ performance depends onthe later.

Much work is to be done, including, for example, test and development of the surface observationoperators used in high resolution models and schemes to use them in this multiscale analysis procedure.Also, in present configuration, the observations analyzed after the next level analysis (at finer grids) hasbegun are not considered to have any significant impact on the latter. Those analyses of thoseobservations can be skipped to save a significant computation burden. Of course, study of use of thoseobservations in the finest grid is also worthy.

Studies on the reasons of unrealistically quickly decaying storm in the forecast from mean analysis ofEnKFuing using radar data, like the forecast from 2155UTC in Em15m, will benefit much to this fields.A existing good forecast as the comparison, like the control run in this work, will be helpful.

In current EnKF using radar data, the horizontal (vertical )covariance localization radius is 6 (4) km.That horizontal radius is less than expected when the covariance contains multiscale information aboutthe forecast errors. But significantly larger radius (say, 12 km) will cause the member forecast unstableduring the analysis cycles. Hence, multiscale methods dealing with the multiscale covariance, likeZhou,et al.,2006, are desirable.

Discussion

An illuminating Experiment (Em15m)

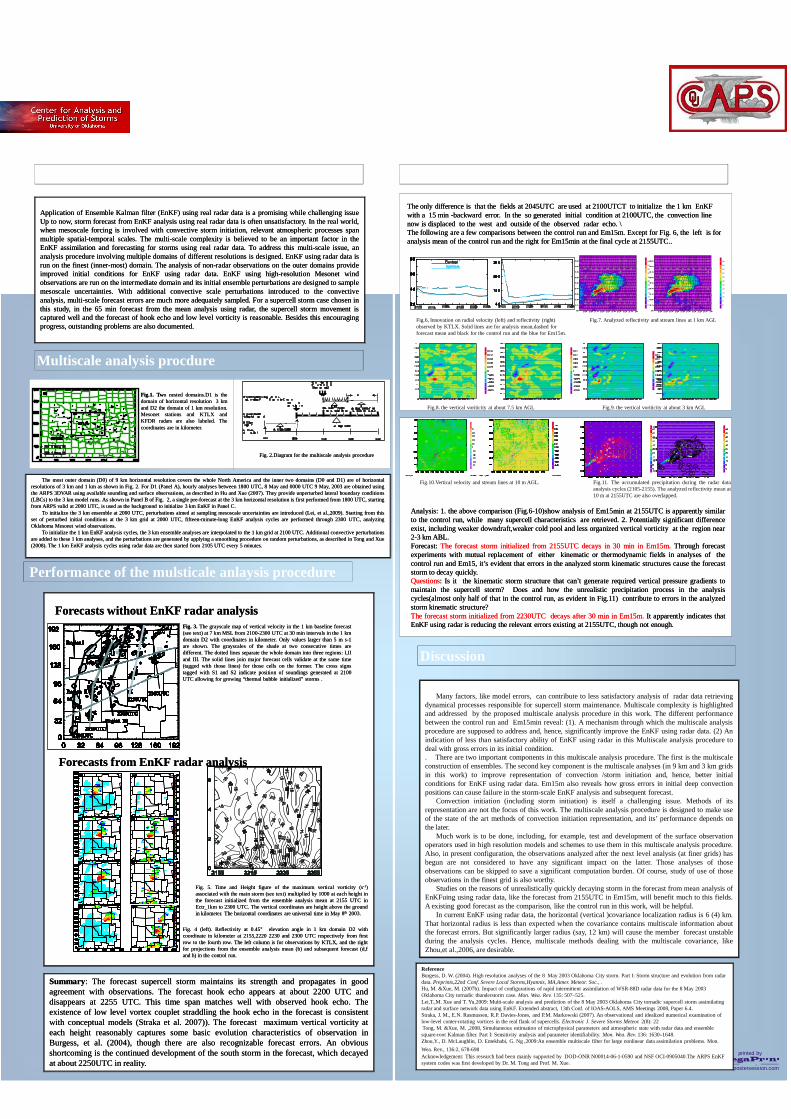
The only difference is that the fields at 2045UTC are used at 2100UTCT to initialize the 1 km EnKFThe only difference is that the fields at 2045UTC are used at 2100UTCT to initialize the 1 km EnKFwith a 15 minwith a 15 min --backward error. In the so generated initial condition at 2100UTC, the convection linebackward error. In the so generated initial condition at 2100UTC, the convection linenow is displaced to the west and outside of the observed radar echo.now is displaced to the west and outside of the observed radar echo. \\The following are a few comparisons between the control run and Em15m. Except for Fig. 6, the left is forThe following are a few comparisons between the control run and Em15m. Except for Fig. 6, the left is foranalysis mean of the control run and the right for Em15min at the final cycle at 2155UTC..analysis mean of the control run and the right for Em15min at the final cycle at 2155UTC..

AnalysisAnalysis:: 11.. thethe aboveabove comparisoncomparison (Fig(Fig..66--1010)show)show analysisanalysis ofof EmEm1515minmin atat 21552155UTCUTC isis apparentlyapparently similarsimilartoto thethe controlcontrol run,run, whilewhile manymany supercellsupercell characteristicscharacteristics areare retrievedretrieved.. 22.. PotentiallyPotentially significantsignificant differencedifferenceexist,exist, includingincluding weakerweaker downdraft,weakerdowndraft,weaker coldcold poolpool andand lessless organizedorganized verticalvertical vorticityvorticity atat thethe regionregion nearnear22--33 kmkm ABLABL..ForecastForecast:: TheThe forecastforecast stormstorm initializedinitialized fromfrom 21552155UTCUTC decaysdecays inin 3030 minmin inin EmEm1515mm.. ThroughThrough forecastforecastexperimentsexperiments withwith mutualmutual replacementreplacement ofof eithereither kinematickinematic oror thermodynamicthermodynamic fieldsfields inin analysesanalyses ofof thethecontrolcontrol runrun andand EmEm1515,, it’sit’s evidentevident thatthat errorserrors inin thethe analyzedanalyzed stormstorm kinematickinematic structuresstructures causecause thethe forecastforecaststormstorm toto decaydecay quicklyquickly..QuestionsQuestions:: IsIs itit thethe kinematickinematic stormstorm structurestructure thatthat can’tcan’t generategenerate requiredrequired verticalvertical pressurepressure gradientsgradients totomaintainmaintain thethe supercellsupercell storm?storm? DoesDoes andand howhow thethe unrealisticunrealistic precipitationprecipitation processprocess inin thethe analysisanalysiscycles(almostcycles(almost onlyonly halfhalf ofof thatthat inin thethe controlcontrol run,run, asas evidentevident inin FigFig..1111)) contributecontribute toto errorserrors inin thethe analyzedanalyzedstormstorm kinematickinematic structure?structure?TheThe forecastforecast stormstorm initializedinitialized fromfrom 22302230UTCUTC decaysdecays afterafter 3030 minmin inin EmEm1515mm.. ItIt apparentlyapparently indicatesindicates thatthatEnKFEnKF usingusing radarradar isis reducingreducing thethe relevantrelevant errorserrors existingexisting atat 21552155UTC,UTC, thoughthough notnot enoughenough..

Fig.6, Innovation on radial velocity (left) and reflectivity (right)observed by KTLX. Solid lines are for analysis mean,dashed forforecast mean and black for the control run and the blue for Em15m.

Fig.7. Analyzed reflectivity and stream lines at 1 km AGL

Fig.8. the vertical voriticity at about 7.5 km AGL Fig.9. the vertical voriticity at about 3 km AGL

Fig.10.Vertical velocity and stream lines at 10 m AGL. Fig.11. The accumulated precipitation during the radar dataanalysis cycles (2105-2155). The analyzed reflectivity mean at10 m at 2155UTC are also overlapped.