Embed Size (px)
Citation preview
materials
Article
Multi-Response Optimization of Resin Finishingby Using a Taguchi-Based Grey Relational Analysis
Md. Nahid Pervez 1 ID , Faizan Shafiq 1, Zahid Sarwar 2, Muhammad Munib Jilani 2
and Yingjie Cai 1,*1 Hubei Provincial Engineering Laboratory for Clean Production and High Value Utilization of
Bio-Based Textile Materials, Wuhan Textile University, Wuhan 430073, China;[email protected] (M.N.P.); [email protected] (F.S.)
2 Department of Textile Processing, National Textile University, Faisalabad 37610, Pakistan;[email protected] (Z.S.); [email protected] (M.M.J.)
* Correspondence: [email protected]; Tel.: +86-027-593-673-34
Received: 17 January 2018; Accepted: 7 March 2018; Published: 15 March 2018
Abstract: In this study, the influence and optimization of the factors of a non-formaldehyde resinfinishing process on cotton fabric using a Taguchi-based grey relational analysis were experimentallyinvestigated. An L27 orthogonal array was selected for five parameters and three levels by applyingTaguchi’s design of experiments. The Taguchi technique was coupled with a grey relational analysisto obtain a grey relational grade for evaluating multiple responses, i.e., crease recovery angle (CRA),tearing strength (TE), and whiteness index (WI). The optimum parameters (values) for resin finishingwere the resin concentration (80 g·L−1), the polyethylene softener (40 g·L−1), the catalyst (25 g·L−1),the curing temperature (140 ◦C), and the curing time (2 min). The goodness-of-fit of the datawas validated by an analysis of variance (ANOVA). The optimized sample was characterized byFourier-transform infrared (FTIR) spectroscopy, thermogravimetric analysis (TGA), and scanningelectron microscope (SEM) to better understand the structural details of the resin finishing process.The results showed an improved thermal stability and confirmed the presence of well deposited ofresin on the optimized fabric surface.
Keywords: resin finishing; multi-response; Taguchi-grey; orthogonal array; ANOVA
1. Introduction
Cellulosic fibers and more specifically cotton are the most widely used types of fiber due toseveral advantages, such as the ability to withstand harsh washing solutions, particularly underalkaline conditions, good perspiration absorption characteristics, comfortable wear properties, and thecapacity to take up a large variety of dyestuffs [1,2]. However, the inclination to wrinkle undereven slight pressing and the lingering maintenance of the wrinkles give cotton clothing a poor wearrating [3]. Ideally, the appearance of garments is imperative to purchasers. To accomplish an attractiveappearance, wrinkles may be deliberately created by squeezing operations. On the other hand,wrinkles or short irregular folds that appear unexpectedly on the surface of a fabric or garment duringwear are not just unwelcome but also may harm the fabrics because increased wear or breakage mayoccur along the wrinkles [4,5].
Wrinkle recovery or recuperation is characterized as a fabric property that allows it to recoverfrom the wrinkles. Therefore, wrinkle recovery is one of the essential properties of fabrics influencingthe item execution. If the wrinkle remains for a moderately long stretch after it occurred, it affectsthe fabric’s wearability and quality negatively. The cross-linking of cellulose has for some time beenutilized to improve the wrinkle protection of cotton fabrics by diminishing chain slippage under wetconditions [6]. The crosslinkers that are used are also known as resin, easy care, or durable press
Materials 2018, 11, 426; doi:10.3390/ma11030426 www.mdpi.com/journal/materials
Materials 2018, 11, 426 2 of 19
finishing agents and can be categorized as formaldehyde-based chemicals and formaldehyde-freecompounds. The formaldehyde-based chemicals are the most seasoned crosslinkers. Resin finishingwas initially conducted using products based on phenol-formaldehyde condensates, methylol melamine,or dimethylol urea. These items resulted in high formaldehyde emissions. Because formaldehyde is acancer-causing compound, finishing agents with a high formaldehyde emission rate are undesirable.In numerous nations, regulations have been implemented regarding the allowable emissions offormaldehyde. Therefore, there is a need to mitigate the harmful effects of formaldehyde by utilizing anon-formaldehyde resin finishing process. Much effort has been invested to discover non-formaldehydecrosslinking operators for cotton to replace the commonly used N-methylol reagents such as zeroformaldehyde-based reactants, the commercial products of 1,3-dimethylurea and glyoxal, as well asinorganic phosphates. Polycarboxylic acids such as citric acid are acceptable for crosslinking cotton dueto the response with cellulose hydroxyl groups by an anhydride intermediate mechanism [7].
There are several parameters influencing the resin finishing process and it is fundamental toupgrade the conditions for a viable resin finishing process. A methodical method for arrangement,execution, and statistical assessment of the procedure is required, and an advanced procedure is requiredto accomplish the optimum quality attributes of the completed item [8]. Traditional optimization studiesthat vary one parameter while holding all other parameters fixed are frequently viewed as a thoroughbut costly approach. The Taguchi design method is an exception to this approach and the use ofan analysis of variance (ANOVA) method is a powerful approach that utilizes orthogonal arrays(OAs) to reduce the number of parameters required to decide the optimal settings of the processingparameters. The adequacy of the Taguchi strategy for enhancing quality in the industry has beenconfirmed. The Taguchi technique facilitates the evaluation of an extensive number of processingparameters while using a fewer number of experimental trials; a single response variable can betested, while many other test investigate multiple responses [9]. If more than one response has to beevaluated, the multi-attribute decision making (MADM) methodologies are used. The multi-attributedecision making selects the best responses from the current choices by considering multiple responses,which are typically correlated with each other. There are several multi-attribute decision makingtechniques, such as the technique for the order of preference by similarity to ideal solution (TOPSIS),the grey relational analysis (GRA), the data envelopment analysis (DEA), and the analytic hierarchyprocess (AHP) [10]. Amongst them, the GRA has been broadly applied in different fields [11].
The GRA was proposed by Deng [12] in 1989 and is a technique for measuring the estimatedlevel among various outcomes utilizing a grey relational grade (GRG). The grey system theory isused to determine vulnerabilities in framework models, examine relationships between frameworks,develop models, and settle on conjectures and choices [13]. The meaning of grey can be defined as thecharacteristic occurring between the extremes of black and white. In the grey system, black representsthe absence of data and white represents complete data in the framework. The purpose of the greysystem and its applications is to describe the grey or fuzzy area between the extremes of black andwhite. The incomplete information is the basic characteristic of a grey system [14]. The GRA is ameasurable procedure based on the grey system and transforms multiple qualitative characteristicsinto single GRGs. By contrasting the computed GRGs, changes in the separate qualitative attributesare determined in accordance with the response evaluations to select an ideal arrangement of theprocessing parameters [15]. Raza et al. [16] studied multi-response optimization in rhamnolipidproduction by using the GRA with the Taguchi approach. Rehman et al. [17] also used the Taguchimethod for the optimization of enzymatic desizing of cotton fabrics under various chemo-physicalconditions. Aslan et al. [18] employed the GRA method to determine the optimal operating parametersof a laboratory scale thickener including feed flow rate, solid percentage, flocculant dosage, and feedwell height for the dewatering performance with multiple performance characteristics. Also severalresources can be found in literature about multi-response optimization of process parameters byTaguchi-based Grey relational analysis method [19–21].
Materials 2018, 11, 426 3 of 19
This study is divided into two sections; first, non-formaldehyde resin finishing of cotton fabrics isconducted using an L27 OA-based Taguchi design. Second, different processing parameters includingthree levels of the concentrations of the resin (g·L−1), catalyst (g·L−1), and the softener (g·L−1), as wellas the curing temperature (◦C) and curing time (min) are investigated to determine the optimumoperating parameters of a resin finishing process to achieve the optimum multiple characteristics byusing the Taguchi-based GRA; this approach has not been reported previously in the literature.
2. Materials and Methods
2.1. Materials
A 100% bleached plain weave cotton fabric (ends per inch × picks per inch = 85 × 52; yarn count40s Ne), with a fabric weight of 102 g·m−2 was used in this study. The cross-linkers Knittex RCT®
(modified dihydroxyethyleneurea) and Knittex® Catalyst Mo were used as catalysts and both wereobtained from Huntsman (The Woodlands, TX, USA). Siligen GL (nonionic polysiloxane by BASF,Basel, Switzerland) was used as a softener.
2.2. Design of Experiments
The five controllable factors that are considered in this research with three levels per factorare shown in Table 1. Taguchi’s experimental design (OA L27) was constructed by using Minitab®
17 statistical software (Minitab Inc, Coventry, UK) and the details are provided in Table 2. The resinfinishing was carried out on a laboratory padder and stenter according to the experimental design.The pH of the solution was maintained at 5.5 by adding a small quantity (3 to 4 drops) of acetic acid.All fabric samples were padded with a wet pick-up of 75%, were dried at 120 ◦C for 3 min, and thencured according to the experimental design. Then the fabric was removed from the curing chamber,cooled at room temperature.
Table 1. Parameters and their levels.
Symbol Process Parameters Unit Level 1 Level 2 Level 3
A Resin (Knittex RCT) g·L−1 80 110 140B Polyethylene Softener g·L−1 20 30 40C Catalyst(Knittex® Mo) g·L−1 15 20 25D Curing temperature ◦C 130 140 150E Curing time min 2 3 4
Table 2. Experimental layout using an (L27) OA and multi-performance results.
Exp. No. A B C D E CRA (o)W + F
S/N Ratio(dB)
TE (gf)W + F
S/N Ratio(dB) WI S/N Ratio
(dB)
1 1 1 1 1 1 210.2 46.4527 1700.2 64.6100 70.2 36.92672 1 1 1 1 2 212.4 46.5431 1700.6 64.6120 70.7 36.98843 1 1 1 1 3 217.1 46.7332 1690.2 64.5588 69.3 36.81474 1 2 2 2 1 218.2 46.7771 1710.4 64.6620 70.1 36.91445 1 2 2 2 2 218.6 46.7930 1700.6 64.6120 69.6 36.85226 1 2 2 2 3 220.8 46.8800 1690.6 64.5608 69.1 36.78967 1 3 3 3 1 219.4 46.8247 1720.2 64.7116 70.8 37.00078 1 3 3 3 2 220.2 46.8563 1710.6 64.6630 70.3 36.93919 1 3 3 3 3 222.4 46.9427 1700.8 64.6131 69.2 36.802110 2 1 2 3 1 223.2 46.9739 1680.2 64.5072 69.7 36.864711 2 1 2 3 2 225.2 47.0514 1670.4 64.4564 68.4 36.701112 2 1 2 3 3 226.4 47.0975 1660.6 64.4053 67.1 36.534513 2 2 3 1 1 222.6 46.9505 1690.4 64.5598 69.4 36.827214 2 2 3 1 2 222.2 46.9349 1680.4 64.5083 69.9 36.8895
Materials 2018, 11, 426 4 of 19
Table 2. Cont.
Exp. No. A B C D E CRA (o)W + F
S/N Ratio(dB)
TE (gf)W + F
S/N Ratio(dB) WI S/N Ratio
(dB)
15 2 2 3 1 3 227.2 47.1282 1660.2 64.4032 69.8 36.877116 2 3 1 2 1 228.4 47.1739 1670.2 64.4554 71.2 37.049617 2 3 1 2 2 227.6 47.1434 1680.8 64.5103 70.9 37.012918 2 3 1 2 3 232.2 47.3172 1640.2 64.2979 70.4 36.951519 3 1 3 2 1 232.4 47.3247 1610.4 64.1387 68.1 36.662920 3 1 3 2 2 233.2 47.3546 1630.6 64.2469 67.2 36.547421 3 1 3 2 3 234.2 47.3917 1600.1 64.0829 67.5 36.586122 3 2 1 3 1 232.6 47.3322 1610.9 64.1414 68.8 36.751823 3 2 1 3 2 233.4 47.3620 1590.3 64.0296 65.2 36.285024 3 2 1 3 3 232.7 47.3359 1610.7 64.1403 64.3 36.164225 3 3 2 1 1 230.2 47.2421 1580.4 63.9753 68.6 36.726526 3 3 2 1 2 230.6 47.2572 1560.8 63.8669 67.7 36.611827 3 3 2 1 3 232.8 47.3397 1580.6 63.9764 68.2 36.6757
2.3. Measurements
The physical tests on the fabrics were performed at 65% relative humidity and 20 ◦C usingstandard test procedures. The crease recovery of the fabric samples was assessed by the AmericanAssociation of Textile Chemists and Colorists (AATCC) Test Method 128-1974 [22]. For the tearing test,an intensity tearing tester (Elmendorf type) was used according to the ASTM D1424 standard [23].The whiteness index (WI) was measured according to the ASTM Test Method E 313 [24] using aHUNTER Lab D25 made in the (11491 Sunset Hills Rd, Reston, VA 20190, USA). The mean values ofthe results were used for the statistical analyses.
2.4. Taguchi Approach
Genichi Taguchi [25] developed a method based on an OA of experiments, which results in alower variance for the experiment to determine the optimum settings of the processing parameters.In order to evaluate the processing parameters, the Taguchi method uses the signal-to-noise (S/N) ratioas a performance criterion or quality index expressed in decibels (dB). The S/N ratio is a logarithmicfunction of the desired output that serves as an objective function for the optimization. The S/N ratiois the ratio of the mean (signal) to the standard deviation (noise). This ratio is a measure of robustnessused to identify the parameters that reduce the variability in a product or process by minimizing theeffects of uncontrollable factors. There are three types of S/N ratios, that are the-lower-the-better,the-higher-the–better, and the-nominal-the-better. A higher S/N ratio represents a better productquality. The concept is to maximize the S/N ratio by minimizing the effect of the random noisefactors, which have an important impact on the process performance [26]. The S/N ratio with alower-the-better characteristic, with a higher-the-better characteristic, and with a nominal-the-bettercharacteristic can be expressed as in Equations (1)–(3), respectively.
S/N = −10 log(
1n ∑n
i=1 y2i
)(1)
S/N = −10 log
(1n ∑n
i=11y2
i
)(2)
SN
= 10 log
(y2
s2
)(3)
where yi is the ith experiments in orthogonal array, n is the total number of the tests, y2 is the averageof data observed and s2 the variation.
Materials 2018, 11, 426 5 of 19
2.5. Crease Recovery Angle
The Taguchi technique for determining the optimal settings of the processing parameters focusesonly on a single response. However, in many cases, multiple quality characteristics need to beidentified. In addition, the manufacturer has to produce items and maintain a balance between quantityand quality with minimum production costs to earn a maximum profit; therefore, the optimizationof multiple quality characteristics is required. The GRA is well suited for this approach since amathematical technique optimizes two or more quality characteristics. The GRA approach is based onthe calculation of the GRGs, which represent the level of correlation between the reference sequenceand the comparability sequence of multiple performance characteristics. If two sequences are identical,the value of the GRG is equal to 1. Hence, the higher the GRG value, the better the correspondingmultiple performance characteristics are.
2.6. Data Pre-Processing
In GRA, the function n of the factors is neglected when the range of the sequence or the standardvalue is large. However, if the factors, goals, and directions are different, the GRA might produceincorrect results. Therefore, one has to pre-process the data that are related to a group of sequences,which is called the grey relational generation’ [27]. Data pre-processing consists of transferringthe original sequence to a comparable sequence. It is required because the ranges and units maydiffer for different data sequences. This is also necessary when the directions of the target in thesequence are different. For this purpose, the experimental results were normalized to a range betweenzero and one. Depending on the response of the data sequence, i.e., either the-larger-the-better orthe-smaller-the-better, there are various methodologies of GRA data pre-processing that have beensuggested by researchers [28]. For the larger-the-better characteristic, the sequence can be normalizedas in Equation (4).
xi∗(k) =
yi(k)− min yi(k)max yi(k)− min yi(k)
(4)
where xi* (k) is the sequence after data pre-processing and yi (k) is the original sequence of the meanvalue of the responses; k = 1 for the responses; i is for the experiment number.
2.7. Calculating the Grey Relational Coefficient and GRG
After the normalization, the deviation sequence is the next step in the GRA and is computedusing Equation (5). The grey relational coefficient is calculated to determine the relationship betweenthe optimal and the actual normalized results and is expressed as in Equation (6) [29].
∆0i (k) = |x0* (k) − xi* (k)| (5)
ξi(k) =∆min + Ψ∆max
∆0i(k) + Ψ∆max(6)
where ∆0i(k) is the deviation sequence of the reference sequence x0* (k) and the comparability sequencexi* (k) and Ψ is a distinguishing coefficient, 0 ≤ Ψ ≤ 1. The value of Ψ is set to 0.5 to maintainequal weights for all parameters. Based on the grey relational coefficients of each response variable,the GRG γi is obtained by averaging the grey relational coefficient corresponding to each experiment(Equation (7)). The overall evaluation of the multiple performance characteristics is based on the GRG.
γi =1n ∑0
i=1 ξi(k) (7)
where γi is the GRG for the ith experiment and n is the number of performance characteristics. The nextstep is the prediction and verification of the quality characteristics using the optimal level of the designparameters. The predicted GRG is calculated using Equation (8).
Materials 2018, 11, 426 6 of 19
γpredicted = γm + ∑qi=1(γi − γm) (8)
where γm is the mean GRG, γi is the GRG at the optimal level, and q is the number of processparameters that affect the responses.
2.8. ANOVA
The ANOVA is a statistical approach to analyze the influence of selected factors on the outputresponse and distributed the variability of the response variables among the available factors. In manytypes of analyses, it is necessary to identify the parameters that are responsible for a wide variationin the output responses and to quantify the variation. This technique is applied for evaluatingthe differences between the available factors and is also used to quantify the chosen parameterscontribution towards the output [30]. The percent of the contribution of the process parametersto the total sum of the squared deviations was used to evaluate the importance of the parameterchanges on the performance characteristics. In addition, an F test was also used to determine whichprocess parameters had a significant effect on the performance characteristics. The change in theprocess parameter has a significant effect on the performance characteristic when the F-value islarge. The inferences derived from the ANOVA table are used to identify which input parameters areresponsible for changes in the process performance; by controlling these parameters, the process canbe improved. In this technique, more importance is placed on data variance than data analysis [31].
2.9. Characterization
In order to confirm the presence of the non-formaldehyde finish on the cotton fabric, Fourier-transform infrared (FTIR) measurements were performed with a Bruker Tensor 27 (Bremen, Germany)spectrometer in normal transmission mode. The thermal stability of the cotton fabrics was analyzed bythermogravimetric analysis (TGA) using a thermogravimetric analyzer (STA-449C; Netsch InstrumentCo., Ltd., Selb, Germany). The surface morphological structures of samples were characterized byusing scanning electron microscope (Hitachi S-4700 SEM, JEOL Ltd., Tokyo, Japan).
3. Results and Discussion
The GRA coupled with the Taguchi method requires the conversion of the experimental data toS/N ratio values. In this study, the crease recovery angle (CRA), tearing strength (TE), and whitenessindex (WI) of the resin finished fabric were analyzed to determine the effect of the resin finishingprocess parameters. The experimental results were transformed into S/N ratios using the Minitabstatistical software and the approach is reported step-by-step. According to the Taguchi’s method,“the larger-the-better analysis” was selected for investigating the effects of the factors on the responses,meaning that the higher the value, the better the response is. This section has two sub-sections. The firstsub-section describes the results of the Taguchi method experiments and the second sub-sectiondescribes the results of the GRA.
3.1. Effect of Process Parameters on the CRA
Creases are characterized as the fabric’s distortions due to its viscoelastic properties. More specifically,the ability to withstand the breaking and re-formation of the hydrogen bonds in the amorphous regionsof the cotton fibers plays a role in determining the crease formation and crease resistance propertiesof the fabrics. This kind of deformation not only has undesirable effects on the fabrics’ appearancebut also results in lower fabric wear quality [32]. In order to determine the effects of the processparameters on the CRA, experiments were conducted using the L27 OA (Table 2). The experimentaldata and S/N ratios of the crease recovery test of the fabrics are shown in Table 2. The response tablefor the S/N ratio results of the CRA for the resin finished fabrics is given in Table 3. It helps to analyzethe effect of the control factors based on the delta statistics. The delta statistics are defined as the
Materials 2018, 11, 426 7 of 19
highest average value minus the lowest average value of the individual factors and the delta ranks areassigned based on these values; a higher delta value represents rank 1, the second highest representsrank 2, etc. This analysis helps to obtain more data about the process under investigation and thehighest delta value represents the most influential factor on the CRA. The results indicate that the resinconcentration has the strongest effect on the CRA with a delta value of 0.57. The curing temperature isthe second most important factor with a delta value of 0.17, followed by the softener, the curing time,and the catalyst with delta values of 0.13, 0.12, and 0.03, respectively.
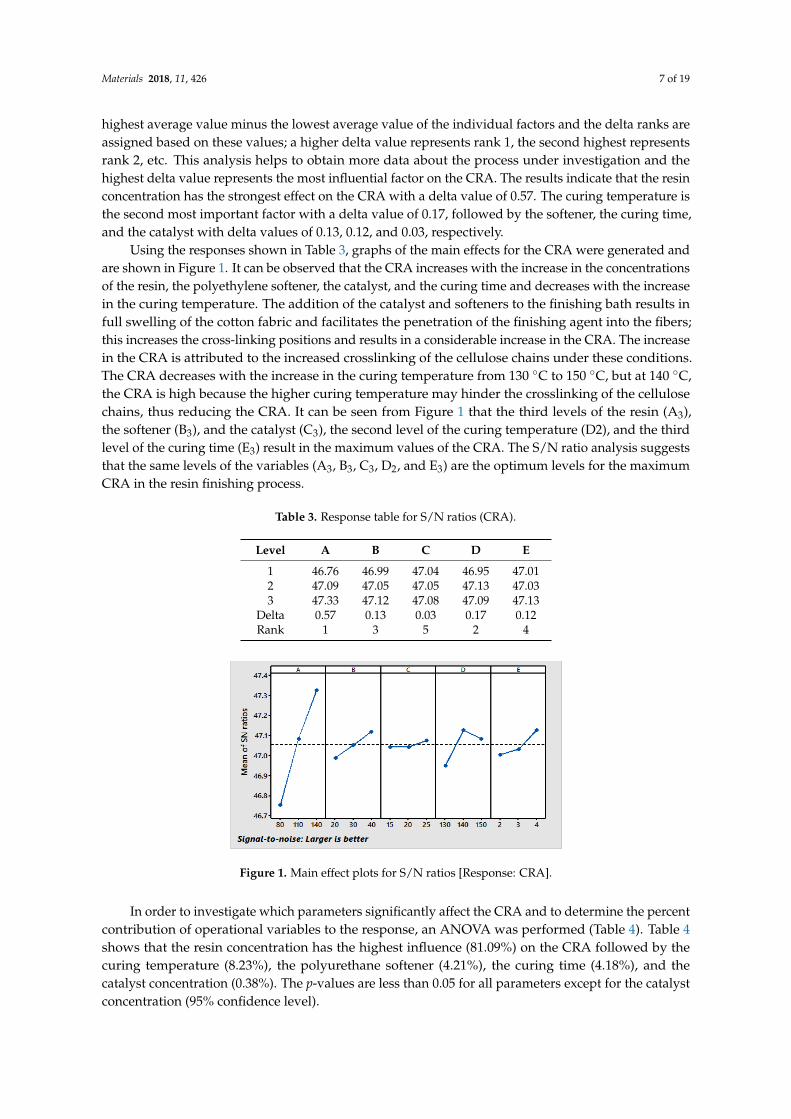
Using the responses shown in Table 3, graphs of the main effects for the CRA were generated andare shown in Figure 1. It can be observed that the CRA increases with the increase in the concentrationsof the resin, the polyethylene softener, the catalyst, and the curing time and decreases with the increasein the curing temperature. The addition of the catalyst and softeners to the finishing bath results infull swelling of the cotton fabric and facilitates the penetration of the finishing agent into the fibers;this increases the cross-linking positions and results in a considerable increase in the CRA. The increasein the CRA is attributed to the increased crosslinking of the cellulose chains under these conditions.The CRA decreases with the increase in the curing temperature from 130 ◦C to 150 ◦C, but at 140 ◦C,the CRA is high because the higher curing temperature may hinder the crosslinking of the cellulosechains, thus reducing the CRA. It can be seen from Figure 1 that the third levels of the resin (A3),the softener (B3), and the catalyst (C3), the second level of the curing temperature (D2), and the thirdlevel of the curing time (E3) result in the maximum values of the CRA. The S/N ratio analysis suggeststhat the same levels of the variables (A3, B3, C3, D2, and E3) are the optimum levels for the maximumCRA in the resin finishing process.
Table 3. Response table for S/N ratios (CRA).
Level A B C D E
1 46.76 46.99 47.04 46.95 47.012 47.09 47.05 47.05 47.13 47.033 47.33 47.12 47.08 47.09 47.13
Delta 0.57 0.13 0.03 0.17 0.12Rank 1 3 5 2 4
Materials 2018, 11, x FOR PEER REVIEW 7 of 19
with the increase in the curing temperature. The addition of the catalyst and softeners to the finishing bath results in full swelling of the cotton fabric and facilitates the penetration of the finishing agent into the fibers; this increases the cross-linking positions and results in a considerable increase in the CRA. The increase in the CRA is attributed to the increased crosslinking of the cellulose chains under these conditions. The CRA decreases with the increase in the curing temperature from 130 °C to 150 °C, but at 140 °C, the CRA is high because the higher curing temperature may hinder the crosslinking of the cellulose chains, thus reducing the CRA. It can be seen from Figure 1 that the third levels of the resin (A3), the softener (B3), and the catalyst (C3), the second level of the curing temperature (D2), and the third level of the curing time (E3) result in the maximum values of the CRA. The S/N ratio analysis suggests that the same levels of the variables (A3, B3, C3, D2, and E3) are the optimum levels for the maximum CRA in the resin finishing process.
Table 3. Response table for S/N ratios (CRA).
Level A B C D E1 46.76 46.99 47.04 46.95 47.01 2 47.09 47.05 47.05 47.13 47.03 3 47.33 47.12 47.08 47.09 47.13
Delta 0.57 0.13 0.03 0.17 0.12 Rank 1 3 5 2 4
Figure 1. Main effect plots for S/N ratios [Response: CRA].
In order to investigate which parameters significantly affect the CRA and to determine the percent contribution of operational variables to the response, an ANOVA was performed (Table 4). Table 4 shows that the resin concentration has the highest influence (81.09%) on the CRA followed by the curing temperature (8.23%), the polyurethane softener (4.21%), the curing time (4.18%), and the catalyst concentration (0.38%). The p-values are less than 0.05 for all parameters except for the catalyst concentration (95% confidence level).
Table 4. ANOVA for S/N ratio (CRA).
Source DF SS MS F p Remarks P (%) A 2 1.47805 0.739025 340.36 0.000 significant 81.09 B 2 0.07667 0.038333 17.65 0.000 significant 4.21 C 2 0.00694 0.003468 1.60 0.233 not significant 0.38 D 2 0.15002 0.075012 34.55 0.000 significant 8.23 E 2 0.07624 0.038122 17.56 0.000 significant 4.18
Residual Error 16 0.03474 0.002171 1.91 Total 26 1.82266
Figure 1. Main effect plots for S/N ratios [Response: CRA].
In order to investigate which parameters significantly affect the CRA and to determine the percentcontribution of operational variables to the response, an ANOVA was performed (Table 4). Table 4shows that the resin concentration has the highest influence (81.09%) on the CRA followed by thecuring temperature (8.23%), the polyurethane softener (4.21%), the curing time (4.18%), and thecatalyst concentration (0.38%). The p-values are less than 0.05 for all parameters except for the catalystconcentration (95% confidence level).
Materials 2018, 11, 426 8 of 19
Table 4. ANOVA for S/N ratio (CRA).
Source DF SS MS F p Remarks P (%)
A 2 1.47805 0.739025 340.36 0.000 significant 81.09B 2 0.07667 0.038333 17.65 0.000 significant 4.21C 2 0.00694 0.003468 1.60 0.233 not significant 0.38D 2 0.15002 0.075012 34.55 0.000 significant 8.23E 2 0.07624 0.038122 17.56 0.000 significant 4.18
Residual Error 16 0.03474 0.002171 1.91Total 26 1.82266
3.2. Effect of Processing Parameters on the TE
The TE is one of the important aspects of a finished fabric. It refers to the thread-by-thread ruptureof a fabric along a line. The measurement of the TE is a widely used parameter in today’s garmentindustry because it is a measure of the serviceability of the fabric [33]. Due to the importance of thiscriterion, research on predicting the tear force in the fabric is important to understand this complexphenomenon. However, durable press finishing adversely affects the TE of woven cotton fabrics [34].As a result, it is worth to investigate the relationship between the durable press performance and theTE of the woven cotton fabrics. In order to determine the effects of the processing parameters on theTE, experiments were conducted using the L27 OA (Table 2). The experimental data and the S/N ratiosof the TE of the fabrics are shown in Table 2. According to Taguchi’s method, “the larger-the-betteranalysis” was selected for investigating the effects of the factors on the fabrics’ TE performance;a higher TE is better. The response table for the SN ratio analysis of the TE of the resin finished fabricsis given in Table 5. The results indicate that the resin concentration has the strongest effect on the TEwith a delta value of 0.56. The catalyst concentration is the most second important factor with a deltavalue of 0.10, followed by the curing time, curing temperature, and softener with delta values of 0.08,0.07, and 0.06, respectively.
Table 5. Response table for the S/N ratios (TE).
Level A B C D E
1 64.62 64.40 64.37 64.34 64.422 64.46 64.40 64.34 64.40 64.393 64.07 64.34 64.44 64.41 64.34
Delta 0.56 0.06 0.10 0.07 0.08Rank 1 5 2 4 3
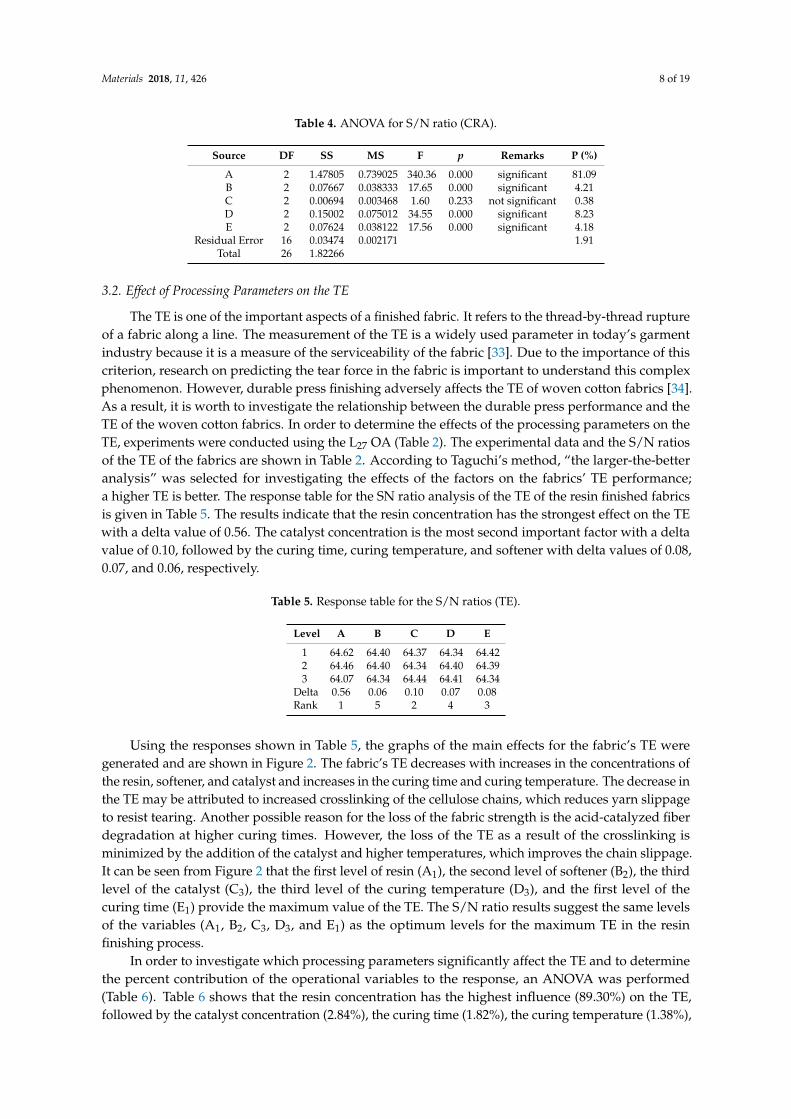
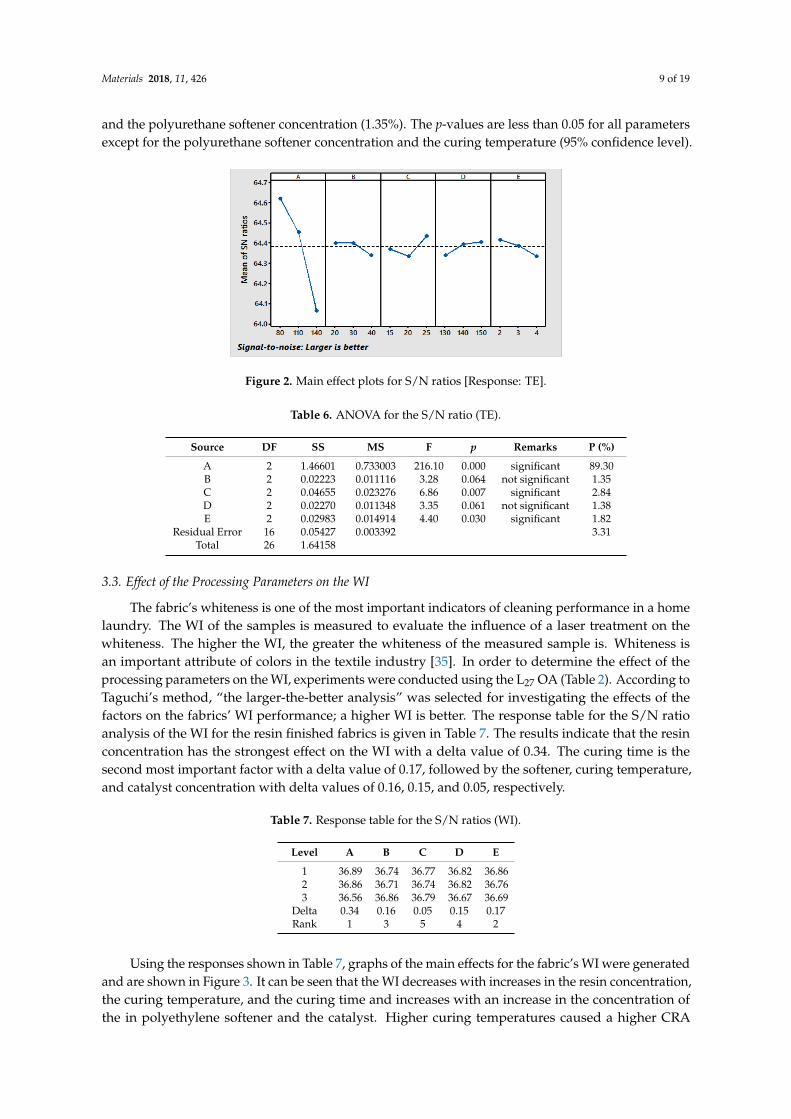
Using the responses shown in Table 5, the graphs of the main effects for the fabric’s TE weregenerated and are shown in Figure 2. The fabric’s TE decreases with increases in the concentrations ofthe resin, softener, and catalyst and increases in the curing time and curing temperature. The decrease inthe TE may be attributed to increased crosslinking of the cellulose chains, which reduces yarn slippageto resist tearing. Another possible reason for the loss of the fabric strength is the acid-catalyzed fiberdegradation at higher curing times. However, the loss of the TE as a result of the crosslinking isminimized by the addition of the catalyst and higher temperatures, which improves the chain slippage.It can be seen from Figure 2 that the first level of resin (A1), the second level of softener (B2), the thirdlevel of the catalyst (C3), the third level of the curing temperature (D3), and the first level of thecuring time (E1) provide the maximum value of the TE. The S/N ratio results suggest the same levelsof the variables (A1, B2, C3, D3, and E1) as the optimum levels for the maximum TE in the resinfinishing process.
In order to investigate which processing parameters significantly affect the TE and to determinethe percent contribution of the operational variables to the response, an ANOVA was performed(Table 6). Table 6 shows that the resin concentration has the highest influence (89.30%) on the TE,followed by the catalyst concentration (2.84%), the curing time (1.82%), the curing temperature (1.38%),
Materials 2018, 11, 426 9 of 19
and the polyurethane softener concentration (1.35%). The p-values are less than 0.05 for all parametersexcept for the polyurethane softener concentration and the curing temperature (95% confidence level).
Materials 2018, 11, x FOR PEER REVIEW 8 of 19
3.2. Effect of Processing Parameters on the TE
The TE is one of the important aspects of a finished fabric. It refers to the thread-by-thread rupture of a fabric along a line. The measurement of the TE is a widely used parameter in today’s garment industry because it is a measure of the serviceability of the fabric [33]. Due to the importance of this criterion, research on predicting the tear force in the fabric is important to understand this complex phenomenon. However, durable press finishing adversely affects the TE of woven cotton fabrics [34]. As a result, it is worth to investigate the relationship between the durable press performance and the TE of the woven cotton fabrics. In order to determine the effects of the processing parameters on the TE, experiments were conducted using the L27 OA (Table 2). The experimental data and the S/N ratios of the TE of the fabrics are shown in Table 2. According to Taguchi’s method, “the larger-the-better analysis” was selected for investigating the effects of the factors on the fabrics’ TE performance; a higher TE is better. The response table for the SN ratio analysis of the TE of the resin finished fabrics is given in Table 5. The results indicate that the resin concentration has the strongest effect on the TE with a delta value of 0.56. The catalyst concentration is the most second important factor with a delta value of 0.10, followed by the curing time, curing temperature, and softener with delta values of 0.08, 0.07, and 0.06, respectively.
Table 5. Response table for the S/N ratios (TE).
Level A B C D E1 64.62 64.40 64.37 64.34 64.42 2 64.46 64.40 64.34 64.40 64.39 3 64.07 64.34 64.44 64.41 64.34
Delta 0.56 0.06 0.10 0.07 0.08 Rank 1 5 2 4 3
Using the responses shown in Table 5, the graphs of the main effects for the fabric’s TE were generated and are shown in Figure 2. The fabric’s TE decreases with increases in the concentrations of the resin, softener, and catalyst and increases in the curing time and curing temperature. The decrease in the TE may be attributed to increased crosslinking of the cellulose chains, which reduces yarn slippage to resist tearing. Another possible reason for the loss of the fabric strength is the acid-catalyzed fiber degradation at higher curing times. However, the loss of the TE as a result of the crosslinking is minimized by the addition of the catalyst and higher temperatures, which improves the chain slippage. It can be seen from Figure 2 that the first level of resin (A1), the second level of softener (B2), the third level of the catalyst (C3), the third level of the curing temperature (D3), and the first level of the curing time (E1) provide the maximum value of the TE. The S/N ratio results suggest the same levels of the variables (A1, B2, C3, D3, and E1) as the optimum levels for the maximum TE in the resin finishing process.
Figure 2. Main effect plots for S/N ratios [Response: TE]. Figure 2. Main effect plots for S/N ratios [Response: TE].
Table 6. ANOVA for the S/N ratio (TE).
Source DF SS MS F p Remarks P (%)
A 2 1.46601 0.733003 216.10 0.000 significant 89.30B 2 0.02223 0.011116 3.28 0.064 not significant 1.35C 2 0.04655 0.023276 6.86 0.007 significant 2.84D 2 0.02270 0.011348 3.35 0.061 not significant 1.38E 2 0.02983 0.014914 4.40 0.030 significant 1.82
Residual Error 16 0.05427 0.003392 3.31Total 26 1.64158
3.3. Effect of the Processing Parameters on the WI
The fabric’s whiteness is one of the most important indicators of cleaning performance in a homelaundry. The WI of the samples is measured to evaluate the influence of a laser treatment on thewhiteness. The higher the WI, the greater the whiteness of the measured sample is. Whiteness isan important attribute of colors in the textile industry [35]. In order to determine the effect of theprocessing parameters on the WI, experiments were conducted using the L27 OA (Table 2). According toTaguchi’s method, “the larger-the-better analysis” was selected for investigating the effects of thefactors on the fabrics’ WI performance; a higher WI is better. The response table for the S/N ratioanalysis of the WI for the resin finished fabrics is given in Table 7. The results indicate that the resinconcentration has the strongest effect on the WI with a delta value of 0.34. The curing time is thesecond most important factor with a delta value of 0.17, followed by the softener, curing temperature,and catalyst concentration with delta values of 0.16, 0.15, and 0.05, respectively.
Table 7. Response table for the S/N ratios (WI).
Level A B C D E
1 36.89 36.74 36.77 36.82 36.862 36.86 36.71 36.74 36.82 36.763 36.56 36.86 36.79 36.67 36.69
Delta 0.34 0.16 0.05 0.15 0.17Rank 1 3 5 4 2
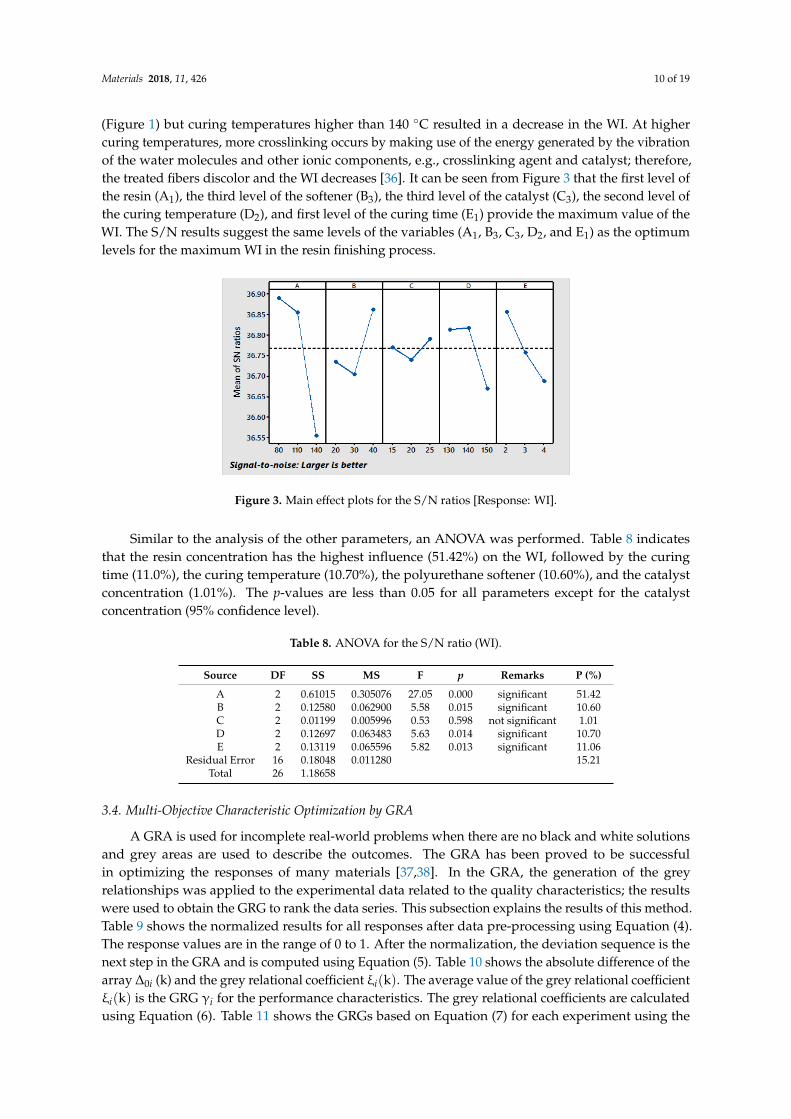
Using the responses shown in Table 7, graphs of the main effects for the fabric’s WI were generatedand are shown in Figure 3. It can be seen that the WI decreases with increases in the resin concentration,the curing temperature, and the curing time and increases with an increase in the concentration ofthe in polyethylene softener and the catalyst. Higher curing temperatures caused a higher CRA
Materials 2018, 11, 426 10 of 19
(Figure 1) but curing temperatures higher than 140 ◦C resulted in a decrease in the WI. At highercuring temperatures, more crosslinking occurs by making use of the energy generated by the vibrationof the water molecules and other ionic components, e.g., crosslinking agent and catalyst; therefore,the treated fibers discolor and the WI decreases [36]. It can be seen from Figure 3 that the first level ofthe resin (A1), the third level of the softener (B3), the third level of the catalyst (C3), the second level ofthe curing temperature (D2), and first level of the curing time (E1) provide the maximum value of theWI. The S/N results suggest the same levels of the variables (A1, B3, C3, D2, and E1) as the optimumlevels for the maximum WI in the resin finishing process.
Materials 2018, 11, x FOR PEER REVIEW 10 of 19
maximum value of the WI. The S/N results suggest the same levels of the variables (A1, B3, C3, D2, and E1) as the optimum levels for the maximum WI in the resin finishing process.
Figure 3. Main effect plots for the S/N ratios [Response: WI].
Similar to the analysis of the other parameters, an ANOVA was performed. Table 8 indicates that the resin concentration has the highest influence (51.42%) on the WI, followed by the curing time (11.0%), the curing temperature (10.70%), the polyurethane softener (10.60%), and the catalyst concentration (1.01%). The p-values are less than 0.05 for all parameters except for the catalyst concentration (95% confidence level).
Table 8. ANOVA for the S/N ratio (WI).
Source DF SS MS F p Remarks P (%) A 2 0.61015 0.305076 27.05 0.000 significant 51.42 B 2 0.12580 0.062900 5.58 0.015 significant 10.60 C 2 0.01199 0.005996 0.53 0.598 not significant 1.01 D 2 0.12697 0.063483 5.63 0.014 significant 10.70 E 2 0.13119 0.065596 5.82 0.013 significant 11.06
Residual Error 16 0.18048 0.011280 15.21 Total 26 1.18658
3.4. Multi-Objective Characteristic Optimization by GRA
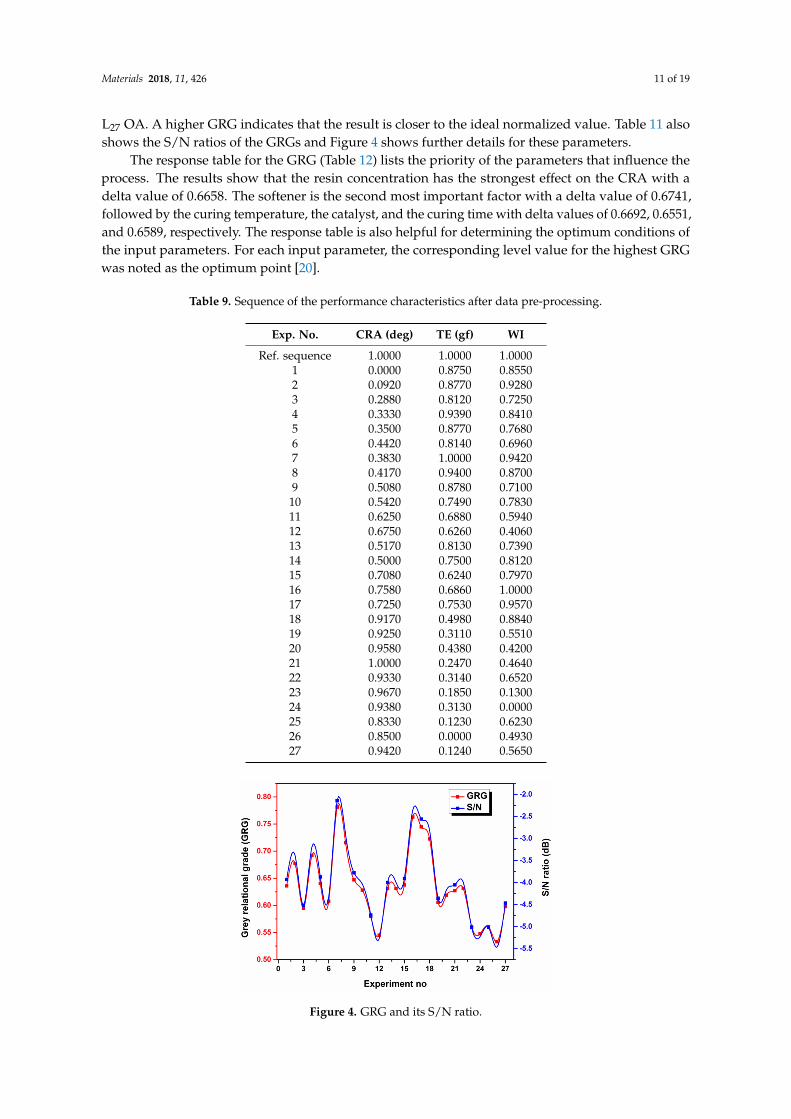
A GRA is used for incomplete real-world problems when there are no black and white solutions and grey areas are used to describe the outcomes. The GRA has been proved to be successful in optimizing the responses of many materials [37,38]. In the GRA, the generation of the grey relationships was applied to the experimental data related to the quality characteristics; the results were used to obtain the GRG to rank the data series. This subsection explains the results of this method. Table 9 shows the normalized results for all responses after data pre-processing using Equation (4). The response values are in the range of 0 to 1. After the normalization, the deviation sequence is the next step in the GRA and is computed using Equation (5). Table 10 shows the absolute difference of the array Δ0i (k) and the grey relational coefficient ξ (k). The average value of the grey relational coefficient ξ (k) is the GRG γ for the performance characteristics. The grey relational coefficients are calculated using Equation (6). Table 11 shows the GRGs based on Equation (7) for each experiment using the L27 OA. A higher GRG indicates that the result is closer to the ideal normalized value. Table 11 also shows the S/N ratios of the GRGs and Figure 4 shows further details for these parameters.
The response table for the GRG (Table 12) lists the priority of the parameters that influence the process. The results show that the resin concentration has the strongest effect on the CRA with a delta value of 0.6658. The softener is the second most important factor with a delta value of 0.6741, followed by the curing temperature, the catalyst, and the curing time with delta values of 0.6692, 0.6551, and
Figure 3. Main effect plots for the S/N ratios [Response: WI].
Similar to the analysis of the other parameters, an ANOVA was performed. Table 8 indicatesthat the resin concentration has the highest influence (51.42%) on the WI, followed by the curingtime (11.0%), the curing temperature (10.70%), the polyurethane softener (10.60%), and the catalystconcentration (1.01%). The p-values are less than 0.05 for all parameters except for the catalystconcentration (95% confidence level).
Table 8. ANOVA for the S/N ratio (WI).
Source DF SS MS F p Remarks P (%)
A 2 0.61015 0.305076 27.05 0.000 significant 51.42B 2 0.12580 0.062900 5.58 0.015 significant 10.60C 2 0.01199 0.005996 0.53 0.598 not significant 1.01D 2 0.12697 0.063483 5.63 0.014 significant 10.70E 2 0.13119 0.065596 5.82 0.013 significant 11.06
Residual Error 16 0.18048 0.011280 15.21Total 26 1.18658
3.4. Multi-Objective Characteristic Optimization by GRA
A GRA is used for incomplete real-world problems when there are no black and white solutionsand grey areas are used to describe the outcomes. The GRA has been proved to be successfulin optimizing the responses of many materials [37,38]. In the GRA, the generation of the greyrelationships was applied to the experimental data related to the quality characteristics; the resultswere used to obtain the GRG to rank the data series. This subsection explains the results of this method.Table 9 shows the normalized results for all responses after data pre-processing using Equation (4).The response values are in the range of 0 to 1. After the normalization, the deviation sequence is thenext step in the GRA and is computed using Equation (5). Table 10 shows the absolute difference of thearray ∆0i (k) and the grey relational coefficient ξi(k). The average value of the grey relational coefficientξi(k) is the GRG γi for the performance characteristics. The grey relational coefficients are calculatedusing Equation (6). Table 11 shows the GRGs based on Equation (7) for each experiment using the
Materials 2018, 11, 426 11 of 19
L27 OA. A higher GRG indicates that the result is closer to the ideal normalized value. Table 11 alsoshows the S/N ratios of the GRGs and Figure 4 shows further details for these parameters.
The response table for the GRG (Table 12) lists the priority of the parameters that influence theprocess. The results show that the resin concentration has the strongest effect on the CRA with adelta value of 0.6658. The softener is the second most important factor with a delta value of 0.6741,followed by the curing temperature, the catalyst, and the curing time with delta values of 0.6692, 0.6551,and 0.6589, respectively. The response table is also helpful for determining the optimum conditions ofthe input parameters. For each input parameter, the corresponding level value for the highest GRGwas noted as the optimum point [20].
Table 9. Sequence of the performance characteristics after data pre-processing.
Exp. No. CRA (deg) TE (gf) WI
Ref. sequence 1.0000 1.0000 1.00001 0.0000 0.8750 0.85502 0.0920 0.8770 0.92803 0.2880 0.8120 0.72504 0.3330 0.9390 0.84105 0.3500 0.8770 0.76806 0.4420 0.8140 0.69607 0.3830 1.0000 0.94208 0.4170 0.9400 0.87009 0.5080 0.8780 0.7100
10 0.5420 0.7490 0.783011 0.6250 0.6880 0.594012 0.6750 0.6260 0.406013 0.5170 0.8130 0.739014 0.5000 0.7500 0.812015 0.7080 0.6240 0.797016 0.7580 0.6860 1.000017 0.7250 0.7530 0.957018 0.9170 0.4980 0.884019 0.9250 0.3110 0.551020 0.9580 0.4380 0.420021 1.0000 0.2470 0.464022 0.9330 0.3140 0.652023 0.9670 0.1850 0.130024 0.9380 0.3130 0.000025 0.8330 0.1230 0.623026 0.8500 0.0000 0.493027 0.9420 0.1240 0.5650
Materials 2018, 11, x FOR PEER REVIEW 11 of 19
0.6589, respectively. The response table is also helpful for determining the optimum conditions of the input parameters. For each input parameter, the corresponding level value for the highest GRG was noted as the optimum point [20].
Table 9. Sequence of the performance characteristics after data pre-processing.
Exp. No. CRA (deg) TE (gf) WIRef. sequence 1.0000 1.0000 1.0000
1 0.0000 0.8750 0.8550 2 0.0920 0.8770 0.9280 3 0.2880 0.8120 0.7250 4 0.3330 0.9390 0.8410 5 0.3500 0.8770 0.7680 6 0.4420 0.8140 0.6960 7 0.3830 1.0000 0.9420 8 0.4170 0.9400 0.8700 9 0.5080 0.8780 0.7100
10 0.5420 0.7490 0.7830 11 0.6250 0.6880 0.5940 12 0.6750 0.6260 0.4060 13 0.5170 0.8130 0.7390 14 0.5000 0.7500 0.8120 15 0.7080 0.6240 0.7970 16 0.7580 0.6860 1.0000 17 0.7250 0.7530 0.9570 18 0.9170 0.4980 0.8840 19 0.9250 0.3110 0.5510 20 0.9580 0.4380 0.4200 21 1.0000 0.2470 0.4640 22 0.9330 0.3140 0.6520 23 0.9670 0.1850 0.1300 24 0.9380 0.3130 0.0000 25 0.8330 0.1230 0.6230 26 0.8500 0.0000 0.4930 27 0.9420 0.1240 0.5650
Figure 4. GRG and its S/N ratio.
Figure 4. GRG and its S/N ratio.
Materials 2018, 11, 426 12 of 19
Table 10. The deviation sequences.
Deviation Sequences ∆0i (1) ∆0i (2) ∆0i (3)
1 1.0000 0.1255 0.14492 0.9083 0.1230 0.07253 0.7125 0.1882 0.27544 0.6667 0.0615 0.15945 0.6500 0.1230 0.23196 0.5583 0.1857 0.30437 0.6167 0.0000 0.05808 0.5833 0.0602 0.13049 0.4917 0.1217 0.2899
10 0.4583 0.2509 0.217411 0.3750 0.3124 0.405812 0.3250 0.3739 0.594213 0.4833 0.1870 0.260914 0.5000 0.2497 0.188415 0.2917 0.3764 0.202916 0.2417 0.3137 0.000017 0.2750 0.2472 0.043518 0.0833 0.5019 0.115919 0.0750 0.6888 0.449320 0.0417 0.5621 0.579721 0.0000 0.7535 0.536222 0.0667 0.6857 0.347823 0.0333 0.8149 0.869624 0.0625 0.6870 1.000025 0.1667 0.8770 0.376826 0.1500 1.0000 0.507227 0.0583 0.8758 0.4348
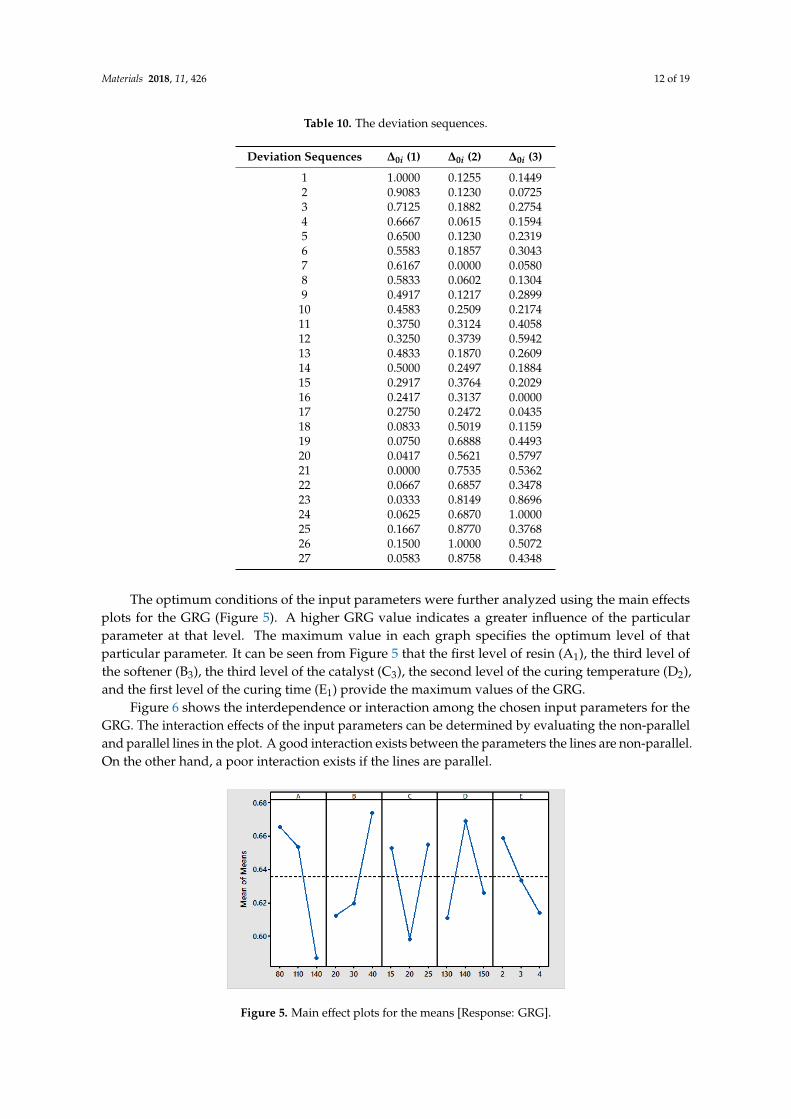
The optimum conditions of the input parameters were further analyzed using the main effectsplots for the GRG (Figure 5). A higher GRG value indicates a greater influence of the particularparameter at that level. The maximum value in each graph specifies the optimum level of thatparticular parameter. It can be seen from Figure 5 that the first level of resin (A1), the third level ofthe softener (B3), the third level of the catalyst (C3), the second level of the curing temperature (D2),and the first level of the curing time (E1) provide the maximum values of the GRG.
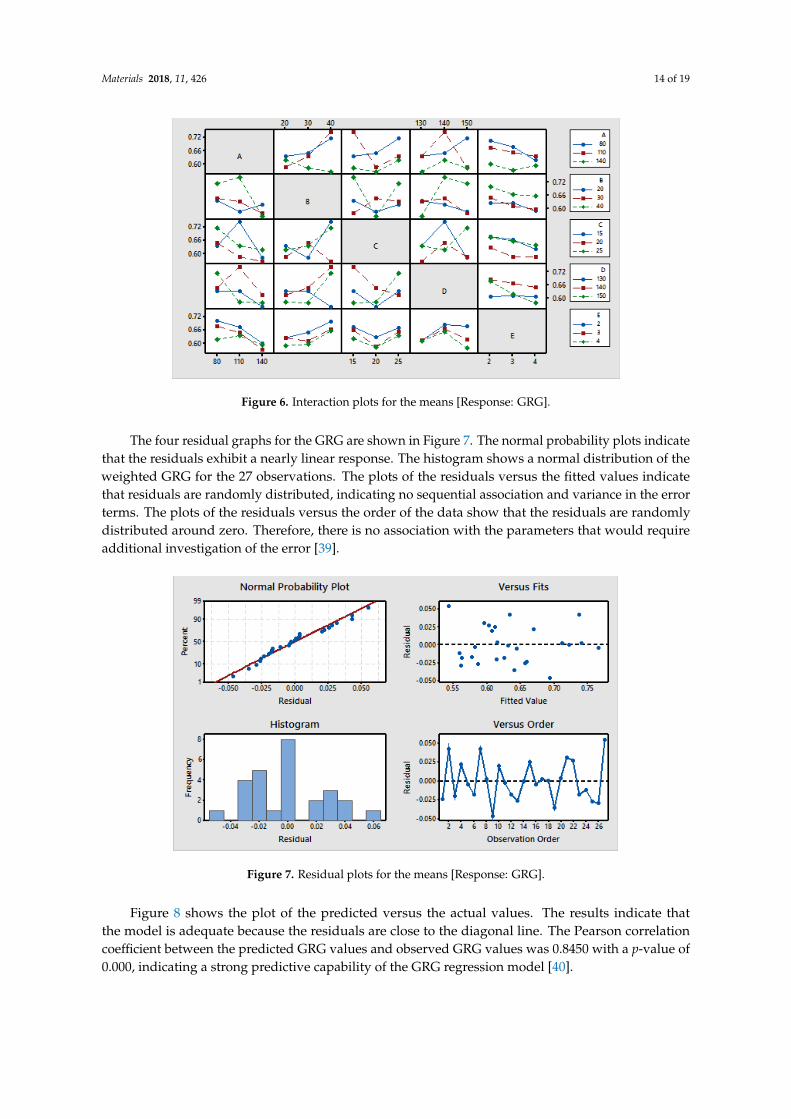
Figure 6 shows the interdependence or interaction among the chosen input parameters for theGRG. The interaction effects of the input parameters can be determined by evaluating the non-paralleland parallel lines in the plot. A good interaction exists between the parameters the lines are non-parallel.On the other hand, a poor interaction exists if the lines are parallel.
Materials 2018, 11, x FOR PEER REVIEW 12 of 19
Table 10. The deviation sequences.
Deviation Sequences Δoi (1) Δoi (2) Δoi (3)1 1.0000 0.1255 0.1449 2 0.9083 0.1230 0.0725 3 0.7125 0.1882 0.2754 4 0.6667 0.0615 0.1594 5 0.6500 0.1230 0.2319 6 0.5583 0.1857 0.3043 7 0.6167 0.0000 0.0580 8 0.5833 0.0602 0.1304 9 0.4917 0.1217 0.2899
10 0.4583 0.2509 0.2174 11 0.3750 0.3124 0.4058 12 0.3250 0.3739 0.5942 13 0.4833 0.1870 0.2609 14 0.5000 0.2497 0.1884 15 0.2917 0.3764 0.2029 16 0.2417 0.3137 0.0000 17 0.2750 0.2472 0.0435 18 0.0833 0.5019 0.1159 19 0.0750 0.6888 0.4493 20 0.0417 0.5621 0.5797 21 0.0000 0.7535 0.5362 22 0.0667 0.6857 0.3478 23 0.0333 0.8149 0.8696 24 0.0625 0.6870 1.0000 25 0.1667 0.8770 0.3768 26 0.1500 1.0000 0.5072 27 0.0583 0.8758 0.4348
The optimum conditions of the input parameters were further analyzed using the main effects plots for the GRG (Figure 5). A higher GRG value indicates a greater influence of the particular parameter at that level. The maximum value in each graph specifies the optimum level of that particular parameter. It can be seen from Figure 5 that the first level of resin (A1), the third level of the softener (B3), the third level of the catalyst (C3), the second level of the curing temperature (D2), and the first level of the curing time (E1) provide the maximum values of the GRG.
Figure 5. Main effect plots for the means [Response: GRG].
Figure 5. Main effect plots for the means [Response: GRG].
Materials 2018, 11, 426 13 of 19
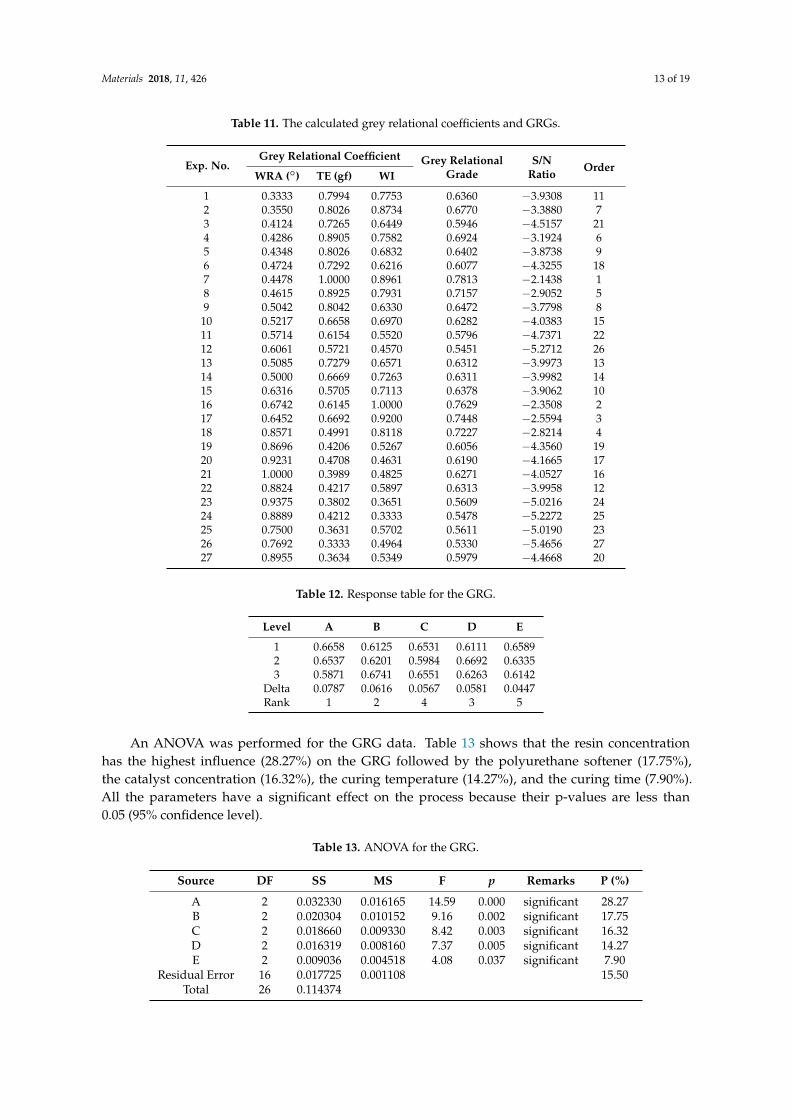
Table 11. The calculated grey relational coefficients and GRGs.
Exp. No.Grey Relational Coefficient Grey Relational
GradeS/N
Ratio OrderWRA (◦) TE (gf) WI
1 0.3333 0.7994 0.7753 0.6360 −3.9308 112 0.3550 0.8026 0.8734 0.6770 −3.3880 73 0.4124 0.7265 0.6449 0.5946 −4.5157 214 0.4286 0.8905 0.7582 0.6924 −3.1924 65 0.4348 0.8026 0.6832 0.6402 −3.8738 96 0.4724 0.7292 0.6216 0.6077 −4.3255 187 0.4478 1.0000 0.8961 0.7813 −2.1438 18 0.4615 0.8925 0.7931 0.7157 −2.9052 59 0.5042 0.8042 0.6330 0.6472 −3.7798 8
10 0.5217 0.6658 0.6970 0.6282 −4.0383 1511 0.5714 0.6154 0.5520 0.5796 −4.7371 2212 0.6061 0.5721 0.4570 0.5451 −5.2712 2613 0.5085 0.7279 0.6571 0.6312 −3.9973 1314 0.5000 0.6669 0.7263 0.6311 −3.9982 1415 0.6316 0.5705 0.7113 0.6378 −3.9062 1016 0.6742 0.6145 1.0000 0.7629 −2.3508 217 0.6452 0.6692 0.9200 0.7448 −2.5594 318 0.8571 0.4991 0.8118 0.7227 −2.8214 419 0.8696 0.4206 0.5267 0.6056 −4.3560 1920 0.9231 0.4708 0.4631 0.6190 −4.1665 1721 1.0000 0.3989 0.4825 0.6271 −4.0527 1622 0.8824 0.4217 0.5897 0.6313 −3.9958 1223 0.9375 0.3802 0.3651 0.5609 −5.0216 2424 0.8889 0.4212 0.3333 0.5478 −5.2272 2525 0.7500 0.3631 0.5702 0.5611 −5.0190 2326 0.7692 0.3333 0.4964 0.5330 −5.4656 2727 0.8955 0.3634 0.5349 0.5979 −4.4668 20
Table 12. Response table for the GRG.
Level A B C D E
1 0.6658 0.6125 0.6531 0.6111 0.65892 0.6537 0.6201 0.5984 0.6692 0.63353 0.5871 0.6741 0.6551 0.6263 0.6142
Delta 0.0787 0.0616 0.0567 0.0581 0.0447Rank 1 2 4 3 5
An ANOVA was performed for the GRG data. Table 13 shows that the resin concentrationhas the highest influence (28.27%) on the GRG followed by the polyurethane softener (17.75%),the catalyst concentration (16.32%), the curing temperature (14.27%), and the curing time (7.90%).All the parameters have a significant effect on the process because their p-values are less than0.05 (95% confidence level).
Table 13. ANOVA for the GRG.
Source DF SS MS F p Remarks P (%)
A 2 0.032330 0.016165 14.59 0.000 significant 28.27B 2 0.020304 0.010152 9.16 0.002 significant 17.75C 2 0.018660 0.009330 8.42 0.003 significant 16.32D 2 0.016319 0.008160 7.37 0.005 significant 14.27E 2 0.009036 0.004518 4.08 0.037 significant 7.90
Residual Error 16 0.017725 0.001108 15.50Total 26 0.114374
Materials 2018, 11, 426 14 of 19
Materials 2018, 11, x FOR PEER REVIEW 14 of 19
Figure 6. Interaction plots for the means [Response: GRG].
Table 13. ANOVA for the GRG.
Source DF SS MS F p Remarks P (%) A 2 0.032330 0.016165 14.59 0.000 significant 28.27 B 2 0.020304 0.010152 9.16 0.002 significant 17.75 C 2 0.018660 0.009330 8.42 0.003 significant 16.32 D 2 0.016319 0.008160 7.37 0.005 significant 14.27 E 2 0.009036 0.004518 4.08 0.037 significant 7.90
Residual Error 16 0.017725 0.001108 15.50 Total 26 0.114374
The four residual graphs for the GRG are shown in Figure 7. The normal probability plots indicate that the residuals exhibit a nearly linear response. The histogram shows a normal distribution of the weighted GRG for the 27 observations. The plots of the residuals versus the fitted values indicate that residuals are randomly distributed, indicating no sequential association and variance in the error terms. The plots of the residuals versus the order of the data show that the residuals are randomly distributed around zero. Therefore, there is no association with the parameters that would require additional investigation of the error [39].
Figure 7. Residual plots for the means [Response: GRG].
Figure 6. Interaction plots for the means [Response: GRG].
The four residual graphs for the GRG are shown in Figure 7. The normal probability plots indicatethat the residuals exhibit a nearly linear response. The histogram shows a normal distribution of theweighted GRG for the 27 observations. The plots of the residuals versus the fitted values indicatethat residuals are randomly distributed, indicating no sequential association and variance in the errorterms. The plots of the residuals versus the order of the data show that the residuals are randomlydistributed around zero. Therefore, there is no association with the parameters that would requireadditional investigation of the error [39].
Materials 2018, 11, x FOR PEER REVIEW 14 of 19
Figure 6. Interaction plots for the means [Response: GRG].
Table 13. ANOVA for the GRG.
Source DF SS MS F p Remarks P (%) A 2 0.032330 0.016165 14.59 0.000 significant 28.27 B 2 0.020304 0.010152 9.16 0.002 significant 17.75 C 2 0.018660 0.009330 8.42 0.003 significant 16.32 D 2 0.016319 0.008160 7.37 0.005 significant 14.27 E 2 0.009036 0.004518 4.08 0.037 significant 7.90
Residual Error 16 0.017725 0.001108 15.50 Total 26 0.114374
The four residual graphs for the GRG are shown in Figure 7. The normal probability plots indicate that the residuals exhibit a nearly linear response. The histogram shows a normal distribution of the weighted GRG for the 27 observations. The plots of the residuals versus the fitted values indicate that residuals are randomly distributed, indicating no sequential association and variance in the error terms. The plots of the residuals versus the order of the data show that the residuals are randomly distributed around zero. Therefore, there is no association with the parameters that would require additional investigation of the error [39].
Figure 7. Residual plots for the means [Response: GRG]. Figure 7. Residual plots for the means [Response: GRG].
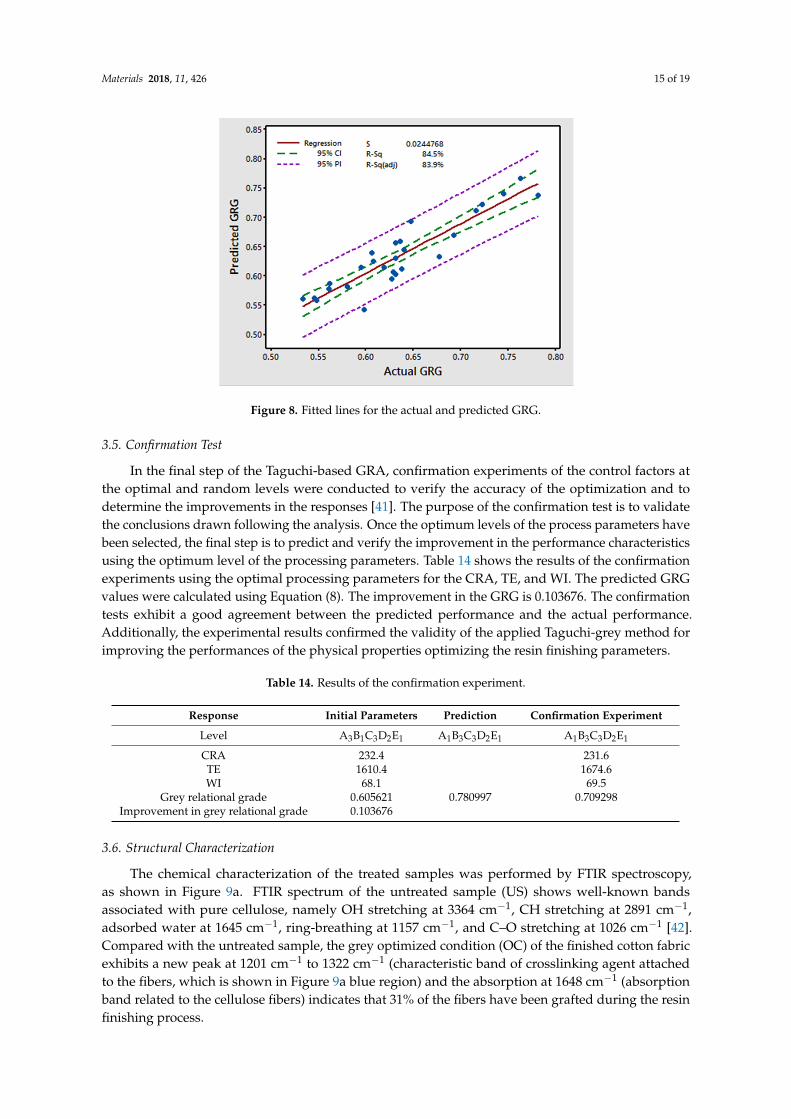
Figure 8 shows the plot of the predicted versus the actual values. The results indicate thatthe model is adequate because the residuals are close to the diagonal line. The Pearson correlationcoefficient between the predicted GRG values and observed GRG values was 0.8450 with a p-value of0.000, indicating a strong predictive capability of the GRG regression model [40].
Materials 2018, 11, 426 15 of 19
Materials 2018, 11, x FOR PEER REVIEW 15 of 19
Figure 8 shows the plot of the predicted versus the actual values. The results indicate that the model is adequate because the residuals are close to the diagonal line. The Pearson correlation coefficient between the predicted GRG values and observed GRG values was 0.8450 with a p-value of 0.000, indicating a strong predictive capability of the GRG regression model [40].
Figure 8. Fitted lines for the actual and predicted GRG.
3.5. Confirmation Test
In the final step of the Taguchi-based GRA, confirmation experiments of the control factors at the optimal and random levels were conducted to verify the accuracy of the optimization and to determine the improvements in the responses [41]. The purpose of the confirmation test is to validate the conclusions drawn following the analysis. Once the optimum levels of the process parameters have been selected, the final step is to predict and verify the improvement in the performance characteristics using the optimum level of the processing parameters. Table 14 shows the results of the confirmation experiments using the optimal processing parameters for the CRA, TE, and WI. The predicted GRG values were calculated using Equation (8). The improvement in the GRG is 0.103676. The confirmation tests exhibit a good agreement between the predicted performance and the actual performance. Additionally, the experimental results confirmed the validity of the applied Taguchi-grey method for improving the performances of the physical properties optimizing the resin finishing parameters.
Table 14. Results of the confirmation experiment.
Response Initial Parameters Prediction Confirmation ExperimentLevel A3B1C3D2E1 A1B3C3D2E1 A1B3C3D2E1 CRA 232.4 231.6 TE 1610.4 1674.6 WI 68.1 69.5
Grey relational grade 0.605621 0.780997 0.709298 Improvement in grey relational grade 0.103676
3.6. Structural Characterization
The chemical characterization of the treated samples was performed by FTIR spectroscopy, as shown in Figure 9a. FTIR spectrum of the untreated sample (US) shows well-known bands associated with pure cellulose, namely OH stretching at 3364 cm−1, CH stretching at 2891 cm−1, adsorbed water at 1645 cm−1, ring-breathing at 1157 cm−1, and C–O stretching at 1026 cm−1 [42]. Compared with the untreated sample, the grey optimized condition (OC) of the finished cotton fabric exhibits a new peak at 1201 cm−1 to 1322 cm−1 (characteristic band of crosslinking agent attached to the fibers, which is
Figure 8. Fitted lines for the actual and predicted GRG.
3.5. Confirmation Test
In the final step of the Taguchi-based GRA, confirmation experiments of the control factors atthe optimal and random levels were conducted to verify the accuracy of the optimization and todetermine the improvements in the responses [41]. The purpose of the confirmation test is to validatethe conclusions drawn following the analysis. Once the optimum levels of the process parameters havebeen selected, the final step is to predict and verify the improvement in the performance characteristicsusing the optimum level of the processing parameters. Table 14 shows the results of the confirmationexperiments using the optimal processing parameters for the CRA, TE, and WI. The predicted GRGvalues were calculated using Equation (8). The improvement in the GRG is 0.103676. The confirmationtests exhibit a good agreement between the predicted performance and the actual performance.Additionally, the experimental results confirmed the validity of the applied Taguchi-grey method forimproving the performances of the physical properties optimizing the resin finishing parameters.
Table 14. Results of the confirmation experiment.
Response Initial Parameters Prediction Confirmation Experiment
Level A3B1C3D2E1 A1B3C3D2E1 A1B3C3D2E1
CRA 232.4 231.6TE 1610.4 1674.6WI 68.1 69.5
Grey relational grade 0.605621 0.780997 0.709298Improvement in grey relational grade 0.103676
3.6. Structural Characterization
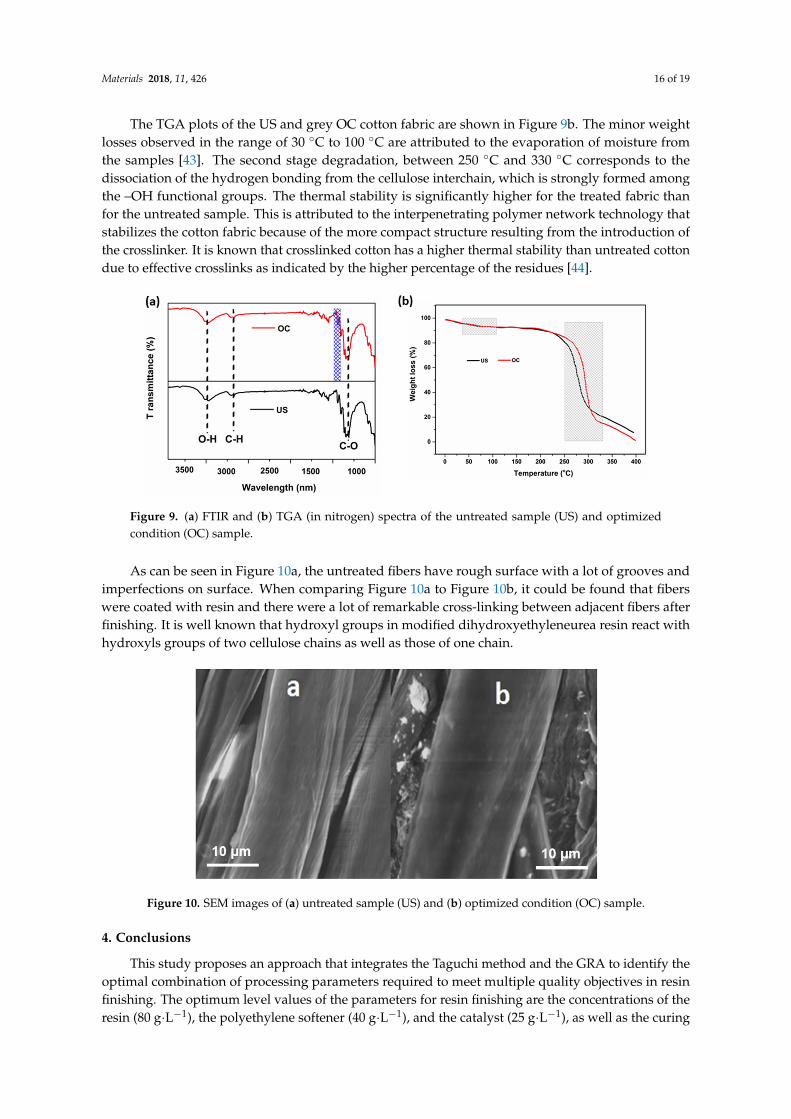
The chemical characterization of the treated samples was performed by FTIR spectroscopy,as shown in Figure 9a. FTIR spectrum of the untreated sample (US) shows well-known bandsassociated with pure cellulose, namely OH stretching at 3364 cm−1, CH stretching at 2891 cm−1,adsorbed water at 1645 cm−1, ring-breathing at 1157 cm−1, and C–O stretching at 1026 cm−1 [42].Compared with the untreated sample, the grey optimized condition (OC) of the finished cotton fabricexhibits a new peak at 1201 cm−1 to 1322 cm−1 (characteristic band of crosslinking agent attachedto the fibers, which is shown in Figure 9a blue region) and the absorption at 1648 cm−1 (absorptionband related to the cellulose fibers) indicates that 31% of the fibers have been grafted during the resinfinishing process.
Materials 2018, 11, 426 16 of 19
The TGA plots of the US and grey OC cotton fabric are shown in Figure 9b. The minor weightlosses observed in the range of 30 ◦C to 100 ◦C are attributed to the evaporation of moisture fromthe samples [43]. The second stage degradation, between 250 ◦C and 330 ◦C corresponds to thedissociation of the hydrogen bonding from the cellulose interchain, which is strongly formed amongthe –OH functional groups. The thermal stability is significantly higher for the treated fabric thanfor the untreated sample. This is attributed to the interpenetrating polymer network technology thatstabilizes the cotton fabric because of the more compact structure resulting from the introduction ofthe crosslinker. It is known that crosslinked cotton has a higher thermal stability than untreated cottondue to effective crosslinks as indicated by the higher percentage of the residues [44].
Materials 2018, 11, x FOR PEER REVIEW 16 of 19
shown in Figure 9a blue region) and the absorption at 1648 cm−1 (absorption band related to the cellulose fibers) indicates that 31% of the fibers have been grafted during the resin finishing process.
The TGA plots of the US and grey OC cotton fabric are shown in Figure 9b. The minor weight losses observed in the range of 30 °C to 100 °C are attributed to the evaporation of moisture from the samples [43]. The second stage degradation, between 250 °C and 330 °C corresponds to the dissociation of the hydrogen bonding from the cellulose interchain, which is strongly formed among the –OH functional groups. The thermal stability is significantly higher for the treated fabric than for the untreated sample. This is attributed to the interpenetrating polymer network technology that stabilizes the cotton fabric because of the more compact structure resulting from the introduction of the crosslinker. It is known that crosslinked cotton has a higher thermal stability than untreated cotton due to effective crosslinks as indicated by the higher percentage of the residues [44].
Figure 9. (a) FTIR and (b) TGA (in nitrogen) spectra of the untreated sample (US) and optimized condition (OC) sample.
As can be seen in Figure 10a, the untreated fibers have rough surface with a lot of grooves and imperfections on surface. When comparing Figure 10a to Figure 10b, it could be found that fibers were coated with resin and there were a lot of remarkable cross-linking between adjacent fibers after finishing. It is well known that hydroxyl groups in modified dihydroxyethyleneurea resin react with hydroxyls groups of two cellulose chains as well as those of one chain.
Figure 10. SEM images of (a) untreated sample (US) and (b) optimized condition (OC) sample.
4. Conclusions
This study proposes an approach that integrates the Taguchi method and the GRA to identify the optimal combination of processing parameters required to meet multiple quality objectives in resin finishing. The optimum level values of the parameters for resin finishing are the concentrations of the resin (80 g·L−1), the polyethylene softener (40 g·L−1), and the catalyst (25 g·L−1), as well as the
Figure 9. (a) FTIR and (b) TGA (in nitrogen) spectra of the untreated sample (US) and optimizedcondition (OC) sample.
As can be seen in Figure 10a, the untreated fibers have rough surface with a lot of grooves andimperfections on surface. When comparing Figure 10a to Figure 10b, it could be found that fiberswere coated with resin and there were a lot of remarkable cross-linking between adjacent fibers afterfinishing. It is well known that hydroxyl groups in modified dihydroxyethyleneurea resin react withhydroxyls groups of two cellulose chains as well as those of one chain.
Materials 2018, 11, x FOR PEER REVIEW 16 of 19
shown in Figure 9a blue region) and the absorption at 1648 cm−1 (absorption band related to the cellulose fibers) indicates that 31% of the fibers have been grafted during the resin finishing process.
The TGA plots of the US and grey OC cotton fabric are shown in Figure 9b. The minor weight losses observed in the range of 30 °C to 100 °C are attributed to the evaporation of moisture from the samples [43]. The second stage degradation, between 250 °C and 330 °C corresponds to the dissociation of the hydrogen bonding from the cellulose interchain, which is strongly formed among the –OH functional groups. The thermal stability is significantly higher for the treated fabric than for the untreated sample. This is attributed to the interpenetrating polymer network technology that stabilizes the cotton fabric because of the more compact structure resulting from the introduction of the crosslinker. It is known that crosslinked cotton has a higher thermal stability than untreated cotton due to effective crosslinks as indicated by the higher percentage of the residues [44].
Figure 9. (a) FTIR and (b) TGA (in nitrogen) spectra of the untreated sample (US) and optimized condition (OC) sample.
As can be seen in Figure 10a, the untreated fibers have rough surface with a lot of grooves and imperfections on surface. When comparing Figure 10a to Figure 10b, it could be found that fibers were coated with resin and there were a lot of remarkable cross-linking between adjacent fibers after finishing. It is well known that hydroxyl groups in modified dihydroxyethyleneurea resin react with hydroxyls groups of two cellulose chains as well as those of one chain.
Figure 10. SEM images of (a) untreated sample (US) and (b) optimized condition (OC) sample.
4. Conclusions
This study proposes an approach that integrates the Taguchi method and the GRA to identify the optimal combination of processing parameters required to meet multiple quality objectives in resin finishing. The optimum level values of the parameters for resin finishing are the concentrations of the resin (80 g·L−1), the polyethylene softener (40 g·L−1), and the catalyst (25 g·L−1), as well as the
Figure 10. SEM images of (a) untreated sample (US) and (b) optimized condition (OC) sample.
4. Conclusions
This study proposes an approach that integrates the Taguchi method and the GRA to identify theoptimal combination of processing parameters required to meet multiple quality objectives in resinfinishing. The optimum level values of the parameters for resin finishing are the concentrations of theresin (80 g·L−1), the polyethylene softener (40 g·L−1), and the catalyst (25 g·L−1), as well as the curing
Materials 2018, 11, 426 17 of 19
temperature (140 ◦C) and the curing time (2 min). The ANOVA results for the GRG indicate a rankingof the input parameters of resin concentration, polyethylene softener, catalyst, curing temperature,and curing time. Therefore, the resin concentration is the most significant parameter for the GRGfor resin finishing. All process parameters have a p-value of less than 0.05, which means they are allsignificant. The improvement in the GRG from the initial parameter combination (A3B1C3D2E1) to theoptimal parameter combination (A1B3C3D2E1) is 0.103676. Moreover, an improvement in the thermalstability was achieved for the optimized fabric.
Acknowledgments: This work was financially supported by the China National Textile & Apparel Council (2013“Textile Vision” Applied Basic Research, 2013-153) and the Collaborative Innovation Plan of Hubei Province forKey Technology of Eco-Ramie Industry (2014-8). We are also very grateful to the reviewers for their valuablecomments and suggestions.
Author Contributions: Md. Nahid Pervez and Faizan Shafiq conceived the paper; Md. Nahid Pervez, Faizan Shafiq,Zahid Sarwar and Muhammad Munib Jilani designed and performed the experiments; Md. Nahid Pervez andYingjie Cai wrote the paper; and all the authors reviewed and edited the final paper.
Conflicts of Interest: The authors declare no conflict of interest.
Abbreviations
AATCC American Association of Textile Chemists and ColoristsANOVA Analysis of varianceCRA Crease recovery angleDF Degree of freedomF F-test valueFTIR Fourier-transform infraredGRA Grey relational analysisGRG Grey relational gradeMS Mean squarep p-value: probability valueP (%) Percentage contributionR-Sq (adj) adjusted R-squared statistic: correlationR-Sq (R2) R-squared statisticSEM Scanning electron microscopeSS Sum of squareS/N ratio Signal-to-noise ratioTE Tearing strengthTGA Thermogravimetric analysisWI Whiteness index
References
1. Goynes, W.R.; Rollins, M.L. A scanning electron-microscope study of washer-dryer abrasion in cotton fibers.Text. Res. J. 1971, 41, 226–231. [CrossRef]
2. Cai, Y.; Pailthorpe, M.T.; David, S.K. A new method for improving the dyeability of cotton with reactivedyes. Text. Res. J. 1999, 69, 440–446. [CrossRef]
3. Teli, M.; Sheikh, J.; Bhavsar, P. Multifunctional finishing of cotton using chitosan extracted from bio-waste.Int. J. Biol. Macromol. 2013, 54, 125–130. [CrossRef] [PubMed]
4. Shi, F.; Wang, Y. Modelling crease recovery behaviour of woven fabrics. J. Text. Inst. 2009, 100, 218–222.[CrossRef]
5. Fan, J. The interrelationship between fabric crease recovery and pressing performance. Int. J. Cloth. Sci. Technol.2001, 13, 368–375. [CrossRef]
6. Harifi, T.; Montazer, M. Past, present and future prospects of cotton cross-linking: New insight into nanoparticles. Carbohydr. Polym. 2012, 88, 1125–1140. [CrossRef]
7. Oakes, J.; Gratton, P. Kinetic investigations of azo dye oxidation in aqueous media. J. Chem. Soc. Perkin Trans.1998, 1857–1864. [CrossRef]
Materials 2018, 11, 426 18 of 19
8. Nalbant, M.; Gökkaya, H.; Sur, G. Application of Taguchi method in the optimization of cutting parametersfor surface roughness in turning. Mater. Des. 2007, 28, 1379–1385. [CrossRef]
9. Chakravorty, R.; Gauri, S.K.; Chakraborty, S. Optimization of correlated responses of EDM process.Mater. Manuf. Process. 2012, 27, 337–347. [CrossRef]
10. Yuvaraj, N.; Pradeep Kumar, M. Multiresponse optimization of abrasive water jet cutting process parametersusing TOPSIS approach. Mater. Manuf. Process. 2015, 30, 882–889. [CrossRef]
11. Kuo, Y.; Yang, T.; Huang, G.-W. The use of grey relational analysis in solving multiple attributedecision-making problems. Comput. Ind. Eng. 2008, 55, 80–93. [CrossRef]
12. Julong, D. Introduction to grey system theory. J. Grey Syst. 1989, 1, 1–24.13. Ng, D.K.W. Grey system and grey relational model. ACM SIGICE Bull. 1994, 20, 2–9. [CrossRef]14. Siddiquee, A.N.; Khan, Z.A.; Mallick, Z. Grey relational analysis coupled with principal component analysis
for optimisation design of the process parameters in in-feed centreless cylindrical grinding. Int. J. Adv.Manuf. Technol. 2010, 46, 983–992. [CrossRef]
15. Hasani, H.; Tabatabaei, S.A.; Amiri, G. Grey relational analysis to determine the optimum process parametersfor open-end spinning yarns. J. Eng. Fibers Fabr. 2012, 7, 81–86.
16. Raza, Z.A.; Ahmad, N.; Kamal, S. Multi-response optimization of rhamnolipid production using grey rationalanalysis in Taguchi method. Biotechnol. Rep. 2014, 3, 86–94. [CrossRef] [PubMed]
17. Rehman, A.; Raza, Z.A.; Masood, R.; Hussain, M.T.; Ahmad, N. Multi-response optimization in enzymaticdesizing of cotton fabric under various chemo-physical conditions using a Taguchi approach. Cellulose 2015,22, 2107–2116. [CrossRef]
18. Hussain, T.; Arain, F.A.; Malik, Z.A. Use of Taguchi Method and Grey Relational Analysis to OptimizeMultiple Yarn Characteristics in Open-End Rotor Spinning. Autex Res. J. 2017, 17, 67–72. [CrossRef]
19. Deepanraj, B.; Sivasubramanian, V.; Jayaraj, S. Multi-response optimization of process parameters in biogasproduction from food waste using Taguchi–Grey relational analysis. Energy Convers. Manag. 2017, 141,429–438. [CrossRef]
20. Vasantharaj, K.; Jerold, M.; Deepanraj, B.; Velan, M.; Sivasubramanian, V. Assessment of a sulfidogenicsystem utilizing microalgal biomass of Chlorella pyrenoidosa as an electron donor: Taguchi based greyrelational analysis. Int. J. Hydrogen Energy 2017, 42, 26545–26554. [CrossRef]
21. Ahmad, N.; Kamal, S.; Raza, Z.A.; Hussain, T.; Anwar, F. Multi-response optimization in the developmentof oleo-hydrophobic cotton fabric using Taguchi based grey relational analysis. Appl. Surf. Sci. 2016, 367,370–381. [CrossRef]
22. 128-1974. Wrinkle Recovery of Fabrics; American Association of Textile Chemists and Colorists: Charlotte,NC, USA, 1974.
23. ASTM D1424. Tearing Strength of Fabrics; American Society of Testing Materials: Philadelphia, PA, USA, 1978.24. ASTM E313. Standard Practice for Calculating Yellowness and Whiteness Indices from Instrumentally Measured
Color Coordinates; American Society of Testing Materials: Philadelphia, PA, USA, 2004.25. Tsui, K.-L. An overview of Taguchi method and newly developed statistical methods for robust design.
IIE Trans. 1992, 24, 44–57. [CrossRef]26. Mavruz, S.; Ogulata, R.T. Taguchi approach for the optimisation of the bursting strength of knitted fabrics.
FIbres Text. East. Eur. 2010, 18, 78–83.27. Chang, C.-K.; Lu, H.S. Design optimization of cutting parameters for side milling operations with multiple
performance characteristics. Int. J. Adv. Manuf. Technol. 2007, 32, 18–26. [CrossRef]28. Khanna, R.; Kumar, A.; Garg, M.P.; Singh, A.; Sharma, N. Multiple performance characteristics optimization
for Al 7075 on electric discharge drilling by Taguchi grey relational theory. J. Ind. Eng. Int. 2015, 11, 459–472.[CrossRef]
29. Yang, Y.-K. Optimization of injection-molding process for mechanical and tribological properties of shortglass fiber and polytetrafluoroethylene reinforced polycarbonate composites with grey relational analysis:A case study. Polym. Plast. Technol. 2006, 45, 769–777. [CrossRef]
30. Nguyen, T.C.; Miska, S.; Saasen, A.; Maxey, J. Using Taguchi and ANOVA methods to study the combinedeffects of drilling parameters on dynamic barite sag. J. Petrol. Sci. Eng. 2014, 121, 126–133. [CrossRef]
31. Senthilkumar, N.; Tamizharasan, T.; Anandakrishnan, V. Experimental investigation and performanceanalysis of cemented carbide inserts of different geometries using Taguchi based grey relational analysis.Measurement 2014, 58, 520–536. [CrossRef]
Materials 2018, 11, 426 19 of 19
32. Hassan, Y.M.E.; EL-Salmawy, A.; Almetwally, A. Performance of woven fabrics containing spandex.Indian Text. J. 2010, 120, 22–27.
33. Dhamija, S.; Chopra, M. Tearing strength of cotton fabrics in relation to certain process and loom parameters.Indian J. Fibre Text. Res. 2007, 32, 439–445.
34. Montazer, M.; Afjeh, M.G. Simultaneous x-linking and antimicrobial finishing of cotton fabric. J. Appl. Polym. Sci.2007, 103, 178–185. [CrossRef]
35. Hung, O.N.; Chan, C.K.; Kan, C.W.; Yuen, C.W.M. An analysis of some physical and chemical properties ofCO2 laser-treated cotton-based fabrics. Cellulose 2017, 24, 363–381. [CrossRef]
36. Fouda, M.M.G.; El Shafei, A.; Sharaf, S.; Hebeish, A. Microwave curing for producing cotton fabrics witheasy care and antibacterial properties. Carbohydr. Polym. 2009, 77, 651–655. [CrossRef]
37. Baskaran, V.; Nachiappan, S.; Rahman, S. Indian textile suppliers' sustainability evaluation using the greyapproach. Int. J. Prod. Econ. 2012, 135, 647–658. [CrossRef]
38. Kuo, C.-F.J.; Tu, H.-M. Gray relational analysis approach for the optimization of process setting in textilecalendering. Text. Res. J. 2009, 79, 981–992. [CrossRef]
39. Sudhakara, D.; Prasanthi, G. Parametric Optimization of Wire Electrical Discharge Machining of PowderMetallurgical Cold Worked Tool Steel using Taguchi Method. J. Inst. Eng. India Ser. C 2017, 98, 119–129.[CrossRef]
40. Hussain, T.; Ali, S.; Qaiser, F. Predicting the crease recovery performance and tear strength of cotton fabrictreated with modified N-methylol dihydroxyethylene urea and polyethylene softener. Color. Technol. 2010,126, 256–260. [CrossRef]
41. Sarıkaya, M.; Güllü, A. Multi-response optimization of minimum quantity lubrication parameters usingTaguchi-based grey relational analysis in turning of difficult-to-cut alloy Haynes 25. J. Clean. Prod. 2015, 91,347–357. [CrossRef]
42. Garside, P.; Wyeth, P. Identification of cellulosic fibres by FTIR spectroscopy-thread and single fibre analysisby attenuated total reflectance. Stud. Conserv. 2003, 48, 269–275. [CrossRef]
43. Wang, M.; She, Y.; Xiao, Z.; Hu, J.; Zhou, R.; Zhang, J. The green adsorption of chitosan tripolyphosphatenanoparticles on cotton fiber surfaces. Carbohydr. Polym. 2014, 101, 812–818. [CrossRef] [PubMed]
44. Trask-Morrell, B.J.; Kottes Andrews, B.A. Thermoanalytical Study of Durable Press Reactant Levels onCotton Fabrics: Part I: Nonformaldehyde Polycarboxylic Acids. Text. Res. J. 1994, 64, 729–736. [CrossRef]
© 2018 by the authors. Licensee MDPI, Basel, Switzerland. This article is an open accessarticle distributed under the terms and conditions of the Creative Commons Attribution(CC BY) license (http://creativecommons.org/licenses/by/4.0/).


![INDEX []€¦ · ** Gali Gopal Ji, Chauk Sarafa Bazar, Bah Agra (U.P.) Keywords : Resin, percent drape coefficient, stiffness Textiles Effect Of Resin Finishing On Stiffness And Drape](https://img.pdfslide.us/doc/110x75/5eae280702b2914dd2092b59/index-gali-gopal-ji-chauk-sarafa-bazar-bah-agra-up-keywords-resin.jpg)