Embed Size (px)
Citation preview
Hydrol. Earth Syst. Sci., 16, 4009–4022, 2012www.hydrol-earth-syst-sci.net/16/4009/2012/doi:10.5194/hess-16-4009-2012© Author(s) 2012. CC Attribution 3.0 License.
Hydrology andEarth System
Sciences
Multi-offset ground-penetrating radar imaging of a lab-scaleinfiltration test
A. R. Mangel1, S. M. J. Moysey1, J. C. Ryan1, and J. A. Tarbutton2
1Environmental Engineering and Earth Sciences, Clemson University, 340 Brackett Hall, Clemson, SC 29634, USA2Mechanical Engineering, Clemson University, 102 Fluor Daniel Building, Clemson, SC 29634, USA
Correspondence to:A. R. Mangel ([email protected])
Received: 31 October 2011 – Published in Hydrol. Earth Syst. Sci. Discuss.: 15 November 2011Revised: 6 September 2012 – Accepted: 2 October 2012 – Published: 5 November 2012
Abstract. A lab scale infiltration experiment was conductedin a sand tank to evaluate the use of time-lapse multi-offsetground-penetrating radar (GPR) data for monitoring dy-namic hydrologic events in the vadose zone. Sets of 21 GPRtraces at offsets between 0.44–0.9 m were recorded every 30 sduring a 3 h infiltration experiment to produce a data cubethat can be viewed as multi-offset gathers at unique times orcommon offset images, tracking changes in arrivals throughtime. Specifically, we investigated whether this data can beused to estimate changes in average soil water content dur-ing wetting and drying and to track the migration of the wet-ting front during an infiltration event. For the first problemwe found that normal-moveout (NMO) analysis of the GPRreflection from the bottom of the sand layer provided wa-ter content estimates ranging between 0.10–0.30 volumetricwater content, which underestimated the value determinedby depth averaging a vertical array of six moisture probesby 0.03–0.05 volumetric water content. Relative errors in theestimated depth to the bottom of the 0.6 m thick sand layerwere typically on the order of 2 %, though increased as highas 25 % as the wetting front approached the bottom of thetank. NMO analysis of the wetting front reflection during theinfiltration event generally underestimated the depth of thefront with discrepancies between GPR and moisture probeestimates approaching 0.15 m. The analysis also resulted inunderestimates of water content in the wetted zone on theorder of 0.06 volumetric water content and a wetting frontvelocity equal to about half the rate inferred from the probemeasurements. In a parallel modeling effort we found thatHYDRUS-1D also underestimates the observed average tankwater content determined from the probes by approximately0.01–0.03 volumetric water content, despite the fact that the
model was calibrated to the probe data. This error suggeststhat the assumed conceptual model of laterally uniform, one-dimensional vertical flow in a homogenous material may notbe fully appropriate for the experiment. Full-waveform mod-eling and subsequent NMO analysis of the simulated GPR re-sponse resulted in water content errors on the order of 0.01–0.03 volumetric water content, which are roughly 30–50 % ofthe discrepancy between GPR and probe results observed inthe experiment. The model shows that interference betweenwave arrivals affects data interpretation and the estimationof traveltimes. This is an important source of error in theNMO analysis, but it does not fully account for the discrep-ancies between GPR and the moisture probes observed inthe experiment. The remaining discrepancy may be relatedto conceptual errors underlying the GPR analysis, such asthe assumption of uniform one-dimensional flow, a lack of asharply defined wetting front in the experiment, and errors inthe petrophysical model used to convert dielectric constant towater content.
1 Introduction
Ground-penetrating radar (GPR) has been established as avaluable tool for evaluating soil water content (Huisman etal., 2003). Surface-based radar reflection surveys are partic-ularly appealing for this purpose as they can map large-scaleregions that are relevant to field applications ranging fromprecision agriculture (Freeland et al., 1998; Lunt et al., 2005)to contaminant transport (Brewster et al., 1995). Several au-thors, including Lunt et al. (2005) and Grote et al. (2005),have shown that GPR reflection surveys can provide water
Published by Copernicus Publications on behalf of the European Geosciences Union.
4010 A. R. Mangel et al.: Multi-offset ground-penetrating radar imaging of a lab-scale infiltration test
content estimates with an accuracy comparable to traditionalinvasive, spatially limited methods, e.g., time-domain reflec-tometry (TDR) or neutron probes. A significant advantageof these probes over radar, however, is that they can pro-vide reliable water content estimates with high temporal res-olution, e.g., at time scales capturing the dynamics of indi-vidual infiltration events. In contrast, almost all studies us-ing GPR to quantitatively estimate water content have beenperformed under nearly steady-state hydraulic conditions orwhere changes in water content have been observed over longperiods of time, e.g., seasonally, due to the significant effortand time required for data collection (Lunt et al., 2005; Groteet al., 2005; Steelman and Endres, 2010)
Most common methods for estimating water content fromGPR are based on deriving wave velocity from arrivals iden-tified in radar images (Huisman et al., 2003). For example,Lunt et al. (2005) mapped seasonal changes in water con-tent over an 80 m× 180 m area of a vineyard by evaluat-ing variations in wave velocity determined from the travel-time of reflections produced by a clay layer of known depth,where the depth of the clay layer was inferred from boreholedata. Water contents were then estimated from the veloci-ties using a site-specific petrophysical equation. Followinga different approach, Huisman et al. (2001) used changesin the traveltime of the direct groundwave in a wide an-gle reflection-refraction (WARR) survey to calculate lateralvariations in wave velocity, which were subsequently trans-formed to near surface water content. While analysis of thegroundwave has been shown to yield excellent results whenthe soil near the ground surface is approximately homoge-neous, it is not clear whether accurate wave velocities can beobtained during an infiltration event. In this case, energy canbe trapped in the low-velocity waveguide behind the wettingfront, causing dispersion of the groundwave (van der Kruk,2006). In contrast, van Overmeeren et al. (1997) analyzedgroundwave, reflected and refracted wave arrivals in multi-offset data obtained from central midpoint (CMP) surveys tosuccessfully determine both lateral and vertical variations inwater content.
Traditional multi-offset GPR survey techniques, i.e., CMPor WARR, are appealing strategies for monitoring water con-tent changes associated with one-dimensional infiltration asthey are well established in the literature (Berard and Maillol,2007; Fisher et al., 1992; Greaves et al., 1996; Grote et al.,2005) and can be easily put into practice with widely avail-able commercial GPR systems. Analysis of the data fromthese surveys typically relies on normal-moveout (NMO)corrections (Fisher et al., 1992), however, which assumesidealized, locally continuous reflector geometries. To over-come these limitations, Bradford (2008) used reflection to-mography to obtain improved velocity estimates and GPRreflection images in areas with significant lateral heterogene-ity. The intensive surveying required to collect data for re-flection tomography, however, makes the approach challeng-ing to implement at the short time scales associated with the
dynamics of individual soil hydrologic events, such as infil-tration in response to rainfall. Given that natural infiltrationin soils is often conceptualized as a one-dimensional processat field scales, it is not yet clear whether meaningful dynamicwater content estimates can be obtained from multi-offsetGPR using a NMO approach or whether more data intensivereflection tomography methods will need to be adopted.
There are relatively few examples in the literature that di-rectly illustrate the influence of soil hydrology on surface-based GPR surveys (Freeland et al., 2006; Grasmueck et al.,2010; Grote et al., 2005; Haarder et al., 2011; Lambot et al.,2008; Moysey, 2010; Saintenoy et al., 2008; Truss et al.,2007). Truss et al. (2007) performed 3-D time-lapse GPRimaging of infiltration in an oolitic limestone that revealedmacroscopic funnel flow effects. These authors also observedoverall shifts in reflector traveltimes that they suggested werecaused by changes in soil moisture, but they did not providedirect estimates of water content. Haarder et al. (2011) usedconstant-offset GPR surveys to monitor an infiltration exper-iment where dye was applied to mark preferential flow pathsthat were later identified when the site was excavated follow-ing the test. These authors concluded that wetting front non-uniformity and fingering complicated the GPR images, not-ing impacts on both radar velocity and amplitudes, but pref-erential flow features themselves were not resolved. Groteet al. (2005) used constant-offset and CMP surveys to mon-itor changes in water content beneath a synthetic road bedduring infiltration tests conducted over a period of approxi-mately 35 weeks and found close agreement with gravimetricwater content estimates. Moysey (2010) used a pair of fixedantennas placed on the surface of a sand tank to show thatchanges in water content during wetting and drying eventsproduce distinct arrival trajectories in transient constant off-set GPR data. These data were then used to calibrate the pa-rameters of a soil infiltration model. Because the antennaswere maintained at a constant offset from each other in thatwork, however, it was not possible to directly determine sub-surface velocity or estimate reflector depths using the GPRdata alone. Despite the various hydrologic and geophysicalinsights provided by these studies, none has directly evalu-ated whether multi-offset imaging can be used to quantifywater content changes in a dynamically changing soil envi-ronment at timescales typical of rainfall and irrigation events.
In this study we investigate whether NMO analysis ofWARR surveys can be used to continuously monitor watercontent, track infiltration fronts, and image soil structure overthe course of a short-term infiltration experiment. The ex-periment is conducted in a sand tank where water is applieduniformly to the surface while an automated positioning sys-tem moves a receiver antenna to 21 different positions abovethe tank. This unique approach to antenna positioning allowsus to collect multi-offset images as approximate “snapshots”of the tank over time. Conceptualizing the data as a 3-D vol-ume, i.e., with dimensions of GPR traveltime, antenna offset,and elapsed time since the start of the experiment, provides
Hydrol. Earth Syst. Sci., 16, 4009–4022, 2012 www.hydrol-earth-syst-sci.net/16/4009/2012/
A. R. Mangel et al.: Multi-offset ground-penetrating radar imaging of a lab-scale infiltration test 4011
a rich space for enhanced analysis of transient processes thatwe expect will allow us to achieve reliable, high resolutionmonitoring of hydrologic events in soils.
2 Methods
2.1 Experimental procedures
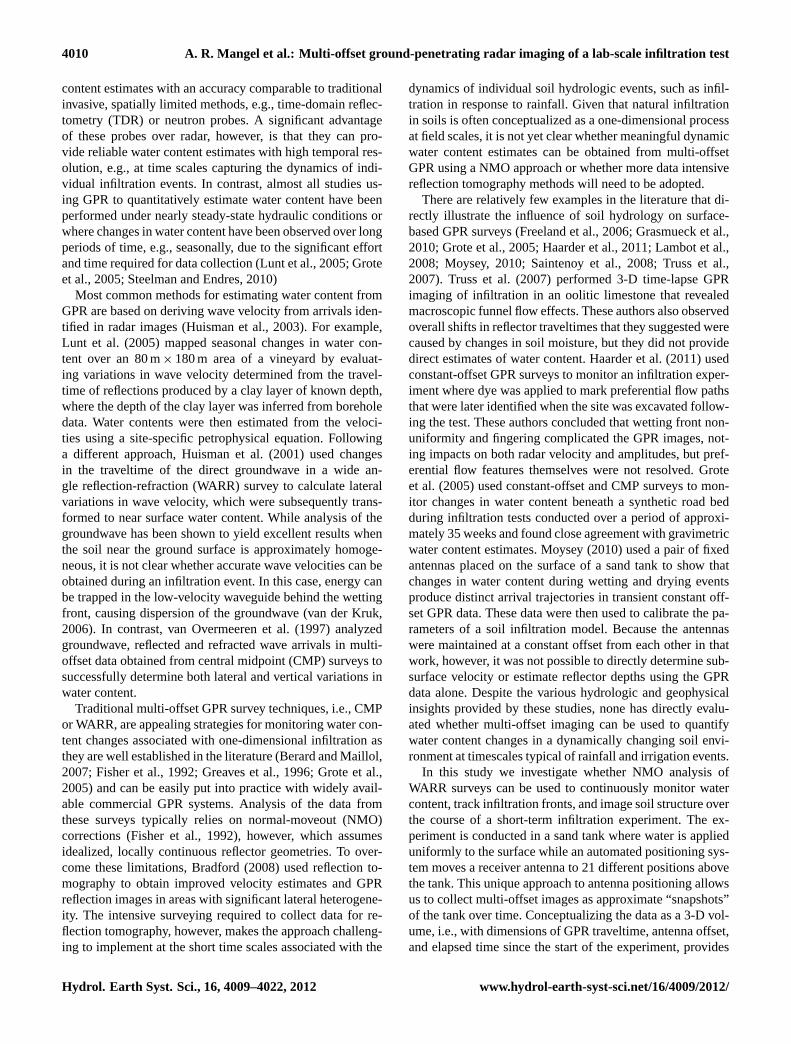
The infiltration experiment was conducted in a 150 cm× 150 cm× 80 cm (L× W × H) wooden tank illustrated inFig. 1. Drains at the base of the tank were left open at alltimes to allow for free discharge of effluent. The tank waspacked with a 60 cm layer of homogeneous, medium grained(0.25–0.5 mm) sand, below which was placed a 20 cm layerof gravel to allow for drainage. The sand was packed into thetank in roughly 1 cm increments. While packing the sand,fifteen Decagon EC-5 soil moisture probes were installed inthe tank. The probes were placed in a central array at depthsof 5, 10, 15, 25, 35, 45 and 55 cm and four lateral arrays,each with probes at depths of 15 and 45 cm. The probes werecalibrated for the sand prior to packing and provided watercontent measurements at 10 s intervals throughout the exper-iment. The depth distribution of initial water content prior tothe experiment was evaluated using the probes and found tobe at approximate capillary equilibrium assuming no verticalflow; the water content was non-uniform due to redistribu-tion of water during previous infiltration tests conducted inthe tank (see Fig. 2).
The infiltration event was initiated by applying water to thesand surface using an irrigation grid consisting of a networkof parallel (0.64 cm O.D.× 0.43 cm I.D.) polyethylene tubes.The tubes were spaced at 1 cm intervals and punctured ev-ery 1 cm to give a 1 cm× 1 cm grid of irrigation points overthe central portion of the tank (∼ 130 cm× 75 cm) where theGPR data were collected. A peristaltic pump monitored by aflow meter provided control over the flux of water applied tothe tank. The tubing was initially purged of air using a set ofvalves so that water could be applied uniformly to the surfaceof the tank as soon as the pump was turned on.
An automated radar imaging system was developed usingLabVIEW (National Instruments, Austin, Texas) to achievefast and accurate multi-offset antenna positioning for theWARR surveys performed during the experiment. A station-ary transmitter antenna was placed on the irrigation grid 7 cmfrom one end of the tank while the receiver antenna wasmounted 4 cm above the sand surface on a carriage that couldmove the length of the tank on an elevated track (Fig. 1). Thereceiver antenna was moved using a belt drive (Pittman Ex-press DC servo motor, Model GM9236S021-R1 and Pololumotor drive chip, Model MD01B), which had a 500 pulseper revolution encoder on the motor to provide lateral posi-tioning precision on the order of tenths of a millimeter. Lab-VIEW was interfaced with the GPR trigger to fire the trans-mitter whenever the receiver antenna was stopped at a desired
Fig. 1.Experimental setup for lab-scale infiltration experiments.
survey position, though the radar’s standard control softwarewas run from a separate computer to collect the data.
The radar system used in the experiment was aPulseEKKO 1000 with 900 MHz antennas (Sensors and Soft-ware, Mississauga, Ontario, Canada). The transmitter an-tenna was fired as the receiver was scanned across the tankat 21 different positions with antenna offsets ranging from0.44–0.9 m. Each round trip of the receiver antenna acrossthe tank was completed in approximately 60 s, but data werecollected in both directions so a complete 21 trace WARRsurvey was collected every 30 s during the experiment.
No water was applied to the tank for the first 8 min of theexperiment to ensure that consistent GPR data could be ob-tained and to assess background conditions in the sand. Waterwas then applied at the surface of the tank by the irrigationgrid for 65 min at a rate of 0.44 cm min−1; this rate was se-lected to provide a strong contrast in water content withinthe tank across the wetting front. After this time, the pumpwas turned off and an additional 107 min of recovery datawere collected as water redistributed in the tank. A total of6300 GPR traces were collected as 300 multi-offset WARRsurveys during the experiment.
2.2 Normal-moveout analysis of WARR surveys
Multi-offset GPR data are typically analyzed by applyingnormal-moveout (NMO) corrections to determine the one-dimensional velocity structure of the subsurface, e.g., seeYilmaz (1987) for details on NMO analysis and Fisher etal. (1992) for application of NMO to GPR. Using the NMOapproach, the apparent (root mean square) velocity (VRMS) ofa wave traveling through the subsurface can be determined byassuming that the traveltime of a wave reflected from a sub-surface interface increases in a well-defined way as the offsetbetween transmitter and receiver antennas is increased. Fora horizontal interface, the relationship between the two-waytraveltime (t) to a reflector located at depth (z) and antennaoffset (x) is linear when plotted asx2 vs. t2:
www.hydrol-earth-syst-sci.net/16/4009/2012/ Hydrol. Earth Syst. Sci., 16, 4009–4022, 2012

4012 A. R. Mangel et al.: Multi-offset ground-penetrating radar imaging of a lab-scale infiltration test
Fig. 2. (a) Data from soil moisture probes located in the central array of the sand tank and(b) HYDRUS-1D model results. “X” marksindicate wetting front picks from taking the maximum of first derivative of the series in time.
t2=
x2
V 2RMS
+4z2
V 2RMS
. (1)
The first step in NMO analysis of WARR data is thereforeto identify a coherent set of arrivals in a multi-offset imagethat represents the reflection response from a subsurface in-terface. The traveltimes of the reflected wave estimated ateach different offset between the transmitter and receiver an-tennas can then be fit by Eq. (1), with the resulting slope andintercept of the best fit line yieldingVRMS and the depth (z) ofthe reflector, respectively. Due to the mode of data collectionused in this study, identification of coherent reflections canalso be aided by reflection patterns that are apparent whenthe data are plotted as constant-offset gathers, as illustratedby Moysey (2010). We emphasize, however, that the abilityto constrain both subsurface velocity and reflector depth overtime is a key advantage of multi-offset versus constant-offsetGPR data.
The effective dielectric constant (κ) of the subsurface canbe determined from velocity using Eq. (2), wherec is thespeed of light in a vacuum. The dielectric constant can thenbe used to determine the average water content (θ) of the sub-surface using a petrophysical relationship such as the Toppequation (Topp et al., 1980), which is given in Eq. (3). For anin depth review and description of current GPR theory andapplications, refer to Jol et al. (2009).
κ =
(c
VRMS
)2
(2)
θ = −0.053+ 0.029κ − 5.5 × 10⁻⁴κ2+ 4.3 × 10⁻⁶κ3 (3)
2.3 Numerical modeling
Numerical modeling of the infiltration experiment and GPRresponse was performed to improve the interpretation of theexperimental results and identify possible sources of error.The homogeneous 0.60 m profile of sand was discretizedinto 1001 equally-sized cells (6× 10⁻⁴ m) within HYDRUS-1D (Simunek et al., 2005). Non-uniform initial soil moistureconditions were specified for the model based on the in-situmoisture probe readings observed at the beginning of the tankexperiment (Fig. 2a). The same flux schedule used in the ex-periment was specified as the upper boundary condition inthe model, and the bottom boundary was specified as a seep-age face to capture the capillary barrier effect that occursat the sand–gravel interface in the tank. Observation pointswere specified to represent soil moisture probe locations inthe tank, whereas the full simulated depth profiles of watercontent were used for the GPR simulations. The Mualem–van Genuchten parameters of the soil (Mualem, 1976; vanGenuchten, 1980) used in the simulations were determinedby calibrating the model in HYDRUS-1D using the observedmoisture probe data from the tank experiments. Starting pa-rameters for the inversion were initialized using the measured
Hydrol. Earth Syst. Sci., 16, 4009–4022, 2012 www.hydrol-earth-syst-sci.net/16/4009/2012/
A. R. Mangel et al.: Multi-offset ground-penetrating radar imaging of a lab-scale infiltration test 4013
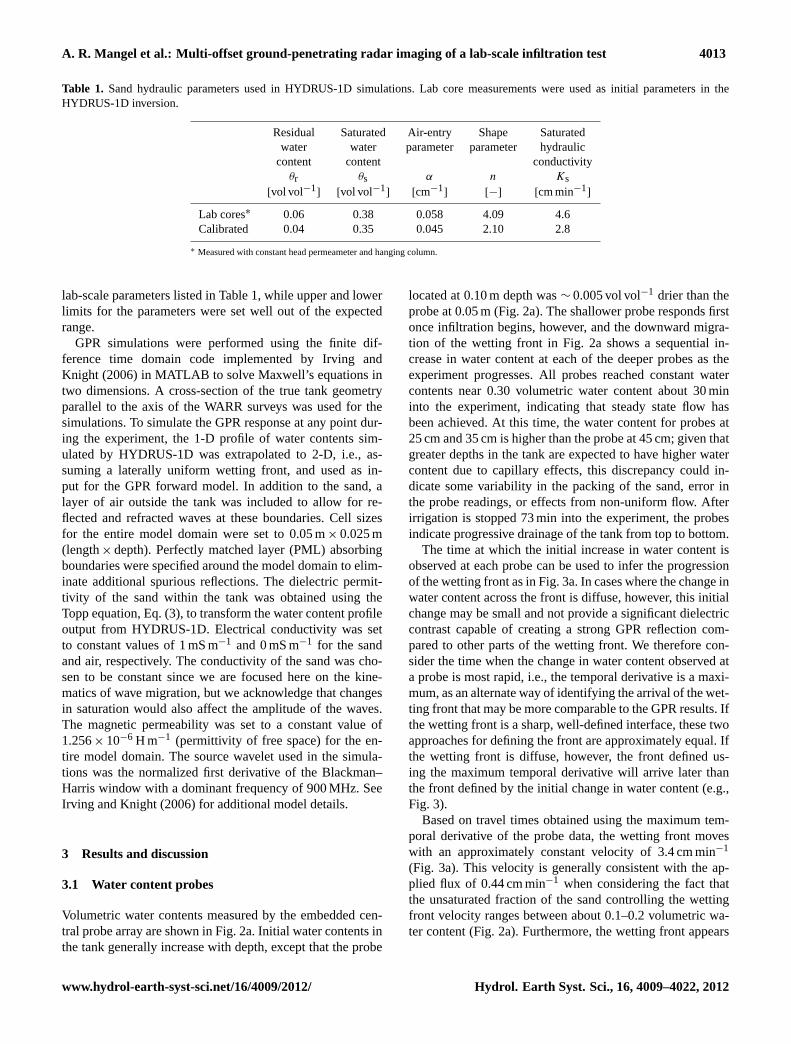
Table 1. Sand hydraulic parameters used in HYDRUS-1D simulations. Lab core measurements were used as initial parameters in theHYDRUS-1D inversion.
Residual Saturated Air-entry Shape Saturatedwater water parameter parameter hydraulic
content content conductivityθr θs α n Ks
[vol vol−1] [vol vol−1
] [cm−1] [−] [cm min−1
]
Lab cores∗ 0.06 0.38 0.058 4.09 4.6Calibrated 0.04 0.35 0.045 2.10 2.8
∗ Measured with constant head permeameter and hanging column.
lab-scale parameters listed in Table 1, while upper and lowerlimits for the parameters were set well out of the expectedrange.
GPR simulations were performed using the finite dif-ference time domain code implemented by Irving andKnight (2006) in MATLAB to solve Maxwell’s equations intwo dimensions. A cross-section of the true tank geometryparallel to the axis of the WARR surveys was used for thesimulations. To simulate the GPR response at any point dur-ing the experiment, the 1-D profile of water contents sim-ulated by HYDRUS-1D was extrapolated to 2-D, i.e., as-suming a laterally uniform wetting front, and used as in-put for the GPR forward model. In addition to the sand, alayer of air outside the tank was included to allow for re-flected and refracted waves at these boundaries. Cell sizesfor the entire model domain were set to 0.05 m× 0.025 m(length× depth). Perfectly matched layer (PML) absorbingboundaries were specified around the model domain to elim-inate additional spurious reflections. The dielectric permit-tivity of the sand within the tank was obtained using theTopp equation, Eq. (3), to transform the water content profileoutput from HYDRUS-1D. Electrical conductivity was setto constant values of 1 mS m−1 and 0 mS m−1 for the sandand air, respectively. The conductivity of the sand was cho-sen to be constant since we are focused here on the kine-matics of wave migration, but we acknowledge that changesin saturation would also affect the amplitude of the waves.The magnetic permeability was set to a constant value of1.256× 10−6 H m−1 (permittivity of free space) for the en-tire model domain. The source wavelet used in the simula-tions was the normalized first derivative of the Blackman–Harris window with a dominant frequency of 900 MHz. SeeIrving and Knight (2006) for additional model details.
3 Results and discussion
3.1 Water content probes
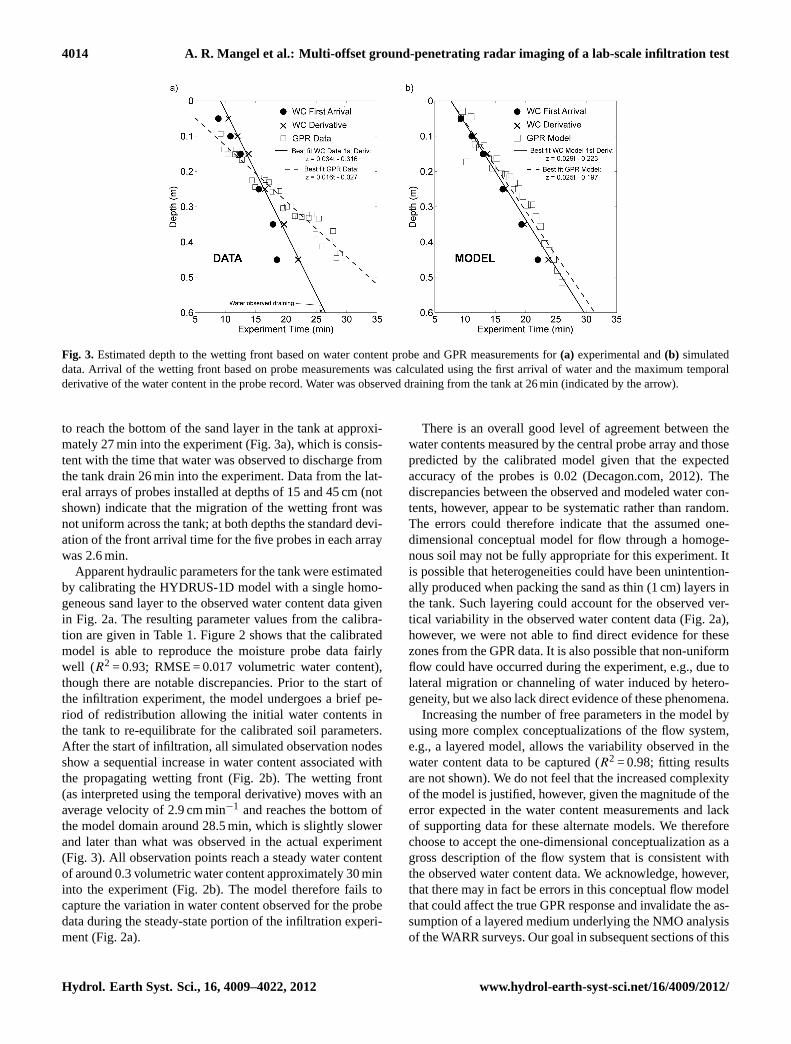
Volumetric water contents measured by the embedded cen-tral probe array are shown in Fig. 2a. Initial water contents inthe tank generally increase with depth, except that the probe
located at 0.10 m depth was∼ 0.005 vol vol−1 drier than theprobe at 0.05 m (Fig. 2a). The shallower probe responds firstonce infiltration begins, however, and the downward migra-tion of the wetting front in Fig. 2a shows a sequential in-crease in water content at each of the deeper probes as theexperiment progresses. All probes reached constant watercontents near 0.30 volumetric water content about 30 mininto the experiment, indicating that steady state flow hasbeen achieved. At this time, the water content for probes at25 cm and 35 cm is higher than the probe at 45 cm; given thatgreater depths in the tank are expected to have higher watercontent due to capillary effects, this discrepancy could in-dicate some variability in the packing of the sand, error inthe probe readings, or effects from non-uniform flow. Afterirrigation is stopped 73 min into the experiment, the probesindicate progressive drainage of the tank from top to bottom.
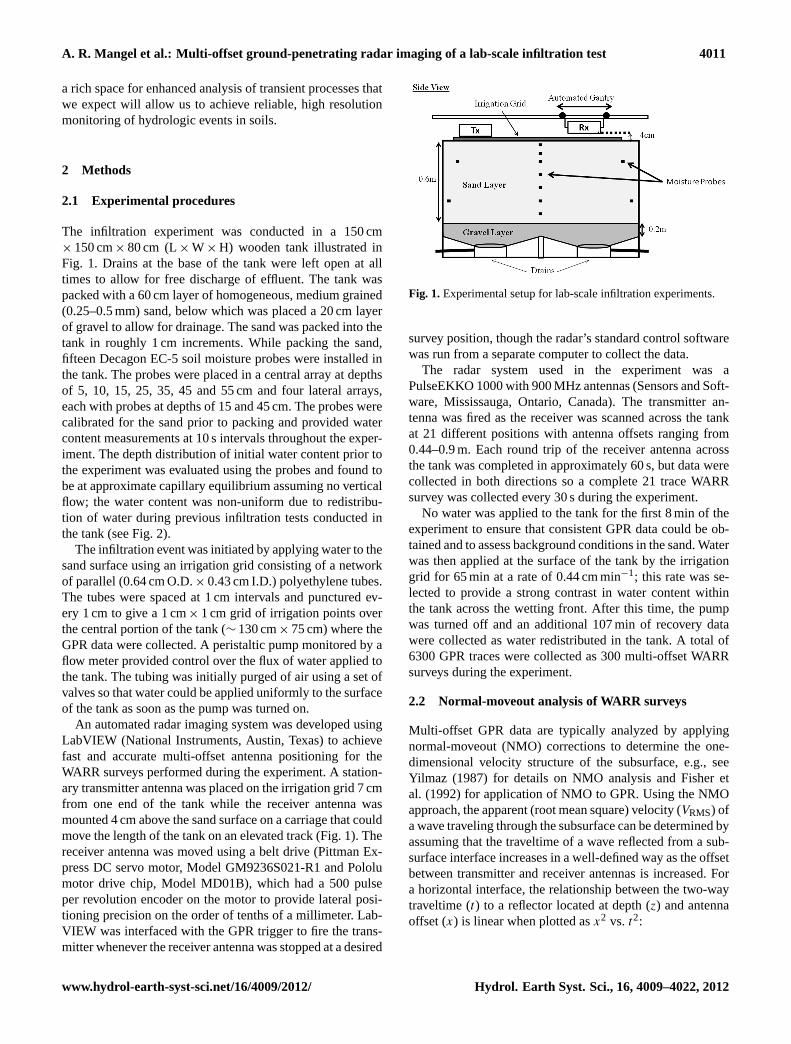
The time at which the initial increase in water content isobserved at each probe can be used to infer the progressionof the wetting front as in Fig. 3a. In cases where the change inwater content across the front is diffuse, however, this initialchange may be small and not provide a significant dielectriccontrast capable of creating a strong GPR reflection com-pared to other parts of the wetting front. We therefore con-sider the time when the change in water content observed ata probe is most rapid, i.e., the temporal derivative is a maxi-mum, as an alternate way of identifying the arrival of the wet-ting front that may be more comparable to the GPR results. Ifthe wetting front is a sharp, well-defined interface, these twoapproaches for defining the front are approximately equal. Ifthe wetting front is diffuse, however, the front defined us-ing the maximum temporal derivative will arrive later thanthe front defined by the initial change in water content (e.g.,Fig. 3).
Based on travel times obtained using the maximum tem-poral derivative of the probe data, the wetting front moveswith an approximately constant velocity of 3.4 cm min−1
(Fig. 3a). This velocity is generally consistent with the ap-plied flux of 0.44 cm min−1 when considering the fact thatthe unsaturated fraction of the sand controlling the wettingfront velocity ranges between about 0.1–0.2 volumetric wa-ter content (Fig. 2a). Furthermore, the wetting front appears
www.hydrol-earth-syst-sci.net/16/4009/2012/ Hydrol. Earth Syst. Sci., 16, 4009–4022, 2012
4014 A. R. Mangel et al.: Multi-offset ground-penetrating radar imaging of a lab-scale infiltration test
Fig. 3. Estimated depth to the wetting front based on water content probe and GPR measurements for(a) experimental and(b) simulateddata. Arrival of the wetting front based on probe measurements was calculated using the first arrival of water and the maximum temporalderivative of the water content in the probe record. Water was observed draining from the tank at 26 min (indicated by the arrow).
to reach the bottom of the sand layer in the tank at approxi-mately 27 min into the experiment (Fig. 3a), which is consis-tent with the time that water was observed to discharge fromthe tank drain 26 min into the experiment. Data from the lat-eral arrays of probes installed at depths of 15 and 45 cm (notshown) indicate that the migration of the wetting front wasnot uniform across the tank; at both depths the standard devi-ation of the front arrival time for the five probes in each arraywas 2.6 min.
Apparent hydraulic parameters for the tank were estimatedby calibrating the HYDRUS-1D model with a single homo-geneous sand layer to the observed water content data givenin Fig. 2a. The resulting parameter values from the calibra-tion are given in Table 1. Figure 2 shows that the calibratedmodel is able to reproduce the moisture probe data fairlywell (R2 = 0.93; RMSE = 0.017 volumetric water content),though there are notable discrepancies. Prior to the start ofthe infiltration experiment, the model undergoes a brief pe-riod of redistribution allowing the initial water contents inthe tank to re-equilibrate for the calibrated soil parameters.After the start of infiltration, all simulated observation nodesshow a sequential increase in water content associated withthe propagating wetting front (Fig. 2b). The wetting front(as interpreted using the temporal derivative) moves with anaverage velocity of 2.9 cm min−1 and reaches the bottom ofthe model domain around 28.5 min, which is slightly slowerand later than what was observed in the actual experiment(Fig. 3). All observation points reach a steady water contentof around 0.3 volumetric water content approximately 30 mininto the experiment (Fig. 2b). The model therefore fails tocapture the variation in water content observed for the probedata during the steady-state portion of the infiltration experi-ment (Fig. 2a).
There is an overall good level of agreement between thewater contents measured by the central probe array and thosepredicted by the calibrated model given that the expectedaccuracy of the probes is 0.02 (Decagon.com, 2012). Thediscrepancies between the observed and modeled water con-tents, however, appear to be systematic rather than random.The errors could therefore indicate that the assumed one-dimensional conceptual model for flow through a homoge-nous soil may not be fully appropriate for this experiment. Itis possible that heterogeneities could have been unintention-ally produced when packing the sand as thin (1 cm) layers inthe tank. Such layering could account for the observed ver-tical variability in the observed water content data (Fig. 2a),however, we were not able to find direct evidence for thesezones from the GPR data. It is also possible that non-uniformflow could have occurred during the experiment, e.g., due tolateral migration or channeling of water induced by hetero-geneity, but we also lack direct evidence of these phenomena.
Increasing the number of free parameters in the model byusing more complex conceptualizations of the flow system,e.g., a layered model, allows the variability observed in thewater content data to be captured (R2 = 0.98; fitting resultsare not shown). We do not feel that the increased complexityof the model is justified, however, given the magnitude of theerror expected in the water content measurements and lackof supporting data for these alternate models. We thereforechoose to accept the one-dimensional conceptualization as agross description of the flow system that is consistent withthe observed water content data. We acknowledge, however,that there may in fact be errors in this conceptual flow modelthat could affect the true GPR response and invalidate the as-sumption of a layered medium underlying the NMO analysisof the WARR surveys. Our goal in subsequent sections of this
Hydrol. Earth Syst. Sci., 16, 4009–4022, 2012 www.hydrol-earth-syst-sci.net/16/4009/2012/
A. R. Mangel et al.: Multi-offset ground-penetrating radar imaging of a lab-scale infiltration test 4015
paper is therefore to use the simulations as a reference thatprovides a quantitative context for assessing the significanceof discrepancies between the observed probe and GPR data.We do not use the observed GPR data to further refine theconceptual accuracy of the flow model.
3.2 GPR arrivals
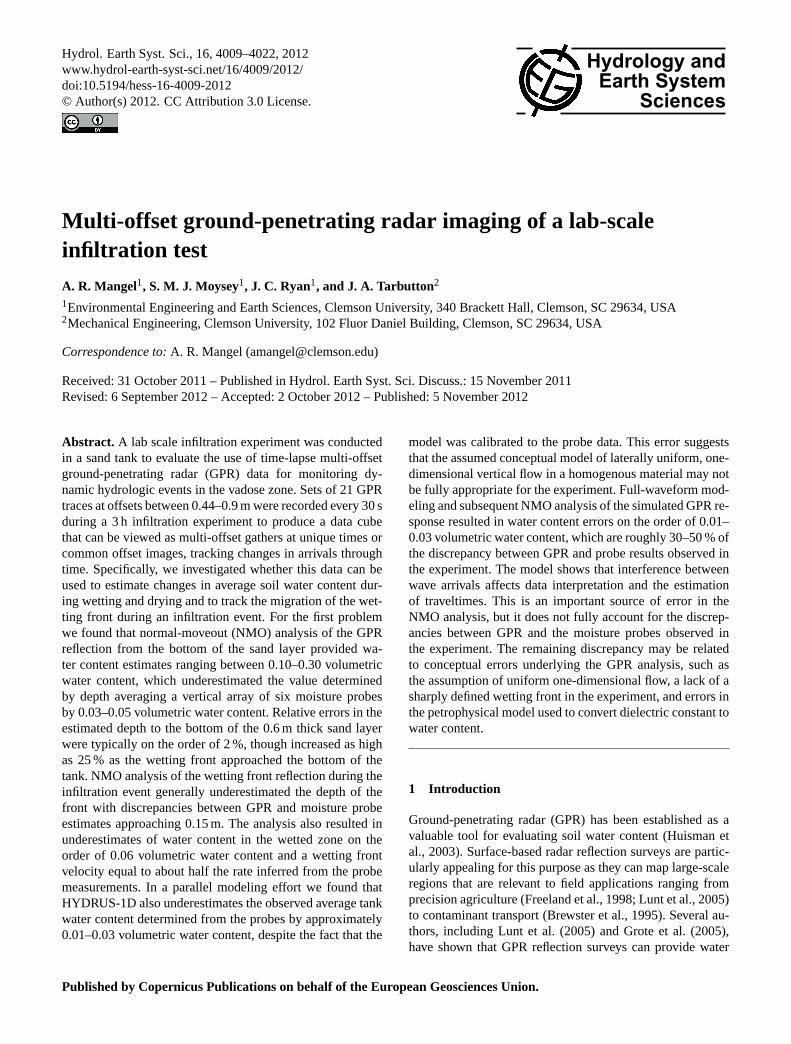
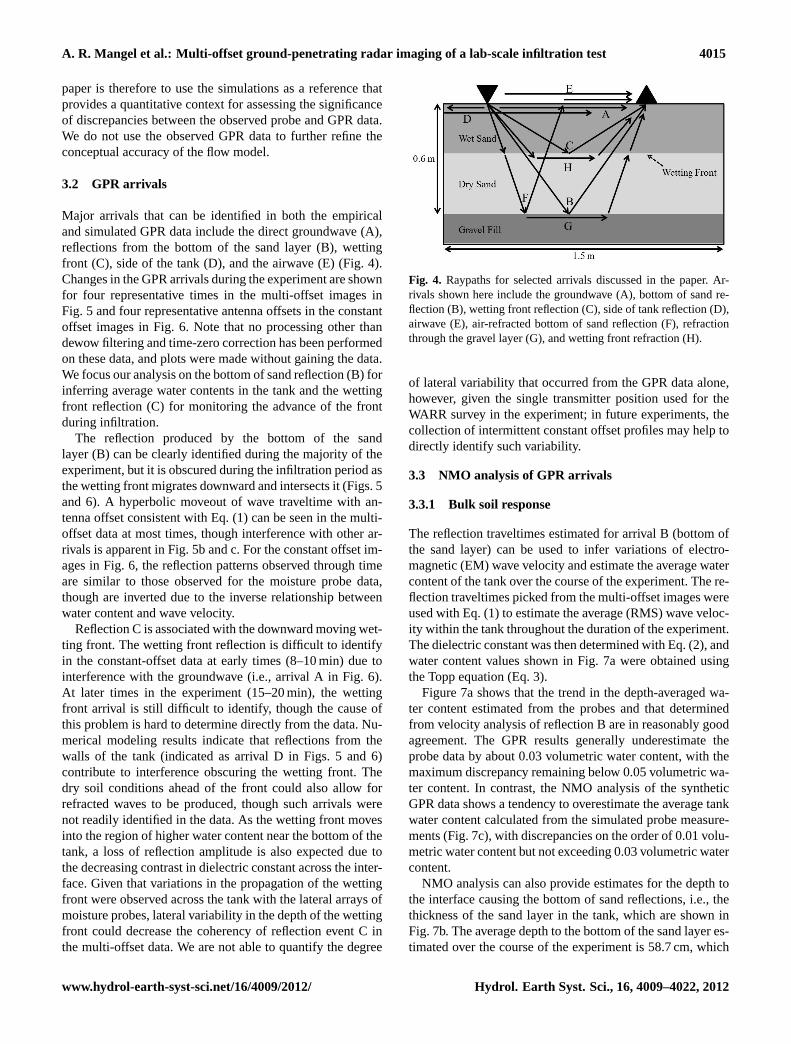
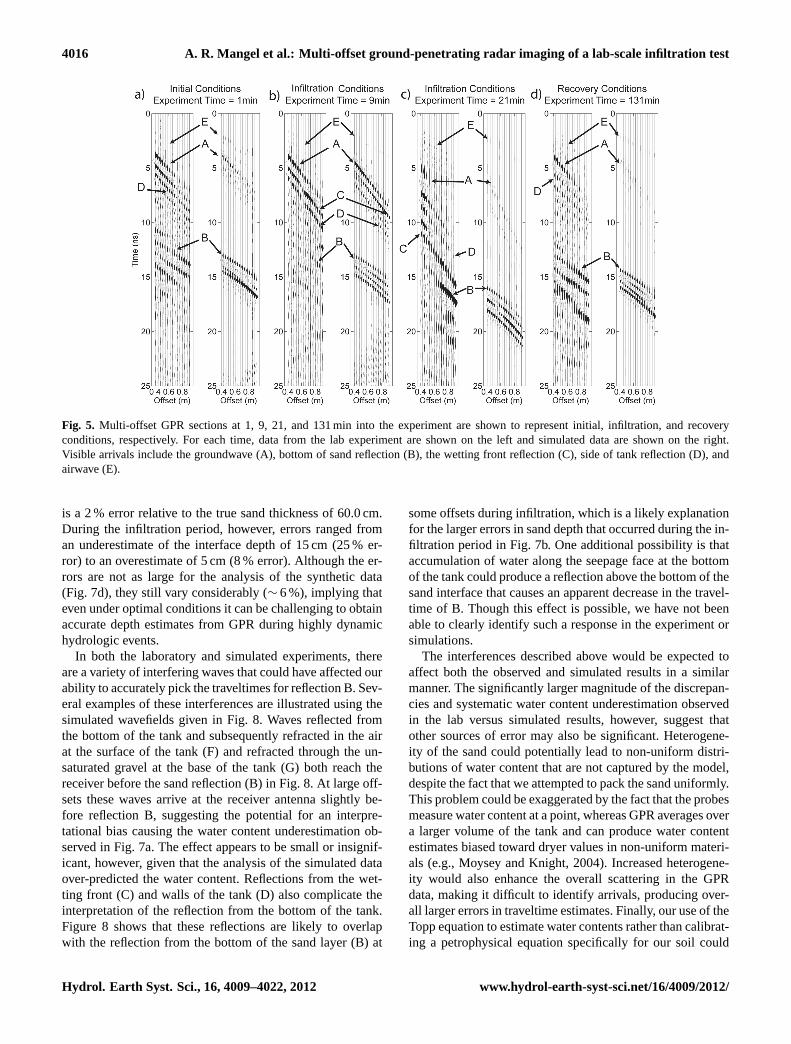
Major arrivals that can be identified in both the empiricaland simulated GPR data include the direct groundwave (A),reflections from the bottom of the sand layer (B), wettingfront (C), side of the tank (D), and the airwave (E) (Fig. 4).Changes in the GPR arrivals during the experiment are shownfor four representative times in the multi-offset images inFig. 5 and four representative antenna offsets in the constantoffset images in Fig. 6. Note that no processing other thandewow filtering and time-zero correction has been performedon these data, and plots were made without gaining the data.We focus our analysis on the bottom of sand reflection (B) forinferring average water contents in the tank and the wettingfront reflection (C) for monitoring the advance of the frontduring infiltration.
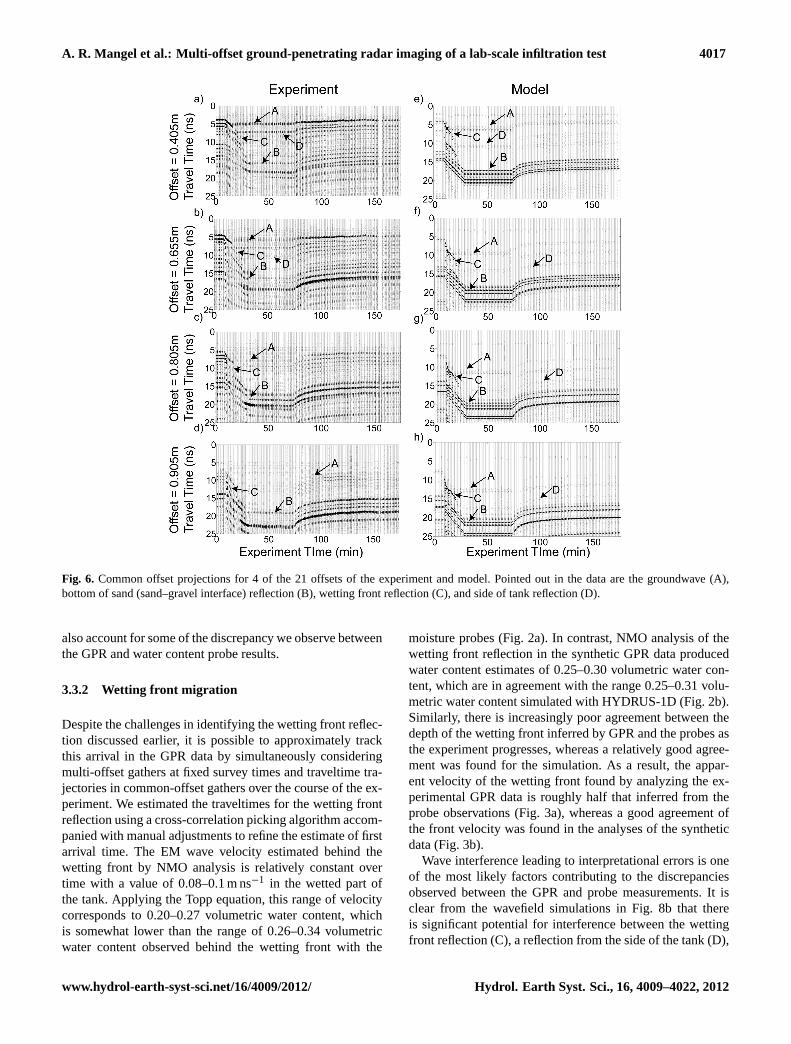
The reflection produced by the bottom of the sandlayer (B) can be clearly identified during the majority of theexperiment, but it is obscured during the infiltration period asthe wetting front migrates downward and intersects it (Figs. 5and 6). A hyperbolic moveout of wave traveltime with an-tenna offset consistent with Eq. (1) can be seen in the multi-offset data at most times, though interference with other ar-rivals is apparent in Fig. 5b and c. For the constant offset im-ages in Fig. 6, the reflection patterns observed through timeare similar to those observed for the moisture probe data,though are inverted due to the inverse relationship betweenwater content and wave velocity.
Reflection C is associated with the downward moving wet-ting front. The wetting front reflection is difficult to identifyin the constant-offset data at early times (8–10 min) due tointerference with the groundwave (i.e., arrival A in Fig. 6).At later times in the experiment (15–20 min), the wettingfront arrival is still difficult to identify, though the cause ofthis problem is hard to determine directly from the data. Nu-merical modeling results indicate that reflections from thewalls of the tank (indicated as arrival D in Figs. 5 and 6)contribute to interference obscuring the wetting front. Thedry soil conditions ahead of the front could also allow forrefracted waves to be produced, though such arrivals werenot readily identified in the data. As the wetting front movesinto the region of higher water content near the bottom of thetank, a loss of reflection amplitude is also expected due tothe decreasing contrast in dielectric constant across the inter-face. Given that variations in the propagation of the wettingfront were observed across the tank with the lateral arrays ofmoisture probes, lateral variability in the depth of the wettingfront could decrease the coherency of reflection event C inthe multi-offset data. We are not able to quantify the degree
Fig. 4. Raypaths for selected arrivals discussed in the paper. Ar-rivals shown here include the groundwave (A), bottom of sand re-flection (B), wetting front reflection (C), side of tank reflection (D),airwave (E), air-refracted bottom of sand reflection (F), refractionthrough the gravel layer (G), and wetting front refraction (H).
of lateral variability that occurred from the GPR data alone,however, given the single transmitter position used for theWARR survey in the experiment; in future experiments, thecollection of intermittent constant offset profiles may help todirectly identify such variability.
3.3 NMO analysis of GPR arrivals
3.3.1 Bulk soil response
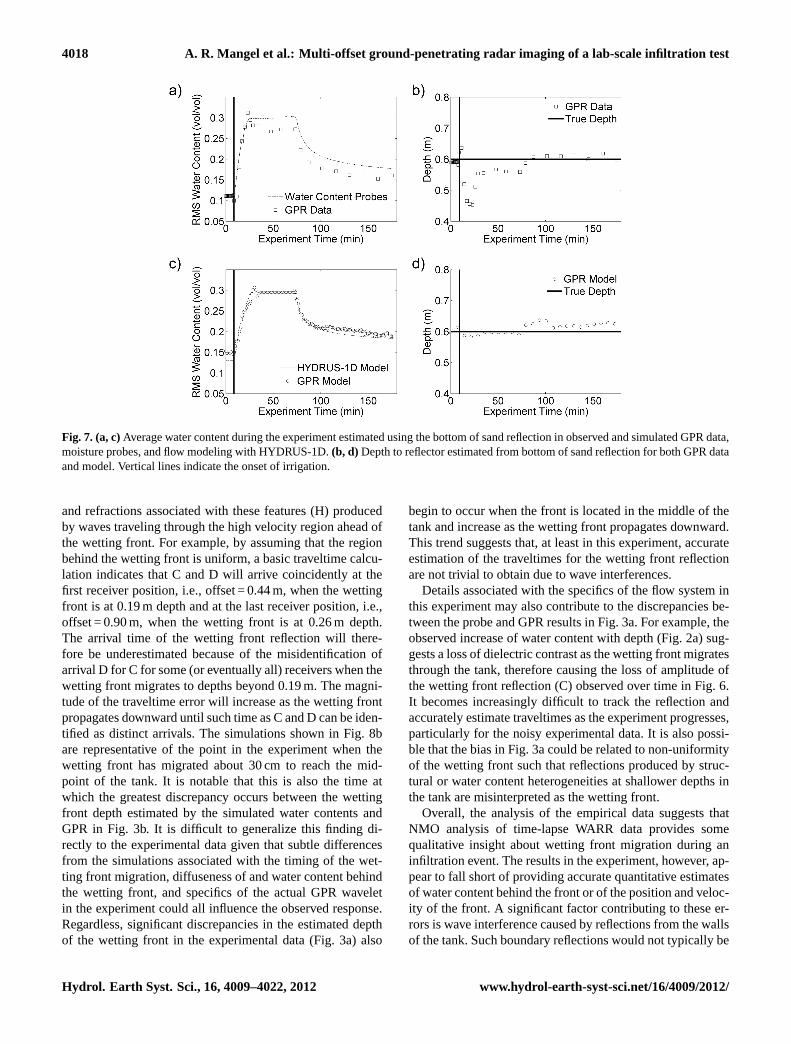
The reflection traveltimes estimated for arrival B (bottom ofthe sand layer) can be used to infer variations of electro-magnetic (EM) wave velocity and estimate the average watercontent of the tank over the course of the experiment. The re-flection traveltimes picked from the multi-offset images wereused with Eq. (1) to estimate the average (RMS) wave veloc-ity within the tank throughout the duration of the experiment.The dielectric constant was then determined with Eq. (2), andwater content values shown in Fig. 7a were obtained usingthe Topp equation (Eq. 3).
Figure 7a shows that the trend in the depth-averaged wa-ter content estimated from the probes and that determinedfrom velocity analysis of reflection B are in reasonably goodagreement. The GPR results generally underestimate theprobe data by about 0.03 volumetric water content, with themaximum discrepancy remaining below 0.05 volumetric wa-ter content. In contrast, the NMO analysis of the syntheticGPR data shows a tendency to overestimate the average tankwater content calculated from the simulated probe measure-ments (Fig. 7c), with discrepancies on the order of 0.01 volu-metric water content but not exceeding 0.03 volumetric watercontent.
NMO analysis can also provide estimates for the depth tothe interface causing the bottom of sand reflections, i.e., thethickness of the sand layer in the tank, which are shown inFig. 7b. The average depth to the bottom of the sand layer es-timated over the course of the experiment is 58.7 cm, which
www.hydrol-earth-syst-sci.net/16/4009/2012/ Hydrol. Earth Syst. Sci., 16, 4009–4022, 2012
4016 A. R. Mangel et al.: Multi-offset ground-penetrating radar imaging of a lab-scale infiltration test
Fig. 5. Multi-offset GPR sections at 1, 9, 21, and 131 min into the experiment are shown to represent initial, infiltration, and recoveryconditions, respectively. For each time, data from the lab experiment are shown on the left and simulated data are shown on the right.Visible arrivals include the groundwave (A), bottom of sand reflection (B), the wetting front reflection (C), side of tank reflection (D), andairwave (E).
is a 2 % error relative to the true sand thickness of 60.0 cm.During the infiltration period, however, errors ranged froman underestimate of the interface depth of 15 cm (25 % er-ror) to an overestimate of 5 cm (8 % error). Although the er-rors are not as large for the analysis of the synthetic data(Fig. 7d), they still vary considerably (∼ 6 %), implying thateven under optimal conditions it can be challenging to obtainaccurate depth estimates from GPR during highly dynamichydrologic events.
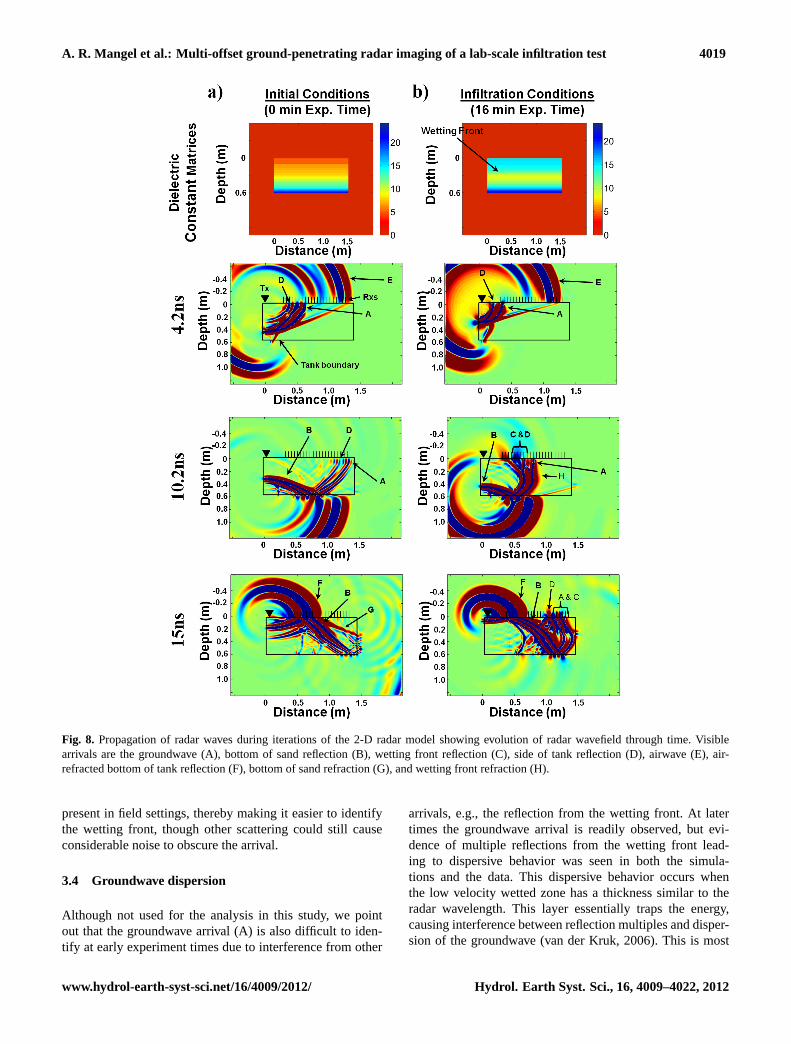
In both the laboratory and simulated experiments, thereare a variety of interfering waves that could have affected ourability to accurately pick the traveltimes for reflection B. Sev-eral examples of these interferences are illustrated using thesimulated wavefields given in Fig. 8. Waves reflected fromthe bottom of the tank and subsequently refracted in the airat the surface of the tank (F) and refracted through the un-saturated gravel at the base of the tank (G) both reach thereceiver before the sand reflection (B) in Fig. 8. At large off-sets these waves arrive at the receiver antenna slightly be-fore reflection B, suggesting the potential for an interpre-tational bias causing the water content underestimation ob-served in Fig. 7a. The effect appears to be small or insignif-icant, however, given that the analysis of the simulated dataover-predicted the water content. Reflections from the wet-ting front (C) and walls of the tank (D) also complicate theinterpretation of the reflection from the bottom of the tank.Figure 8 shows that these reflections are likely to overlapwith the reflection from the bottom of the sand layer (B) at
some offsets during infiltration, which is a likely explanationfor the larger errors in sand depth that occurred during the in-filtration period in Fig. 7b. One additional possibility is thataccumulation of water along the seepage face at the bottomof the tank could produce a reflection above the bottom of thesand interface that causes an apparent decrease in the travel-time of B. Though this effect is possible, we have not beenable to clearly identify such a response in the experiment orsimulations.
The interferences described above would be expected toaffect both the observed and simulated results in a similarmanner. The significantly larger magnitude of the discrepan-cies and systematic water content underestimation observedin the lab versus simulated results, however, suggest thatother sources of error may also be significant. Heterogene-ity of the sand could potentially lead to non-uniform distri-butions of water content that are not captured by the model,despite the fact that we attempted to pack the sand uniformly.This problem could be exaggerated by the fact that the probesmeasure water content at a point, whereas GPR averages overa larger volume of the tank and can produce water contentestimates biased toward dryer values in non-uniform materi-als (e.g., Moysey and Knight, 2004). Increased heterogene-ity would also enhance the overall scattering in the GPRdata, making it difficult to identify arrivals, producing over-all larger errors in traveltime estimates. Finally, our use of theTopp equation to estimate water contents rather than calibrat-ing a petrophysical equation specifically for our soil could
Hydrol. Earth Syst. Sci., 16, 4009–4022, 2012 www.hydrol-earth-syst-sci.net/16/4009/2012/
A. R. Mangel et al.: Multi-offset ground-penetrating radar imaging of a lab-scale infiltration test 4017
Fig. 6. Common offset projections for 4 of the 21 offsets of the experiment and model. Pointed out in the data are the groundwave (A),bottom of sand (sand–gravel interface) reflection (B), wetting front reflection (C), and side of tank reflection (D).
also account for some of the discrepancy we observe betweenthe GPR and water content probe results.
3.3.2 Wetting front migration
Despite the challenges in identifying the wetting front reflec-tion discussed earlier, it is possible to approximately trackthis arrival in the GPR data by simultaneously consideringmulti-offset gathers at fixed survey times and traveltime tra-jectories in common-offset gathers over the course of the ex-periment. We estimated the traveltimes for the wetting frontreflection using a cross-correlation picking algorithm accom-panied with manual adjustments to refine the estimate of firstarrival time. The EM wave velocity estimated behind thewetting front by NMO analysis is relatively constant overtime with a value of 0.08–0.1 m ns−1 in the wetted part ofthe tank. Applying the Topp equation, this range of velocitycorresponds to 0.20–0.27 volumetric water content, whichis somewhat lower than the range of 0.26–0.34 volumetricwater content observed behind the wetting front with the
moisture probes (Fig. 2a). In contrast, NMO analysis of thewetting front reflection in the synthetic GPR data producedwater content estimates of 0.25–0.30 volumetric water con-tent, which are in agreement with the range 0.25–0.31 volu-metric water content simulated with HYDRUS-1D (Fig. 2b).Similarly, there is increasingly poor agreement between thedepth of the wetting front inferred by GPR and the probes asthe experiment progresses, whereas a relatively good agree-ment was found for the simulation. As a result, the appar-ent velocity of the wetting front found by analyzing the ex-perimental GPR data is roughly half that inferred from theprobe observations (Fig. 3a), whereas a good agreement ofthe front velocity was found in the analyses of the syntheticdata (Fig. 3b).
Wave interference leading to interpretational errors is oneof the most likely factors contributing to the discrepanciesobserved between the GPR and probe measurements. It isclear from the wavefield simulations in Fig. 8b that thereis significant potential for interference between the wettingfront reflection (C), a reflection from the side of the tank (D),
www.hydrol-earth-syst-sci.net/16/4009/2012/ Hydrol. Earth Syst. Sci., 16, 4009–4022, 2012
4018 A. R. Mangel et al.: Multi-offset ground-penetrating radar imaging of a lab-scale infiltration test
Fig. 7. (a, c)Average water content during the experiment estimated using the bottom of sand reflection in observed and simulated GPR data,moisture probes, and flow modeling with HYDRUS-1D.(b, d) Depth to reflector estimated from bottom of sand reflection for both GPR dataand model. Vertical lines indicate the onset of irrigation.
and refractions associated with these features (H) producedby waves traveling through the high velocity region ahead ofthe wetting front. For example, by assuming that the regionbehind the wetting front is uniform, a basic traveltime calcu-lation indicates that C and D will arrive coincidently at thefirst receiver position, i.e., offset = 0.44 m, when the wettingfront is at 0.19 m depth and at the last receiver position, i.e.,offset = 0.90 m, when the wetting front is at 0.26 m depth.The arrival time of the wetting front reflection will there-fore be underestimated because of the misidentification ofarrival D for C for some (or eventually all) receivers when thewetting front migrates to depths beyond 0.19 m. The magni-tude of the traveltime error will increase as the wetting frontpropagates downward until such time as C and D can be iden-tified as distinct arrivals. The simulations shown in Fig. 8bare representative of the point in the experiment when thewetting front has migrated about 30 cm to reach the mid-point of the tank. It is notable that this is also the time atwhich the greatest discrepancy occurs between the wettingfront depth estimated by the simulated water contents andGPR in Fig. 3b. It is difficult to generalize this finding di-rectly to the experimental data given that subtle differencesfrom the simulations associated with the timing of the wet-ting front migration, diffuseness of and water content behindthe wetting front, and specifics of the actual GPR waveletin the experiment could all influence the observed response.Regardless, significant discrepancies in the estimated depthof the wetting front in the experimental data (Fig. 3a) also
begin to occur when the front is located in the middle of thetank and increase as the wetting front propagates downward.This trend suggests that, at least in this experiment, accurateestimation of the traveltimes for the wetting front reflectionare not trivial to obtain due to wave interferences.
Details associated with the specifics of the flow system inthis experiment may also contribute to the discrepancies be-tween the probe and GPR results in Fig. 3a. For example, theobserved increase of water content with depth (Fig. 2a) sug-gests a loss of dielectric contrast as the wetting front migratesthrough the tank, therefore causing the loss of amplitude ofthe wetting front reflection (C) observed over time in Fig. 6.It becomes increasingly difficult to track the reflection andaccurately estimate traveltimes as the experiment progresses,particularly for the noisy experimental data. It is also possi-ble that the bias in Fig. 3a could be related to non-uniformityof the wetting front such that reflections produced by struc-tural or water content heterogeneities at shallower depths inthe tank are misinterpreted as the wetting front.
Overall, the analysis of the empirical data suggests thatNMO analysis of time-lapse WARR data provides somequalitative insight about wetting front migration during aninfiltration event. The results in the experiment, however, ap-pear to fall short of providing accurate quantitative estimatesof water content behind the front or of the position and veloc-ity of the front. A significant factor contributing to these er-rors is wave interference caused by reflections from the wallsof the tank. Such boundary reflections would not typically be
Hydrol. Earth Syst. Sci., 16, 4009–4022, 2012 www.hydrol-earth-syst-sci.net/16/4009/2012/
A. R. Mangel et al.: Multi-offset ground-penetrating radar imaging of a lab-scale infiltration test 4019
Fig. 8. Propagation of radar waves during iterations of the 2-D radar model showing evolution of radar wavefield through time. Visiblearrivals are the groundwave (A), bottom of sand reflection (B), wetting front reflection (C), side of tank reflection (D), airwave (E), air-refracted bottom of tank reflection (F), bottom of sand refraction (G), and wetting front refraction (H).
present in field settings, thereby making it easier to identifythe wetting front, though other scattering could still causeconsiderable noise to obscure the arrival.
3.4 Groundwave dispersion
Although not used for the analysis in this study, we pointout that the groundwave arrival (A) is also difficult to iden-tify at early experiment times due to interference from other
arrivals, e.g., the reflection from the wetting front. At latertimes the groundwave arrival is readily observed, but evi-dence of multiple reflections from the wetting front lead-ing to dispersive behavior was seen in both the simula-tions and the data. This dispersive behavior occurs whenthe low velocity wetted zone has a thickness similar to theradar wavelength. This layer essentially traps the energy,causing interference between reflection multiples and disper-sion of the groundwave (van der Kruk, 2006). This is most
www.hydrol-earth-syst-sci.net/16/4009/2012/ Hydrol. Earth Syst. Sci., 16, 4009–4022, 2012
4020 A. R. Mangel et al.: Multi-offset ground-penetrating radar imaging of a lab-scale infiltration test
easily identified by a diagnostic shingling appearance in thegroundwave arrival in multi-offset gathers (van der Kruk etal., 2009). For instance, the shape of the groundwave waveletis clearly affected at larger offsets, suggesting that dispersionis a factor in the data. Preliminary results (not shown) alsoindicate velocity dependent shifts in the frequency spectraof the groundwave occur at early infiltration time (8–10 min)when the wetting front is very shallow, which is characteristicof dispersion due to the presence of a low-velocity waveguide(van der Kruk et al., 2009). We did not, however, observethe shingling effect in the multi-offset data suggested by vander Kruk et al. (2009) as a diagnostic indicator for dispersivewaves caused by the presence of a low-velocity waveguide.This is likely because the longest offset in our data (0.9 m)is less than what is required to observe the shingling effect(van der Kruk, 2006). There is also a loss of amplitude forthe groundwave at large offsets, and at all offsets the ampli-tude decreases during the period of irrigation, but reboundsslightly when the irrigation is terminated. While we have notevaluated the cause of these amplitude variations, they areconsistent with attenuation occurring with changes in electri-cal conductivity associated with the varying water contents.Due to the potential for dispersion and amplitude effects forthe groundwave, we chose not to analyze the groundwavearrival in this work as questions remain whether accuratewave velocities can be estimated from NMO analysis of thegroundwave during infiltration events (van der Kruk et al.,2009).
3.5 Applicability to heterogeneous systems
Despite the fact that the NMO analysis used in this work wasrelatively simple, that our modeling assumption of a later-ally uniform wetting front may be inaccurate based on themoisture probe data, and that there was substantial noise inthe GPR data generated by scattering and refractions, we stillobtained a good deal of quantitative insight into the macro-scopic flow processes occurring in the tank using transientWARR surveys. It is possible that full 3-D GPR imaging,where both the transmitter and receiver antennas are moved,could capture more details related to local variations in flow,i.e., non-uniformity of the wetting front or other preferen-tial flow processes. For example, Truss et al. (2007) wereable to capture the interaction between the wetting front anda meter-scale structural feature (sand-filled hole) that chan-neled flow during an experiment in the Miami Oolite. Boththe 3-D GPR monitoring studies by Truss et al. (2007) andHaarder et al. (2011) suggest, however, that directly captur-ing small-scale preferential flow features can be challenging.Haarder et al. (2011) were able to observe changes in reflec-tion amplitudes that they interpreted to be caused by pondingassociated with funnel flow, but they were not able to inter-pret individual small-scale preferential flow features directlyfrom the GPR data. These authors concluded that GPR wasuseful for identifying patterns associated with large-scale
flow processes, which have been observed by both Haarderet al. (2011) and Truss et al. (2007) to cause macroscopicchanges in water content that produced shifts in the travel-time of reflections associated with soil heterogeneities. Thisis consistent with our results, where we have found that areflection from a subsurface interface, i.e., the sand–gravelboundary at the bottom of the tank, could provide reliableestimates of average water content over time. The complex-ity of the GPR response associated with the wetting front, thepotential for preferential flow at scales below the resolutionof GPR, and the quantitative consistency of water content es-timates observed over both wetting and drying events in thisstudy suggest that soil reflectors, i.e., physical contrasts insubsurface materials, are a critically important tool for quan-titatively monitoring infiltration events.
Given that our experiment was intentionally designed torepresent a simple soil environment with a single interface,it remains an open question whether our degree of successin monitoring infiltration using the NMO approach could beachieved in more complicated environments. We acknowl-edge that acquiring more data, e.g., full-resolution 3-D GPRsurveys with multiple antenna offsets, will always hold morepotential for resolving the details of infiltration in the subsur-face. The time required to perform these surveys, however, isstill a limiting factor; for example, Truss et al. (2007) reportthat in their study 50 min was required to perform each con-stant offset survey over a 10 m× 10 m area using a customsingle channel GPR that was integrated with an advancedpositioning system specifically for 3-D surveying. In con-trast, multi-channel GPR systems amenable to fast WARRsurveying over large areas are commercially available “off-the-shelf” at a reasonable cost. If NMO analysis of transientWARR data could be shown to provide reliable average wa-ter content estimates in heterogeneous soils, it would opena new opportunity to provide critically important data to hy-drologists and soil scientists working at catchment scales.
4 Conclusions
A lab-scale infiltration and redistribution experiment wasperformed to evaluate whether multi-offset GPR could ef-fectively constrain subsurface structures, track infiltrationfronts, and monitor water content variability with time in adynamically evolving system. The unique form of automatedtime-lapse multi-offset surveying used in this study allowedus to collect a 3-D GPR data cube that can be viewed as ei-ther multi-offset or constant offset gathers. Normal-moveout(NMO) analysis of reflections related to the bottom of a sandlayer were used to independently estimate the mean radarvelocity and average soil water content of the tank over thecourse of the experiment and provided agreement with aver-aged moisture probe measurements to within 0.03–0.05 vol-umetric water content. It was also possible to independentlydetermine the thickness of the sand layer in the tank with an
Hydrol. Earth Syst. Sci., 16, 4009–4022, 2012 www.hydrol-earth-syst-sci.net/16/4009/2012/

A. R. Mangel et al.: Multi-offset ground-penetrating radar imaging of a lab-scale infiltration test 4021
average error of about 2 % and maximum error on the orderof 25 %, which occurred as the infiltrating wetting front ap-proached this interface. The movement of the wetting frontreflection was also visible in the GPR data, though it was dif-ficult to track without interpreting the arrival as a reflectionsurface in the 3-D GPR data cube. NMO analysis of the wet-ting front reflection resulted in underestimates of water con-tent in the wetted zone on the order of 0.06 volumetric watercontent compared to measurements made with the moistureprobes. Likewise, the depth of the front was typically un-derestimated leading to underestimation of the wetting frontvelocity by a factor of 2.
Analysis of data for a set of numerical experiments con-ducted in parallel showed a much better agreement betweenthe GPR and moisture probes, particularly for the wettingfront results. From the simulations, it was possible to in-fer that wave interference between the direct wave, multiplereflections from the wetting front, reflections from the sidewalls of the tank, and refractions associated with fast zonesin the air above the tank, the dry sand below the wetting front,and the gravel lining the bottom of the tank could all con-tribute to noise in the data and errors in traveltime estima-tion. In particular, misidentification of refracted waves couldpotentially lead to overestimation of GPR velocity and un-derestimation of water content qualitatively consistent withdiscrepancies observed in the experiment. The magnitude ofthe discrepancies between GPR and moisture probe resultsfor the simulations, however, is substantially smaller thanthat for the experiments. Other factors, such as an incor-rect conceptualization of the tank as a homogeneous, one-dimensional flow system, could play an additional role inaccounting for the magnitude of the discrepancies betweenGPR and probe measurements.
The collection of 3-D GPR data would help to evalu-ate the significance of non-uniform flow versus other pos-sible errors, such as inaccuracies in the petrophysical rela-tionship used to estimate water content from dielectric con-stant. There is also significant potential for learning aboutthe early-time behavior of the wetting front by analyzingchanges in the shape of the groundwave wavelet causedby interference between arrivals, such as reflection multi-ples within the wetted zone. Tools such as dispersion anal-ysis (van der Kruk, 2006) and full-waveform inversion (e.g.,Busch et al., 2010; Minet et al., 2010) are particularlypromising for this purpose.
This study illustrates the potential of transient multi-offsetreflection surveys for improving the characterization of va-dose zone dynamics, particularly the bulk response of a soil.The key advantage of the approach is that it is possible toestimate wave velocity and constrain the depth of subsurfacestructures directly from the GPR data without the need forsupporting data, such as boreholes, to independently con-strain the depth to reflectors. Changes in water content canthen be obtained if a petrophysical relationship between di-electric constant and water content can be estimated for the
soil. Given that multi-offset data can be collected quicklyin the field using commercially available equipment, our re-sults suggest that there is significant opportunity for non-invasive monitoring of soil moisture dynamics over catch-ment scales at time scales relevant to individual hydrologicevents if strong radar reflectors exist within the soil profile.Improved characterization of the hydrologic state of the sub-surface at catchment scales will ultimately lead to a better un-derstanding of vadose zone processes and advances in large-scale soil infiltration models.
Acknowledgements.This material is based upon work supportedby, or in part by, the US Army Research Laboratory and theUS Army Research Office under grant number W911NF-08-1-0370 and W911NF-10-1-0292. We thank two anonymous reviewersfor their helpful comments that improved the manuscript.
Edited by: K. Roth
References
Berard, B. A. and Maillol, J.-M.: Multi-offset ground penetratingradar data for improved imaging in areas of lateral complexity– Application at a Native American site, J. Appl. Geophys., 62,167–177, 2007.
Bradford, J. H.: Measuring water content heterogeneity using mul-tifold GPR with reflection tomography, Vadose Zone J., 7, 184–193, 2008.
Brewster, M. L., Annan, A. P., Greenhouse, J. P., Kueper, B. H.,Olhoeft, G. R., Redman, J. D., and Sander, K. A.: Observed mi-gration of a controlled DNAPL release by geophysical methods,Ground Water, 33, 977–987, 1995.
Busch, S., van der Kruk, J., Bikowski, J., and Vereecken, H.: Full-waveform inversion of muti-offset surface GPR data, in: Pro-ceedings of the 13th International Conference on Ground Pen-etrating Radar, Lecce, Italy, 21–25 June 2010.
Degacon.com, EC-5 Soil Moisture Sensor User Manual:http://www.decagon.com/assets/Uploads/13876-01-Manual-EC-5.pdf, last access: August 2012.
Fisher, E., McMechan, G. A., and Annan, P.: Acquisition and pro-cessing of wide-aperture ground-penetrating radar data, Geo-physics, 57, 495–504, 1992.
Freeland, R. S., Yoder, R. E., and Ammons, J. T.: Mapping shal-low underground features that influence site-specific agriculturalproduction, J. Appl. Geophys., 40, 19–27, 1998.
Freeland, R. S., Odhiambo, L. O., Tyner, J. S., Ammons, J. T., andWright, W. C.: Nonintrusive mapping of near-surface preferentialflow, Appl. Eng. Agr., 22, 315–319, 2006.
Grasmueck, M., Marchesini, P., Eberli, G. P., Zeller, M., and Van-Dam, R. L.: 4D tracking of water infiltration in fractured high-porosity limestone, in: 2010 13th International Conference onGround Penetrating Radar, Lecce, Italy, 21–25 June 2010, 1–6,2010.
Greaves, R. J., Lesmes, D. P., Lee, J. M., and Toksoz, M. N.: Ve-locity variations and water content estimated from multi-offsetground-penetrating radar, Geophysics, 61, 683–695, 1996.
www.hydrol-earth-syst-sci.net/16/4009/2012/ Hydrol. Earth Syst. Sci., 16, 4009–4022, 2012
4022 A. R. Mangel et al.: Multi-offset ground-penetrating radar imaging of a lab-scale infiltration test
Grote, K., Hubbard, S., Harvey, J., and Rubin, Y.: Evaluation of in-filtration in layered pavements using surface GPR reflection tech-niques, J. Appl. Geophys., 57, 129–153, 2005.
Haarder, E. B., Looms, M. C., Jensen, K. H., and Nielsen, L.: Visu-alizing unsaturated flow phenomena using high-resolution reflec-tion ground penetrating radar, Vadose Zone J., 10, 84–97, 2011.
Huisman, J. A., Sperl, C., Bouten, W., and Verstraten, J. M.: Soilwater content measurements at different scales: accuracy of timedomain reflectometry and ground-penetrating radar, J. Hydrol.,245, 48–58, 2001.
Huisman, J. A., Hubbard, S. S., Redman, J. D., and Annan, A. P.:Measuring soil water content with ground penetrating radar, Va-dose Zone J., 2, 476–491, 2003.
Irving, J. and Knight, R.: Numerical modeling of ground-penetrating radar in 2-D using MATLAB, Comput. Geosci., 32,1274–1258, 2006.
Jol, H. M., Annan, P., Arcone, S. A., Bridge, J., Bristow, C., But-nor, J., Buynevich, I. V., Cassidy, N., Comas, X., Damiata, B.,Daniels, D., Doolittle, J., FitzGerald, D., Goodman, D., Higashi,N., Hongo, H., Jol, H., Koppenjan, S., Nishimura, Y., Piro, S.,Redman, D., Saarenketo, T., Schneider, K., Slater, L., Steinberg,J., Yarovoy, A.: Ground Penetrating Radar: Theory and Appli-cations, 1st Edn., edited by: Jol, H. M., Elsevier, Oxford, UK,2009.
Lambot, S., Binley, A., Slob, E., and Hubbard, S.: Ground-penetrating radar in Hydrogeophysics, Vadose Zone J., 7, 137–139, 2008.
Lunt, I. A., Hubbard, S. S., and Rubin, Y.: Soil moisture contentestimation using ground-penetrating radar reflection data, J. Hy-drol., 307, 254–269, 2005.
Minet, J., Lambot, S., Slob, E. C., and Vanclooster, M.: Soil sur-face water content estimation by full-waveform inversion in thepresence of thin layers, IEEE T. Geosci. Remote, 48, 1138–1150,2010.
Moysey, S.: Hydrologic trajectories in transient ground-penetratingradar reflection data, Geophysics, 75, 211–219, 2010.
Moysey, S. and Knight, R. J.: Modeling the field-scale re-lationship between dielectric constant and water content inheterogeneous systems, Water Resour. Res., 40, W03510,doi:10.1029/2003WR002589, 2004.
Mualem, Y.: A new model for predicting the hydraulic conductivityof unsaturated porous media, Water Resour. Res, 12, 513–522,1976.
Saintenoy, A., Schneider, S., and Tucholka, P.: Evaluating ground-penetrating radar use for water infiltration monitoring, VadoseZone J., 7, 208–214, 2008.
Simunek, J., van Genuchten, M. Th., and Sejna, M.: HYDRUS 1DCode for simulating the one-dimensional movement of water,heat, and multiple solutes in variably saturated porous media, De-partment of Environmental Sciences and University of CaliforniaRiverside, US Salinity Laboratory, USDA, ARS, Riverside, CA,2005
Steelman, C. M. and Endres, A. L.: An examination of di-rect ground wave soil moisture monitoring over an annualcycle of soil conditions, Water Resour. Res., 46, W11533,doi:10.1029/2009WR008815, 2010.
Topp, G. C., Davis, J. L., and Annan, A. P.: Electromagnetic deter-mination of soil water content: measurements in coaxial trans-mission lines, Water Resour. Res., 16, 574–582, 1980.
Truss, S., Grasmueck, M., Vega, S., and Viggiano, D. A.: Imag-ing rainfall drainage within the Miami oolitic limestone usinghigh-resolution time-lapse ground-penetrating radar, Water Re-sour. Res., 43, W03405,doi:10.1029/2005WR004395, 2007.
van der Kruk, J.: Properties of surface waveguides derived from in-version of fundamental and higher mode dispersive GPR data,IEEE T. Geosci. Remote, 44, 2908–2915, 2006.
van der Kruk, J., Vereecken, H., and Jacob, R. W.: Identifying dis-persive GPR signals and inverting for surface wave-guide prop-erties, Leading Edge, 28, 936–940, 2009.
van Genuchten, M. Th.: A closed-form equation for predicting thehydraulic conductivity of unsaturated soils, Soil Sci. Soc. Am. J.,44, 892–898, 1980.
van Overmeeren, R. A., Sariowan, S. V., and Gehrels, J. C.: Groundpenetrating radar for determining volumetric soil water content;Results of comparative measurements at two test sites, J. Hydrol.,197, 316–338, 1997.
Yilmaz, O.: Seismic Data Analysis: Processing, Inversion, and In-terpretation of Seismic Data, in: Investigations in Geophysics,2nd Edn., Volume I & 2, edited by: Doherty, S. M. and Cooper,M. R., Society of Exploration Geophysicists, Tulsa, OK, USA,1987.
Hydrol. Earth Syst. Sci., 16, 4009–4022, 2012 www.hydrol-earth-syst-sci.net/16/4009/2012/