Embed Size (px)
Citation preview
Multi-objective regression test selection in practice: An empirical studyin the defense software industry
Garousi, V., Özkan, R., & Betin-Can, A. (2018). Multi-objective regression test selection in practice: An empiricalstudy in the defense software industry. Information and Software Technology, 103, 40-54.https://doi.org/10.1016/j.infsof.2018.06.007
Published in:Information and Software Technology
Document Version:Peer reviewed version
Queen's University Belfast - Research Portal:Link to publication record in Queen's University Belfast Research Portal
Publisher rights© 2018 Elsevier B.V. All rights reserved.This manuscript version is made available under the CC-BY-NC-ND 4.0 license http://creativecommons.org/licenses/by-nc-nd/4.0/,whichpermits distribution and reproduction for non-commercial purposes, provided the author and source are cited.
General rightsCopyright for the publications made accessible via the Queen's University Belfast Research Portal is retained by the author(s) and / or othercopyright owners and it is a condition of accessing these publications that users recognise and abide by the legal requirements associatedwith these rights.
Take down policyThe Research Portal is Queen's institutional repository that provides access to Queen's research output. Every effort has been made toensure that content in the Research Portal does not infringe any person's rights, or applicable UK laws. If you discover content in theResearch Portal that you believe breaches copyright or violates any law, please contact [email protected].
Download date:24. Jul. 2020
This is a pre‐print of the following paper that has been published in the Information and Software Technology (IST) journal:
http://dx.doi.org/10.1016/j.infsof.2018.06.007
1
Multi‐objective regression test selection in practice: an empirical study in
the defense software industry
Vahid Garousi
Information Technology Group
Wageningen University,
Netherlands
Ramazan Özkan
Consultant software engineer
Ankara, Turkey
Aysu Betin‐Can
Informatics Institute, Middle East
Technical University, Ankara, Turkey
Abstract:
Context: Executing an entire regression test‐suite after every code change is often costly in large software projects. To cope
with this challenge, researchers have proposed various regression test‐selection techniques.
Objective: This paper was motivated by a real industrial need to improve regression‐testing practices in the context of a
safety‐critical industrial software in the defence domain in Turkey. To address our objective, we set up and conducted an
“action‐research” collaborative project between industry and academia.
Method: After a careful literature review, we selected a conceptual multi‐objective regression‐test selection framework
(called MORTO) and adopted it to our industrial context by developing a custom‐built genetic algorithm (GA) based on
that conceptual framework. GA is able to provide full coverage of the affected (changed) requirements while considering
multiple cost and benefit factors of regression testing. e.g., minimizing the number of test cases, and maximizing
cumulative number of detected faults by each test suite.
Results: The empirical results of applying the approach on the Software Under Test (SUT) demonstrate that this approach
yields a more efficient test suite (in terms of costs and benefits) compared to the old (manual) test‐selection approach,
used in the company, and another applicable approach chosen from the literature. With this new approach, regression
selection process in the project under study is not ad‐hoc anymore. Furthermore, we have been able to eliminate the
subjectivity of regression testing and its dependency on expert opinions.
Conclusion: Since the proposed approach has been beneficial in saving the costs of regression testing, it is currently in
active use in the company. We believe that other practitioners can apply our approach in their regression‐testing contexts
too, when applicable. Furthermore, this paper contributes to the body of evidence in regression testing by offering a
success story of successful implementation and application of multi‐objective regression testing in practice.
Keywords:
Regression testing; multi‐objective optimization; genetic algorithms; empirical study; defence software industry; action‐
research
This is a pre‐print of the following paper that has been published in the Information and Software Technology (IST) journal:
http://dx.doi.org/10.1016/j.infsof.2018.06.007
2
TABLE OF CONTENTS
1 INTRODUCTION ....................................................................................................................................................................... 2 2 CASE DESCRIPTION AND NEED ANALYSIS ................................................................................................................................. 4
2.1 Industrial context and the software under test .................................................................................................................................. 4 2.2 Need analysis and motivations for the study .................................................................................................................................... 5
3 RELATED WORK ..................................................................................................................................................................... 6 4 DEVELOPING A GENETIC ALGORITHM FOR MULTI-OBJECTIVE REGRESSION TEST SELECTION ....................................................... 8
4.1 An overview of solution approach ..................................................................................................................................................... 8 4.2 Design of the GA for the problem at hand ........................................................................................................................................ 8
5 INDUSTRIAL EMPIRICAL STUDY ............................................................................................................................................... 10 5.1 Goal and research questions .......................................................................................................................................................... 10 5.2 Selection of cost/benefit objectives and calibrating their weight values .......................................................................................... 11 5.3 How the Delphi method was used for determining weights for benefit objectives .......................................................................... 14 5.4 RQ 1: Calibration of the MORTOGA............................................................................................................................................... 15 5.5 RQ 2: Improvements in regression testing provided by MORTOGA .............................................................................................. 18
5.5.1 Choosing the SUT versions for regression testing ............................................................................................................................................. 18 5.5.2 Setting up the control techniques (manual regression testing and selective requirement-based approach) ..................................................... 18 5.5.3 Coverage of affected requirements .................................................................................................................................................................... 19 5.5.4 Cost and benefit objectives ................................................................................................................................................................................ 20
5.6 Benefits of the results and the MORTOGA approach in the industrial context ............................................................................... 22 5.7 Limitations and threats to validity ................................................................................................................................................... 23
6 CONCLUSIONS AND FUTURE WORK ........................................................................................................................................ 24 REFERENCES .......................................................................................................................................................................... 24
1 INTRODUCTION
Software testing is an important phase of the Software Development Life Cycle (SDLC). Furthermore, inadequate
software testing could lead to major economic consequences, e.g., [1‐3]. For example, a report called “Software fail watch”
[1] published in 2017 by a large software company, Tricentis GmbH, revealed that software failures caused $1.7 trillion
globally in financial losses in 2017 alone.
There are different types of software testing approaches. Regression testing is an important type of software testing
activity, which is to test a Software Under Test (SUT) to ensure that code changes have not affected the existing
functionality of the system [4]. The traditional and simplest approach to regression testing is to re‐execute all the test cases
that were used to test the software before the modifications were made, i.e., the “retest all” approach [4]. In practice
however, re‐executing all the previous test cases in regression testing after each software revision is not practical
especially in the case of large software systems, due to time and budget constraints [5]. Regression testing is costly
because, as software grows in size and complexity, a suite accumulate more tests and therefore take longer to run. For
instance, a 2011 paper [6] reported that the regression (automated) testing of a Microsoft product required several days.
An alternative approach is selecting only a subset of the initial test suite. Such an approach is referred to as regression
test‐selection, test prioritization [7, 8], or test minimization [4]. Much research effort has been spent on finding cost‐
efficient methods for regression testing and many techniques have been proposed in the literature (refer to two survey
papers in this area [4, 9]). The techniques in this area are based either on single‐objective optimization (e.g., reducing the
number of test cases) or multi‐objective optimization (e.g., minimizing the number of test cases and maximizing test
coverage). For example, Harman [10] presented a conceptual framework for multi‐objective regression test‐selection,
referred to as Multi‐Objective Regression Test Optimization (MORTO), which considered a set of cost‐based objectives

This is a pre‐print of the following paper that has been published in the Information and Software Technology (IST) journal:
http://dx.doi.org/10.1016/j.infsof.2018.06.007
3
(such as test execution time and third‐party costs) as well as a set of value‐based objectives (such as code coverage and
coverage of past fault).
The work reported in our paper is motivated by a real industrial need to improve regression‐testing practices in the
context of a safety‐critical industrial software in the defence domain. Based on the industrial need, we set up and
conducted an industry‐academia collaborative [11, 12] project and followed the principles of “action‐research” [13, 14].
After an extensive literature review, we chose the MORTO conceptual framework [10] as the baseline, and developed a
custom‐built genetic algorithm (GA) [15] to apply it in the project under study. In the subject project, before development
and introduction of the new approach (as presented in this paper), regression test‐selection was performed manually
making it costly, subjective and error prone. Furthermore, quality of regression testing was highly dependent on the skills
and experience of the test teams and test engineers. Therefore, there was a strong need for systematic approaches to
regression test selection in the subject project. This need was especially very critical given the safety‐critical nature of the
Software Under Test (SUT) since it is a controller software system in the defence domain (further details not disclosed due
to confidentiality).
Our regression test‐selection project had several objectives: (1) to provide full coverage of the requirements that are
affected by the program modifications, and (2) to improve the overall cost‐benefit of the regression testing approach
based on all the relevant regression selection criteria in the project, e.g., minimizing the number of test cases while
ensuring full coverage of the affected requirement by regression test suites. Using the systematic guidelines for
technology transfer provided by Gorschek et al. [16], as a team of researchers and practitioners, we jointly developed a
search‐based approach and transitioned this technology to the industrial context. Since the proposed approach has been
beneficial in saving the costs of regression testing, it is now in active use in the company. After developing and
implementing this systematic approach in the company, a positive outcome is that regression test‐selection in the
company is not ad‐hoc anymore and we diminished the subjectivity and dependency of regression testing on experts’
opinions.
The contribution of this paper is three‐fold:
Design and development of a multi‐objective GA for multi‐objective regression test optimization (i.e., our GA‐
based approach is an “instance” of the MORTO conceptual framework [10] for our specific context);
Empirical calibration (tuning) of the GA (parameters such as GA population size, crossover and mutation rates) to
ensure its best performance [17, 18] in our context; and
Empirical evaluation of the proposed GA and comparing the efficiency of regression test‐selection using the GA
with the old (manual) test‐selection approach, and another applicable approach that we found in the literature
[19].
We have structured the rest of this paper as follows. We describe the project context, SUT and the needs/motivations for
our work in Section 2. We review the related work in Section 3. Section 4 discusses how we developed the GA for multi‐
objective regression test selection in our context. Section 5 explains the application and empirical study of the approach in
our industrial project and evaluates its effectiveness. Finally, in Section 6, we draw conclusions, and discuss our ongoing
and future works.
Note that this paper summarizes the results of MSc thesis of the second author [20]. For the brevity of presentation and
due to space limitations, we have summarized the approach and the empirical results in this paper. For more details, the
reader can refer to the online version of the MSc thesis [20].
This is a pre‐print of the following paper that has been published in the Information and Software Technology (IST) journal:
http://dx.doi.org/10.1016/j.infsof.2018.06.007
4
2 CASE DESCRIPTION AND NEED ANALYSIS
As discussed in Section 1, this work was initiated by an industrial need and we followed the principles of “action‐
research” [13, 14]. Therefore, we first review the industrial context and then discuss the needs and motivations for the
study.
2.1 INDUSTRIAL CONTEXT AND THE SOFTWARE UNDER TEST
The subject project, SUT, is a safety‐critical industrial controller software in the defence domain. The functionality of the
SUT is defined by 935 system‐level requirements. To verify those system‐level requirements, the test team has developed
54 different test suites, each containing a set of test cases (test steps). The numbers of test steps in each of the test suites
vary from 182 to 3,588 test cases. In total, there were 30,834 test cases (test steps) for the entire system. All black‐box test‐
execution activities in this project are all done manually since the project has not yet adopted automated testing practices
[21]. Manual execution times of each of the 54 test suites vary between 2 and 71 hours, per test suite, which results in a
total of more than 1,500 hours of test execution labor. Considering that each workday has 8 hours, this translated to 187+
staff‐days of manual test execution effort, for each single re‐execution of the entire test suites. This denotes that the test
team had to spend a large amount of time and effort on manual regression testing of the SUT. There were about 25 full‐
time manual testers in the company assigned to run such large number of test cases in each round of regression testing on
each version of the SUT.
The customer of the project is a major government organization in Turkey. At the time when the current industry‐
academia collaborative project started, the subject project had entered its acceptance‐testing phase. The subject project is
still ongoing as of this writing and the software is in the maintenance phase. A test group in the customer organization
was tasked with executing acceptance tests and this group is authorized to determine the regression test coverage of each
software build. The second author of this paper was a member of this test group for several years.
The project contractor is a large company with expertise in a broad range of products in defense. For confidentiality
reasons, we only share limited details about the context and the subject project throughout this paper. The contractor
company has achieved the CMMI Level 5 rating in the following areas: (1) software and systems engineering, (2)
integrated product and process development, and (3) supplier sourcing. Because of having CMMI Level 5 rating, all
software‐testing activities are well documented and conducted in high standards by the project contractor.
For the subject project (SUT), there is an independent test group in the contractor company. The test group itself consists
of several test teams, partitioned by the type of subsystems in the SUT. All of the test activities, conducted together with
participation of the customer test team, are black‐box testing, since the customer does not have access to the SUT’s source
code. As of this writing, as discussed above, the SUT is in the software maintenance phase and test teams conducted
regression tests after each revision of the SUT with participation of the contractor and customer test teams.
Since the contractor company had achieved the CMMI Level 5 rating, it has a systematic metric/measurement program
and a set of measurement databases in place. One of those measurement databases is used by the test team to store, in fine
granularity, historical cost (effort) data for different cost factors in testing, e.g., costs of third‐party services (in staff‐hours)
needed for a given test case, and system setup costs needed for a given test case. The cost (effort) database had historical
going back several years at the time of the project reported in this paper. The teams regularly used such data to make
various decisions w.r.t. test and test management in the company. During our empirical study reported in this paper, we
also used some data from the cost (effort) database as reported in Section 5.2.
In case of a test failure, which is determined by the contractor, a software fix is implemented and a new software build is
submitted. Before the introduction of improvements proposed in this paper, in order to assure the customer that software
changes did not affect previously‐verified functionalities, the contractor test team used to provide a list of possibly‐

This is a pre‐print of the following paper that has been published in the Information and Software Technology (IST) journal:
http://dx.doi.org/10.1016/j.infsof.2018.06.007
5
affected low‐level requirements and proposed a regression test suite based on their analysis and experience for each
software build. In the rest of the paper, we will refer to the set of test suites selected for regression as “regression test‐set”.
Contractually, in the subject project, a test suite cannot be divided in sub‐parts (test cases or test steps) in the regression
selection process. Therefore, a test suite is either executed in its entirety or not at all. Such a condition is due to various
reason, one being the need for systematic “end‐to‐end”” testing [22], in which a black‐box test suite tests a complete end‐
to‐end behavioral scenario of the SUT, e.g., one use‐case of the safety‐critical controller software.
2.2 NEED ANALYSIS AND MOTIVATIONS FOR THE STUDY
In the project under study, in the past, each time when a software fix was implemented, the customer test team used to
first evaluate the list of affected system requirements and the regression test‐set proposed by the contractor test team. The
customer test team would then either accept the proposed regression test‐set or would request adding more test suites to
it. The entire approach was ad‐hoc, subjective and purely based on expert opinion. To make the matters worse, there was
an inherent challenge (conflict) in the process since the contractor test team always tried eagerly to “minimize” the scope
and size of regression test‐set, naturally to lower their own test cost and effort, the customer test team usually had the
tendency to “enlarge” the scope of regression test‐set as much as possible, by adding extra test suites “to be on the safe
side”. As a result, the regression testing process needed extensive meetings and discussions about the extent (scope) of the
regression test‐set. This unsystematic process usually led to long, controversial (and often unpleasant) discussions and at
the end of negotiations, there was a test suite which made neither side happy. Ironically, as per our analysis, the resulting
test suites usually did not even achieve 100% coverage of the affected (changed) requirements, since they were derived
with ad‐hoc mechanisms, e.g., ad‐hoc and complex Excel‐sheet‐ and heuristics‐based decision‐support.
Neither the customer nor the contractor test team had access to source code and lacked detailed information about the
software (the entire software is highly classified due to its nature), and therefore, decisions about the scope of regressing
testing were made subjectively and mostly based on rules of thumb.
After several rounds of meetings among the both test teams and the research team (authors of this paper), both test teams
mentioned that they were keen to improve the existing ad‐hoc regression test‐selection practices and establish a
systematic, more effective and efficient regression test‐selection approach. The important criteria that the stakeholders
raised for regression testing were to include a set of cost and value (benefit) factors (as discussed next). Let us clarify that
the project stakeholders were typical and included: the customer, developers, testers and managers. We were asked to
develop a better regression testing approach that would cover all the affected system requirements, by a new software
revision (maintenance activity), while, at the same time, would entail the least cost and provide maximum value (benefit)
for regression testing.
The stakeholders observed in the past that multiple cost and benefit factors were associated with regression testing of the
subject system. Two example cost factors that we identified in discussions with the stakeholders are: (1) Test execution
time: time required for executing a test suite (conducted mostly manually in the project as test automation is not widely
practiced in this project); and (2) Third party cost: the cost of services procured from third party organizations, since some
of the test suites in the subject system required specific services and hardware devices that cannot be provided by the
internal stakeholders and had to be acquired/rented from third party organizations (often, due to their “classified”
nature).
Similarly, we identified the following example value (benefit) factors in our discussions with the stakeholders: (1)
Number of detected faults: experience has shown that as the software is developed and periodically upgraded, the
phenomenon of re‐emergence of similar defects is quite common [23]. Thus, the detection ability of past faults by a given
regression test suite is seen as one of its values and it makes sense, in regression testing, to give priority to test suites
which detect higher number of past faults; (2) Faults severity: it is not only the number of faults detected by a test suite
This is a pre‐print of the following paper that has been published in the Information and Software Technology (IST) journal:
http://dx.doi.org/10.1016/j.infsof.2018.06.007
6
that is important, but also the severity of faults. Test suites which detect more severe faults are better to be prioritized in
regression testing.
While some test suites may be deemed of high priority in terms of some of the above cost objectives, they may be assessed
in lower priority in terms of the value (benefit) objectives. Also, similar to the many other contexts in the optimization
research literature, the cost and value factors in this context represented “conflicting” objectives and both categories of
objectives should be considered holistically in the optimization approach. As a result, this turns the problem into a
challenging multi‐object optimization problem [24]. Thus, the work reported in this paper was initiated to develop a
solution for the problem at hand.
3 RELATED WORK
Using an existing 7‐step process for technology transfer, proposed by Gorschek et al. [16], after identifying the need and
motivations for the study (as discussed in Section 2), we conducted a careful literature review to be aware of the state of
the art and practice in this area, and possibly find a suitable approach as the baseline to be adopted/extended in our
project.
(Automated) regression test‐selection has become a research field of its own since a few decades ago and a large number
of regression test‐selection techniques have been presented in this area (perhaps at least 200 studies so far according to
[4]). Given such a large number of papers, it is not practical to review all of them in this section, but instead, we review a
few of the many survey (review) papers that have been published in this area [4, 9, 25‐28], as listed in Table 1. These
review papers were identified in a recent systematic literature review (SLR) of literature reviews in software testing [29] (a
so‐called “tertiary” study).
As listed in Table 1, we can see the intensive focus of the research community on regression test minimization, selection
and prioritization. Some of these review papers have focused on more focused topics, e.g., application of genetic
algorithms for test‐case prioritization in [27], and have reviewed a smaller number of (primary) studies (7 papers in [27]).
However, other review papers in this set have taken a “broader” focus and have reviewed a larger pool of papers in this
area (189 papers in [4]). Interested readers can use any of the review papers listed in Table 1 as an “index” to the vast
body of knowledge in this area and study any of the many papers in this area.
The concept of regression test‐selection is closely related to two similar concepts: test‐case prioritization and test‐suite
minimization [4]. While test‐case selection seeks to identify the test cases that are relevant to some set of recent changes in
the system under test (SUT), test‐suite minimization seeks to eliminate redundant test cases in order to reduce the number
of tests to run. Test‐case prioritization seeks to order test cases in such a way that early fault detection is maximized.
Those techniques sort (prioritize) test cases selected using a modification‐based technique according to coverage or other
objectives [30].
Table 1‐ A summary of the existing review (survey) papers in the field of regression test‐selection (by years of
publication)
Year of
publication
Reference Paper title Type of survey
(review) paper
Num. of (primary)
studies reviewed
2010 [9] A systematic review on regression test selection
techniques
SLR 27
2011 [25] Regression test selection techniques: a survey Regular survey 118
2012 [4] Regression testing minimization, selection and
prioritisation: a survey
Regular survey 189
2012 [26] Systematic literature review on regression test
prioritization technique
SLR 65
2012 [27] On the application of genetic algorithms for test‐ SLR 7

This is a pre‐print of the following paper that has been published in the Information and Software Technology (IST) journal:
http://dx.doi.org/10.1016/j.infsof.2018.06.007
7
case prioritization: a systematic literature review
2013 [28] Test‐case prioritization: a systematic mapping
study
Systematic mapping 120
2018 [27] Test‐case prioritization approaches in regression
testing: a systematic literature review
SLR 69
Some of regression test‐selection techniques work by comparing outputs produced by old and new versions of the SUT.
In these techniques, tests that will cause the modified program to produce different output than the original program are
selected. Most of these techniques focused on software modifications in the SUT by using source‐code analysis methods
such as execution trace analysis, data‐flow analysis and control‐flow analysis [31‐38]. These techniques were not
applicable in our case since we had no access to source code.
Test‐selection based on test‐suite minimization aim at finding a smaller group of test cases having the same coverage with
respect to produced outputs of the old and modified SUT. For instance, Gu et al. [19] developed an algorithm that
minimizes test suites by maximizing the coverage of the changed requirements (i.e. the requirements that are affected by
the program modifications) and minimizing coverage of unaffected (irrelevant) requirement.
By reviewing the literature, we also realized that the majority of existing regression test‐selection techniques have focused
on a single objective or two objectives. However, in many real‐world regression testing scenarios, including our project as
discussed in Section 2.2, we have observed that there are more than two objectives (criteria) that have an impact on
effectiveness and efficiency of a regression test suite such as execution time, coverage, priority (assigned by experts), and
fault history. Therefore, industrial applicability of many of the existing single‐ or dual‐objective regression test‐selection
techniques is limited [4]. To tackle the regression testing problem in such contexts, Harman discussed the need for
multiple criteria by coining the term Multi‐Objective Regression Test Optimization (MORTO) and provided a list of
possible regression test‐selection criteria in [10]. As presented in [10], MORTO is not a fully‐developed approach yet, and
only serves as a conceptual framework for this problem.
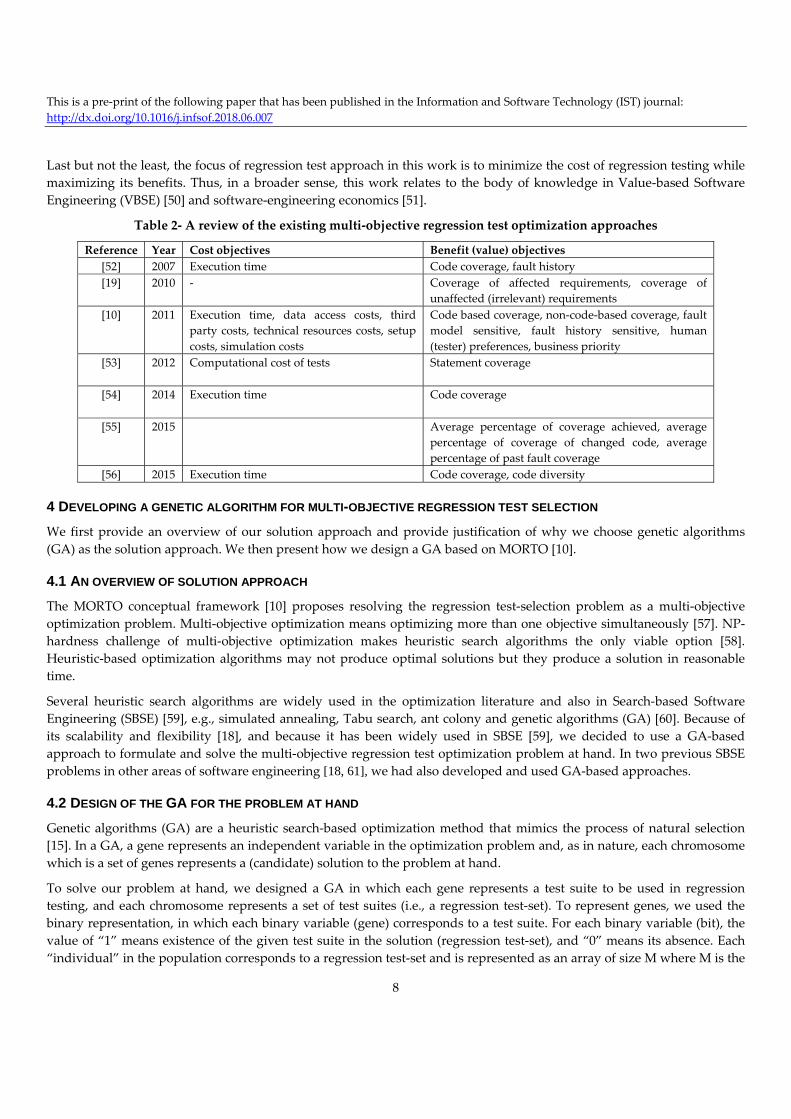
We further reviewed the literature regarding existing multi‐objective regression test optimization approaches, and we list
the approaches that we have found in Table 2. We also provide in Table 2 the list of cost/benefit objectives considered in
each approach. The MORTO conceptual framework [10] seems the most comprehensive approach in terms of number of
support cost/benefit objectives. After our careful literature review, we selected the MORTO approach [10] as our base
framework, since it defines a consolidated framework supporting multiple objectives for regression testing, and
compared to the other approaches, e.g. [6], its conceptual framework of cost and benefit drivers was more applicable to
our context and the set of our cost and benefit drivers (as discussed in Section 2.2).
As we can see in in Table 2, some of the identified approaches considered code coverage as a value objective which can
only be utilized when conducting white‐box (regression) test selection. To the best of our knowledge, the work of Gu et al.
[19] is the only regression test approach which has considered black‐box objectives, i.e., coverage of affected
requirements, and coverage of unaffected (irrelevant) requirements. Since in our study context, we did not have access to
the system source code, only a black‐box (regression) test selection was feasible. Thus, from the set of all existing
approaches in the literature, only the approach of Gu et al. [19] could be applied in our context which we did (details in
Section 5.4).
The other category of related work is the group of studies reported for testing software systems in the “defense” domain.
While most of the efforts in this area are “classified” (confidential) and are not usually reported in publication venues (i.e.,
journals and conferences), some researchers and practitioners have reported studies in this area, e.g., [39‐45]. “CrossTalk:
The Journal of Defense Software” is a dedicate journal for software engineering on the defense domain and some of its
papers are on testing, e.g., [42, 43]. There are also sources in the grey literature discussing software testing in the defense
domain, e.g., [46‐49]. However, we did not find any studies, neither in formal or grey literature, in the topic of regression
test optimization for defense‐related software systems.
This is a pre‐print of the following paper that has been published in the Information and Software Technology (IST) journal:
http://dx.doi.org/10.1016/j.infsof.2018.06.007
8
Last but not the least, the focus of regression test approach in this work is to minimize the cost of regression testing while
maximizing its benefits. Thus, in a broader sense, this work relates to the body of knowledge in Value‐based Software
Engineering (VBSE) [50] and software‐engineering economics [51].
Table 2‐ A review of the existing multi‐objective regression test optimization approaches
Reference Year Cost objectives Benefit (value) objectives
[52] 2007 Execution time Code coverage, fault history
[19] 2010 ‐ Coverage of affected requirements, coverage of
unaffected (irrelevant) requirements
[10] 2011 Execution time, data access costs, third
party costs, technical resources costs, setup
costs, simulation costs
Code based coverage, non‐code‐based coverage, fault
model sensitive, fault history sensitive, human
(tester) preferences, business priority
[53] 2012 Computational cost of tests
Statement coverage
[54] 2014 Execution time
Code coverage
[55] 2015 Average percentage of coverage achieved, average
percentage of coverage of changed code, average
percentage of past fault coverage
[56] 2015 Execution time Code coverage, code diversity
4 DEVELOPING A GENETIC ALGORITHM FOR MULTI-OBJECTIVE REGRESSION TEST SELECTION
We first provide an overview of our solution approach and provide justification of why we choose genetic algorithms
(GA) as the solution approach. We then present how we design a GA based on MORTO [10].
4.1 AN OVERVIEW OF SOLUTION APPROACH
The MORTO conceptual framework [10] proposes resolving the regression test‐selection problem as a multi‐objective
optimization problem. Multi‐objective optimization means optimizing more than one objective simultaneously [57]. NP‐
hardness challenge of multi‐objective optimization makes heuristic search algorithms the only viable option [58].
Heuristic‐based optimization algorithms may not produce optimal solutions but they produce a solution in reasonable
time.
Several heuristic search algorithms are widely used in the optimization literature and also in Search‐based Software
Engineering (SBSE) [59], e.g., simulated annealing, Tabu search, ant colony and genetic algorithms (GA) [60]. Because of
its scalability and flexibility [18], and because it has been widely used in SBSE [59], we decided to use a GA‐based
approach to formulate and solve the multi‐objective regression test optimization problem at hand. In two previous SBSE
problems in other areas of software engineering [18, 61], we had also developed and used GA‐based approaches.
4.2 DESIGN OF THE GA FOR THE PROBLEM AT HAND
Genetic algorithms (GA) are a heuristic search‐based optimization method that mimics the process of natural selection
[15]. In a GA, a gene represents an independent variable in the optimization problem and, as in nature, each chromosome
which is a set of genes represents a (candidate) solution to the problem at hand.
To solve our problem at hand, we designed a GA in which each gene represents a test suite to be used in regression
testing, and each chromosome represents a set of test suites (i.e., a regression test‐set). To represent genes, we used the
binary representation, in which each binary variable (gene) corresponds to a test suite. For each binary variable (bit), the
value of “1” means existence of the given test suite in the solution (regression test‐set), and “0” means its absence. Each
“individual” in the population corresponds to a regression test‐set and is represented as an array of size M where M is the
This is a pre‐print of the following paper that has been published in the Information and Software Technology (IST) journal:
http://dx.doi.org/10.1016/j.infsof.2018.06.007
9
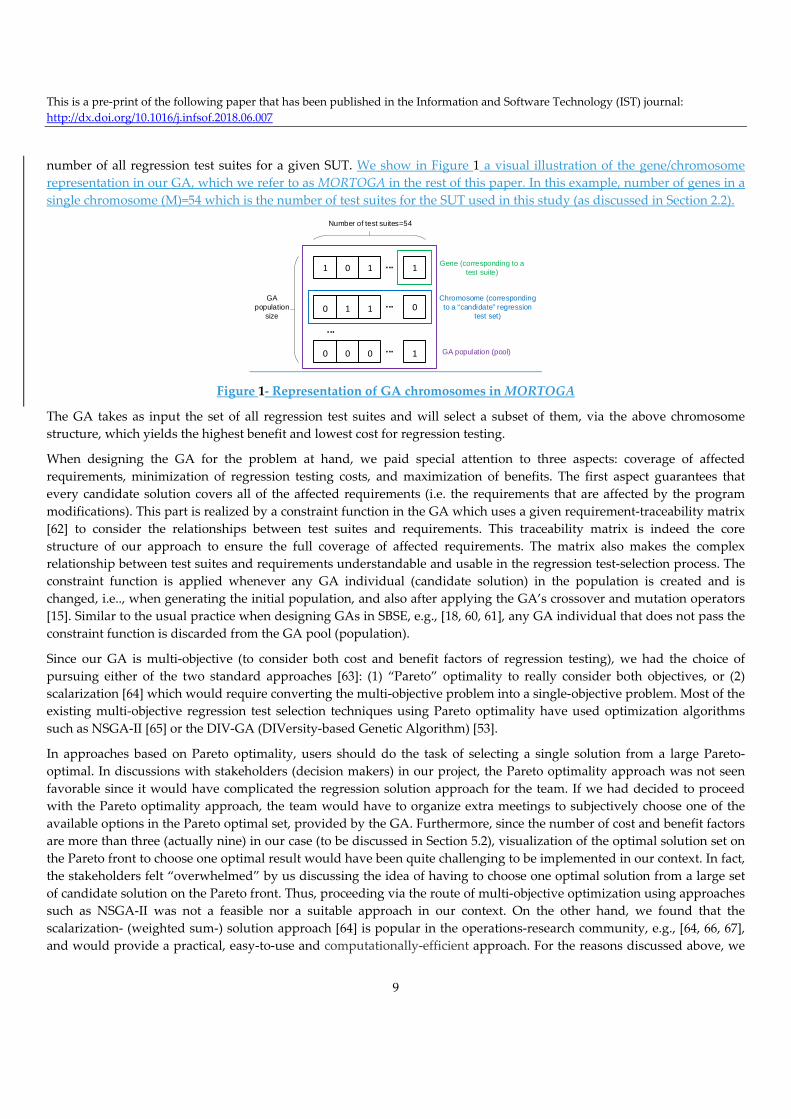
number of all regression test suites for a given SUT. We show in Figure 1 a visual illustration of the gene/chromosome
representation in our GA, which we refer to as MORTOGA in the rest of this paper. In this example, number of genes in a
single chromosome (M)=54 which is the number of test suites for the SUT used in this study (as discussed in Section 2.2).
Figure 1‐ Representation of GA chromosomes in MORTOGA
The GA takes as input the set of all regression test suites and will select a subset of them, via the above chromosome
structure, which yields the highest benefit and lowest cost for regression testing.
When designing the GA for the problem at hand, we paid special attention to three aspects: coverage of affected
requirements, minimization of regression testing costs, and maximization of benefits. The first aspect guarantees that
every candidate solution covers all of the affected requirements (i.e. the requirements that are affected by the program
modifications). This part is realized by a constraint function in the GA which uses a given requirement‐traceability matrix
[62] to consider the relationships between test suites and requirements. This traceability matrix is indeed the core
structure of our approach to ensure the full coverage of affected requirements. The matrix also makes the complex
relationship between test suites and requirements understandable and usable in the regression test‐selection process. The
constraint function is applied whenever any GA individual (candidate solution) in the population is created and is
changed, i.e.., when generating the initial population, and also after applying the GA’s crossover and mutation operators
[15]. Similar to the usual practice when designing GAs in SBSE, e.g., [18, 60, 61], any GA individual that does not pass the
constraint function is discarded from the GA pool (population).
Since our GA is multi‐objective (to consider both cost and benefit factors of regression testing), we had the choice of
pursuing either of the two standard approaches [63]: (1) “Pareto” optimality to really consider both objectives, or (2)
scalarization [64] which would require converting the multi‐objective problem into a single‐objective problem. Most of the
existing multi‐objective regression test selection techniques using Pareto optimality have used optimization algorithms
such as NSGA‐II [65] or the DIV‐GA (DIVersity‐based Genetic Algorithm) [53].
In approaches based on Pareto optimality, users should do the task of selecting a single solution from a large Pareto‐
optimal. In discussions with stakeholders (decision makers) in our project, the Pareto optimality approach was not seen
favorable since it would have complicated the regression solution approach for the team. If we had decided to proceed
with the Pareto optimality approach, the team would have to organize extra meetings to subjectively choose one of the
available options in the Pareto optimal set, provided by the GA. Furthermore, since the number of cost and benefit factors
are more than three (actually nine) in our case (to be discussed in Section 5.2), visualization of the optimal solution set on
the Pareto front to choose one optimal result would have been quite challenging to be implemented in our context. In fact,
the stakeholders felt “overwhelmed” by us discussing the idea of having to choose one optimal solution from a large set
of candidate solution on the Pareto front. Thus, proceeding via the route of multi‐objective optimization using approaches
such as NSGA‐II was not a feasible nor a suitable approach in our context. On the other hand, we found that the
scalarization‐ (weighted sum‐) solution approach [64] is popular in the operations‐research community, e.g., [64, 66, 67],
and would provide a practical, easy‐to‐use and computationally‐efficient approach. For the reasons discussed above, we
1 ...0 1 1
Number of test suites=54
Gene (corresponding to a test suite)
...1 1 0
0 ...0 0 1
...
GA population
size
Chromosome (corresponding to a “candidate” regression
test set)
GA population (pool)
0
This is a pre‐print of the following paper that has been published in the Information and Software Technology (IST) journal:
http://dx.doi.org/10.1016/j.infsof.2018.06.007
10
chose the scalarization approach and converted the multi‐objective problem to a single‐objective problem as discussed
next.
To implement multi‐objective optimization as a scalarized single‐objective GA, we defined a fitness (objective) function
for our GA. Using this fitness function, the GA would find the best regression test‐set among the candidates. We show in
Equation 1 the fitness function, in which the cost and value objectives are combined into one single objective by using a
weighting scheme. The fitness (objective) function includes the weighting factors (coefficients) and (cost/benefit)
objectives. The actual weighting values to be used inside Equation 1 would be specific for a given subject project (SUT).
For our specific case‐study SUT, we will discuss in Section 5.2 how we determined the values for the weighting values in
the fitness function.
∀ ∈
,∀ ∈
Equation 1 ‐ Fitness (objective) function of the GA
In Equation 1, Fitness(c) represents the fitness function value for a given chromosome c. The term ObjValue(g, o) is the
value of each objective (cost or benefit objectives) for a given test suite (gene) g. The term factor(o) denotes the
predetermined weight (ratio) of each objective o in the overall fitness value.
To consider cost and benefit objectives properly, the factor coefficients of benefit objectives are positive values while the
factor coefficients of cost objectives are negative values, and the goal is to maximize the overall fitness value.
Note that the GA has been developed in an extensible manner for the objectives, any set (combination) of cost and benefit
objectives can be plugged into the fitness function, depending on the SUT. We implemented our GA in Matlab and its
code is available open‐source online [68]. In the rest of this paper, we refer to our approach and GA as MORTOGA.
5 INDUSTRIAL EMPIRICAL STUDY
Once we designed the MORTOGA approach, which was based on our industrial need (Section 2), we applied it to our
industrial setting in an empirical study to assess its usefulness. We discuss the empirical study’s goal, research questions
(RQs) and results next.
5.1 GOAL AND RESEARCH QUESTIONS
The goal of the empirical study was to improve the current manual regression test‐selection process of a large industrial
safety‐critical software by applying the MORTOGA approach, as developed in Section 4. Before applying the GA on the
problem domain (SUT), we were aware from the SBSE literature that the GA’s internal parameters (e.g., population size,
crossover and mutation rates) had to be first properly “tuned” (calibrated) empirically to ensure its best performance [17,
18]. Various studies, e.g., [17, 18], have shown that, when not calibrated properly, performance and outputs generated by
SBSE techniques could be sub‐par and far from the best outcomes. Thus, empirical calibration of MORTOGA’s internal
parameters (e.g., population size, crossover and mutation rates) to the problem at hand was our first task in the empirical
study.
Based on the above goal, we posed two research questions (RQs):
RQ 1: How can the MORTOGA be best calibrated (tuned) to yield the best results in the context under study? As
discussed above, a GA’s internal parameters (e.g., population size, crossover and mutation rates) have to be also
properly tuned (calibrated) empirically to ensure its best performance [17, 18].
RQ 2: How much improvement in regression testing does MORTOGA approach provide compared to the manual
regression test‐selection and the selected approach from the literature, the requirement coverage‐based approach
[19]?
This is a pre‐print of the following paper that has been published in the Information and Software Technology (IST) journal:
http://dx.doi.org/10.1016/j.infsof.2018.06.007
11
RQs 1 and 2 will be addressed in Section 5.4 and 5.5. But before answering them, to adopt and apply the GA in the subject
project, we had to first select the cost/benefit objectives in the project under study, and then calculate their weighting
values to embed inside the fitness function in Equation 1, which we discuss next.
5.2 SELECTION OF COST/BENEFIT OBJECTIVES AND CALIBRATING THEIR WEIGHT VALUES
As discussed in the MORTOGA design (Section 4.2), before using the GA approach in the project, we needed to calibrate
the GA with cost and benefit weight values. We developed the GA in a flexible / extensible manner in terms of the
objectives, i.e., various sets of cost and benefit objectives can be plugged into the fitness function, depending on the
system and project under test.
As a result of meetings with various stakeholders in the project, we selected the following cost/benefit objectives for the
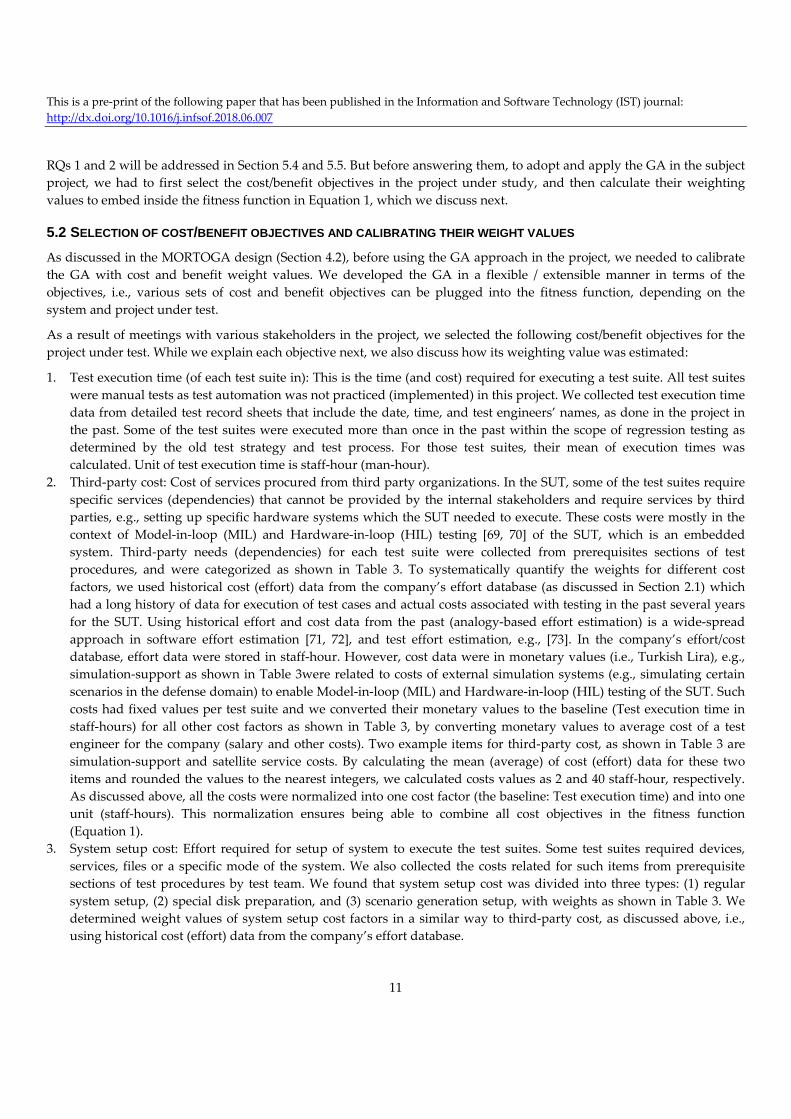
project under test. While we explain each objective next, we also discuss how its weighting value was estimated:
1. Test execution time (of each test suite in): This is the time (and cost) required for executing a test suite. All test suites
were manual tests as test automation was not practiced (implemented) in this project. We collected test execution time
data from detailed test record sheets that include the date, time, and test engineers’ names, as done in the project in
the past. Some of the test suites were executed more than once in the past within the scope of regression testing as
determined by the old test strategy and test process. For those test suites, their mean of execution times was
calculated. Unit of test execution time is staff‐hour (man‐hour).
2. Third‐party cost: Cost of services procured from third party organizations. In the SUT, some of the test suites require
specific services (dependencies) that cannot be provided by the internal stakeholders and require services by third
parties, e.g., setting up specific hardware systems which the SUT needed to execute. These costs were mostly in the
context of Model‐in‐loop (MIL) and Hardware‐in‐loop (HIL) testing [69, 70] of the SUT, which is an embedded
system. Third‐party needs (dependencies) for each test suite were collected from prerequisites sections of test
procedures, and were categorized as shown in Table 3. To systematically quantify the weights for different cost
factors, we used historical cost (effort) data from the company’s effort database (as discussed in Section 2.1) which
had a long history of data for execution of test cases and actual costs associated with testing in the past several years
for the SUT. Using historical effort and cost data from the past (analogy‐based effort estimation) is a wide‐spread
approach in software effort estimation [71, 72], and test effort estimation, e.g., [73]. In the company’s effort/cost
database, effort data were stored in staff‐hour. However, cost data were in monetary values (i.e., Turkish Lira), e.g.,
simulation‐support as shown in Table 3were related to costs of external simulation systems (e.g., simulating certain
scenarios in the defense domain) to enable Model‐in‐loop (MIL) and Hardware‐in‐loop (HIL) testing of the SUT. Such
costs had fixed values per test suite and we converted their monetary values to the baseline (Test execution time in
staff‐hours) for all other cost factors as shown in Table 3, by converting monetary values to average cost of a test
engineer for the company (salary and other costs). Two example items for third‐party cost, as shown in Table 3 are
simulation‐support and satellite service costs. By calculating the mean (average) of cost (effort) data for these two
items and rounded the values to the nearest integers, we calculated costs values as 2 and 40 staff‐hour, respectively.
As discussed above, all the costs were normalized into one cost factor (the baseline: Test execution time) and into one
unit (staff‐hours). This normalization ensures being able to combine all cost objectives in the fitness function
(Equation 1).
3. System setup cost: Effort required for setup of system to execute the test suites. Some test suites required devices,
services, files or a specific mode of the system. We also collected the costs related for such items from prerequisite
sections of test procedures by test team. We found that system setup cost was divided into three types: (1) regular
system setup, (2) special disk preparation, and (3) scenario generation setup, with weights as shown in Table 3. We
determined weight values of system setup cost factors in a similar way to third‐party cost, as discussed above, i.e.,
using historical cost (effort) data from the company’s effort database.
This is a pre‐print of the following paper that has been published in the Information and Software Technology (IST) journal:
http://dx.doi.org/10.1016/j.infsof.2018.06.007
12
4. Technical resources cost (test execution environment) to be spent by the internal team in the company: There are
different test environments for the subject system, e.g., software on simulated hardware lab. Usage of these
environments also incurs costs. We excluded the lab installation costs because installation of the lab was done only
once. The other cost items that we included were: simulated software in the lab (i.e., Software‐in‐the‐Loop, SIL),
software on real hardware (HIL), real system or any combination of these environments. While usage of the simulated
software in the lab (i.e., Software‐in‐the‐Loop, SIL) testing approach had a cost of 4 staff‐hours, testing the model of
“All on the real system” had a cost of 48 staff‐hours.
5. Verification (oracle) cost: Verification of specific requirement items in this context is not trivial and entails non‐trivial
costs. They usually require post‐analysis of data collected during testing. We also collected the verification costs from
the historical data related to how much time verification activities had taken.
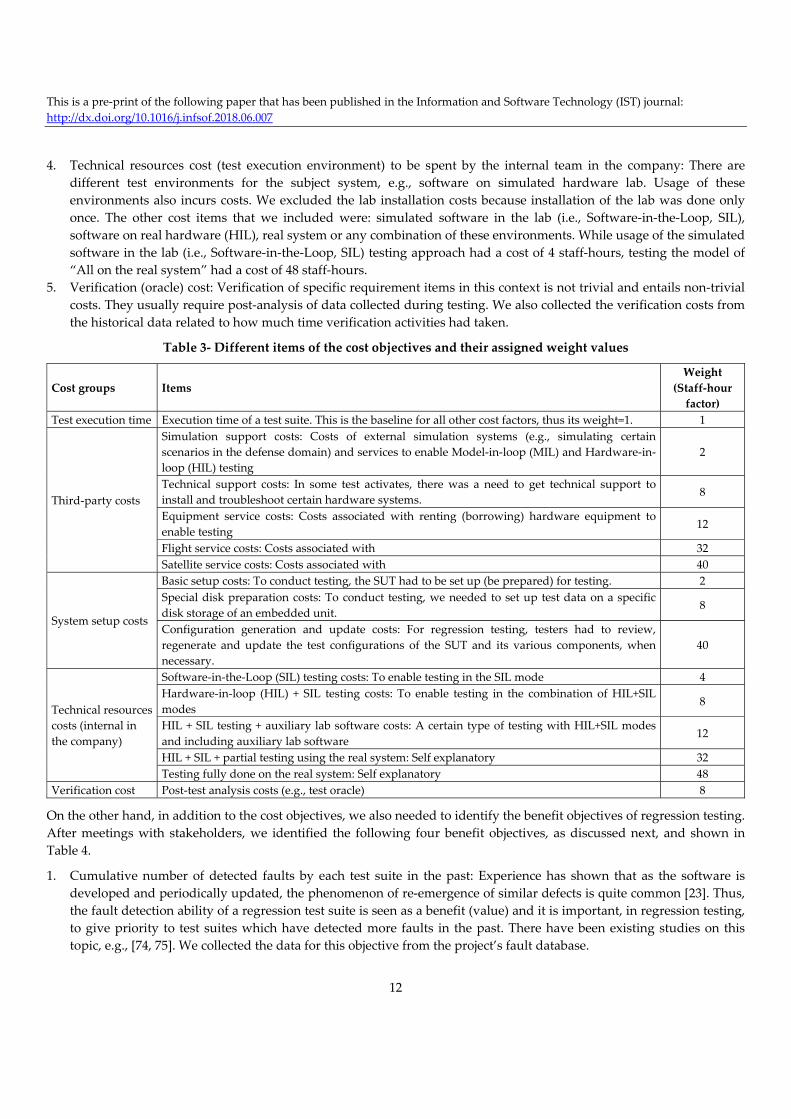
Table 3‐ Different items of the cost objectives and their assigned weight values
Cost groups Items
Weight
(Staff‐hour
factor)
Test execution time Execution time of a test suite. This is the baseline for all other cost factors, thus its weight=1. 1
Third‐party costs
Simulation support costs: Costs of external simulation systems (e.g., simulating certain
scenarios in the defense domain) and services to enable Model‐in‐loop (MIL) and Hardware‐in‐
loop (HIL) testing
2
Technical support costs: In some test activates, there was a need to get technical support to
install and troubleshoot certain hardware systems. 8
Equipment service costs: Costs associated with renting (borrowing) hardware equipment to
enable testing 12
Flight service costs: Costs associated with 32
Satellite service costs: Costs associated with 40
System setup costs
Basic setup costs: To conduct testing, the SUT had to be set up (be prepared) for testing. 2
Special disk preparation costs: To conduct testing, we needed to set up test data on a specific
disk storage of an embedded unit. 8
Configuration generation and update costs: For regression testing, testers had to review,
regenerate and update the test configurations of the SUT and its various components, when
necessary.
40
Technical resources
costs (internal in
the company)
Software‐in‐the‐Loop (SIL) testing costs: To enable testing in the SIL mode 4
Hardware‐in‐loop (HIL) + SIL testing costs: To enable testing in the combination of HIL+SIL
modes 8
HIL + SIL testing + auxiliary lab software costs: A certain type of testing with HIL+SIL modes
and including auxiliary lab software 12
HIL + SIL + partial testing using the real system: Self explanatory 32
Testing fully done on the real system: Self explanatory 48
Verification cost Post‐test analysis costs (e.g., test oracle) 8
On the other hand, in addition to the cost objectives, we also needed to identify the benefit objectives of regression testing.
After meetings with stakeholders, we identified the following four benefit objectives, as discussed next, and shown in
Table 4.
1. Cumulative number of detected faults by each test suite in the past: Experience has shown that as the software is
developed and periodically updated, the phenomenon of re‐emergence of similar defects is quite common [23]. Thus,
the fault detection ability of a regression test suite is seen as a benefit (value) and it is important, in regression testing,
to give priority to test suites which have detected more faults in the past. There have been existing studies on this
topic, e.g., [74, 75]. We collected the data for this objective from the project’s fault database.

This is a pre‐print of the following paper that has been published in the Information and Software Technology (IST) journal:
http://dx.doi.org/10.1016/j.infsof.2018.06.007
13
2. Number of detected faults in the last version: In addition to the cumulative number of detected faults (the previous
objective), the number of faults detected by a test suite in the last version provides awareness about the “recent” fault
detection ability of a test suite. We saw cases when a test suite may not have had detected many faults in the past
cumulatively, relative to other test suites, but has detected many faults just in the last version of the SUT. Because of
this contribution, we added the number of detected faults in the last version as a separate value objective to the list of
objectives. We also obtained the data for this objective from the fault database.
3. Faults severity: Not only the number of faults detected by a test suite is important, but also the severity of those faults.
Test suites which detect more severe faults are better to be prioritized in regression testing [74]. In the project, three
severity values were already defined in the faults database: 1 (most severe), 2 and 3 (least severe). For each test suite,
its previously‐detected faults were grouped based on priority level. Afterward, we applied the following formula,
defined in decision‐making meetings with consensus of stakeholders: Fault severity (a test suite)=
(3*Num_faults_severity_1) + (2* Num_faults_severity_2) + (1* Num_faults_severity_3).
4. Test‐suite execution priority: Based on some rationale which are hard (or impossible) to formulate (quantify), the test
team may assign some sort of “Priority” to a regression test suite, on their experience, which denotes its importance.
In our context, the test team assigned the priorities by using the Delphi method for each test suite based on their
experience and their insight about the fault detection ability of each test suite. It is based on an ordinal metric and
there are three priority levels: 1, 2 and 3, with the value 1 being the most important one.
Determining the weight values of benefit objectives was not as straightforward as the cost objectives. For cost objectives,
we already had the historical cost data from which we could “quantify” cost and effort relatively easily, and were able to
assign weight values for cost objectives. However, for benefit objectives such as: Cumulative number of detected faults
and Faults severity, it was not immediately obvious how we could “quantify” benefits in the MORTOGA’s formula
(Equation 1). To tackle this need, by reviewing the literature, we used the wideband Delphi method [76] to gather experts’
opinions to determine the importance of and to quantify benefits. To keep the focus of this section on cost/benefit
objectives, we separate the discussion on details of the operational execution of the Delphi method and present that aspect
in Section 5.3.
As discussed in Section 4.2, since the MORTOGA is multi‐objective (to consider both cost and benefit factors), we used the
scalarization approach [63] to fit all the objectives into one single objective function. In order to provide the intended
weight values for all the objectives in the fitness value calculations, all the objectives were scaled (normalized) to the
range of [0, 1] by using the following formula: scaledValue = Value/MaxValue.
As shown in Table 4, all the cost objectives were given the equal negative weight of ‐0.1 (but note that we had already
differentiated them via a weighting scheme in Table 3). All benefit objectives had positive weights. To run the
MORTOGA on our SUT, the weight values shown in Table 4 were plugged into the GA’s fitness function (Equation 1). Let
us recall from the discussions above that, all the cost and benefit factors were normalized into one cost factor (the
baseline: Test execution time) and into one unit, staff‐hours. We did this normalization to ensure being able to combine all
cost and benefit objectives in the fitness function (Equation 1).
As a result of the weighting process, the GA fitness function thus became “dimensionless”. In other words, a fitness value
calculated by the fitness function represents the cost and value balance of a given solution.
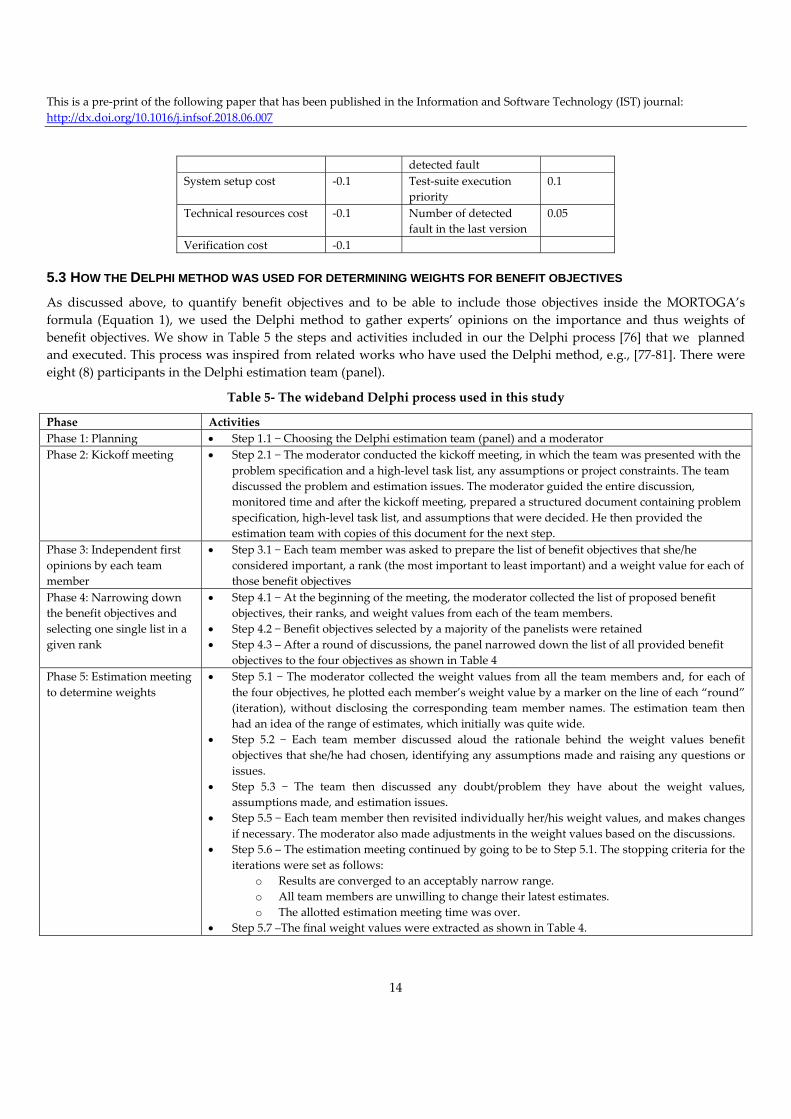
Table 4‐ Weight values of cost and benefit objectives in the project, used in the MORTOGA’s fitness function
Cost objectives Weights Benefit objectives Weights
Test execution time ‐0.1 Fault severity 0.2
Third‐party cost ‐0.1 Cumulative number of 0.15
This is a pre‐print of the following paper that has been published in the Information and Software Technology (IST) journal:
http://dx.doi.org/10.1016/j.infsof.2018.06.007
14
detected fault
System setup cost ‐0.1 Test‐suite execution
priority
0.1
Technical resources cost ‐0.1 Number of detected
fault in the last version
0.05
Verification cost ‐0.1
5.3 HOW THE DELPHI METHOD WAS USED FOR DETERMINING WEIGHTS FOR BENEFIT OBJECTIVES
As discussed above, to quantify benefit objectives and to be able to include those objectives inside the MORTOGA’s
formula (Equation 1), we used the Delphi method to gather experts’ opinions on the importance and thus weights of
benefit objectives. We show in Table 5 the steps and activities included in our the Delphi process [76] that we planned
and executed. This process was inspired from related works who have used the Delphi method, e.g., [77‐81]. There were
eight (8) participants in the Delphi estimation team (panel).
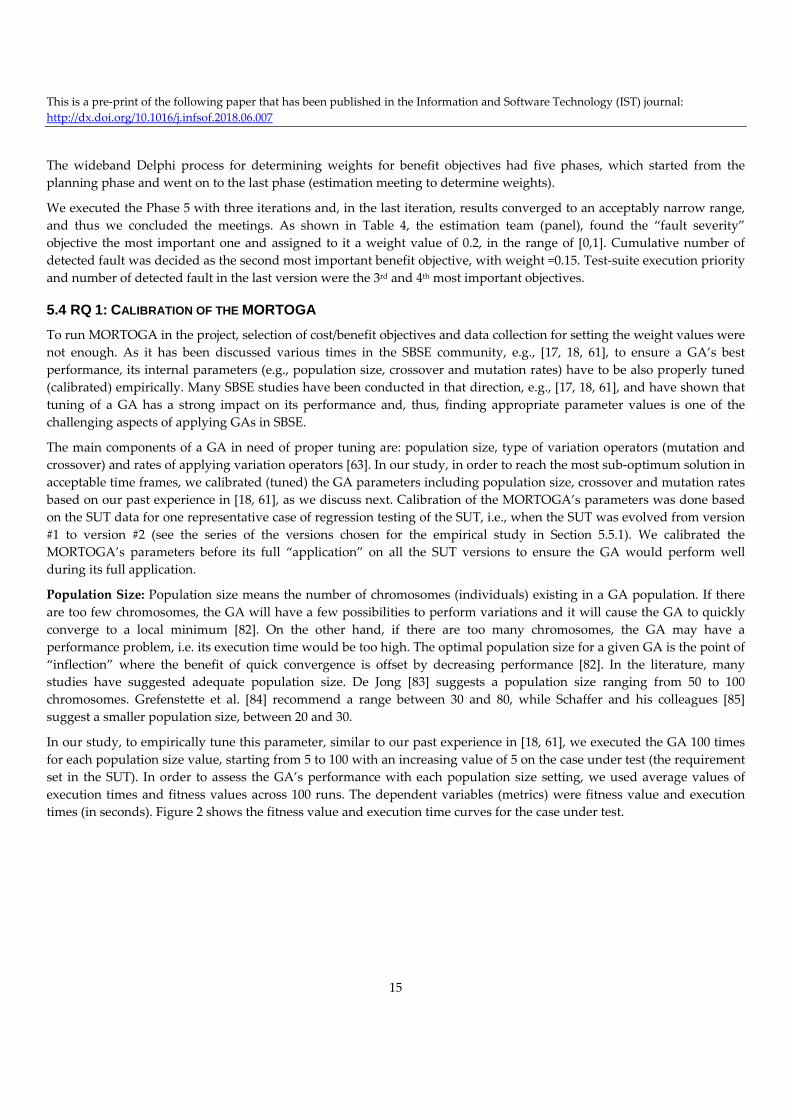
Table 5‐ The wideband Delphi process used in this study
Phase Activities
Phase 1: Planning Step 1.1 − Choosing the Delphi estimation team (panel) and a moderator
Phase 2: Kickoff meeting Step 2.1 − The moderator conducted the kickoff meeting, in which the team was presented with the
problem specification and a high‐level task list, any assumptions or project constraints. The team
discussed the problem and estimation issues. The moderator guided the entire discussion,
monitored time and after the kickoff meeting, prepared a structured document containing problem
specification, high‐level task list, and assumptions that were decided. He then provided the
estimation team with copies of this document for the next step.
Phase 3: Independent first
opinions by each team
member
Step 3.1 − Each team member was asked to prepare the list of benefit objectives that she/he
considered important, a rank (the most important to least important) and a weight value for each of
those benefit objectives
Phase 4: Narrowing down
the benefit objectives and
selecting one single list in a
given rank
Step 4.1 − At the beginning of the meeting, the moderator collected the list of proposed benefit
objectives, their ranks, and weight values from each of the team members.
Step 4.2 − Benefit objectives selected by a majority of the panelists were retained
Step 4.3 – After a round of discussions, the panel narrowed down the list of all provided benefit
objectives to the four objectives as shown in Table 4
Phase 5: Estimation meeting
to determine weights
Step 5.1 − The moderator collected the weight values from all the team members and, for each of
the four objectives, he plotted each member’s weight value by a marker on the line of each “round”
(iteration), without disclosing the corresponding team member names. The estimation team then
had an idea of the range of estimates, which initially was quite wide.
Step 5.2 − Each team member discussed aloud the rationale behind the weight values benefit
objectives that she/he had chosen, identifying any assumptions made and raising any questions or
issues.
Step 5.3 − The team then discussed any doubt/problem they have about the weight values,
assumptions made, and estimation issues.
Step 5.5 − Each team member then revisited individually her/his weight values, and makes changes
if necessary. The moderator also made adjustments in the weight values based on the discussions.
Step 5.6 – The estimation meeting continued by going to be to Step 5.1. The stopping criteria for the
iterations were set as follows:
o Results are converged to an acceptably narrow range.
o All team members are unwilling to change their latest estimates.
o The allotted estimation meeting time was over.
Step 5.7 –The final weight values were extracted as shown in Table 4.
This is a pre‐print of the following paper that has been published in the Information and Software Technology (IST) journal:
http://dx.doi.org/10.1016/j.infsof.2018.06.007
15
The wideband Delphi process for determining weights for benefit objectives had five phases, which started from the
planning phase and went on to the last phase (estimation meeting to determine weights).
We executed the Phase 5 with three iterations and, in the last iteration, results converged to an acceptably narrow range,
and thus we concluded the meetings. As shown in Table 4, the estimation team (panel), found the “fault severity”
objective the most important one and assigned to it a weight value of 0.2, in the range of [0,1]. Cumulative number of
detected fault was decided as the second most important benefit objective, with weight =0.15. Test‐suite execution priority
and number of detected fault in the last version were the 3rd and 4th most important objectives.
5.4 RQ 1: CALIBRATION OF THE MORTOGA
To run MORTOGA in the project, selection of cost/benefit objectives and data collection for setting the weight values were
not enough. As it has been discussed various times in the SBSE community, e.g., [17, 18, 61], to ensure a GA’s best
performance, its internal parameters (e.g., population size, crossover and mutation rates) have to be also properly tuned
(calibrated) empirically. Many SBSE studies have been conducted in that direction, e.g., [17, 18, 61], and have shown that
tuning of a GA has a strong impact on its performance and, thus, finding appropriate parameter values is one of the
challenging aspects of applying GAs in SBSE.
The main components of a GA in need of proper tuning are: population size, type of variation operators (mutation and
crossover) and rates of applying variation operators [63]. In our study, in order to reach the most sub‐optimum solution in
acceptable time frames, we calibrated (tuned) the GA parameters including population size, crossover and mutation rates
based on our past experience in [18, 61], as we discuss next. Calibration of the MORTOGA’s parameters was done based
on the SUT data for one representative case of regression testing of the SUT, i.e., when the SUT was evolved from version
#1 to version #2 (see the series of the versions chosen for the empirical study in Section 5.5.1). We calibrated the
MORTOGA’s parameters before its full “application” on all the SUT versions to ensure the GA would perform well
during its full application.
Population Size: Population size means the number of chromosomes (individuals) existing in a GA population. If there
are too few chromosomes, the GA will have a few possibilities to perform variations and it will cause the GA to quickly
converge to a local minimum [82]. On the other hand, if there are too many chromosomes, the GA may have a
performance problem, i.e. its execution time would be too high. The optimal population size for a given GA is the point of
“inflection” where the benefit of quick convergence is offset by decreasing performance [82]. In the literature, many
studies have suggested adequate population size. De Jong [83] suggests a population size ranging from 50 to 100
chromosomes. Grefenstette et al. [84] recommend a range between 30 and 80, while Schaffer and his colleagues [85]
suggest a smaller population size, between 20 and 30.
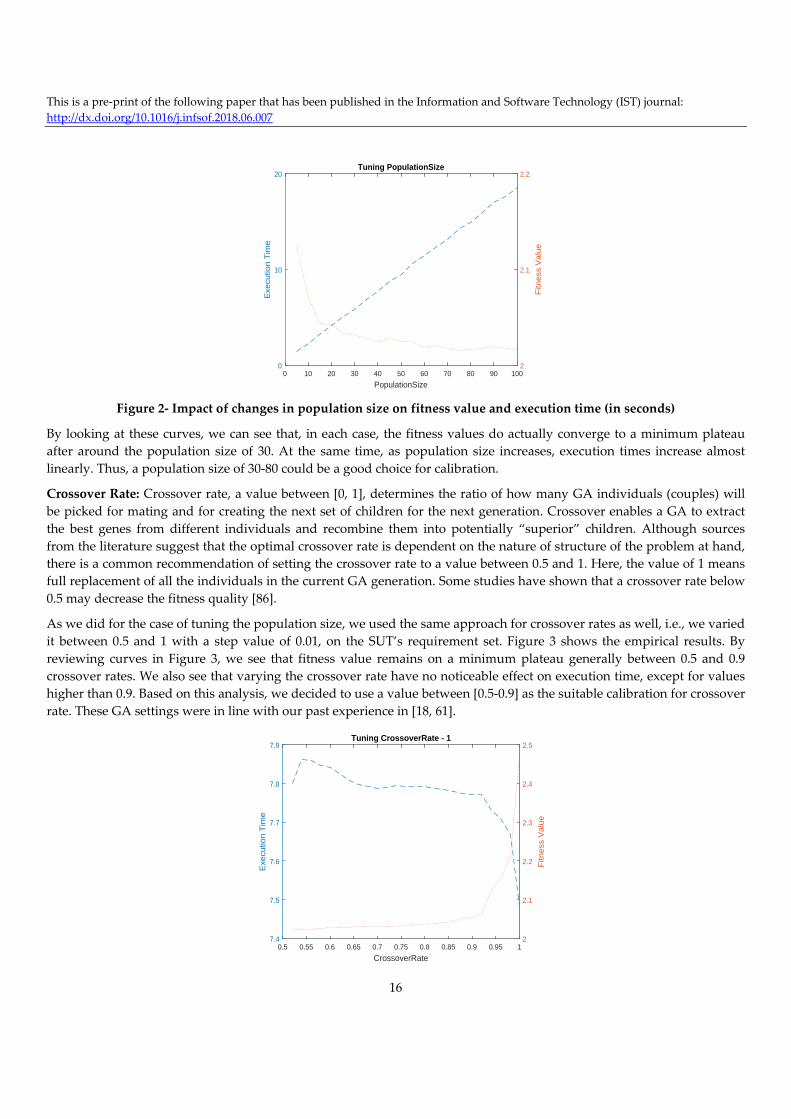
In our study, to empirically tune this parameter, similar to our past experience in [18, 61], we executed the GA 100 times
for each population size value, starting from 5 to 100 with an increasing value of 5 on the case under test (the requirement
set in the SUT). In order to assess the GA’s performance with each population size setting, we used average values of
execution times and fitness values across 100 runs. The dependent variables (metrics) were fitness value and execution
times (in seconds). Figure 2 shows the fitness value and execution time curves for the case under test.
This is a pre‐print of the following paper that has been published in the Information and Software Technology (IST) journal:
http://dx.doi.org/10.1016/j.infsof.2018.06.007
16
Figure 2‐ Impact of changes in population size on fitness value and execution time (in seconds)
By looking at these curves, we can see that, in each case, the fitness values do actually converge to a minimum plateau
after around the population size of 30. At the same time, as population size increases, execution times increase almost
linearly. Thus, a population size of 30‐80 could be a good choice for calibration.
Crossover Rate: Crossover rate, a value between [0, 1], determines the ratio of how many GA individuals (couples) will
be picked for mating and for creating the next set of children for the next generation. Crossover enables a GA to extract
the best genes from different individuals and recombine them into potentially “superior” children. Although sources
from the literature suggest that the optimal crossover rate is dependent on the nature of structure of the problem at hand,
there is a common recommendation of setting the crossover rate to a value between 0.5 and 1. Here, the value of 1 means
full replacement of all the individuals in the current GA generation. Some studies have shown that a crossover rate below
0.5 may decrease the fitness quality [86].
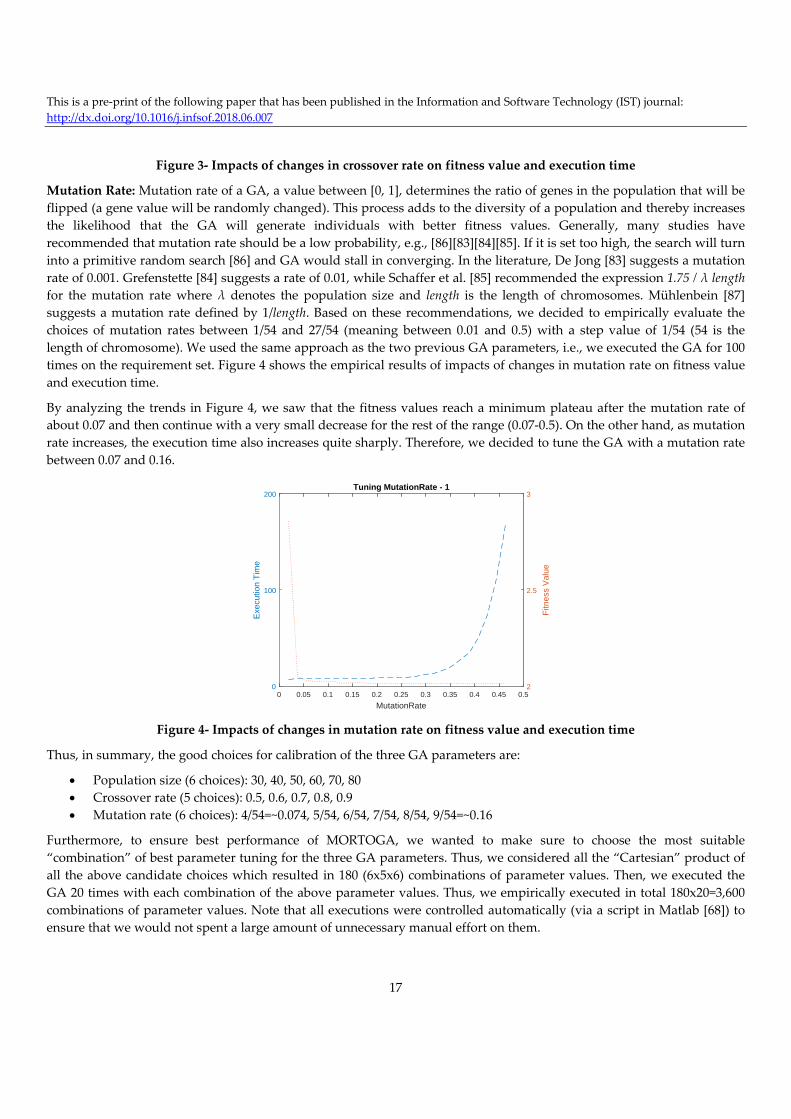
As we did for the case of tuning the population size, we used the same approach for crossover rates as well, i.e., we varied
it between 0.5 and 1 with a step value of 0.01, on the SUT’s requirement set. Figure 3 shows the empirical results. By
reviewing curves in Figure 3, we see that fitness value remains on a minimum plateau generally between 0.5 and 0.9
crossover rates. We also see that varying the crossover rate have no noticeable effect on execution time, except for values
higher than 0.9. Based on this analysis, we decided to use a value between [0.5‐0.9] as the suitable calibration for crossover
rate. These GA settings were in line with our past experience in [18, 61].
PopulationSize0 10 20 30 40 50 60 70 80 90 100
Exe
cutio
n T
ime
0
10
20Tuning PopulationSize
Fitn
ess
Valu
e
2
2.1
2.2
CrossoverRate0.5 0.55 0.6 0.65 0.7 0.75 0.8 0.85 0.9 0.95 1
Exe
cutio
n T
ime
7.4
7.5
7.6
7.7
7.8
7.9Tuning CrossoverRate - 1
Fitn
ess
Val
ue
2
2.1
2.2
2.3
2.4
2.5
This is a pre‐print of the following paper that has been published in the Information and Software Technology (IST) journal:
http://dx.doi.org/10.1016/j.infsof.2018.06.007
17
Figure 3‐ Impacts of changes in crossover rate on fitness value and execution time
Mutation Rate: Mutation rate of a GA, a value between [0, 1], determines the ratio of genes in the population that will be
flipped (a gene value will be randomly changed). This process adds to the diversity of a population and thereby increases
the likelihood that the GA will generate individuals with better fitness values. Generally, many studies have
recommended that mutation rate should be a low probability, e.g., [86][83][84][85]. If it is set too high, the search will turn
into a primitive random search [86] and GA would stall in converging. In the literature, De Jong [83] suggests a mutation
rate of 0.001. Grefenstette [84] suggests a rate of 0.01, while Schaffer et al. [85] recommended the expression 1.75 / λ length
for the mutation rate where λ denotes the population size and length is the length of chromosomes. Mühlenbein [87]
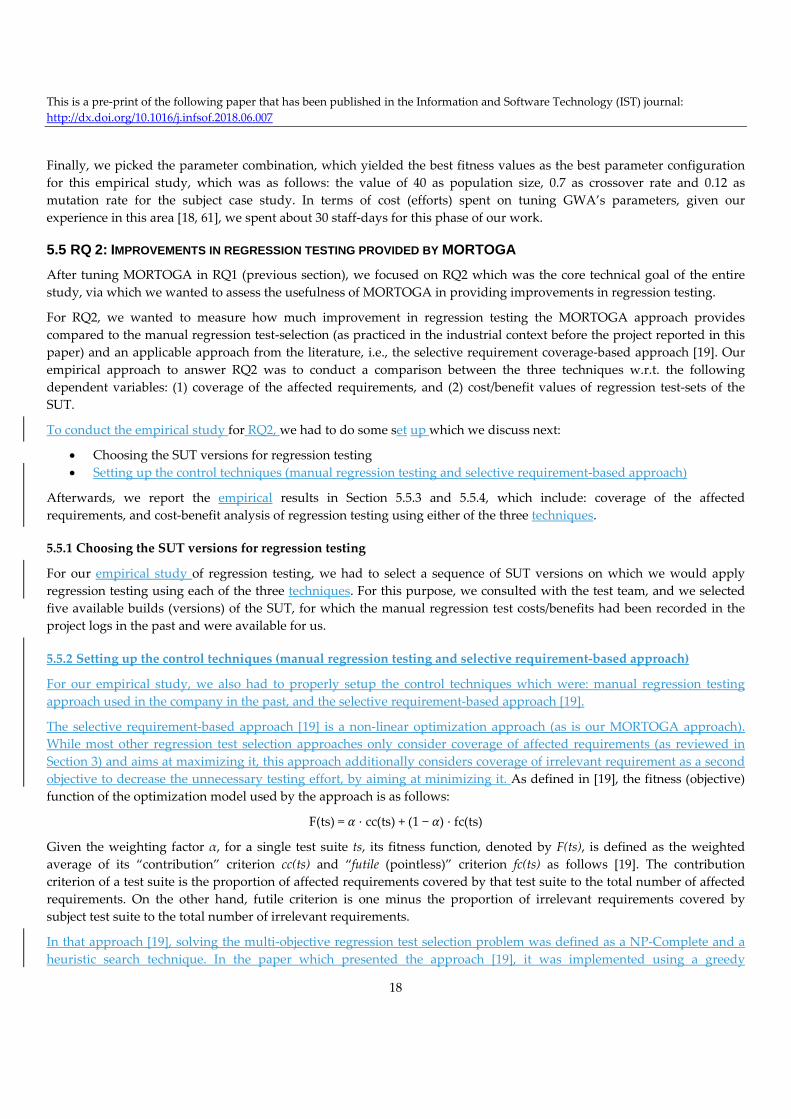
suggests a mutation rate defined by 1/length. Based on these recommendations, we decided to empirically evaluate the
choices of mutation rates between 1/54 and 27/54 (meaning between 0.01 and 0.5) with a step value of 1/54 (54 is the
length of chromosome). We used the same approach as the two previous GA parameters, i.e., we executed the GA for 100
times on the requirement set. Figure 4 shows the empirical results of impacts of changes in mutation rate on fitness value
and execution time.
By analyzing the trends in Figure 4, we saw that the fitness values reach a minimum plateau after the mutation rate of
about 0.07 and then continue with a very small decrease for the rest of the range (0.07‐0.5). On the other hand, as mutation
rate increases, the execution time also increases quite sharply. Therefore, we decided to tune the GA with a mutation rate
between 0.07 and 0.16.
Figure 4‐ Impacts of changes in mutation rate on fitness value and execution time
Thus, in summary, the good choices for calibration of the three GA parameters are:
Population size (6 choices): 30, 40, 50, 60, 70, 80
Crossover rate (5 choices): 0.5, 0.6, 0.7, 0.8, 0.9
Mutation rate (6 choices): 4/54=~0.074, 5/54, 6/54, 7/54, 8/54, 9/54=~0.16
Furthermore, to ensure best performance of MORTOGA, we wanted to make sure to choose the most suitable
“combination” of best parameter tuning for the three GA parameters. Thus, we considered all the “Cartesian” product of
all the above candidate choices which resulted in 180 (6x5x6) combinations of parameter values. Then, we executed the
GA 20 times with each combination of the above parameter values. Thus, we empirically executed in total 180x20=3,600
combinations of parameter values. Note that all executions were controlled automatically (via a script in Matlab [68]) to
ensure that we would not spent a large amount of unnecessary manual effort on them.
MutationRate0 0.05 0.1 0.15 0.2 0.25 0.3 0.35 0.4 0.45 0.5
Exe
cutio
n T
ime
0
100
200Tuning MutationRate - 1
Fitn
ess
Val
ue
2
2.5
3
This is a pre‐print of the following paper that has been published in the Information and Software Technology (IST) journal:
http://dx.doi.org/10.1016/j.infsof.2018.06.007
18
Finally, we picked the parameter combination, which yielded the best fitness values as the best parameter configuration
for this empirical study, which was as follows: the value of 40 as population size, 0.7 as crossover rate and 0.12 as
mutation rate for the subject case study. In terms of cost (efforts) spent on tuning GWA’s parameters, given our
experience in this area [18, 61], we spent about 30 staff‐days for this phase of our work.
5.5 RQ 2: IMPROVEMENTS IN REGRESSION TESTING PROVIDED BY MORTOGA
After tuning MORTOGA in RQ1 (previous section), we focused on RQ2 which was the core technical goal of the entire
study, via which we wanted to assess the usefulness of MORTOGA in providing improvements in regression testing.
For RQ2, we wanted to measure how much improvement in regression testing the MORTOGA approach provides
compared to the manual regression test‐selection (as practiced in the industrial context before the project reported in this
paper) and an applicable approach from the literature, i.e., the selective requirement coverage‐based approach [19]. Our
empirical approach to answer RQ2 was to conduct a comparison between the three techniques w.r.t. the following
dependent variables: (1) coverage of the affected requirements, and (2) cost/benefit values of regression test‐sets of the
SUT.
To conduct the empirical study for RQ2, we had to do some set up which we discuss next:
Choosing the SUT versions for regression testing
Setting up the control techniques (manual regression testing and selective requirement‐based approach)
Afterwards, we report the empirical results in Section 5.5.3 and 5.5.4, which include: coverage of the affected
requirements, and cost‐benefit analysis of regression testing using either of the three techniques.
5.5.1 Choosing the SUT versions for regression testing
For our empirical study of regression testing, we had to select a sequence of SUT versions on which we would apply
regression testing using each of the three techniques. For this purpose, we consulted with the test team, and we selected
five available builds (versions) of the SUT, for which the manual regression test costs/benefits had been recorded in the
project logs in the past and were available for us.
5.5.2 Setting up the control techniques (manual regression testing and selective requirement‐based approach)
For our empirical study, we also had to properly setup the control techniques which were: manual regression testing
approach used in the company in the past, and the selective requirement‐based approach [19].
The selective requirement‐based approach [19] is a non‐linear optimization approach (as is our MORTOGA approach).
While most other regression test selection approaches only consider coverage of affected requirements (as reviewed in
Section 3) and aims at maximizing it, this approach additionally considers coverage of irrelevant requirement as a second
objective to decrease the unnecessary testing effort, by aiming at minimizing it. As defined in [19], the fitness (objective)
function of the optimization model used by the approach is as follows:
F(ts) = ⋅ cc(ts) + (1 − ) ⋅ fc(ts)
Given the weighting factor α, for a single test suite ts, its fitness function, denoted by F(ts), is defined as the weighted
average of its “contribution” criterion cc(ts) and “futile (pointless)” criterion fc(ts) as follows [19]. The contribution
criterion of a test suite is the proportion of affected requirements covered by that test suite to the total number of affected
requirements. On the other hand, futile criterion is one minus the proportion of irrelevant requirements covered by
subject test suite to the total number of irrelevant requirements.
In that approach [19], solving the multi‐objective regression test selection problem was defined as a NP‐Complete and a
heuristic search technique. In the paper which presented the approach [19], it was implemented using a greedy
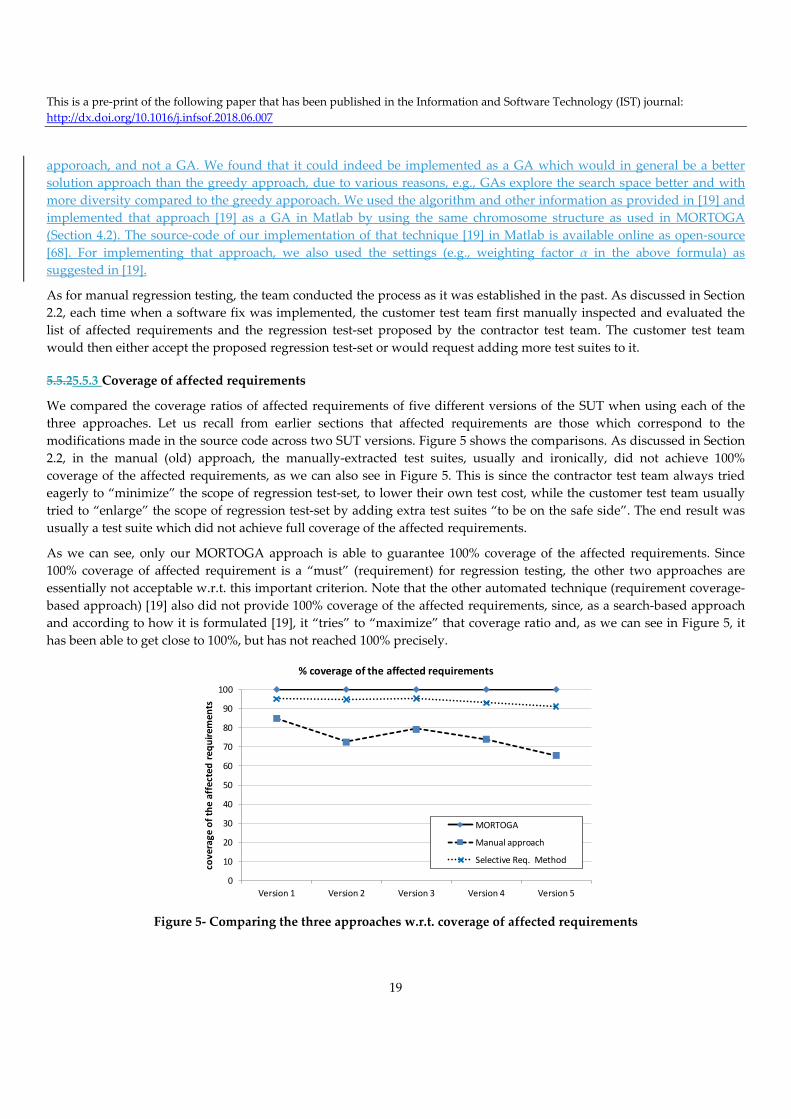
This is a pre‐print of the following paper that has been published in the Information and Software Technology (IST) journal:
http://dx.doi.org/10.1016/j.infsof.2018.06.007
19
apporoach, and not a GA. We found that it could indeed be implemented as a GA which would in general be a better
solution approach than the greedy approach, due to various reasons, e.g., GAs explore the search space better and with
more diversity compared to the greedy apporoach. We used the algorithm and other information as provided in [19] and
implemented that approach [19] as a GA in Matlab by using the same chromosome structure as used in MORTOGA
(Section 4.2). The source‐code of our implementation of that technique [19] in Matlab is available online as open‐source
[68]. For implementing that approach, we also used the settings (e.g., weighting factor α in the above formula) as
suggested in [19].
As for manual regression testing, the team conducted the process as it was established in the past. As discussed in Section
2.2, each time when a software fix was implemented, the customer test team first manually inspected and evaluated the
list of affected requirements and the regression test‐set proposed by the contractor test team. The customer test team
would then either accept the proposed regression test‐set or would request adding more test suites to it.
5.5.25.5.3 Coverage of affected requirements
We compared the coverage ratios of affected requirements of five different versions of the SUT when using each of the
three approaches. Let us recall from earlier sections that affected requirements are those which correspond to the
modifications made in the source code across two SUT versions. Figure 5 shows the comparisons. As discussed in Section
2.2, in the manual (old) approach, the manually‐extracted test suites, usually and ironically, did not achieve 100%
coverage of the affected requirements, as we can also see in Figure 5. This is since the contractor test team always tried
eagerly to “minimize” the scope of regression test‐set, to lower their own test cost, while the customer test team usually
tried to “enlarge” the scope of regression test‐set by adding extra test suites “to be on the safe side”. The end result was
usually a test suite which did not achieve full coverage of the affected requirements.
As we can see, only our MORTOGA approach is able to guarantee 100% coverage of the affected requirements. Since
100% coverage of affected requirement is a “must” (requirement) for regression testing, the other two approaches are
essentially not acceptable w.r.t. this important criterion. Note that the other automated technique (requirement coverage‐
based approach) [19] also did not provide 100% coverage of the affected requirements, since, as a search‐based approach
and according to how it is formulated [19], it “tries” to “maximize” that coverage ratio and, as we can see in Figure 5, it
has been able to get close to 100%, but has not reached 100% precisely.
Figure 5‐ Comparing the three approaches w.r.t. coverage of affected requirements
0
10
20
30
40
50
60
70
80
90
100
Version 1 Version 2 Version 3 Version 4 Version 5
coverage of the affected
req
uirem
ents
% coverage of the affected requirements
MORTOGA
Manual approach
Selective Req. Method
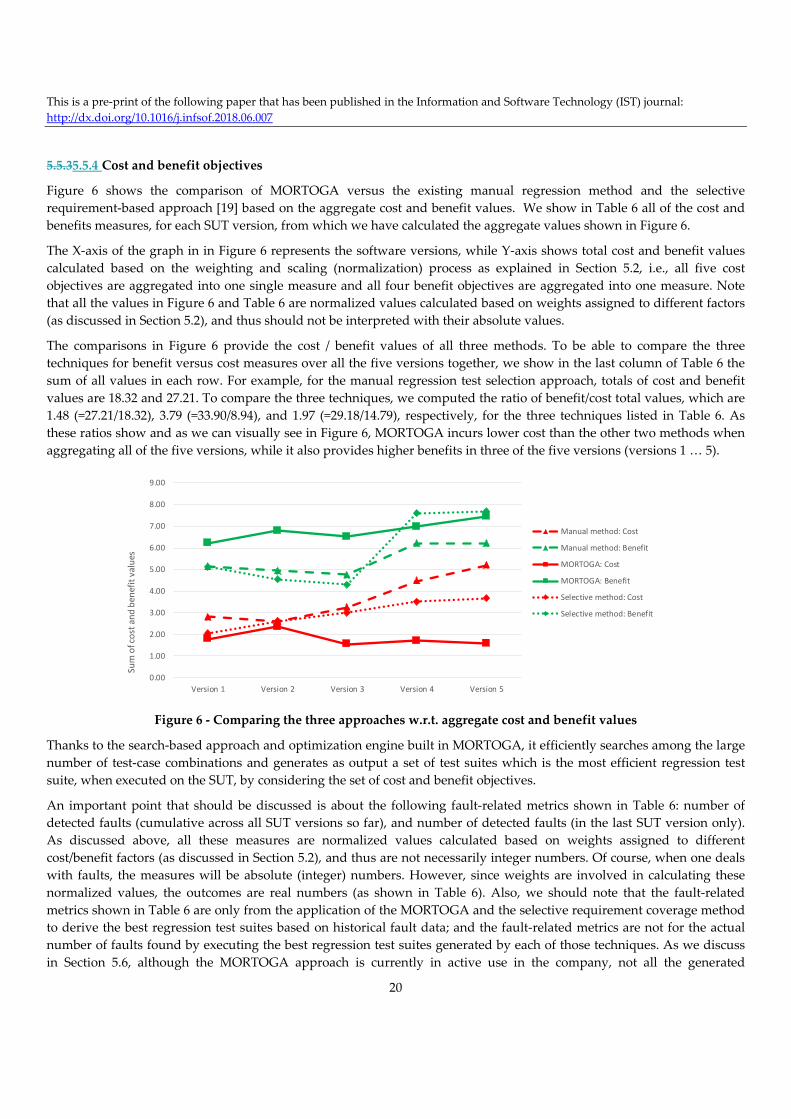
This is a pre‐print of the following paper that has been published in the Information and Software Technology (IST) journal:
http://dx.doi.org/10.1016/j.infsof.2018.06.007
20
5.5.35.5.4 Cost and benefit objectives
Figure 6 shows the comparison of MORTOGA versus the existing manual regression method and the selective
requirement‐based approach [19] based on the aggregate cost and benefit values. We show in Table 6 all of the cost and
benefits measures, for each SUT version, from which we have calculated the aggregate values shown in Figure 6.
The X‐axis of the graph in in Figure 6 represents the software versions, while Y‐axis shows total cost and benefit values
calculated based on the weighting and scaling (normalization) process as explained in Section 5.2, i.e., all five cost
objectives are aggregated into one single measure and all four benefit objectives are aggregated into one measure. Note
that all the values in Figure 6 and Table 6 are normalized values calculated based on weights assigned to different factors
(as discussed in Section 5.2), and thus should not be interpreted with their absolute values.
The comparisons in Figure 6 provide the cost / benefit values of all three methods. To be able to compare the three
techniques for benefit versus cost measures over all the five versions together, we show in the last column of Table 6 the
sum of all values in each row. For example, for the manual regression test selection approach, totals of cost and benefit
values are 18.32 and 27.21. To compare the three techniques, we computed the ratio of benefit/cost total values, which are
1.48 (=27.21/18.32), 3.79 (=33.90/8.94), and 1.97 (=29.18/14.79), respectively, for the three techniques listed in Table 6. As
these ratios show and as we can visually see in Figure 6, MORTOGA incurs lower cost than the other two methods when
aggregating all of the five versions, while it also provides higher benefits in three of the five versions (versions 1 … 5).
Figure 6 ‐ Comparing the three approaches w.r.t. aggregate cost and benefit values
Thanks to the search‐based approach and optimization engine built in MORTOGA, it efficiently searches among the large
number of test‐case combinations and generates as output a set of test suites which is the most efficient regression test
suite, when executed on the SUT, by considering the set of cost and benefit objectives.
An important point that should be discussed is about the following fault‐related metrics shown in Table 6: number of
detected faults (cumulative across all SUT versions so far), and number of detected faults (in the last SUT version only).
As discussed above, all these measures are normalized values calculated based on weights assigned to different
cost/benefit factors (as discussed in Section 5.2), and thus are not necessarily integer numbers. Of course, when one deals
with faults, the measures will be absolute (integer) numbers. However, since weights are involved in calculating these
normalized values, the outcomes are real numbers (as shown in Table 6). Also, we should note that the fault‐related
metrics shown in Table 6 are only from the application of the MORTOGA and the selective requirement coverage method
to derive the best regression test suites based on historical fault data; and the fault‐related metrics are not for the actual
number of faults found by executing the best regression test suites generated by each of those techniques. As we discuss
in Section 5.6, although the MORTOGA approach is currently in active use in the company, not all the generated
0.00
1.00
2.00
3.00
4.00
5.00
6.00
7.00
8.00
9.00
Version 1 Version 2 Version 3 Version 4 Version 5
Sum of cost and benefit values
Manual method: Cost
Manual method: Benefit
MORTOGA: Cost
MORTOGA: Benefit
Selective method: Cost
Selective method: Benefit
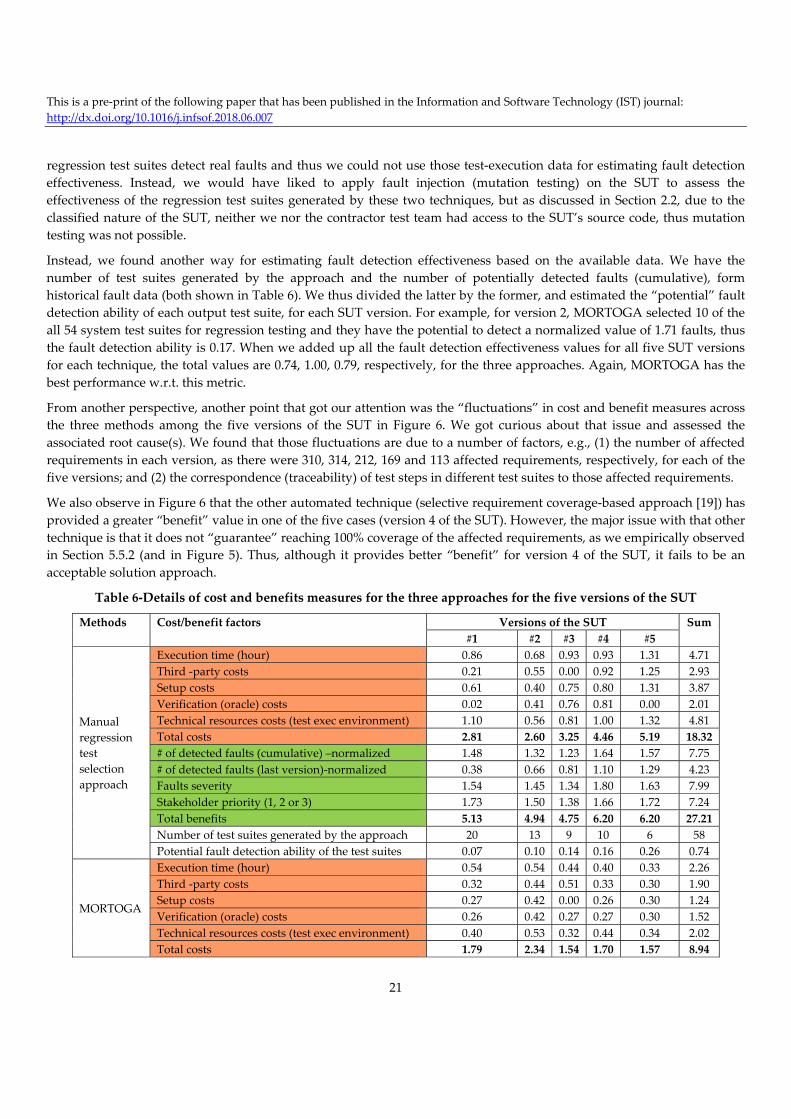
This is a pre‐print of the following paper that has been published in the Information and Software Technology (IST) journal:
http://dx.doi.org/10.1016/j.infsof.2018.06.007
21
regression test suites detect real faults and thus we could not use those test‐execution data for estimating fault detection
effectiveness. Instead, we would have liked to apply fault injection (mutation testing) on the SUT to assess the
effectiveness of the regression test suites generated by these two techniques, but as discussed in Section 2.2, due to the
classified nature of the SUT, neither we nor the contractor test team had access to the SUT’s source code, thus mutation
testing was not possible.
Instead, we found another way for estimating fault detection effectiveness based on the available data. We have the
number of test suites generated by the approach and the number of potentially detected faults (cumulative), form
historical fault data (both shown in Table 6). We thus divided the latter by the former, and estimated the “potential” fault
detection ability of each output test suite, for each SUT version. For example, for version 2, MORTOGA selected 10 of the
all 54 system test suites for regression testing and they have the potential to detect a normalized value of 1.71 faults, thus
the fault detection ability is 0.17. When we added up all the fault detection effectiveness values for all five SUT versions
for each technique, the total values are 0.74, 1.00, 0.79, respectively, for the three approaches. Again, MORTOGA has the
best performance w.r.t. this metric.
From another perspective, another point that got our attention was the “fluctuations” in cost and benefit measures across
the three methods among the five versions of the SUT in Figure 6. We got curious about that issue and assessed the
associated root cause(s). We found that those fluctuations are due to a number of factors, e.g., (1) the number of affected
requirements in each version, as there were 310, 314, 212, 169 and 113 affected requirements, respectively, for each of the
five versions; and (2) the correspondence (traceability) of test steps in different test suites to those affected requirements.
We also observe in Figure 6 that the other automated technique (selective requirement coverage‐based approach [19]) has
provided a greater “benefit” value in one of the five cases (version 4 of the SUT). However, the major issue with that other
technique is that it does not “guarantee” reaching 100% coverage of the affected requirements, as we empirically observed
in Section 5.5.2 (and in Figure 5). Thus, although it provides better “benefit” for version 4 of the SUT, it fails to be an
acceptable solution approach.
Table 6‐Details of cost and benefits measures for the three approaches for the five versions of the SUT
Methods Cost/benefit factors Versions of the SUT Sum
#1 #2 #3 #4 #5
Manual
regression
test
selection
approach
Execution time (hour) 0.86 0.68 0.93 0.93 1.31 4.71
Third ‐party costs 0.21 0.55 0.00 0.92 1.25 2.93
Setup costs 0.61 0.40 0.75 0.80 1.31 3.87
Verification (oracle) costs 0.02 0.41 0.76 0.81 0.00 2.01
Technical resources costs (test exec environment) 1.10 0.56 0.81 1.00 1.32 4.81
Total costs 2.81 2.60 3.25 4.46 5.19 18.32
# of detected faults (cumulative) –normalized 1.48 1.32 1.23 1.64 1.57 7.75
# of detected faults (last version)‐normalized 0.38 0.66 0.81 1.10 1.29 4.23
Faults severity 1.54 1.45 1.34 1.80 1.63 7.99
Stakeholder priority (1, 2 or 3) 1.73 1.50 1.38 1.66 1.72 7.24
Total benefits 5.13 4.94 4.75 6.20 6.20 27.21
Number of test suites generated by the approach 20 13 9 10 6 58
Potential fault detection ability of the test suites 0.07 0.10 0.14 0.16 0.26 0.74
MORTOGA
Execution time (hour) 0.54 0.54 0.44 0.40 0.33 2.26
Third ‐party costs 0.32 0.44 0.51 0.33 0.30 1.90
Setup costs 0.27 0.42 0.00 0.26 0.30 1.24
Verification (oracle) costs 0.26 0.42 0.27 0.27 0.30 1.52
Technical resources costs (test exec environment) 0.40 0.53 0.32 0.44 0.34 2.02
Total costs 1.79 2.34 1.54 1.70 1.57 8.94

This is a pre‐print of the following paper that has been published in the Information and Software Technology (IST) journal:
http://dx.doi.org/10.1016/j.infsof.2018.06.007
22
# of detected faults (cumulative) ‐normalized 1.67 1.71 1.65 1.79 1.86 8.69
# of detected faults (last version) ‐normalized 0.85 1.22 1.30 1.34 1.58 6.30
Faults severity 1.91 1.81 1.75 1.89 1.94 9.63
Stakeholder priority (1, 2 or 3) 1.77 2.04 1.80 1.95 2.07 8.69
Total benefits 6.20 6.77 6.50 6.97 7.46 33.90
Number of test suites generated by the approach 13 10 7 9 7 46
Potential fault detection ability (Ratio) 0.13 0.17 0.24 0.20 0.27 1.00
Selective
requirement
coverage
method
Execution time (hour) 0.63 0.63 0.73 0.76 0.97 3.73
Third ‐party costs 0.31 0.49 1.09 0.69 0.85 3.44
Setup costs 0.36 0.47 0.00 0.62 0.91 2.36
Verification (oracle) costs 0.31 0.44 0.56 0.63 0.00 1.94
Technical resources costs (test exec environment) 0.41 0.56 0.61 0.80 0.93 3.32
Total costs 2.03 2.60 2.99 3.51 3.66 14.79
# of detected faults (cumulative) ‐normalized 1.37 1.19 1.10 1.95 1.95 7.56
# of detected faults (last version) ‐normalized 0.76 0.70 0.75 1.50 1.64 5.35
Faults severity 1.48 1.30 1.19 2.04 2.01 8.03
Stakeholder priority (1, 2 or 3) 1.49 1.35 1.25 2.10 2.05 8.25
Total benefits 5.10 4.54 4.30 7.59 7.66 29.18
Number of test suites generated by the approach 12 10 8 8 11 49
Potential fault detection ability of the test suites 0.11 0.12 0.14 0.24 0.18 0.79
5.6 BENEFITS OF THE RESULTS AND THE MORTOGA APPROACH IN THE INDUSTRIAL CONTEXT
Since the MORTOGA approach has development and calibration efforts associated with it, we decided to objectively and
critically evaluate its benefit for the test team. One of the authors had done a similar analysis in a previous work [88], in
which he and his colleagues quantitatively estimated the time saving (cost‐benefit) of a novel automated testing platform
for an industrial partner.
To objectively and critically justify the development and calibration efforts (costs) of MORTOGA in the industrial context,
we looked at the costs values of the three approaches in Table 6, and aimed at estimating how much cost saving
MORTOGA would provide. Let us recall from Section 2.1 that we had an estimate about the total manual execution time
of the entire test suites (187+ staff‐days). Thus, if we could estimate how much reduction in total manual execution time,
the output test suite by MORTOGA would provide, we would be able to justify using MORTOGA.
As discussed in Section 5.5.2. since 100% coverage of affected requirement is a “must” (requirement) for regression
testing, the other automated technique [19] was essentially not acceptable w.r.t. this important criterion and we thus only
compared the manual (old) approach and MORTOGA’s costs (including its development and calibration efforts). Over
the five versions, test execution time of the test suites selected by the manual (old) approach had a cost of 4.71 in the unit
of analysis (recall that values are normalized), while MORTOGA had a cost of only 2.26. This mean a cost saving of 52.1%
of the total manual execution time of the entire test suites. Thus, we expected that using MORTOGA would save about 97
staff‐days (187 x 52.1%) in that manual execution effort. Further note that such a saving is just for one single application of
MORTOGA on the pilot five‐version series of the SUT, and we should note that regression testing of the SUT have been
continuously conducted since several years ago and will go on for several years to come (the project has no “end date” yet
as of this writing). According to our time logs, development and calibration of MORTOGA took about 200 staff‐days in
total. Thus we expect that using MORTOGA in two cases such as the one we reported in this paper would “pay off” its
development and calibration costs.
From another perspective, as we discussed in the related work (Section 3), most of the regression test‐selection techniques
proposed in literature are source‐code based and they are not applicable for the cases when source code is not available
(such as our case). Most of the regression test‐selection techniques presented in literature are structured based on a single

This is a pre‐print of the following paper that has been published in the Information and Software Technology (IST) journal:
http://dx.doi.org/10.1016/j.infsof.2018.06.007
23
objective. However, in real‐world regression testing scenarios, there are many different criteria that may have impact on
effectiveness of a test suite like execution time, coverage, user priority, fault history etc. The use of a single criterion does
not answer regression test selection requirements in practice and it severely limits its fault detection ability.
The results of this study show that MORTOGA provides a suitable solution option for both issues mentioned above. With
100% coverage of affected requirements, it provides a high‐level (requirement coverage based) solution option especially
for the large‐scale complex systems. In terms of optimization, MORTOGA effectively selects the optimum solution based
on real‐world cost and benefit objectives. This aspect of the approach provides more realistic solutions than single
objective approaches. Since the proposed approach (MORTOGA) has been beneficial in the industrial context in saving
the costs of regression testing (as shown above), it is currently in active use in the company and project under study. Since
the manual regression test‐selection approach was in use before we had developed MORTOGA, we used the empirical
results as reported in this paper, as motivations to communicate with the test team’s management. Since the entire study
was closely conducted with participation of the test team and its management, “deploying” the MORTOGA approach
was straightforward and, with some time spent on briefing test team, the entire team “embraced” this new and better
approach and the method has been in active use, as of this writing.
5.7 LIMITATIONS AND THREATS TO VALIDITY
This empirical study was an action‐research [13, 14] project in which we developed a solution method based on
optimization search. The purpose of the study was to apply a tailored version of a MORTO approach [10] to an industrial
project and assess the effectiveness of proposed methodology by comparing the existing manual regression testing
approach with the proposed solution.
The validity of a study denotes the trustworthiness of the results, and to what extent the results are true and not biased by
the researchers’ subjective point of view [89]. We discuss next the potential threats to the validity of our study and the
steps that we have taken to minimize or mitigate them. The threats are discussed in the context of the four types of threats
to validity based on a standard checklist for validity threats presented in [90]: internal validity, construct validity,
conclusion validity and external validity.
Internal validity: Internal validity in this study deals with designing the experiment correctly (i.e., without having
confounding factors, bias, etc.) such that any observed effect in the dependent variables can really be attributed to the
change of independent variables (in our case, the change of the regression test selection method). Internal validity of the
study was ensured since all approaches were developed and applied systematically. A potential threat to internal validity
in this experiment could be the poor setting of GA parameters. That threat was minimized by taking a systematic
approach to systematically tune the GA parameters for the proposed solution, as discussed in Section 5.3. Another
potential threat to internal validity which is also a treat to conclusion validity could the relative small scale of the case
under study. We believe the SUT was a mid‐size software since it includes 935 system‐level requirements. To verify those
system‐level requirements, 54 different test suites were developed, each containing between 182 to 3,588 test steps. Thus,
the context is a typical (representative) industrial context, as per our experience in testing various types of systems in the
past, e.g. [11].
Construct validity: Construct validity is concerned with the extent to which the object of study truly represents theory
behind the study [89]. We are not aware of any construct validity in this study.
Conclusion validity: Conclusion validity is concerned with the correct application of statistical procedures (which in our
case does not apply) and the correct interpretation of the results of the experiment. For this empirical study, one possible
threat is about running the GA which is a stochastic algorithm and a single run of this algorithm may not provide a stable
result. In order to mitigate that threat, we used our past experience in GA parameter tuning [18, 61], and executed all the
GA‐related experiments for a large number of times (at least, 100) and we picked the best outcomes.
This is a pre‐print of the following paper that has been published in the Information and Software Technology (IST) journal:
http://dx.doi.org/10.1016/j.infsof.2018.06.007
24
External validity: External validity is concerned with the extent to which the results of this study can be generalized.
Threats to external validity are conditions that could limit our ability to generalize the results of our experiment to
industrial practice. As mentioned before, this study was an action‐research project. It presented a solution for a specific
industrial problem with specific parameters and settings. However, our solution provides a general and flexible structure
which is applicable to a typical regression test‐selection problem, in black‐box approach (based on requirements). For
example, as discussed in Section 4.2, we developed MORTOGA in a flexible / extensible manner in terms of the
cost/benefit objectives, i.e., various sets of cost and benefit objectives can be plugged into the fitness function, depending
on the system and project under test.
6 CONCLUSIONS AND FUTURE WORK
Based on the principles of “action‐research” [13, 14], we presented in this paper a GA‐based approach (called
MORTOGA) and an empirical study on regression test‐selection problem of an industrial project with several cost and
benefit objectives. Two research questions were raised and answered in scope of the empirical study: (RQ1) How can the
GA be best calibrated to yield the best results for the context at hand?; and (RQ2) How much improvements does the
approach provide compared to the previous existing test selection approach?
We formulated and solved the problem using a custom‐built genetic algorithm (GA). The empirical results demonstrated
that this approach yields a more efficient regression test‐set in terms of cost/benefit and more effective in terms of
coverage of affected requirements compared to the old (manual) test‐selection approach, and another approach from the
literature, i.e., the selective requirement coverage‐based approach [19]. We developed MORTOGA based on a set of five
cost objectives and four benefit objectives for regression testing while providing full coverage of affected requirements.
Since our proposed approach has been beneficial and has made a positive difference in the company practices in terms of
regression testing, it is currently in active use in the industrial context. With this approach, regression selection process in
the project is not ad‐hoc anymore. Furthermore, we were able to eliminate the subjectivity of regression testing and its
dependency on expert opinions. Thanks to the new approach, regression test‐sets are now determined based on
requirement coverage, and cost and benefits of test suites in a systematic approach.
Our future work directions include the followings: (1) enhancement of MORTOGA by covering other cost and benefit
parameters; (2) applying MORTOGA in other contexts and regression test‐selection problems and to further assess its
generalizability; and (3) further assessment of the fault detection effectiveness of the three approaches by conducting
mutation testing. Due to confidentiality, logistical and costs reasons, we were so far unable to inject artifacts defects
(mutants) in the real SUT in the field, and measure fault detection rates (mutation scores).
Acknowledgements:
The authors would like to thank Dietmar Pfahl for a detailed review on an early draft of this paper.
REFERENCES [1] Tricentis Inc., ʺʺSoftware fail watchʺ report, 5th edition,ʺ https://www.tricentis.com/software‐fail‐watch/, 2017, Last accessed: Jan. 2018.
[2] Research Triangle Institute, ʺThe economic impacts of inadequate infrastructure for software testing,ʺ NIST Planning Report 02‐3, National
Institute of Standards and Technology, 2002.
[3] E. Torres, ʺInadequate Software Testing Can Be Disastrous,ʺ IEEE Potentials, vol. 37, no. 1, pp. 9‐47, 2018.
[4] S. Yoo and M. Harman, ʺRegression Testing Minimization, Selection and Prioritization: A Survey,ʺ Softw. Test. Verif. Reliab., vol. 22, pp. 67‐120,
2012.
[5] M. Vierhauser, R. Rabiser, P. Gr, #252, and nbacher, ʺA case study on testing, commissioning, and operation of very‐large‐scale software
systems,ʺ presented at the Companion Proceedings of International Conference on Software Engineering, Hyderabad, India, 2014.
[6] R. Carlson, H. Do, and A. Denton, ʺA clustering approach to improving test case prioritization: An industrial case study,ʺ presented at the
Proceedings of IEEE International Conference on Software Maintenance, 2011.
[7] C. Henard, M. Papadakis, M. Harman, Y. Jia, and Y. L. Traon, ʺComparing White‐Box and Black‐Box Test Prioritization,ʺ in IEEE/ACM
International Conference on Software Engineering, 2016, pp. 523‐534.
This is a pre‐print of the following paper that has been published in the Information and Software Technology (IST) journal:
http://dx.doi.org/10.1016/j.infsof.2018.06.007
25
[8] R. K. Saha, L. Zhang, S. Khurshid, and D. E. Perry, ʺAn Information Retrieval Approach for Regression Test Prioritization Based on Program
Changes,ʺ in IEEE/ACM International Conference on Software Engineering, 2015, vol. 1, pp. 268‐279.
[9] E. Engström, P. Runeson, and M. Skoglund, ʺA systematic review on regression test selection techniques,ʺ Information and Software Technology,
vol. 52, pp. 14‐30, 2010.
[10] M. Harman, ʺMaking the case for MORTO: Multi objective regression test optimization,ʺ Proceedings International Conference on Software
Testing, Verification, and Validation Workshops, pp. 111‐114, 2011.
[11] V. Garousi, M. M. Eskandar, and K. Herkiloğlu, ʺIndustry‐academia collaborations in software testing: experience and success stories from
Canada and Turkey,ʺ Software Quality Journal, special issue on Industry Academia Collaborations in Software Testing, pp. 1‐53, 2016.
[12] V. Garousi, K. Petersen, and B. Özkan, ʺChallenges and best practices in industry‐academia collaborations in software engineering: a
systematic literature review,ʺ Information and Software Technology, vol. 79, pp. 106–127, 2016.
[13] P. S. M. d. Santos and G. H. Travassos, ʺAction research use in software engineering: An initial survey,ʺ in Proceedings of International
Symposium on Empirical Software Engineering and Measurement, 2009, pp. 414‐417, 1671296.
[14] D. E. Avison, F. Lau, M. D. Myers, and P. A. Nielsen, ʺAction research,ʺ Communications of the ACM, vol. 42, no. 1, pp. 94‐97, 1999.
[15] S. N. Sivanandam and S. N. Deepa, Introduction to Genetic Algorithms. Springer, 2007.
[16] T. Gorschek, P. Garre, S. Larsson, and C. Wohlin, ʺA Model for Technology Transfer in Practice,ʺ IEEE Software, vol. 23, no. 6, pp. 88‐95, 2006.
[17] A. Arcuri and G. Fraser, ʺOn parameter tuning in search based software engineering,ʺ in Proceedings of international conference on Search‐based
software engineering, 2011, pp. 33‐47, 2042252.
[18] V. Garousi, ʺEmpirical analysis of a genetic algorithm‐based stress test technique,ʺ presented at the Proceedings of annual conference on
Genetic and evolutionary computation, 2008.
[19] Q. Gu, B. Tang, and D. Chen, ʺOptimal Regression Testing based on Selective Coverage of Test Requirements,ʺ in International Symposium on
Parallel and Distributed Processing with Applications, 2010, pp. 419‐426.
[20] R. Özkan, ʺMulti‐objective regression test selection in practice: an empirical study in the defense software industry,ʺ MSc thesis, Middle East
Technical University, http://etd.lib.metu.edu.tr/upload/12620692/index.pdf, 2017, Last accessed: Jan. 2018.
[21] V. Garousi and M. V. Mäntylä, ʺWhen and what to automate in software testing? A multivocal literature review,ʺ Information and Software
Technology, vol. 76, pp. 92‐117, 2016.
[22] B. Xiaoying, W. T. Tsai, R. Paul, S. Techeng, and L. Bing, ʺDistributed end‐to‐end testing management,ʺ in Proceedings IEEE International
Enterprise Distributed Object Computing Conference, 2001, pp. 140‐151.
[23] J.‐M. K. J.‐M. Kim and a. Porter, ʺA history‐based test prioritization technique for regression testing in resource constrained environments,ʺ
Proceedings of the 24th International Conference on Software Engineering. ICSE 2002, pp. 119‐129, 2002.
[24] K. Deb, Multi‐Objective Optimization Using Evolutionary Algorithms. John Wiley & Sons, 2001.
[25] S. Biswas, R. Mall, M. Satpathy, and S. Sukumaran, ʺRegression test selection techniques: A survey,ʺ Informatica, 2011.
[26] Y. Singh, ʺSystematic Literature Review on Regression Test Prioritization Techniques,ʺ Informatica vol. 36, pp. 379–408, 2012.
[27] M. Khatibsyarbini, M. A. Isa, D. N. A. Jawawi, and R. Tumeng, ʺTest case prioritization approaches in regression testing: A systematic
literature review,ʺ Information and Software Technology, vol. 93, pp. 74‐93, 2018.
[28] C. Catal and D. Mishra, ʺTest case prioritization: a systematic mapping study,ʺ Software Quality Journal, vol. 21, no. 3, pp. 445‐478, 2013.
[29] V. Garousi and M. V. Mäntylä, ʺA systematic literature review of literature reviews in software testing,ʺ Information and Software Technology,
vol. 80, pp. 195‐216, 2016.
[30] B. Qu, C. Nie, B. Xu, and X. Zhang, ʺTest Case Prioritization for Black Box Testing,ʺ in Proceedings of International Computer Software and
Applications Conference, 2007, pp. 465‐474.
[31] R. Gupta, M. J. Harrold, and M. L. Soffa, ʺAn approach to regression testing using slicing,ʺ Proceerdings of Int. Conference on Software
Maintenance, pp. 299‐308, 1992.
[32] G. Rothermel, ʺEfficient, Effective Regression Testing Using Safe Test Selection Techniques,ʺ ed. Doctoral Dissertation, Clemson University,
1996.
[33] G. Rothermel and M. J. Harrold, ʺA safe, efficient regression test selection technique,ʺ ACM Transactions on Software Engineering and
Methodology, vol. 6, pp. 173‐210, 1997.
[34] S. Bates and S. Horwitz, ʺIncremental program testing using program dependence graphs,ʺ Proceedings of symposium on Principles of
programming languages, vol. 5, pp. 384‐396, 1993.
[35] W. E. Wong, J. R. Horgan, S. London, H. Agrawal, and S. Street, ʺA Study of Effective Regression Testing in Practice,ʺ in Proceedings of the
International Symposium on Software Reliability Engineering, 1997, pp. 264‐274.
[36] J. a. Jones and M. J. Harrold, ʺTest‐suite reduction and prioritization for modified condition/decision coverage,ʺ in IEEE International Conference
on Software Maintenance, 2001, pp. 92‐103.
[37] Y. Chen, R. L. Probert, and H. Ural, ʺModel‐based Regression Test Suite Generation Using Dependence Analysis,ʺ in Proceedings of the
international workshop on Advances in model‐based testing, 2007, pp. 54‐62.
[38] M. Akhin and V. Itsykson, ʺA regression test selection technique based on incremental dynamic analysis,ʺ Software Engineering Conference in
Russia, pp. 19‐24, 2009.
[39] V. Garousi, E. G. Ergezer, and K. Herkiloğlu, ʺUsage, usefulness and quality of defect reports: an industrial case study in the defence domain,ʺ
in International Conference on Evaluation and Assessment in Software Engineering (EASE), 2016, pp. 277‐282.
This is a pre‐print of the following paper that has been published in the Information and Software Technology (IST) journal:
http://dx.doi.org/10.1016/j.infsof.2018.06.007
26
[40] M. E. Coşkun, M. M. Ceylan, K. Yiğitözu, and V. Garousi, ʺA tool for automated inspection of software design documents and its empirical
evaluation in an aviation industry setting,ʺ in Proceedings of the International Workshop on Testing: Academic and Industrial Conference ‐ Practice
and Research Techniques (TAIC PART), 2016, pp. 118‐128.
[41] V. Garousi et al., ʺExperience in automated testing of simulation software in the aviation industry,ʺ IEEE Software, In Press, 2017.
[42] B. Chase, ʺPortable Automated Test Station: Using Engineering‐Design Partnerships to Replace Obsolete Test Systems,ʺ CrossTalk, The Journal
of Defense Software Engineering, pp. 4‐8, 2015.
[43] C. Hagen, S. Hurt, and A. Williams, ʺMetrics That Matter in Software Integration Testing Labs,ʺ CrossTalk, The Journal of Defense Software
Engineering, pp. 24‐28, 2015.
[44] J. Park, H. Ryu, H.‐J. Choi, and D.‐K. Ryu, ʺA survey on software test maturity in Korean defense industry,ʺ presented at the Proceedings of
the India software engineering conference, Hyderabad, India, 2008.
[45] A. Shumskas, ʺSoftware test and analysis: Department of Defense policy directions,ʺ in Proceedings of Annual International Computer Software &
Applications Conference, 1989, p. 526.
[46] B. Gauf, ʺDefense Needs Better Ways to Test Software,ʺ National Defense Magazine,
http://www.nationaldefensemagazine.org/articles/2013/10/1/2013october‐defense‐needs‐better‐ways‐to‐test‐software, 2013, Last accessed: Jan. 2018.
[47] B. Robinson, ʺTrustworthy battlefield software depends on better testing,ʺ Defense Systems Magazine,
https://defensesystems.com/articles/2010/06/07/defense‐it‐software‐testing.aspx, 2010, Last accessed: Jan. 2018.
[48] US Department of Defense, ʺSoftware Testing During Post‐Development Support of Weapons Systems,ʺ Report No. 94‐175, 1994.
[49] M. Reginald N, C. Youngblut, and D. A. Wheeler, ʺSoftware Testing Initiative for Strategic Defense Systems,ʺ Tehcnical report P‐2701, Institute
for Defense Analyses, 1992.
[50] S. Biffl, A. Aurum, B. Boehm, H. Erdogmus, and P. Grünbacher, Value‐Based Software Engineering. Springer, 2010.
[51] B. W. Boehm, Software Engineering Economics. Prentice Hall, 1981.
[52] S. Yoo and M. Harman, ʺPareto efficient multi‐objective test case selection,ʺ in Proceedings of international symposium on Software testing and
analysis, 2007, p. 140.
[53] A. D. Lucia, M. D. Penta, R. Oliveto, and A. Panichella, ʺOn the role of diversity measures for multi‐objective test‐case selection,ʺ in
International Workshop on Automation of Software Test, 2012, pp. 145‐151.
[54] L. S. d. Souza, R. B. C. Prudencio, and F. d. A. Barros, ʺMulti‐Objective Test Case Selection: A study of the influence of the Catfish effect on
PSO based strategies,ʺ in Workshop de Testes e Tolerância a Falhas ‐ WTF, 2014
[55] M. G. Epitropakis, S. Yoo, M. Harman, and E. K. Burke, ʺEmpirical evaluation of pareto efficient multi‐objective regression test case
prioritisation,ʺ in Proceedings of International Symposium on Software Testing and Analysis, 2015, pp. 234‐245, 2771788.
[56] D. Mondal, H. Hemmati, and S. Durocher, ʺExploring Test Suite Diversification and Code Coverage in Multi‐Objective Test Case Selection,ʺ in
International Conference on Software Testing, Verification and Validation, 2015, pp. 1‐10.
[57] ʺMulti‐objective optimization,ʺ Wikipedia, 2016. [Online]. Available.
[58] ʺHeuristic (computer science),ʺ Wikipedia, 2016. [Online]. Available.
[59] M. Harman, P. McMinn, J. T. de Souza, and S. Yoo, ʺSearch Based Software Engineering: Techniques, Taxonomy, Tutorial,ʺ in Empirical
Software Engineering and Verification: International Summer Schools, B. Meyer and M. Nordio, Eds., 2012, pp. 1‐59.
[60] V. Garousi, ʺTraffic‐aware Stress Testing of Distributed Real‐Time Systems based on UML Models using Genetic Algorithms,ʺ Journal of
Systems and Software, vol. 81, no. 2, pp. 161‐185, 2006.
[61] M. R. Karim, G. Ruhe, M. M. Rahman, V. Garousi, and T. Zimmermann, ʺAn empirical investigation of single‐objective and multi‐objective
evolutionary algorithms for developer’s assignment to bugs,ʺ Journal of Software: Evolution and Process, vol. 28, no. 12, pp. 1025–1060, 2016.
[62] S. Winkler and J. Pilgrim, ʺA survey of traceability in requirements engineering and model‐driven development,ʺ Software and System
Modeling, vol. 9, no. 4, pp. 529‐565, 2010.
[63] A. E. Eiben and J. E. Smith, ʺWhat is an Evolutionary Algorithm?,ʺ Introduction to Evolutionary Computing, pp. 15‐35, 2003.
[64] K. Miettinen and M. M. Mäkelä, ʺOn scalarizing functions in multiobjective optimization,ʺ OR Spectrum, vol. 24, no. 2, pp. 193‐213, 2002.
[65] S. Yoo and M. Harman, ʺPareto efficient multi‐objective test case selection,ʺ Proceedings of the 2007 international symposium on Software testing
and analysis ‐ ISSTA ʹ07, p. 140, 2007.
[66] G. Eichfelder, Adaptive Scalarization Methods in Multiobjective Optimization. Springer, 2008.
[67] H. Ishibuchi, T. Doi, and Y. Nojima, ʺIncorporation of Scalarizing Fitness Functions into Evolutionary Multiobjective Optimization
Algorithms,ʺ in International Conference on Parallel Problem Solving from Nature, 2006, pp. 493‐502.
[68] R. Özkan, V. Garousi, and A. Betin‐Can, ʺGA tool source‐code in Matlab for multi‐objective regression testing,ʺ
http://doi.org/10.5281/zenodo.1149058, 2017.
[69] J. Zander, I. Schieferdecker, and P. J. Mosterman, Model‐Based Testing for Embedded Systems. CRC Press, 2011.
[70] V. Garousi, M. Felderer, Ç. M. Karapıçak, and U. Yılmaz, ʺWhat we know about testing embedded software,ʺ IEEE Software, In press, 2018.
[71] M. Jørgensen, ʺA review of studies on expert estimation of software development effort,ʺ Journal of Systems and Software, vol. 70, no. 1, pp. 37‐
60, 2004.
[72] A. Idri, F. a. Amazal, and A. Abran, ʺAnalogy‐based software development effort estimation: A systematic mapping and review,ʺ Information
and Software Technology, vol. 58, pp. 206‐230, 2015.
[73] E. Aranha and P. Borba, ʺAn Estimation Model for Test Execution Effort,ʺ in International Symposium on Empirical Software Engineering and
Measurement, 2007, pp. 107‐116.
This is a pre‐print of the following paper that has been published in the Information and Software Technology (IST) journal:
http://dx.doi.org/10.1016/j.infsof.2018.06.007
27
[74] S. Elbaum, A. G. Malishevsky, and G. Rothermel, ʺPrioritizing test cases for regression testing,ʺ SIGSOFT Software Engineering Notes, vol. 25,
no. 5, pp. 102‐112, 2000.
[75] T. Zimmermann, N. Nagappan, and A. Zeller, ʺPredicting Bugs from History,ʺ in Software Evolution: Springer Berlin Heidelberg, 2008, pp. 69‐
88.
[76] M. Adler and E. Ziglio, Gazing Into the Oracle: The Delphi Method and Its Application to Social Policy and Public Health. Jessica Kingsley Publishers,
1996.
[77] T. J. Gandomani, K. T. Wei, and A. K. Binhamid, ʺA case study research on software cost estimation using expertsʹ estimates, Wideband
Delphi, and Planning Poker technique,ʺ International Journal of Software Engineering and its Applications, Article vol. 8, no. 11, pp. 173‐182, 2014.
[78] A. Rai, G. P. Gupta, and P. Kumar, ʺEstimation of software development efforts using improved delphi technique: A novel approach,ʺ
International Journal of Applied Engineering Research, Article vol. 12, no. 12, pp. 3228‐3236, 2017.
[79] S. Piroozfar, R. Barzi, and M. A. A. Kazemi, ʺIdentify software quality indicators based on Fuzzy Delphi method,ʺ in Proceedings of International
Conference on Computers and Industrial Engineering, 2015.
[80] T. Philip, G. Schwabe, and E. Wende, ʺIdentifying early warning signs of failures in offshore software development projects ‐ a Delphi
survey,ʺ in Proc. of Americas Conference on Information Systems, 2010, pp. 3925‐3934.
[81] R. Schmidt, K. Lyytinen, M. Keil, and P. Cule, ʺIdentifying Software Project Risks: An International Delphi Study,ʺ Journal of Management
Information Systems, vol. 17, no. 4, pp. 5‐36, 2001.
[82] S. Gotshall and B. Rylander, ʺOptimal population size and the genetic algorithm,ʺ Proceedings On Genetic And Evolutionary Computation
Conference, pp. 1‐5, 2000.
[83] K. DeJong, ʺLearning with genetic algorithms: an overview,ʺ Mach. Lang., vol. 3, no. 2‐3, pp. 121‐138, 1988.
[84] H. G. Cobb and J. J. Grefenstette, ʺGenetic Algorithms for Tracking Changing Environments,ʺ in Proceedings of International Conference on
Genetic Algorithms, 1993, pp. 523‐530, 657576.
[85] J. D. Schaffer, R. A. Caruana, L. J. Eshelman, and R. Das, ʺA study of control parameters affecting online performance of genetic algorithms for
function optimization,ʺ presented at the Proceedings of the international conference on Genetic algorithms, 1989.
[86] V. P. Patil and D. D. Pawar, ʺThe optimal crossover or mutation rates in Genetic algorithm : A Review,ʺ International Journal of Applied
Engineering and Technology, vol. 5, pp. 38‐41, 2015.
[87] H. M, #252, and hlenbein, ʺParallel Genetic Algorithms Population Genetics and Combinatorial Optimization,ʺ in Proceedings of International
Conference on Genetic Algorithms, 1989, pp. 416‐421, 657252.
[88] S. A. Jolly, V. Garousi, and M. M. Eskandar, ʺAutomated Unit Testing of a SCADA Control Software: An Industrial Case Study based on
Action Research,ʺ in IEEE International Conference on Software Testing, Verification and Validation (ICST), 2012, pp. 400‐409.
[89] P. R. C. Wohlin, M. Höst, M. C. Ohlsson, B. Regnell, and A. Wesslén, ʺExperimentation in Software Engineering: An Introduction,ʺ 2000.
[90] C. Wohlin, P. Runeson, M. Höst, M. C. Ohlsson, B. Regnell, and A. Wesslén, Experimentation in Software Engineering: An Introduction. Kluwer
Academic Publishers, 2000.