Embed Size (px)
Citation preview
i
Multi Objective Optimization of Cutting and Geometric parameters
in turning operation to Reduce Cutting forces and Surface
Roughness
Thesis submitted in partial fulfillment of the requirements for the degree
of
Bachelor of Technology (B.Tech.)
In
Mechanical Engineering
By
GAUTAM KUMAR
Roll no. 109ME0042
Under the guidance of
Prof. S.K SAHOO
NATIONAL INSTITUTE OF TECHNOLOGY,ROURKELA 769008, INDIA
ii
NATIONAL INSTITUTE OF TECHNOLOGY
ROURKELA 769008, INDIA
Certificate of Approval
This is to certify that the thesis entitled Multi objective optimization of cutting
and geometric parameters in turning operation to cutting force and surface
roughness submitted by Shri Gautam Kumar has been carried out under my
supervision in partial fulfillment of the requirement for the Degree of Bachelor of
Technology in Mechanical Engineering at National institute of technology,
Rourkela and this work hs not been submitted elsewhere before for any other
academic degree.
---------------------------
Dr. S.K SAHOO
Professor
Rourkela-769008 Department of Mechanical engineering
Date- National institute of Technology, Rourkela

iii
Acknowledgement
I wish to express my gratitude to prof S.K Sahoo, Associate professor, Department
of Mechanical Engineering, National Institute of technology, Rourkela for giving
an opportunity to carry out the project under his supervision. I am greatly indebted
to him for his inspiring guidance, constructive suggestion and criticism from time
to time during the course of progress of the work.
I express my sincere thanks to Prof. K.P Maity, head of department, Mechanical
Engineering, NIT Rourkela for providing necessary facilities in the department to
carry out my project .
I would also like to thank Mr. Mantra satpathy, Ph.D scholar for his consistent
assistance and help in carrying out the experiments.
Last but not the least, my sincere thanks to all staff member of central workshop
who have extended all sorts of help for accomplishing this undertaking.
GAUTAM KUMAR
DEPARTMENT OF MECHANICAL ENGINEERING
NATIONAL INSTITUTE OF TECHNOLOGY
ROURKELA-769008

iv
ABSTRACT
Turning operation is one of the most important machining operations to be carried out in
different industries for manufacturing of various products. As it is a basic operation for various
industries it is very essential to optimize the various parameters affecting turning operation for
the optimum operating condition. Turning operation is affected by both cutting parameters and
geometrical parameters. The parameter influence most are cutting velocity, depth of cut , feed
rate, geometry of cutting tool like principle cutting edge angle ,rake angle, nose radius etc. In
order to control surface roughness and cutting force acting on material during turning operation it
is very necessary to control these parameters as the product with desired attributes are function
of these parameter.
The objective of the project is obtain the optimum values of different cutting parameter like
cutting speed , depth of cut, feed rate and principle cutting edge angle for the minimum cutting
force and surface roughness.
In the project turning operation of 304 SS as work piece is carried out with WC inserts as tool.
The different values of cutting parameters, cutting speed (13.18, 20.724, 33.912 m/min), feed
rate (0.105, 0.166, 0.25mm/rev), depth of cut (0.5, 0.6, 0.7mm) and principle cutting edge angle
(78, 66, 62 degree) are selected.
Different combinations of experiments are designed and conducted based on Taguchi’s L9
orthogonal array design. Grey relational coefficients are determined after normalizing the value
of output responses for lower-the-better condition and after that grey relation grade is obtained.
Grey relation grade value are converted in S/N ratio for larger-the-better condition in MINTAB
16 and based on the plot of S/N ratio in MINTAB 16 the optimal levels of the input parameters

v
are identified. Confirmation test is conducted for the optimal level of input parameters to validate
the experimental result.
Key Words: Cutting force, Surface roughness, Multi-objective optimization, Orthogonal Array,
Grey relational Analysis.

vi
CONTENTS
Item Page No.
Title Page i
Certificate ii
Acknowledgement iii
Abstract iv
Contents vi
List of tables vii
List of figures viii
Chapter 1
1.1Introduction 1
1.2 Literature Review 3
Chapter 2
2.1 Work piece composition 5
2.2 Tool specification 6
2.3 Equipment Used 7
2.3.1 Dynamometer
2.3.2 Talysurf 8
Chapter 3
3.1 Methodology 10
3.1.1 Taguchi Method 10
3.1.2 Grey Relational Analysis 12
3.2 Procedure followed 14

vii
Chapter 4
4.1 Experimental Observation and Result 16
4.2 Confirmatory test 21
Chapter 5
5.1 Conclusion 23
Bibliography 24

viii
List of Tables
Table no Description page no.
Table 1 Chemical composition of SS 304 5
Table 2 Mechanical composition of SS 304 5
Table 3 Tool Specification 6
Table 4 Levels of Input parameter 12
Table 5 Design of Experiment L9 orthogonal array 12
Table 6 Observation Table 14
Table 7 Normalization table of cutting force and surface roughness 15
Table 8 Loss quality estimate (Δo) 15
Table 9 grey relation coefficient 16
Table 10 Grey relations Grade 17
Table 11 Cutting and surface roughness for optimal value 22
Table 12 Confirmatory test 22

ix
List of figures
Figure no. description page no.
Figure 1 cutting tool 13
Figure 2 dynamometer 14
Figure 3 handysurf 15
Figure 5 surface roughness (Ra) 15
Figure 6 experimental setup 20
Figure 7 S/N ratio plot 26

1
Chapter 1
1.1 INTRODUCTION
Today metal cutting is significant industry in most economically developed countries. Of all the
processes used to shape the metals, the conditions of operation are most varied in machining.
Machining is most widely used process to produce different shape used in engineering world.
Turning is the machining operation which widely used in industries for machining. During
turning operation the work material is held in the chuck and rotated and tool is held rigidly in a
tool post and moved at constant rate along the axis of the work material, cutting away the layer
of metal from work piece to form a cylinder or other complex profile. The turning operation is
controlled by cutting and the geometry parameters. The cutting parameters include cutting speed,
feed rate and depth of cut.
The cutting speed is defined as the rate uncut surface of the work material passes the cutting of
tool and usually expressed in ft/min or m/min. the feed rate is the distance moved by tool in the
axial direction at every revolution of work material. The depth of cut is the thickness of material
removed from the work material in the radial direction. The cutting speed and the feed rate are
the two most influential cutting parameters during tuning operation and it should be controlled
by operator to achieve optimal cutting condition.
Traditionally selection of cutting parameters for turning is left to machine operators but in this
case even for a skilled operator it is very difficult to obtain the optimum values of the parameter.
To determine the good quality characteristic it is very necessary to set optimum value of the
parameters.

2
To predict the optimum value of different parameters we use optimization technique. Using a
optimization technique we can evaluate the optimum values for different cutting and geometry
parameter for which we achieve optimum economic performance of the operation. In turning
operation we perform multi-objective to establish a tradeoffs between various input parameters
to achieve desired value of the responses. In turning operation the machining performances are
measured by different responses such as tool life, material removal rate, surface roughness,
cutting force. These performances measures significantly influence the economic performance of
machining, such as production cost, profit rate etc.
Manufacturing of any product includes various types of process and in today’s world
manufacturing processes are caught between the growing needs for quality, high manufacturing
costs, high process safety and short manufacturing times. In order to meet the required demand,
manufacturing process control parameters should be chosen in the best possible manner. The
selection of optimum process parameter plays an important role to ensure quality of the product,
reduce manufacturing cost and to increase production rate. Modeling and optimization of the
input process parameters is one of the difficult task and these required following aspects:
knowledge of manufacturing process, empirical formula to develop realistic constrains,
specification of machine capabilities, development of an effective optimization criterion and
knowledge of mathematical and numerical optimization techniques.
Cutting force and surface roughness are two most important technological parameters in
machining process. Cutting force directly influence on cutting pressure and power consumption,
heat generation, tool wear, deformation of work piece machined, its dimensional accuracy, chip
formation and machining system stability. It is the necessary for the evaluation of power

3
machining (choice of electric motor). Surface roughness is related to many properties of machine
elements like wear resistance, friction and heat transmission.
1.2 Literature Review
Ahilan C, Kumanan, S & Sivakumaran,N [12] they conducted and designed experiment on
CNC machine with AISI304 as work material and Carbide tool inserts to study and optimize the
turning parameters using taguchi and grey relation method. They have taken four parameters
cutting speed, depth of cut, feed rate and nose radius and these parameters effect on power
consumption and surface roughness. Experiments were conducted on the basis of L27 orthogonal
array and after that grey relation method was used to optimize the multi response of power
consumption and surface roughness. Using the grey relation grade ANOVA is used to determine
the contribution of different factor. They observed that the cutting speed affects the most
followed by feed rate, depth of cut and nose radius.
H.L Shyu and L.L Hsieh [9] studied the optimization of UV/H2O2 and UV/TiO2 process for
copper complexes using taguchi’s experiment design . They used five control factors pH
solution, Kind of catalyst, capacity of H2O2 , kind of amino carboxylic acid, the ratio of cu2+
and
amino carboxylic acid and three different levels and used L18 orthogonal array. The result
showed that the photo degradation reduced by 97.8% with the presence of H2O2. . It also showed
that effect of catalyst was insignificant.
Emel Kuram, Babur Ozcelik [8] studied the micro-milling of aluminum metal with ball nose
end mill. It was carried out in four stages: experimental work, modeling and multi- optimization.

4
The control parameters were spindle speed, depth of cut on tool wear and feed per tooth. Their
effect on force on surface roughness was investigated. Taguchi design of experiment was used to
carry out the experiment. The effect of input parameters on the responses was evaluated by
analysis of variance. After that grey relation methd is used to estimate the optimum combination
of input parameter for minimum value of tool wear, cutting force and surface roughness. It was
also concluded that spindle speed is the most significant parameter among the parameters.
C.L.Lin[7] studied the approach based on taguchi method in combination with grey relation
analysis for th optimization of turning operation of S45C steel bars with multi-performances
responses. Optimal cutting parameters were estimated by using grey relation grade as the
performance index. The control parameters were cutting speed, feed rate and depth of cut and
each having three levels. The orthogonal array used was L9. The grey relation analysis of cutting
force, tool life and surface roughness can convert the multiple objective characteristic in single
characteristic known as grey relation grade. The result also showed that Grey relation method is
can be efficiently used for multi-response optimization for different machining process.

5
Chapter 2
2.1 Work piece
SS 304 is the most extensively used stainless steel, available in wide variety of products, forms
and finishes. It is having an excellent welding and forming capacities. The balanced austenitic
structure of grade 304 can be deep drawn without any intermediate annealing. SS 304 can be
readily brake or roll formed into various components for application in the industrial,
transportation and architectural fields. It has two types:
304L, the low carbon version which does not require post weld-annealing and therefore it is
widely used in heavy gauge components.
304H is having high carbon content and it has application at elevated temperature. It has high
toughness.
Chemical composition of SS 304
Table 1 Chemical composition of SS 304
GRADE C Mn Si P S Cr Mo Ni N
304
0.08 2.0 0.75 0.045 0.030 20.0 - 10.5 0.10
Mechanical properties of SS 304
Table 2 Mechanical properties of SS 304
GRADE Tensile
strength(Mpa)
Yield strength
0.2% proof
(MPa)
Elongation
(% in 50 mm)
Rockwell
hardness
(HR B)
Brinell
hardness
(HB)
304
515 205 40 92 201

6
SS 304 is widely used material and have application in different fields like :
Food processing equipment like in milk processing.
Architecture paneling and trim.
Chemical containers and heat exchangers.
Threaded fasteners and springs.
2.2 Tool specification
Tool used for turning of the 304 SS was carbide inserts.
Figure 1 Cutting tool
Table 3 Tool Specification
ISO catalog number Tip dimension
D L10 S Re D1
SCMT
09T308TN5120
Carbide 9.53 9.53 3.97 0.8 4.40

7
2.3 Equipment used
2.3.1Dynamometer
The forces during turning operation are measured using dynamometer. This device is the most
reliable method for measuring cutting forces. It is inserted either between the tool and machine
as a dynamometer-type tool holder or between the work and machine as work holding type
dynamometer. In our case we have used tool holder type dynamometer. It is capable of
measuring two or three forces at a time depending upon the complexity of the dynamometer. The
net power and other properties can be calculated from these force components. There are two
types of dynamometer used for measurement of forces: mechanical type dynamometer and
electrical strain dynamometer. In our case we used electrical strain guage dynamometer. It is
common in use and it is more accurate. The basic principal of strain gauge dynamometer is
shown in figure .
Figure 2 Dynamometer

8
2.3.2 Talysurf
It is a stylus and skid based instrument in which magnification are evaluated electrically. The
response of talysurf is more rapid and most accurate. In this instrument sharply pointed stylus is
used to trace the profile of turning surface and the oscillatory movement of the stylus is
converted into corresponding change in electric current. The profile of the surface irregularities
are thus converted into electrical quantity. The diamond stylus which traces the profile of the
irregularities has a tip of dimension 0.001 inch and act on the surface with a force of rmine the
0.1gm.talysurf is based on the principle of running probe along the surface and determine the
variation in height of the surface as a function of distance.some error can be incorporated during
the measurement of surface roughness due to stylus speed and lateral deflection due to
unevenness of the surface.
Figure 3 Handysurf
The handysurf measures the different surface roughness parametrs like Ra, Rsm, Rz, and Rp.

9
The most common surface roughness parameter is average roughness Ra. surface roughness
average (Ra) is also known as arithmetic average (AA) and is rated as the arithmetic average
deviation of surface peaks and valleys expressed in micro inches or micro meters. It can be
measured by following formula:
Ra = CLA=AA= (M1 +M2 + ….. +Mn)/n
Where Mx = measure value
Figure 4 Surface roughness (Ra)

10
Chapter 3
3.1 Methodology
The design of experiment was done by using taguchi method and multi-objective optimisation is
done by grey relational analysis method.
3.1.1Taguchi method
Genichi taguchi a Japanese engineer devised a experimental design principle which is used for
quality engineering. According to taguchi “quality is the loss imparted to society from the time a
product is shipped”. The concept of taguchi method is to design a levels of each parameters so to
reduce the deviation in characteristic from its target value. He used the concept of orthogonal
array to study large number of combination of variables in small number of experiments. At the
core of product and process design is the concept of experimental design. The method according
to which we design our experiments guide in selecting combinations of the various factor levels
that enable us to determine the output characteristic and thereby calculating the performance
statistic. An orthogonal array represents a matrix of numbers. Each row represents the levels or
states of choosen factors and each column represents a specific factor whose effect on the
response variable are of interest. Orthogonal array is having a property that every factor setting
occurs the same number of times for every test setting of all other factors. This allows us to made
balanced comparison among factors level under variety of conditions.

11
Taguchi recommends the use of loss functions to determine process response deviation from thr
desired value. The value of loss function is further converted into signal-to-noise(S/N) ratio and
tries to select the parameter levels that maximize this ratio. The term signal represents the square
of the mean of the quality characteristic while noise is a measure of the variability of the
characteristic.
There are three categories of output characteristic in the analysis of S/N ratio, these are : Higher-
the-better, lower-the-better and nominal-the best. The S/N ratio can be evaluated by following
formula:
For nominal the best
S/N T = 10log (
)
For Higher-the-better
S/NL = -10 log
∑
2)
For lower-the-better
S/NS = -10 log
∑
2)
Where y is the observed data and n is the number of observation.
The method is most relevant for the optimization of single response. in the multi-objective
optimization the lower S/N ratio of one response may c for optimization of multi-response to
higher S/N ratio of other there for resultant S/N ratio of the responses are required for the
12
optimization of multi-response. For this purpose we must adopt another method in combination
with taguchi method. Here we have used Grey relational analysis.
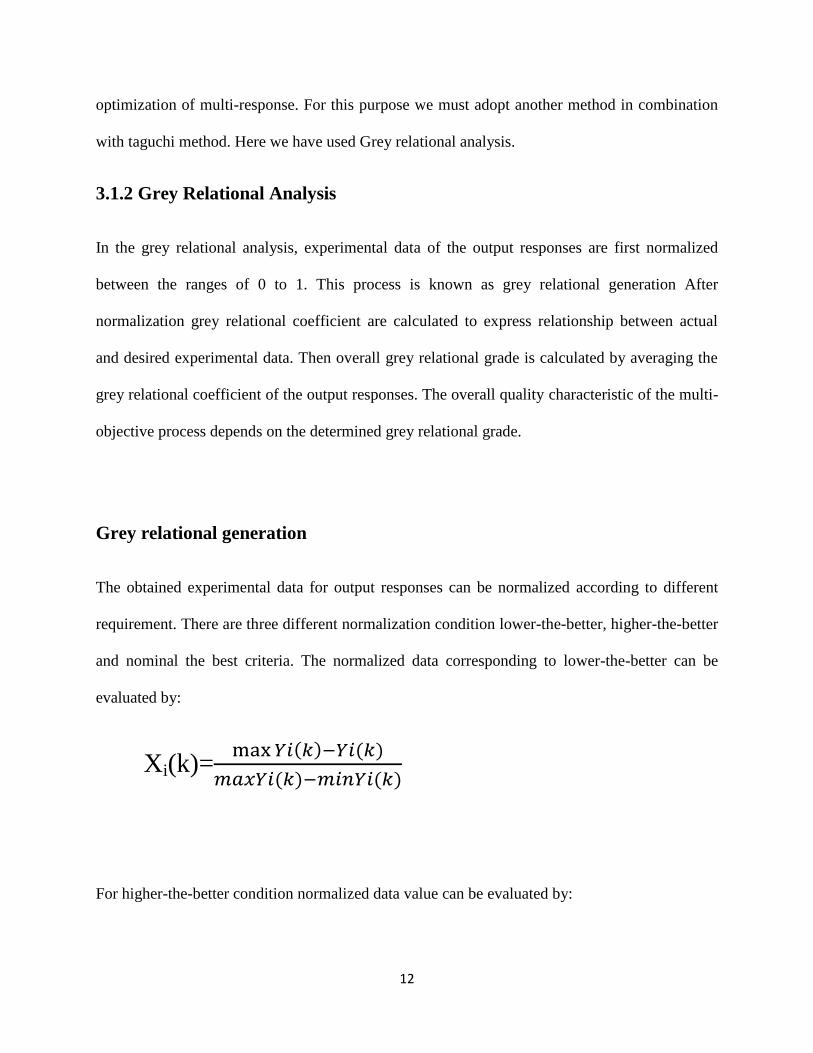
3.1.2 Grey Relational Analysis
In the grey relational analysis, experimental data of the output responses are first normalized
between the ranges of 0 to 1. This process is known as grey relational generation After
normalization grey relational coefficient are calculated to express relationship between actual
and desired experimental data. Then overall grey relational grade is calculated by averaging the
grey relational coefficient of the output responses. The overall quality characteristic of the multi-
objective process depends on the determined grey relational grade.
Grey relational generation
The obtained experimental data for output responses can be normalized according to different
requirement. There are three different normalization condition lower-the-better, higher-the-better
and nominal the best criteria. The normalized data corresponding to lower-the-better can be
evaluated by:
Xi(k)= ) )
) )
For higher-the-better condition normalized data value can be evaluated by:

13
Xi(k)= ) )
) )
Where Xi is the value obtained after grey relational generation. minYi(k) is smallest value of Yi
and max Yi(k) is the maximum value of Yi(k).
Grey relational coefficient
The grey relational coefficient is calculated by following equation:
γi =
)
Where γi the grey relational coefficient of the Ith
experiment for the kth
response. Δoi=||Xo (k)-
Xi(k)||=difference between absolute value, ζ the distinguishing coefficient and it is defined in the
range 0 < ζ ≤1,Δmin= min|| x0(k)-xj(k)|| is the smallest value of Yj(k) and Δmax= max||x(k)-
xj(k)|| is the largest value of Yj(k).
Grey relational grade
The grey relational grade is calculated by averaging the grey relation coefficients corresponding
to each experiment.
14
αi=
∑ )
Where n is total number of responses.
3.2 Procedure followed
According to above discussion following steps have been followed for the multi-objective
optimization of the turning operation using Taguchi and Grey Relational Analysis.
1. The cutting parameters and geometric parameters for turning operation are selected.
Cutting parameters:
Cutting speed
Feed rate
Depth of cut
Geometry parameter
Principal cutting edge angle
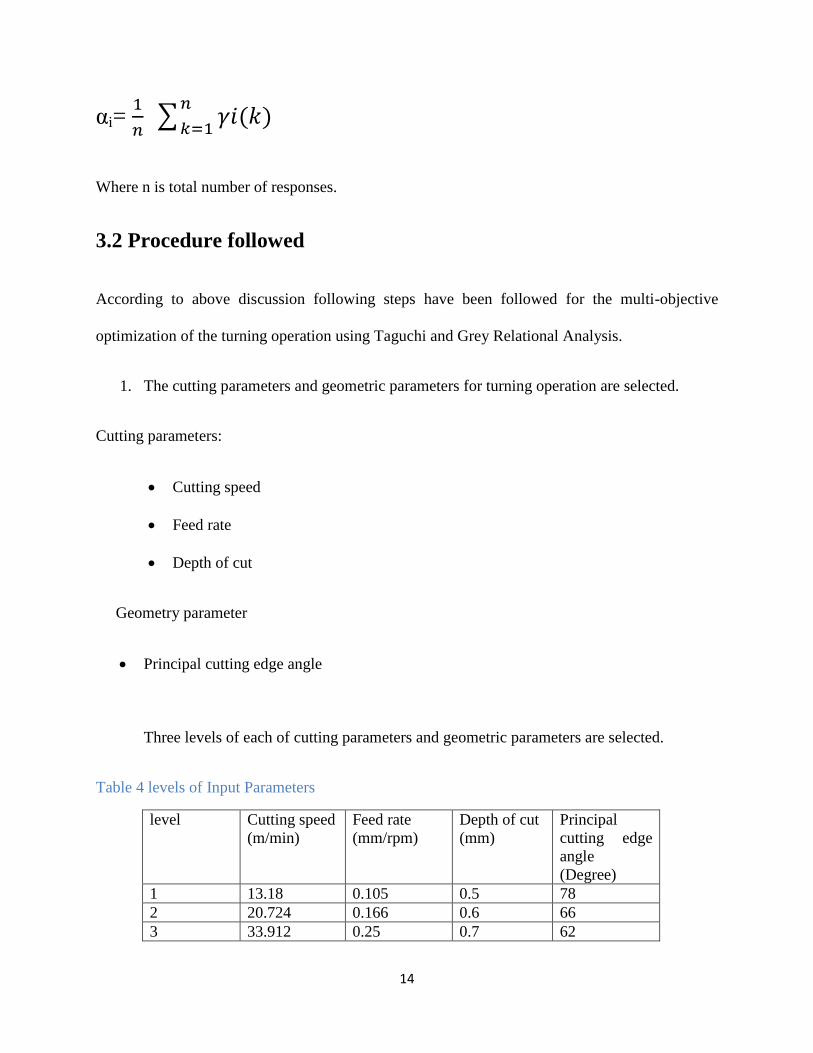
Three levels of each of cutting parameters and geometric parameters are selected.
Table 4 levels of Input Parameters
level Cutting speed
(m/min)
Feed rate
(mm/rpm)
Depth of cut
(mm)
Principal
cutting edge
angle
(Degree)
1 13.18 0.105 0.5 78
2 20.724 0.166 0.6 66
3 33.912 0.25 0.7 62

15
2. For 4 input parameters and 3 level an orthogonal array L9 is selected using
MINITAB16.
Table 5 Design Of Experiment L9 Orthogonal array
Sl.no Cutting speed Feed rate Depth of cut Principal
cutting edge
angle
1 1 1 1 1
2 1 2 2 2
3 1 3 3 3
4 2 1 2 3
5 2 2 3 1
6 2 3 1 2
7 3 1 3 2
8 3 2 1 3
9 3 3 2 1
Now based on arrangement of the orthogonal array table (5), turning of the work piece is carried
out using carbide tool on the lathe. 304 SS work piece is centered and properly fitted on the
headstock. First a rough pass was given to the work piece and diameter of work piece was made
to 30mm.
Figure 5 Experimental Setup

16
Chapter 4
4.1 Experimental observation and result
For each combination of input parameters according to orthogonal array, cutting force and
surface roughness is determined using dynamometer and talysurf.
Table 6 Observation Table
Sl.no Cutting
speed
(mm/min)
Feed rate
(mm/rpm)
Depth
of cut
(mm)
Principle
cutting
angle
Force (N)
Surface
roughness
Ra
(µm) Thrust Feed Radial
1 13.18 0.105 0.5 78 235.2 107.8 98 2.6
2 13.18 0.166 0.6 66 196.0 117.6 88.2 1.5
3 13.18 0.250 0.7 62 480.2 294.0 235.2 1.3
4 20.724 0.105 0.6 62 284.2 235.2 176.4 0.8
5 20.724 0.166 0.7 78 284.2 176.4 147.0 0.7
6 20.724 0.250 0.5 66 323.4 196.0 147.0 0.8
7 33.912 0.105 0.7 66 303.8 245.0 176.4 0.9
8 33.912 0.166 0.5 62 196.0 137.2 137.2 1
9 33.912 0.250 0.6 78 486.2 196.0 235.6 1.2
3. After measurement of force and surface roughness, the value of cutting force (thrust
force) and surface roughness is normalized using lower-the-better condition. For lower-
the-better condition normalized formula is:

17
Xi(k) = ) )
) )
After normalization we obtained following table:
Table 7 Normalized value of cutting force and surface roughness
Sl.no Cutting force Surface roughness
1 0.8649 0.0000
2 1.0000 0.5789
3 0.0206 0.6842
4 0.6960 0.9473
5 0.6960 1.0000
6 0.5600 0.9473
7 0.6285 0.8947
8 1.0000 0.8421
9 0.0000 0.7326
After obtaining normalized data table () it has been used to calculate the quality loss estimates.
Quality loss (Δoi) estimates for each normalized value are shown in table (8). It is estimated by
Δoi=||Xo (k)-Xi(k)||=difference between absolute value and Xi(k). The value of Xoi= 1.

18
Table 8 loss quality estimate
Sl.no Cutting force Surface roughness
1 0.1351 1.0000
2 0.0000 0.4211
3 0.9794 0.3158
4 0.3040 0.0527
5 0.3040 0.0000
6 0.4400 0.0527
7 0.3715 0.1053
8 0.0000 0.1579
9 1.0000 0.2674
After evaluating loss quality estimates (Δoi) grey relation coefficient for cutting force and surface
roughness is calculated. The grey relational coefficient γij can be expressed as :
γij =
)
where,
ζ the distinguishing coefficient and it is defined in the range 0 < ζ ≤1.
Δmin= min|| x0(k)-xj(k)|| is the smallest value of Yj(k).
Δmax= max||x(k)-xj(k)|| is the largest value of Yj(k).

19
Table 9 Grey relation coefficient
Sl.no Cutting force Surface roughness
Ideal sequence 1.0000 1.0000
1 0.7872 0.3333
2 1.0000 0.5428
3 0.3379 0.6128
4 0.6218 0.9046
5 0.6218 1.0000
6 0.5319 0.9046
7 0.5737 0.8260
8 1.0000 0.7599
9 0.3333 0.6544
After averaging grey relation coefficient grey relation grade is obtained using equation
αi=
∑ )
Where n= number of process responses.
Thus multi-objective optimization has been converted in single optimization. Table (10) shows
the grey relational grade and order. The higher value of grey relation grade means that the
corresponding input parameter is closer to optimal value.
Table 10 Grey Relation Grade
Sl no Grey relational grade order
1 0.5602 7
2 0.7714 3
3 0.4753 9
4 0.7632 4

20
5 0.8190 2
6 0.7182 5
7 0.6998 6
8 0.8799 1
9 0.4938 8
Now the S/N ratio plot for the grey relational grade has been calculated using MINITAB 16. the
S/N ratio has been calculated for higher-the-better condition. The S/N plot for the grey relational
grade is shown in the figure 6.
Figure 6 S/N ratio plot

21
With the help of S/N ratio figure optimal parametric combination of the input parameters has
been determined.
The optimal setting of input factors is A2 B2 C1 D2.
4.2 Confirmatory test
For the optimal setting of the input parameters obtained from the minitab, experiment is
performed and value of cutting force and surface roughness is obtained.
Table 11 cutting force and surface roughness value for optimal setting
Sl .no Cutting
speed
(m/min)
Feed rate
(mm/rpm)
Depth of cut
(mm)
Force(N) Surface
roughness
Ra (µm) Thrust Feed Radial
1 20.724 0.166 0.5 186.2 127.4 137.2 2.4
For the obtained value of surface roughness and cutting force, S/N ratio is calculated according
to previous steps and is compared with the S/N ratio evaluated from MINITAB 16 for input
parameters A2 B2 C1 D2. The S/N ratio for the experimental run is -1.106 while S/N ratio by
using MINTAB 16 for the same is -0.975681.

22
Table 12 confirmatory test
Optimal cutting factors
Prediction
(MINITAB)
experiment
level A2 B2 C1 D2 A2 B2 C1 D2
CUTTING FORCE (N) 186.2
SURFACE ROUGHNESS(µm) 2.4
S/N RATIO (larger-the-better) -0.975681 -1.1069
The S/N ratio value predicted by MINITAB 16 and S/N ratio by calculation for the
Experimental optimal both are same so it can be concluded that the optimal setting
A2 B2 C1 D2 is right optimal setting and turning for 304 SS should be done at this
setting for minimum cutting force and surface roughness.

23
Chapter 5
Conclusion
After the experiment and analysis of the turning operation of 304 SS with carbide insert tool
following conclusion can be made.
1. The optimization of multi-objective responses can be done efficiently and in simplified
way by using Taguchi and grey relational analysis approach.
2. From the analysis it can be shown that feed rate and cutting speed are the main important
input parameters which affect the cutting force and the surface roughness most.
3. By this technique the turning operation performance characteristic like cutting force and
surface roughness can be improved together.

24
Bibliography
[1] E.Edward Moor Trent Metal Cutting,4th
edition, Butterworth-heinemann publications
TJ1185.T73 2000
[2] R.Venkata Rao Advance modeling and optimisation of manufacturing process, springer-
verlag London Limited 2011
[3] Ranjit K. Roy Design of Experiments using the Taguchi approach, a wiley-interscience
publication.
[4] Avinash M. Badadhe Metrology and Quality Control, Technical publication Pune ISBN 81-
89411-86-1.
[5] Dr. R kesavan, B. vijaya Ramanath Manufacturing technology-ll, firewall media publication
2006
[6] Wit Grzesik Advanced Machining Process of Meta7llic Materials, Elsevier 2008.
[7] C.L.Lin Use of Taguchi method and Grey Relational Analysis to optimize Turning operations
with Multiple Performance Characteristics, material and manufacturing process Vol. 19,No. 2,
pp. 209-220, 2004.
[8] Emel Kuram, Babur Ozcelik, Muti-objective optimisation using Taguchi based Grey
relational analysis for micro-milling of Al 7075 material with ball nose end mill, measurement
46(2013) 1849-1864

25
[9] H.L Shyu and L.L Hsieh, application of the Taguchi experimental design to the optimization
of UV/TiO2 and UV/H2O2 process for copper complexes treatment, Environmental informatics
archieves, Volume 5(2007), 674-683.
[10] Sathiya P & Abdul Jaleel, M.Y, Grey based Taguchi method for optimization of bead
geometry in laser bead-on-plate Welding, Advances in Production Engineering & Management
5(2010) 4, 225-234 ISSN 1854-6250
[11] Y.F.Hasio, Y.S.Tarng and W.J. Huang, Optimisation of Plasma Arc Welding Parameters by
Using the Taguchi Method with Grey Relational Analysis.
[12] Ahilan, C; Kumanan, S & Sivakumaran, N, Application of Grey Based Taguchi Method in
multi-reponse optimization of Turning process, Advances in production Engineering &
management 5(2010) 3, 171-180.