Embed Size (px)
Citation preview


,£*CHtr*


HD28.M414
no.
S5
I3%-|G3
y
oBvmf
WORKING PAPER
ALFRED P. SLOAN SCHOOL OF MANAGEMENT
MULTI -OBJECTIVE ASSESSMENT OF STRATEGIC PLANNING
EFFECTIVENESS: A DISCRIMINANT ANALYSIS APPROACH
Vasudevan RamanujamN. Venkatraman
John C. Camillus
October, 1985 WP# 1716-85
MASSACHUSETTS
INSTITUTE OF TECHNOLOGY50 MEMORIAL DRIVE
CAMBRIDGE, MASSACHUSETTS 02139

MULTI -OBJECTIVE ASSESSMENT OF STRATEGIC PLANNING
EFFECTIVENESS: A DISCRIMINANT ANALYSIS APPROACH
Vasudevan RamanujamN . VenkatramanJohn C. Camillus
October, 1985 WP# 1716-85

„*. im^lmi,, wa pmM.I.T. LIBRARIES
JUN 2 5 1991
Rtl/LiVtU
MULTI-OBJECTIVE ASSESSMENT OF
STRATEGIC PLANNING EFFECTIVENESS:
A DISCRIMINANT ANALYSIS APPROACH
VASUDEVAN RAMANUJAM
The Weatherhead School of Management
Case Western Reserve University
Cleveland, Ohio 44106
216-368-5100
N. VENKATRAMAN
Alfred P. Sloan School of Management
Massachusetts Institute of Technology
50 Memorial Drive
Cambridge, Massachusetts 02139
617-253-5044
and
JOHN C. CAMILLUS
Graduate School of Business
University of Pittsburgh
Pittsburgh, Pa. 15260
412-624-6156
Please do not quote or cite without permission.
To appear in Academy of Management Journal , June 1986,

MULTI-OBJECTIVE ASSESSMENT OF
STRATEGIC PLANNING EFFECTIVENESS:
A DISCRIMINANT ANALYSIS APPROACH
ABSTRACT
Seven key dimensions of a planning system, five reflecting its deisgn
aspects and two tapping the organizational context of planning, are developed
from the literature. Discriminant analysis is employed to evaluate the
ability of these seven dimensions to distinguish between more effective and
less effective planning systems, using three different criteria of planning
effectiveness. While influences on effectiveness seem to vary depending on
the effectiveness criterion used, on an overall basis, the most important
dimensions were system capability (or its creativity and control
orientation), resources provided for planning, and functional coverage.
Portions of this paper were presented at the Fourth Annual StrategicManagement Society Conference, Philadelphia, in October 1984. The authorswould like to thank Jarmell Boyd, Patrick Gaughan, Linda Natal, and LorettaRiles for their administrative assistance during the data collection andanalysis stages of the project on which this paper is based. The insightfulcomments and suggestions provided by the two anonymous reviewers and theeditor are also gratefully acknowledged.

The relationship between strategic planning (hereafter, planning) and
organizational performance is one of the most extensively researched issues
in the strategic management field. An illustrative list of studies
addressing the impact of planning on performance includes Ansoff, Avner,
Brandenburg, Portner, and Radosevich (1970), Fulmer and Rue (1974), Grinyer
and Norburn (1975), Herold (1972), Karger and Malik (197b), Kudla (1980),
Lindsay and Rue (1980), Malik and Karger (1975), Rue and Fulmer (1973), Thune
and House (1970), and Wood and LaForge (1979). A complete review and
critique is provided by Armstrong (1982) and Lorange (1979).
Despite the large number of research efforts aimed at elucidating the
linK between planning and performance, the results of the above body of
research are fragmented and contradictory. This state of affairs has arisen
because most previous research on the effectiveness of planning systems has
suffered from two major conceptual shortcomings. Fi rst , most studies have
used rather simplistic conceptualizations of the notion of planning. Thus,
researchers have been attempting to show differences in financial performance
between "planners" and "non planners" or "formal planners" and "informal
planners". Second , most studies have been solely preoccupied with the
linkage between planning and the financial aspects of corporate performance,
even though conceptual writings on formal planning systems stress several
non-financial and intangible benefits (Camillus, 197b; Steiner, 1979).
With regard to the first issue, crude dichotomizations along a single
dimension, namely the presence or absence of planning or its degree of
formality, are clearly suspect, given that the debate as to what the term
"planning" connotes is still a live one (Mintzberg, 1981; Snyder, 1982). Such
conceptualizations are inconsistent with the multidimensional view of
planning systems that is becoming more and more visible in the literature
(e.g., King & Cleland, 1978; Lorange, 1979, 198U; Lorange & Vancil, 1977).
Similarly, with regard to the second issue, the exclusive emphasis on
financial performance is conceptually flawed and is open to attack as being
narrowly focused. A broader concept of effectiveness is needed.
A truly meaningful assessment of the value of planning systems should,
therefore, recognize their multidimensional nature and the plurality of
approaches that can be used to assess their worth. Such an assessment is
attempted in this research study. Three distinctive features of this study
should be noted. Fi rst , based on an extensive literature review, we identify
seven distinct design and contextual dimensions of planning systems that are
widely believed to influence their effectiveness. Second , we explicitly
recognize the many possible meanings of effectiveness in the context of
planning, and use multiple criteria for assessing planning system
effectiveness. Thi rd , we cast the study in a comparative mode by using the
technique of discriminant analysis in order to bring the differences between
more effective and less effective planning systems into sharp relief.
The purpose of this paper is to test the proposition that relatively
more effective systems will differ from relatively less effective ones along
the seven key design and contextual dimensions referred to above and that the
relative importance of these dimensions will vary depending upon the
criterion of effectiveness used.
DIMENSIONS OF A PLANNING SYSTEM
Planning systems are multi faceted management systems that are
contextually embedded. Hence, they cannot be adequately described in terms of
one or two characteristics such as "formality". Although employing different
terminology, most writings (e.g., King & Cleland, 1978; Lorange & Vanci 1 ,
1977; Steiner, 1979) emphasize the notion that planning systems are best
described in multidimensional terms. Unfortunately, there is as yet no
consensus as to what these dimensions are.
Nevertheless, in one way or other, most researchers emphasize two sets
of impacts on a planning system's effectiveness. These include (i) The
design elements of the planning system and (ii) the organizational context of
planning . We synthesized seven dimensions that tap these two aspects. Five
design elements were included in this study. They are: (i) system
capability, (ii) use of techniques, (iii) degree of attention to internal
facets, (iv) degree of attention to external facets, and (v) functional
coverage. The organizational context of planning was captured in the
following two dimensions: (i) resources provided for strategic planning,
including top management support, and (ii) resistance to planning, or, in
Steiner's (1979) words, "anti-planni ng biases". While other dimensions can
be identified that might conceivably influence the effectiveness of planning,
the above seven have the support of an extensive literature. Also, they are
variables that are relatively more amenable to control by managers.
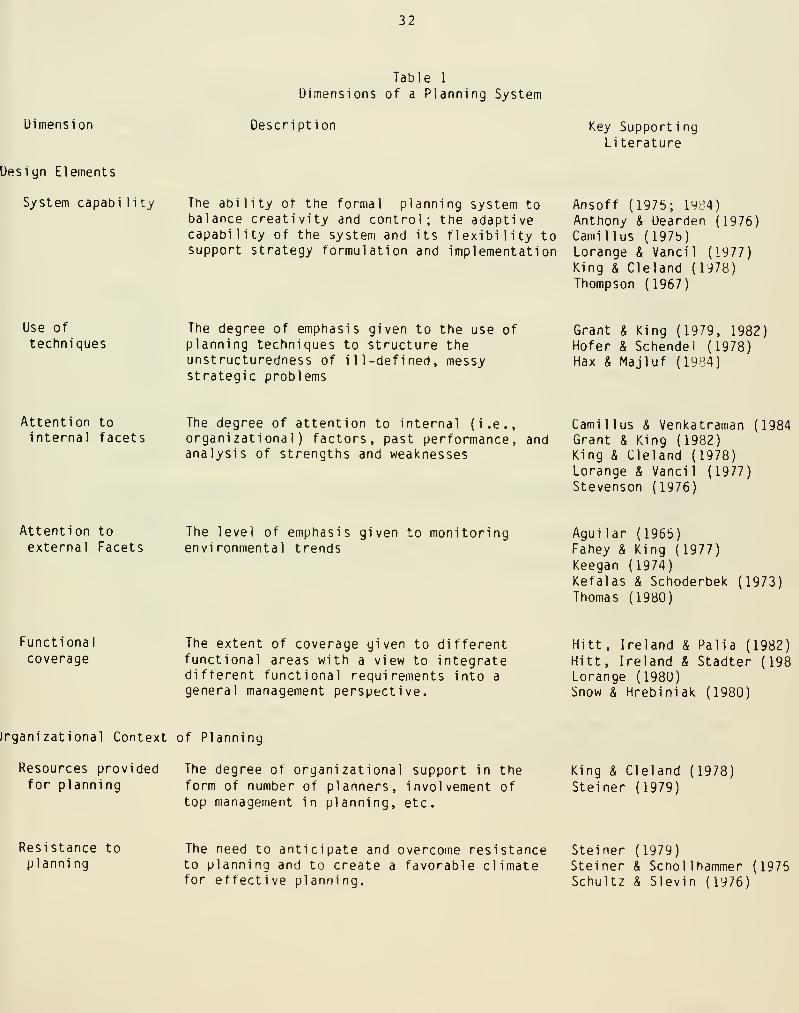
Table 1 summarizes the seven dimensions and indicates the literature
support for each ot them. A brief discussion of each dimension is provided
in the following paragraphs.
INSERT TABLE 1 ABOUT HERE

Design Elements
System Capability. Strategic planning systems differ in the extent to
which they emphasize creativity as opposed to control (Camillus, 1975; Shank,
Niblock, & Sandal Is, 1973). It has been stressed that these two somewhat
opposing orientations need to be balanced in order to enhance the
effectiveness of a system. An excessive emphasis on creativity at the
expense of control or vice versa is apt to be dysfunctional, we
conceptualize systems capability in terms of the ability of the system to
foster control as well as creativity. The creative capability of the system
is assessed in terms of its ability to anticipate suprises and crises, its
ability to adapt to unforeseen changes, etc. On the other hand, the control
aspect of the system refers to the degree of emphasis given to managerial
motivation, upward and downward communication within the organizational
hierarchy, integration of diverse operational areas, etc.
Use of Techniques. A variety of analytical techniques and methodologies
have been developed to aid managers in identifying and dealing with strategic
decisions and problems (Grant & King, 1979). The use of these techniques is
one indication of the extent of formalization of the planning process. The
extent of reliance on planning techniques and methodologies is also an
indicator of the organization's approach to decision-making, i.e.,
comprehensive versus incremental (Fredri ckson , 1984).
The extent of reliance on planning techniques is thus an important
dimension of the planning system. Since the use of formal techniques is
premised on the assumption that they lead to more effective definition and
resolution of the i 11 -structured problems of planning, this dimension can
also be expected to impact the effectiveness of the planning system itself
over time.
Attention to Internal Facets. A formal approach to planning usually
begins with an assessment of the organization's recent history and current
situation. This step or stage in planning is variously referred to as
"situation audit", "appraisal", etc. (Ansoff, 1965; Steiner, 1979). In this
assessment, the organization's internal capabilities receive close study to
identify its strengths and weaknesses. Often plans fail because of an
inadequate or incorrect assessment of the organization's internal aspects
(King & Cleland, 1978). The degree of attention to internal aspects such as
past performance, current strengths and weaknesses, and diagnostic assessment
of recent failures or performance shortfalls is treated in this study as a
distinct and important influence on the effectiveness of an organization's
planning.
Attention to External Facets. One of the purposes of planning is to
adapt the organization to environmental demands and pressures. Analyzing
external opportunities and threats is a major element of planning (Andrews,
1971). There is no need to belabor the importance given in the literature to
external orientation as an influence on planning effectiveness. The extent
of attention devoted to various aspects of the environment is therefore
included in this study as a further aspect of a planning system's design.
Functional Coverage. This term refers to the degree of emphasis
accorded to various functional areas in planning. Functional coverage can
vary because of strategic differences in the competitive postures of firms in
an industry. Some firms may attempt to compete on the basis of price and
volume, while others may emphasize product differentiation and customer
service. The distinctive competencies demanded by these alternate approaches
are usually manifested as a pattern of emphasis on different functional areas
(Hi tt , Ireland, & Palia, 1982; Snow & Hrebiniak, 198U). In the former case,
manufacturing efficienies may be key, while in the latter case, the marketing
function may receive special emphasis. A balanced emphasis on all functions
may be more important in yet other situations, where general management is
the key success factor. The degree of emphasis given to various functional
areas was, therefore, included as a planning system design dimension.
Organizational Context of Planning
Resources Provided for Planning. Many authors have emphasized that
planning in an organization cannot be successful unless adequate resources
are committed to that activity (e.g., King & Cleland, 1978; Steiner, 1979).
These resources may be physical, e.g., the creation and maintenance of a
separate planning staff and office, or they may be intangible, e.g., the time
spent by the CEO and other key managers in the planning function. Planning
is not a costless activity. If benefits are expected from planning, the
organization must be willing to incur a commensurate level of tangible and
intangible costs of doing effective planning as well.
Resistance to Planning. Early research on planning systems emphasized
the importance of identifying and overcoming the sources of resistance to
organizational planning (Steiner, 1979; Steiner & Schol lnammer, 1975).
Resistance to the system may be manifested in lack of acceptance of the
outputs of planning, withdrawal or nominal participation in planning
activities without active involvement on the part of operating managers,
gaming behaviors, etc. The level of resistance to the idea and processes of
planning can be expected to exert a negative influence on the effectiveness
of the planning system.
MULTIPLE CRITERIA OF PLANNING SYSTEM EFFECTIVENESS
In this study planning system effectiveness was approached from three
perspectives. Fi rst , the extent of fulfillment of key planning objectives
was examined. Second , in keeping with most prior research, economic
performance of the organization was included as a further effectiveness
criterion. Thi rd , an overall measure of satisfaction with the planning
system was also considered.
Fulfillment of Planning Objectives
We considered six commonly emphasized objectives of planning, namely,
(i) predicting future trends, (ii) evaluating alternatives, (iii) enhancing
management development, (iv) avoiding problem areas, (v) improving short-term
performance, and (vi) improving long-term performance. Each of these
objectives is discussed and justified next.
Predicting Future Trends. Planning is often justified on the grounds
that contemporary organizational environments have become increasingly
turbulent, thereby necessitating some formal mechanisms for environmental
monitoring and coping with environmental change (Ansoff, 1984; Gluck,
Kaufman, & Wallecx, 1980, 1982). An objective that follows from this
reasoning is the improvement of the ability of a planning system to predict
future trends. It is not suggested that planning should necessarily result in
accurate predictions of the future, but at a minimum planning should aid an
organization in delineating probable, plausible, and preferable future states
of the world (Amara, 1981). In fact, according to Paul, Donavan, & Taylor
(1978), one of the major problems with planning is the inability of planners

10
to produce reasonably valid forecasts of the future. Thus, predicting future
trends is considered an important task of planning and constitutes our first
objective.
Evaluating Alternatives. Critics of planning always point out the
tendency of planning to degenerate into a "numbers game". A good planning
system, it has been proposed, should not only serve as a vehicle for
mind-stretching (Camillus, 1975), but also should delicately balance control
and creativity considerations (Shank, Niblock, & Sandalls, 1973). The extent
to which a planning system fosters the creative generation and exploration of
alternative courses of action thus becomes a further important test of its
effectiveness, and is second in our list of objectives.
Avoiding Problem Areas. Yet another approach to the evaluation of
planning is to examine the extent to which the system results in an
accumulation of experience and enhances organizational learning (e.g.,
Shrivastava & Grant, 1985). An evolutionary approach to systems design
(Lorange & Vanci 1 , 1977) is consistent with the idea that effective planning
systems are adaptive learning systems. Learning can be said to be occurring
if the system increases the probability of goal achievement and minimizes the
recurrence of errors. A corollary is that an effective planning system should
enable an organization to avoid problem areas. This is the thi rd objective
for planning.
Enhancing Management Development. Formalization of planning should lead
to an improvement in the quality of management and facilitate management
succession. This constitutes the long-term "educational" value of the
planning process (Hax & Majluf, 1984; Lorange & Vancil, 1977). The
contribution of planning to the development of an organization's management
depth is by no means an easy achievement to evaluate. Yet, some attention to
11
this important objective appears to be warranted in evaluating a planning
system. This is the fourth objective.
Improving Short-term and Long-term Performance. Finally, the importance
of performance, both short-term and long-term, cannot be overemphasized. In a
sense, performance improvement is the raison d'etre tor adopting elaborate
planning systems in the first place. This is implicit in the exclusive
performance focus of the impressive body of planning system evaluation
studies identified earlier. These are the fifth and the sixth objectives.
Performance Relative to Competition
In addition to the achievement of key planning objectives, it was
posited that effective systems would result in better levels of
organizational performance. There is a subtle difference between achieving
performance objectives and being a relatively higher performing organization.
Hence, performance was included as a separate criterion of planning
effectiveness. Four performance indicators, considered relative to the
competition rather than in absolute terms, were used in this study, namely,
sales growth, earnings growth, market share changes, and return on
investment.
Satisfaction with The Planning System
Adopting the approach common in the management information systems
implementation literature (Lucas, 1978), "satisfaction" with the planning
system was treated as an additional effectiveness criterion. Satisfaction is
particularly important when the system's use is mandatory as opposed to
voluntary, which is likely to be the case for an organization's planning
system. Satisfaction with the system is likely to reflect objective
fulfillment, thus satisfaction can be also be regarded as an additional
internal validation criterion for the objective fulfillment variables.
12
RESEARCH METHODS
Data
Two hundred and seven executives, representing both the planning
function and other operating functions, completed a detailed questionnaire on
their company's planning practices. This sample represents a response rate of
34.5 percent of 600 executives of Fortune 500 , Fortune 500 Service , and Inc
500 companies who received the questionnaire. This level of response from a
list of predominantly Fortune 1000 firms is considered higher than is usual
for mail surveys of this population (Gaedeke & Tootelian, 1976). The
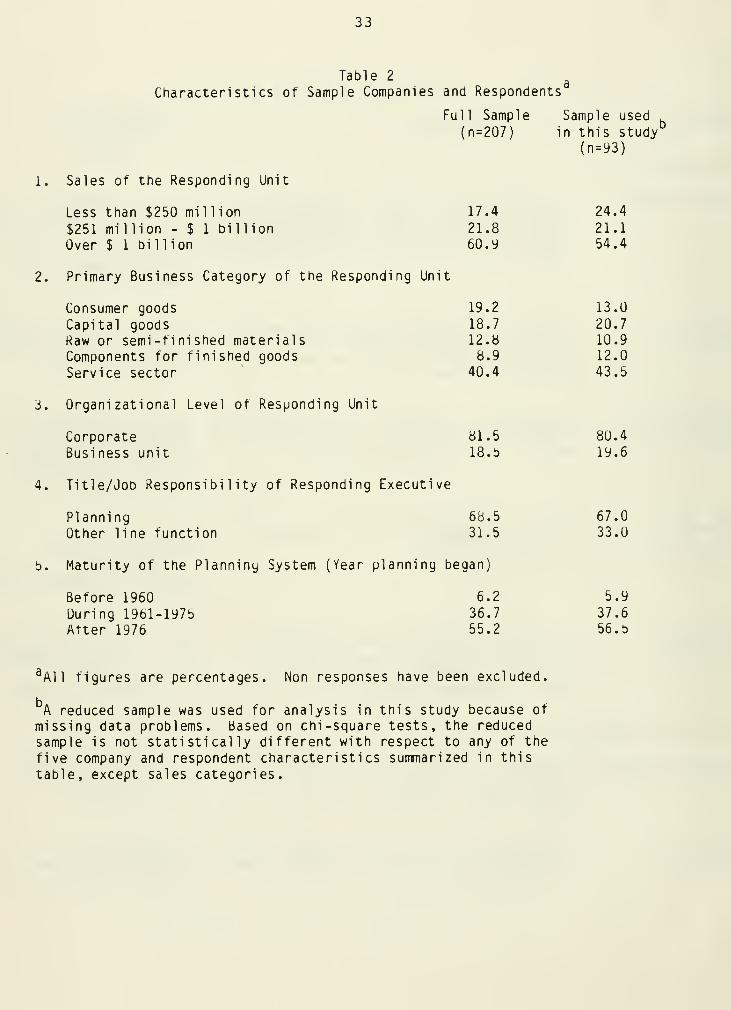
characteristics of the sample are shown in Table 2.
INSERT TABLE 2 ABOUT HERE
The sample is biased in favor of larger firms, with 60.9 percent having
sales in excess of $1 billion. Similarly, planning executives (68.5%) and
respondents at the corporate level of their organizations (81.5%) constitute
a dominant part of the sample.
Since smaller firms do not usually undertake planning to any significant
extent (Robinson & Pearce, 1984), the size bias in the sample is not believed
to be serious from the point of view of drawing tentative generalizations
about the planning processes of firms that do plan. A comparision of the
responses of operating executives and planning executives using t-tests
indicated that planning executives as a group did not tend to systematically
overrate or underrate their planning systems. However, since data were
obtained from a single respondent from each organization, there is a real
13
possibility of response bias or selection bias. A tradeoff between overall
sample size and number of responses per firm became inevitable in view of
resource limitations and we leaned in favor of a large sample size. Given
that our target respondents were top level planning or operating executives,
it was assumed that they would be quite knowledgable about their planning
systems and generally unbiased in their responses.
Measurements
The seven systems dimensions were measured by multi-item scales. The
lack of valid and reliable measurement scales has been one of the impediments
to the development of middle-range theories of strategy and strategic
planning (Venkatraman & Grant, 1986). In this study, content validity of
each dimension was sought to be assured by the use of multiple experts
(including the authors) and an iterative procedure for ensuring an exhaustive
coverage of the domain of the construct, while the use of multi-item scales
was motivated by the aim of enhancing the reliability of measurements
(Nunnally, 1978).
Effectiveness was measured using both single-item and multi-item scales.
The six individual objective fulfillment variables and their simple additive
composite made up the objective fulfillment battery. The four relative
performance items and their composite constituted the relative performance
battery. SATISFN was measured by a single item scale. All variables were
measured using appropriately anchored 5-point Likert scales.
The multi-item scales used in this study are described in Appendix 1.
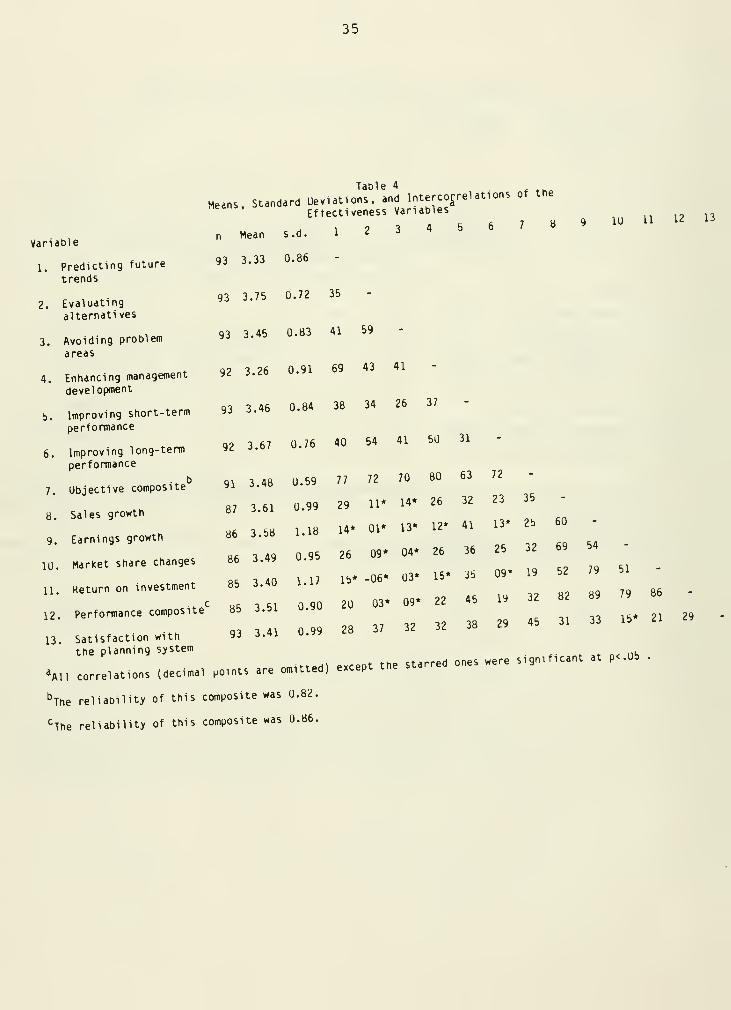
Means, standard deviations, reliabilities (Cronbach alphas) and
intercorrelations for the planning system dimensions are reported in Table 3.
Corresponding statistics for the effectiveness variables and composites are
shown in Table 4.
14
INSERT TABLE 3 AND TABLE 4 ABOUT HERE
It should be noted that the planning systems dimensions used in this
study were specified a priori because of the availability of extensive
literature support (see Table 1). Nevertheless, factor analysis of the
variable set was undertaken to determine if any further parsimony could be
accomplished in the number of planning system dimensions used. Three to
seven factor solutions were prepared and the varimax rotated factor scores
were carefully studied. Since none of the factor structures were easy to
interpret, it was decided to rely on the seven originally specified
dimensions.
Choice of Analytic Technique
Given the interest in exploring the systems dimensions contributing to
di fferences in effectiveness between more effective and less effective
systems, discriminant analysis was deemed to be the appropriate analytical
approach. Although the use of an alternative analytical methodology such as
multiple regression may seem just as appropriate given the interval nature of
the effectiveness variables, an examination of the correlation matrix for the
independent variable set revealed significant multicol 1 inearity in the data.
This further reinforced the original decision to use discriminant analysis as
15
the analytical method, since mul ticol 1 inearity does not affect the
interpretation of discriminant analysis results, many researchers' belief to
the contrary (Eisenbeis, 1977).
Groupings for Discriminant Analysis. The effectiveness groupings for
discriminant analysis were constructed as follows. Since responses were
provided on a five point scale, all respondents choosing 1, 2, or 3 were
placed in one group, and those checking 4, or b were placed in the other
2group. In the case of the two composites, the median was used as the cut
point to yield tne two groups for discriminant analysis.
Tests of Multivariate Normality. The accuracy of the classifications
that result from the application of discriminant analysis are sensitive to
the assumption that the predictor variables constitute a multivariate normal
population. To test for this, tne z-tests for the significance of the
coefficients of skewness and kurtosis discussed by Bock (197b) were employed
The discriminating variables used in this study displayed significant
deviation from normality. This calls for caution in interpreting the
accuracy of the classifications reported here. However, our primary concern
Thirteen regressions were nevertheless run. They yielded statisticallysignificant models witn multiple R values in the ranye U.42 to U.75. Thesigns of the coefficients of the independent variables were umnterpretablebecause of multicol 1 inearity in the data. This multi col 1 inecinty is likelyto be due to common method variance arising from our data collectionapproach.
2Before assigning the neutral responses (scored 3) to the low effectivenessgroups, ANOVAs were run for each grouping variable for all sevendiscriminating dimensions. Scheffe pairwise comparisons across the tnreegroupings showed that the neutral groups were more similar to the low
effectiveness groups than the high effectiveness groups, thus justifying thepooling of the neutral ratings with the low effectiveness ones.
3This problem persisted even when various data transformations were tried.
The detailed results of this analysis are not reported here in the interestof conserving space.
16
in this study is with descriptive rather than predictive relevance (Frank,
Massy, & Morrison, 1965). The failure of a key model assumption, which is
critical for prescriptive studies, is therefore not believed to constitute a
serious challenge.
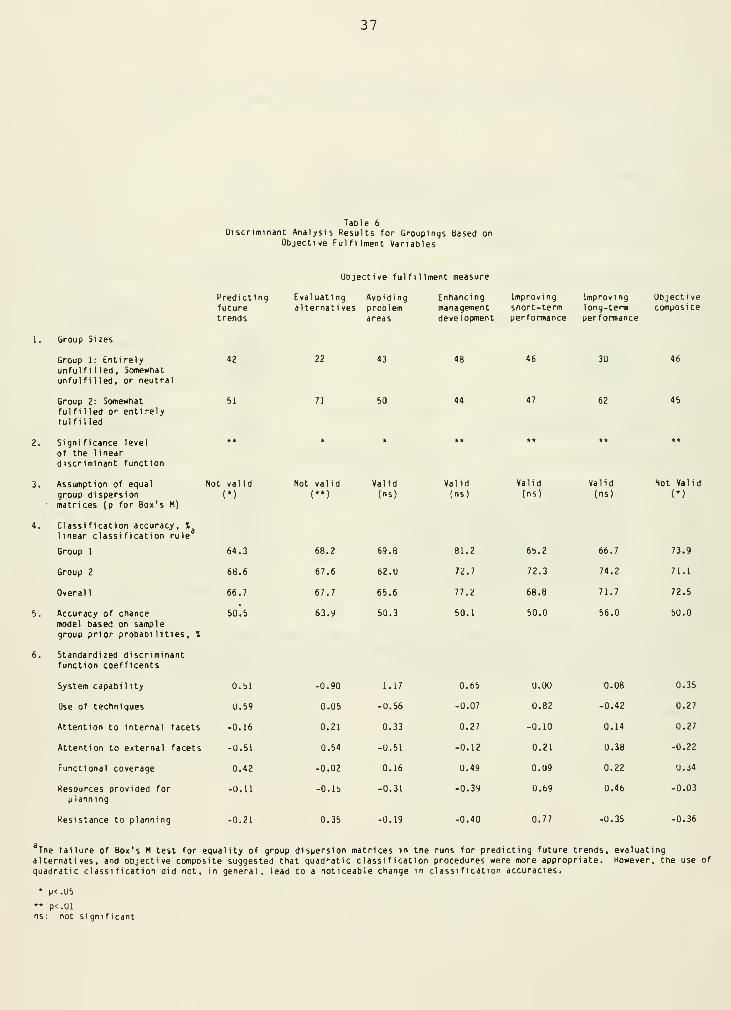
Analysis. A total of 13 discriminant analysis runs were performed for
this study. These include the seven runs based on the objective fulfillment
variables and their composite, the five runs based on the performance
variables and their composite, and the run based on "overall satisfaction".
The seven discriminators being composite dimensions, missing data on even one
of the component variables for any respondent led to the loss of that case.
The discriminant analyses were run using 93 cases that had complete data for
constructing all the seven planning system dimensions. A comparison of these
93 cases with the 114 excluded cases with respect to various characteristics
confirms that this data reduction did not lead to any significant biasing of
the sample used for discriminant analysis (see Table 2).
RESULTS AND DISCUSSION
Overall Results
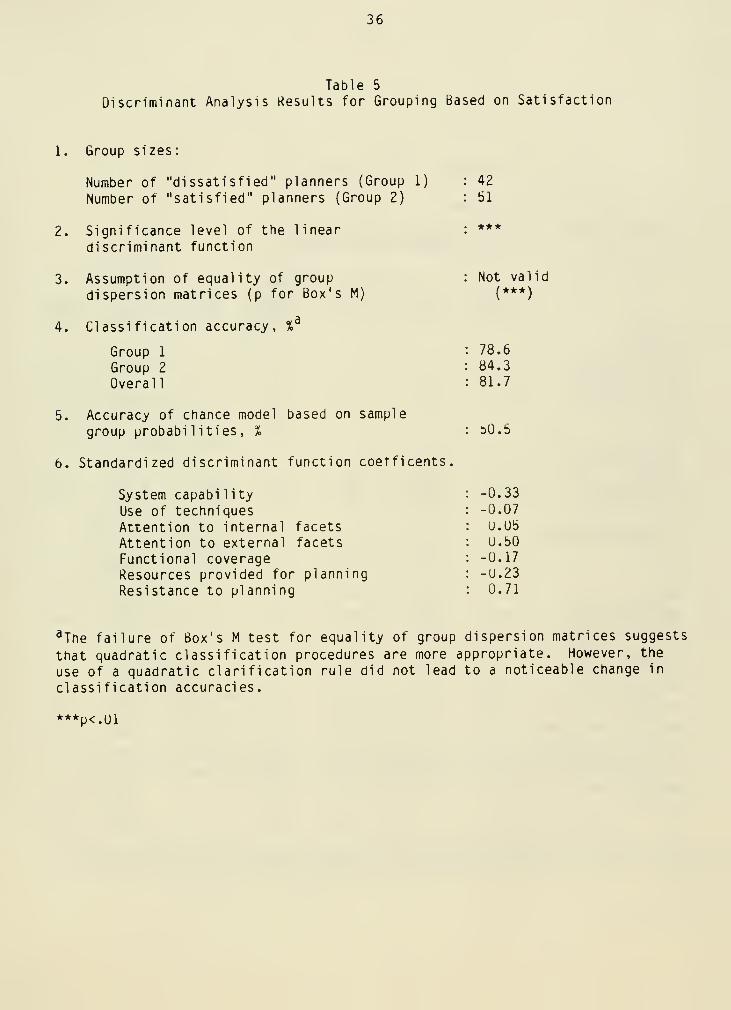
Table 5 shows the results for the discriminant analysis run using
SATISFN as the effectiveness criterion, and serves as a prototype for Tables
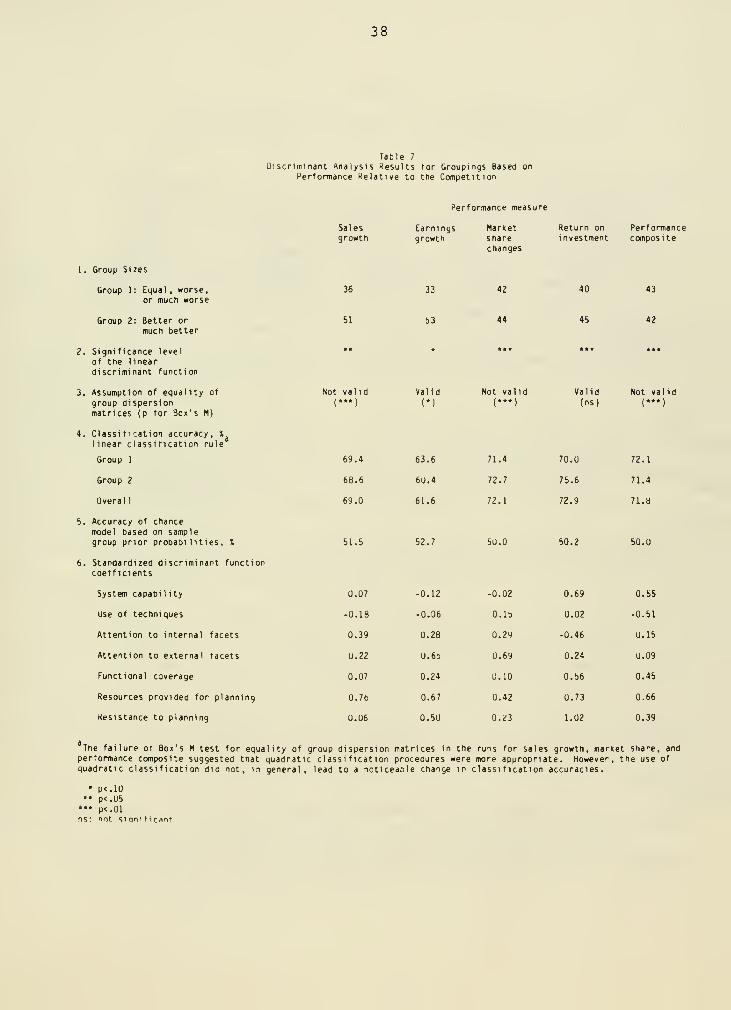
6 and 7, which summarize the results for the objective fulfillment and
relative performance variables, respectively.
INSERT TABLES 5, 6, AND 7 ABOUT HERE
17
The above tables provide for each run (i) the size of the two
effectiveness groups, (ii) the significance level of the discriminant
function, using Bartlett's approximate chi-square test, (iii) the result of
Box's test for equality of group dispersion matrices, (iv) classification
results, (v) the expected accuracy of a chance model using random assignment
of cases to the groups based on their sample prior probabilities, and (vi)
the standardized discriminant function coefficients for the discriminating
dimensions.
Of the 13 discriminant functions, 12 were significant at p< 0.05. The
run for earnings growth was significant at p< 0.10. That the same seven
dimensions lead to significant discriminant functions for each of the
effectiveness criteria used, is encouraging. To a degree, this is not
surprising. The objective fulfillment variables were all highly
intercorrelated , as were the relative performance variables (see Table 4).
In addition, the objective fulfillment variables had high correlations with
the satisfaction variable (as expected). The generally low and
non-significant correlations between the objective fulfillment and relative
performance variables does confirm our initial treatment of the two as
distinct effectiveness criteria. In light of this, the uniformly good
discrimination achieved across all the runs attests to the value of the seven
planning system dimensions in classifying planning systems along either type
of effectiveness criterion.
Equal group sizes are an important consideration in interpreting bias in
discriminant analysis (Morrison, 1969). The grouping procedure used in this
study yielded nearly equal group sizes (i.e., with the smaller group
accounting for no less than 4b percent) for all but the runs based on
alternative evaluation, long-term performance, sales growth, and earnings
18
growth. For these runs, the benchmark chance model accuracies are
accordingly higher. In other words, the discriminant function's
classification accuracy is compared against a higher "test" value in judging
its worth as a discriminating tool. As can be noted in Table 6, the most
unequal group sizes resulted for evaluating alternatives. Even in this case
the discriminant function's overall classification accuracy of 66.7 percent
is somewhat better than the 63.9 expected accuracy of the corresponding
cnance model. For earnings growth the discriminant function's overall
classification accuracy was about 9 percentage points better than that of the
corresponding chance model. In all other cases the overall classification
accuracy of the corresponding discriminant function was at least 15
percentage points higher than the respective chance model. Thus, the results
of the discriminant analysis runs are informative.
Traditionally, the relative importance of the discriminating variables
has been believed to be reflected in the absolute magnitudes of their
standardized discriminant function coefficients, which are treated as being
analogous to the beta weights in a regression model (Klecka, 1975). However,
some methodologists question this approach. While many alternative ranking
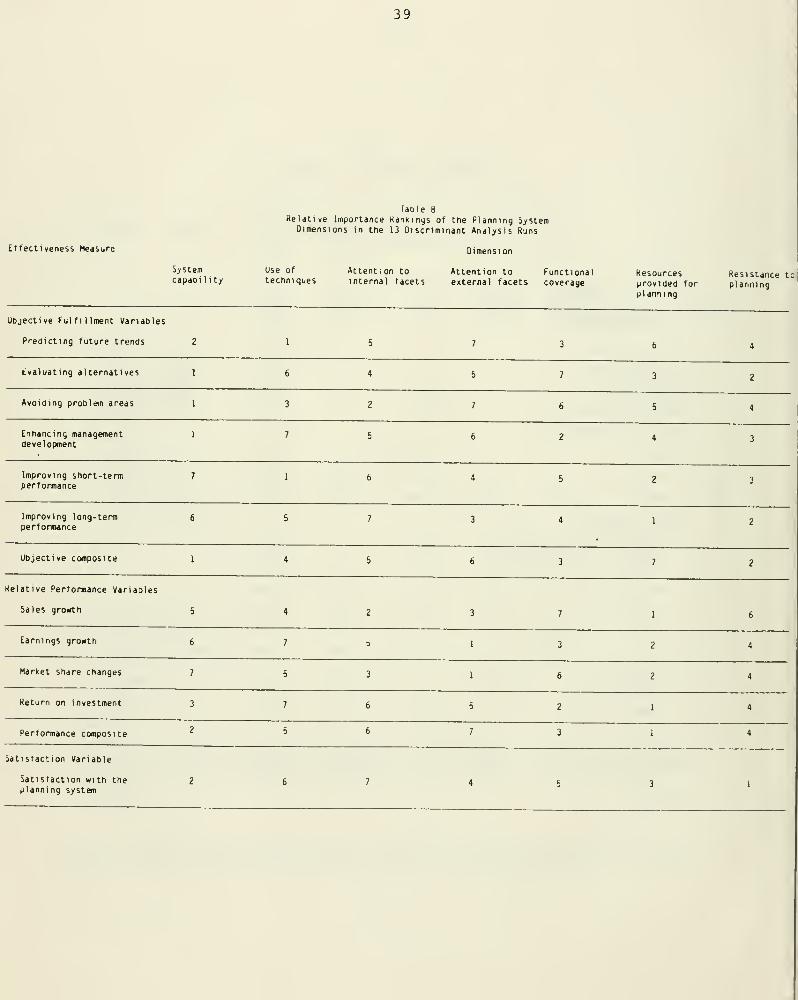
schemes exist, the procedure suggested by Mosteller and Wallace (1963) was
used in this study for ranking the discriminating dimensions. A summary of
the relative importance rankings for the 13 runs is provided in Table 8.
In this procedure, the variables are ranked on the basis of the absolute
value of the product bj (x.j - x-2), where bj is the unstandardized
discriminant function coefficient of the variable j, x., is the mean of this
variable for group 1, and x2
is the mean for group 2. For a discussion of
the superiority of this procedure over the conventional use of the
standardized discriminant coefficients for ranking, see Mosteller and Wallace
(1963) or Joy and Tollefson (1975).

19
INSERT TABLE 8 ABOUT HERE
Satisfaction with the Planning System - Results and Discussion
For the grouping based on satisfaction with the planning system, the
three top ranked discriminators were resistance to planning, system
capability, and resources provided for planning. Attention to internal
facets ranked as the least important discriminating dimension. These
findings suggest that satisfaction with planning is largely a function of the
organizational context of planning.
On a univariate basis, the low satisfaction group differed from the high
satisfaction group along all but one dimension: attention to external
facets. However, in the discriminant analysis, attention to external facets
emerged as the fourth most important discriminator.
If use of techniques, attention to internal facets and functional
coverage can be considered to represent aspects of the planning process that
tap its degree of formality, then it appears that formality of planning and
satisfaction are unrelated or only weakly related.
The implications of these findings for managers concerned with enhancing
satisfaction with planning would appear to be to pay specific attention to
the organizational context of planning, particularly, to the sources of
resistance to planning, it any, and the level of resources committed to
planning activities. Enhancing the external orientation of the planning
system also appears to contribute to greater satisfaction with planning.
Presumably, externally oriented planning systems are perceived as being
conducive to more meaningful planning exercises and thereby result in greater
20
satisfaction with planning. Of course, these are conjectures subject to
further empirical testing, since discriminant analysis results can only yield
tentative clues as to causal linkages.
Objective Fulfillment - Results and Discussion
Turning to the runs for the objective fulfillment variables, system
capability appears to be the key discriminator on an overall basis. It
ranked first in four of the seven objective fulfillment runs. It was,
however, ranked last in the run for short-term performance and sixth in the
run for long-term performance. Thus, system capability appears to be more
related to the process-based as opposed to the outcome-based objectives of
planning. Further support for this conjecture is provided in the fact that
system capability ranked near the bottom in three of the five runs based on
the relative performance variables, although when the grouping for
discriminant analysis was based on the performance composite, it ranked
second (see Table 8)
.
Although resistance to planning was never ranked as the top
discriminator in the objective fulfillment runs, it was never ranked lower
than fourth. In five runs, it was ranked either second or third. Thus
resistance to planning appears to be a key discriminator for objective
fulfil lment
.
Use of techniques, functional coverage, and resources provided for
planning were ranked among the top three discriminators in three runs each.
Each ranked at the bottom in one run. While use of techniques was top ranked
in the runs for predicting future trends and short-term performance, it was
ranked last in the run for enhancing management development. Thus, the
contributions of techniques seem limited to the relatively more tangible
objectives. Functional coverage ranked second in the run for enhancing
21
management development and third in the runs for predicting future trends and
the objective composite. Why functional integration should contribute to
improved prediction of future trends is not clear, but that such integration
can lead to management development is intuitively tenable. Functional
emphasis and integration can result in the identification of key success
factors and in developing a general management perspective. Such integration
can also be expected to result in reduced conflict across functional
boundaries. Resources provided for planning was found to be an important
discriminator for the performance objectives and in stimulating a wide
variety of alternatives and their evaluation.
Attention to internal facets as well as attention to external facets
appear to be the least important discriminators as far as the objective
fulfillment variables are concerned. However, attention to external facets
ranked relatively high with reference to the performance objectives, while
the highest rankings for attention to internal facets were acnieved in the
runs for avoiding problem areas and evaluating alternatives.
Relative Performance - Results and Discussion
Resources provided for planning emerged as the key discriminator as far
as the relative performance runs were concerned. It ranked consistently as
the first or second factor. In contrast, use of techniques had consistently
low rankings in these runs. It ranked last in two runs, namely those for
earnings growth and return on investment, and in no run did it achieve a
ranking higher than 4. This finding lends support to recent criticisms of
the technique orientation in contemporary management (Peters & Waterman,
1981), and particularly to the attacks against popular planning techniques
such as PIMS and BCG (Kiechel, 1982; Wensley, 1982). Techniques have a role
to play in strategic planning, but the results of this study suggest that
22
effective planning requires more than the mere use of sophisticated
analytical techniques.
The consistent and relatively low ranking of resistance to planning in
the runs for relative competitive performance is also an interesting finding.
In early writings on planning, considerable emphasis was placed on the
resistance issue. It is tempting to speculate that such emphasis, while
appropiate in the early days of planning, is perhaps less critical today.
Today planning has increasingly been recognized and accepted as a line
manager's job (Business Week, 1984). The issue of introducing it to the
organization and securing the commitment of managers may have simply become
less crucial. This does not, however, minimize the need for managing
organizational resistance to planning.
Attention to external facets ranked at the top in the runs for earnings
growth and market share changes, and was third in the run for sales growth.
Thus, an external orientation appears to be important for effectiveness in
relative competitive performance. However, attention to external facets was
not a key discriminator for return on investment and the performance
composite.
Both attention to internal facets and functional coverage showed
considerable rank instability from run to run. The former's high ranking in
the run for sales growth is not easy to interpret, while the high ranking of
functional coverage in the run for return on investment is explainable as
being possibly due to the efficiences achieved by good functional
coordination.
23
A Synthesis
Considering all the thirteen runs together, both system capability and
resources provided for planning ranked at the top in four runs each. System
capability ranked as one of the three top discriminators in eight runs and
resources in nine. System capability ranked at the bottom in only two runs
and resources in only one. Thus, on an overall basis there is little doubt
that system capability and resources provided for planning are key dimensions
from the standpoint of planning system effectiveness construed in the
broadest sense.
Although it ranked at the top in only one run, resistance to planning
was never ranked at the bottom and was among the top three discriminators in
six of the runs. However, its discriminating influence was limited to the
runs involving objective fulfillment and satisfaction. In contrast,
functional coverage, which also ranked among the top three discriminators in
six runs, was found to be an important discriminator for three of the seven
objective fulfillment runs and three of the five relative performance runs.
We are therefore inclined to interpret functional coverage to be a more
important discriminator than resistance to planning on an overall basis.
IMPLICATIONS
The importance of the context of planning is underscored by the fact
that each of the three effectiveness criteria employed in this study appears
to be influenced significantly by at least one of the two contextual
dimensions. Both resources provided for planning and resistance to planning
were key discriminators for satisfaction as well as objective fulfillment,
whereas resources ranked consistently at the top for relative competitive
24
performance. Future studies should include additional contextual dimensions,
as compared to the two used in this study. Some possible candidates are
environmental volatility, leadership styles, planning system maturity, etc.
Among the design elements, system capability proved to be a powerful
discriminator for satisfaction and objective fulfillment, but proved less
important for relative performance (except for the performance composite).
In contrast, attention to external facets was an important discriminator for
relative performance, but not for objective fulfillment. Functional coverage
was an important discriminator for both objective fulfillment and relative
performance. These results suggest that the importance of the design
elements varies considerably depending on the effectiveness criterion used.
The implication of this conclusion for systems design is that efforts to
create a "supersystem" capable of achieving numerous purposes at the same
time is unlikely to be productive and that systems design should be tailored
to specific purposes of planning. Tradeoffs are inevitable if a planning
system is to meet multiple aims (King, 1983).
The implication of the overall importance of resources and functional
coverage is straight forward. Effective planning requires an infusion of
adequate resources to the planning effort. This in turn requires high levels
of involvement on the part of not only staff managers but also operating
managers and the chief executive officer. As for functional coverage a high
score along this dimension would result from uniformly high scores on all the
component items in this scale. This implies that functional integration and
a general management perspective are crucial for effective planning.
The finding that system capability emerged overall as the most important
discriminator raises important questions about the role of creativity and
control as key considerations in planning systems design. Some component
25
items of this dimension tapped a creativity orientation, while others tapped
a control orientation. While it is conventional to think of creativity and
control as opposed orientations, our data suggested that the two tend to go
together, as implied by Peters and Waterman (1981) in their discussion of
"simultaneous loose-tight properties" in the context of organizational
excellence. This was the reason why creativity and control aspects were
included within the same dimension. For the present, we suggest that
effective planning is achieved by a high degree of attention to both
creativity and control as opposed to trading the one off against the other.
This hypothesis is currently being subjected to further empirical analysis by
examining interactive models of the creativity and control subdimensions of
the system capability construct.
CONCLUSIONS
Most prior research on the effectiveness of planning systems has pursued
the implicit question, "Does planning pay?" In contrast, this study was
based on the premise that planniny is a multidimensional and
indistinguishable feature of the overall management process, and hence we
pursued the question, "What dimensions of planning are associated with
effectiveness, effectiveness being approached from multiple perspectives?"
The results of this study suggest that determinants of planning system
efTecti veness tend to vary depending on the specific effectiveness criterion
used. Nevertheless, on an overall basis, the key dimensions seem to be
system capability, resources provided for planning and functional coverage.
Every effort was made to use an appropriate methodology and to execute
it as rigorously as possible. However, a key limitation of this study is our
26
reliance on data from a single respondent in eacn firm. There is a
possibility that this may have introduced response or function bias in the
data and may raise questions about the general izabi 1 ity of our findings,
since organization level constructs such as those used here are probably best
measured using multiple respondents drawn from different functional and
hierarchical levels.
The following are some possible extensions of this study. One line of
inquiry would be to examine in detail the propositions suggested by the
results summarized in Table 8. A second extension would be to examine the
interrelationships among the planning system dimensions, instead of treating
them as separate entities as was done in this study. Third, the seven
systems dimensions can be considered jointly to develop Men empirically-
based taxonomies of planning systems and their effectiveness implications can
be further explored. Lastly, the relationships between the seven dimensions
and the three effectiveness criteria can be simultaneously analyzed using
approaches such as MANOVA and canonical correlation analysis (Ramanujam &
Venkatraman, iy«5).
We believe that research on planning systems is at a critical crossroad.
We hope this study will stimulate further efforts in new directions and lead
to an enhanced understanding of the role and value of planning systems in the
formulation and implementation of strategy.
27
REFERENCES
Aguilar, F. J. 1965. Scanning the business environment . New York: MacMillan.
Amara, R. C. 1981. The futures field: Searching for definitions and
boundaries. The Futurist , lb (1): 25-29.
Andrews, K. R. 1971. The concept of corporate strategy . Homewood, 111.:
Dow Jones-Irwin.
Ansoff, H. I. 1965. Corporate Strategy . New York: McGraw-Hill.
Ansoff, H. I. 1975. Managiny strategic surprise by response to weak
signals. California Management Review , 18 (2): 21-33.
Ansoff, H. I. 1984. Implanting strategic management , Englewood Cliffs, N.J.:
Prentice-Hal 1 .
Ansoff, H. I., Avener, J., Brandenburg, R. G., Portner, F. E., & Radosevich,
R. 1970. Does planning pay? The effect of planning on the success of
acquisitions in American firms. Long Range Planning , 3 (2): 2-7.
Antnony, R. N., & Dearden, J. 1976. Management control systems , Homewood,
III.: Ricnard D. Irwin.
Armstrong, J. S. 1982. Tne value of formal planning tor strategic decisions:
Review uf empirical research. Strategic Management Journal , 3: 197-211.
Bock, R. D. 1975. Multivariate statistical methods in behavioral research .
New York : McGraw-Hi 1 1
.
Business Week. 1984. The new breed of strategic planner. Business Week ,
September 17: 62.
Camillus, J. C. 1975. Evaluating the benefits of formal planning. Long
Range Planning , 8 (3): 33-4U.
Camillus, J. C, & Venkatraman, N. 1984. Dimensions of strategic choice,
Planning Review , 12(1): 26-31;46.
Dillon, W. R. 1979. The performance of the linear discriminant function in
nonoptimal situations and the estimation of classification error rates:
A review of recent findings. Journal of Marketing Research , 16: 370-381.
Eisenbeis, R. A. 1977. Pitfalls in the application of discriminant analysisin business, finance, and economics. The Journal of Finance , 32 (3):
875-90U.
Fahey, L., & King, W. R. 1977. Environmental scanning for corporateplanning. Business Horizons , 20(4): 61-71.
Frank, R. E., Massy, W. M., <4 Morrison, D. G. 1965. Bias in multiple
discriminant analysis. Journal of Marketing Research , 2: 250-258.
28
Fredrickson, J. W. 1984. The comprehensiveness of strategic decision
processes: Extensions, observations, future directions. Academy of
Management Journal , 27: 445-466.
Fulmer, R. M., & Rue, L. W. 1974. The practice and profitability of Long
Range Planning. Managerial Planning , 22 (6): 1-7.
Gaedeke, R. M., & Tootelian, D. H. 1976. The Fortune '500' list - An
endangered species for academic research. Journal of Business Research ,
4: 283-288.
Gluck, F., Kaufman, S., & Walleck, A. S. 1980. Strategic management for
competitive advantage. Harvard Business Review , 58 (4): 154-161.
Gluck, F., Kaufman, S., & Walleck, A. S. 1982. The four phases of strategic
management. Journal of Business Strategy , 2 (3): 9-21.
Grant, J. H., & King, W. R. 1979. Strategy formulation: analytical and
normative models. In D. £. Schendel & C. W. Hofer (Eds.), Strategic
management: A new view of business policy and planning . Boston:
Little, Brown.
Grant, J. H., & King, W. R. 1982. The logic of strategic planning . Boston:
Little, Brown & Company.
Grinyer, P. D., & Norburn, D. 1975. Planning for existing markets:
Perceptions of executives and financial performance. Journal of the
Royal Statistical Society , 138: 70-97.
Hax, A. C, & Majluf, N. S. 1984. Strategic management: An integrative
perspective . Englewood Cliffs, N.J.: Prentice-Hall.
Herold, L). M. 1972. Long range planning and organizational performance: A
cross validation study. Academy of Management Journal , lb: 91-104.
Hitt, M. A., Ireland, K. A. & Palia, K. A. 1982a. Industrial firms' grand
strategy and functional importance: Moderating effects of technology and
structure. Academy of Management Journal , 25: 265-2y8.
Hitt, M. A., Ireland, R. A., 6 Stadter, G. A. 1982b. Functional importance
and company performance: Moderating effects of grand strategy and
industry type. Strategic Management Journal , 3: 315-330.
Hofer, C. W., & Schendel, D. E. 1978. Strategy formulation: Analytical
concepts . St. Paul, MN: West Publishing Company.
Joy, 0. M., & Tollefson, J. 0. 1975. On the financial applications of
discriminant analysis. Journal of Financial and Quantitative Analysis ,
723-739.
Karger, D. W., & Malik, Z. A. 1975. Long range planning and organizational
performance. Long Range Planning , 8 (6): 60-69.
29
Keegan, w. J. 1974. Multinational scanning: A Study of information sourcesutilized by headquarters executives in multinational companies.Administrative Science Quarterly , 19: 411-421.
Ketalas, A., & Schoderbek, P. P. 1973. Scanning the business environment:Some empirical results. Decision Sciences , 4: 63-74.
Kiechel, W. 1982. Corporate strategists under fire. Fortune , December 27:
34.
King, W. R. 1983. Evaluating strategic planning systems. StrategicManagement Journal , 4: 263-277.
Kiny, W. R., & Cleland, D. I. 1978. Strategic planning and policy . NewYork: Van Nostrand Rheinhold.
Klecka, W. R. 197b. Discriminant Analysis. In Nie, N.H. et al (Eds.), SPSS:Statistical Package for the Social Sciences , New York: McGraw-Hill.
Kudla, R. J. 1980. The effects of strategic planning on common stockreturns. Academy of Management Journal , 23: b-2U.
Lindsay, W. M., & Rue, L. W. 1980. Impact of organization environment on the
lony range planning process: A contingency view. Academy of ManagementJournal , 23: 385-4U4.
Lorange, P. 1979. Formal planning systems: Their role in strategyimplementation. In Scnendel, U.E., & C.W. Hofer (Eds.), Strategicmanagement: A new view of business policy and planning . Boston: LittleBrown d Company.
Lorange, P. 1980. Corporate planning: An executive viewpoint . EnglewoodCliffs, N.J.: Prentice-Hal I
.
Lorange, P., & Vanci I , R. F. 1977. Strategic planning systems . EnglewoodCliffs, N.J.: Prentice-Hal I
.
Lucas, H. C. 1978. Empirical evidence for a descriptive model of
implementation. MIS Quarterly . 2(2): 27-41.
Malik, Z. A., & Karger, D. W. 1975. Does long range planning improve companyperformance? Management Review , 64 (9): 26-31.
Mintzberg, H. 1981. What is planning anyway? Strategic Management Journal ,
2: 319-324.
Morrison, D. M. 1969. On the interpretation of discriminant analysis.Journal of Marketing Research , b: 156-163.
Mosteller, F., & Wallace, D. F. 1963. Inference in an authorship problem.Journal of the American Statistical Association , 27b-309.
Nunnally, J.C. 1978. Psychometric Theory. New York: McGraw-Hill.
30
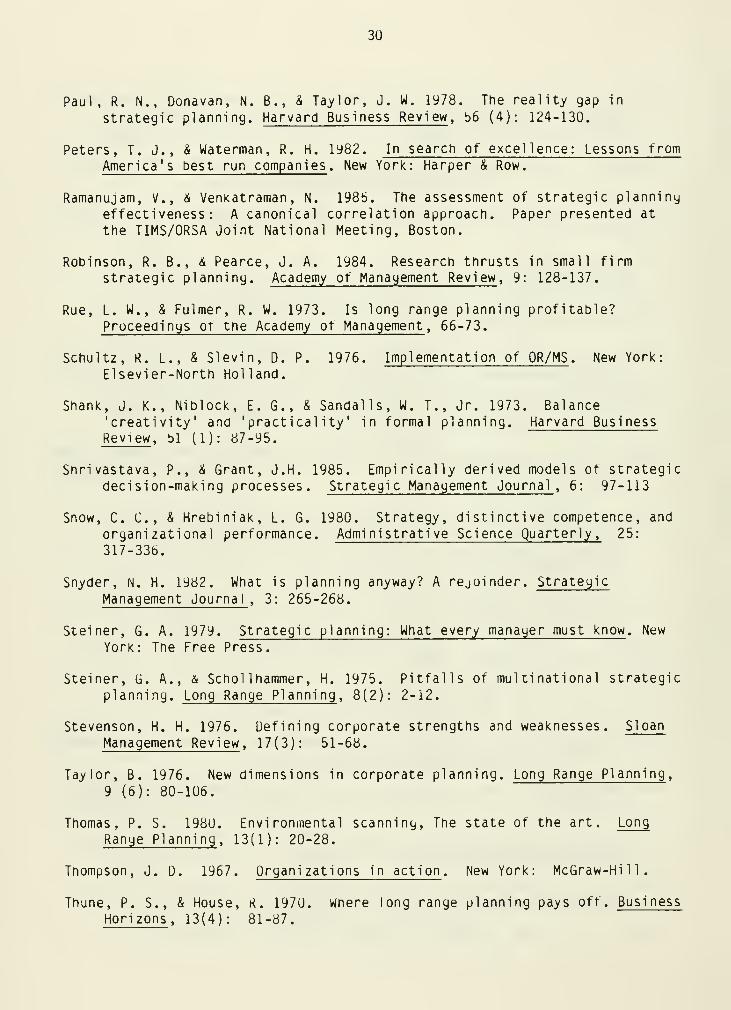
Paul, R. N., Donavan, N. 8., & Taylor, J. W. 1978. The reality gap in
strategic planning. Harvard Business Review , b6 (4): 124-130.
Peters, T. J., & Waterman, R. H. 1982. In search of excellence: Lessons from
America's best run companies . New York: Harper & Row.
Ramanujam, V., & Venkatraman, N. 198b. The assessment of strategic planning
effectiveness: A canonical correlation approach. Paper presented at
the TIMS/ORSA Joint National Meeting, Boston.
Robinson, R. B., <4 Pearce, J. A. 1984. Research thrusts in small firmstrategic planning. Academy of Management Review , 9: 128-137.
Rue, L. W., & Fulmer, R. W. 1973. Is long range planning profitable?Proceedings of the Academy of Management , 66-73.
Schultz, R. L., & Slevin, D. P. 1976. Implementation of OR/MS . New York:
Elsevier-North Holland.
Shank, J. K., Niblock, E. G., & Sandalls, W. T., Jr. 1973. Balance'creativity' and 'practicality' in formal planning. Harvard BusinessReview , bl (1): 87-95.
Shrivastava, P., & Grant, J.H. 1985. Empirically derived models of strategicdecision-making processes. Strategic Management Journal , 6: 97-113
Snow, C. C, & Hrebiniak, L. G. 1980. Strategy, distinctive competence, and
organizational performance. Administrative Science Quarterly, 25:
317-336.
Snyder, N. H. 1982. What is planning anyway? A rejoinder. Strategic
Management Journal , 3: 265-268.
Steiner, G. A. 1979. Strategic planning: What every manager must know . New
York: The Free Press.
Steiner, G. A., & Schol lhammer, H. 1975. Pitfalls of multinational strategic
planning. Long Range Planning, 8(2): 2-12.
Stevenson, H. H. 1976. Defining corporate strengths and weaknesses. Sloan
Management Review , 17(3): 51-68.
Taylor, B. 1976. New dimensions in corporate planning. Long Range Planning,
9 (6): 80-106.
Thomas, P. S. 1980. Environmental scanning, The state of the art. Long
Range Planning, 13(1): 20-28.
Thompson, J. D. 1967. Organizations in action . New York: McGraw-Hill.
Thune, P. S., & House, R. 1970. Where long range planning pays off. Business
Horizons, 13(4): 81-87.

31
Venkatraman , N., & Grant, J. H. 1986. Construct measurement in
organizational strategy research: A critique and proposal. Academy ofManagement Review
, 11: Forthcoming.
Wensley, R. 1982. PIMS and BCG: New horizons or false dawn? StrategicManagement Journal , 3: 147-158.
Wood, D. R., St LaForge, R. w. 1979. The impact of comprehensive planning onfinancial performance. Academy of Management Journal, 22: 516-526.

32
Dimension
Desiyn Elements
System capabi I i ty
Table 1
Dimensions of a Planning System
Description
The ability of the formal planning system tobalance creativity and control; the adaptivecapability of the system and its flexibility tosupport strategy formulation and implementation
Key SupportingLiterature
Ansoff (1975; 1Y84)Anthony £ Dearden (1976)Camillus (197b)Lorange & Vancil (1977)King & Cleland (1978)Thompson (1967)
Use of
techniquesThe degree of emphasis given to the use ofplanning techniques to structure theunstructuredness of ill-defined, messystrategic problems
Grant & King (1979, 1982)Hofer & Schendel (1978)Hax & Majluf (1984)
Attention tointernal facets
The degree of attention to internal (i.e.,organizational) factors, past performance, andanalysis of strengths and weaknesses
Camillus & VenkatramanGrant & King (1982)King & Cleland (1978)Lorange & Vancil (1977)Stevenson (1976)
(1984
Attention toexternal Facets
The level of emphasis given to monitoringenvironmental trends
Aguilar (1965)Fahey & King (1977)Keegan (1974)Kefalas & Schoderbek (1973)Thomas (1980)
Functional
coverageThe extent of coverage given to differentfunctional areas with a view to integratedifferent functional requirements into a
general management perspective.
Hitt , Ireland &
Hitt, Ireland &
Lorange (1980)Snow & Hrebiniak (1980)
Palia (1982)Stadter (198
Irganizational Context of Planning
Resources providedfor planning
The degree of organizational support in theform of number of planners, involvement of
top management in planning, etc.
King & Cleland (1978;
Steiner (1979)
Resistance to
planni ngThe need to anticipate and overcome resistanceto planning and to create a favorable climatefor effective planning.
Steiner (1979)Steiner & Schollhammer (1975Schultz & Slevin (1976)
33
Table 2
Characteristics of Sample Companies and Respondents'
1. Sales of the Responding Unit
Less than $250 million
$251 million - $ 1 billionOver $ 1 bi 11 ion
Full Sample(n=207)
17.4
21.860.
y
2. Primary Business Category of the Responding Unit
Consumer goods 19.2
Capital goods 18.7
Raw or semi-finished materials 12.8
Components for finished goods 8.9
Service sector 40.4
3. Organizational Level of Responding Unit
Corporate 81.5
Business unit 18.5
4. Title/Job Responsibility of Responding Executive
Planning 68.5
Other line function 31.5
b. Maturity of the Planning System (Year planning began)
Before 1960During 1961-1975After 1976
6.2
36.755.2
Sample used .
in this study(n-93)
24.4
21.154.4
13.0
20.710.912.0
43.5
80.4
19.6
67.033.0
5.9
37.656. b
aAl 1 figures are percentages. Non responses have been excluded.
A reduced sample was used for analysis in this study because of
missing data problems. Based on chi-square tests, the reduced
sample is not statistically different with respect to any of the
five company and respondent characteristics summarized in this
table, except sales categories.

34
Table 3Means, Standard Ueviations, Reliabilities, and Intercorrelations
ot the Seven Planning System Dimensions
Dimension
1. System capabi lity
2. Use of techniques
3. Attention to internal facets
4. Attention to external facets
5. Functional coverage
6. Resources provided for planning
7. Resistance to planning 1.66 0.61 -69 -43 -28 -41 -33 -70 (70)
All values are based on the sample of 93 firms used in the discriminant analysis runs. Decimal points areomitted for reliabilities and correlations. Reliabilities are shown within parentheses. All correlations aresignificant at p<.05.
The reliability for this dimension for the full sample (n=207) was 0.77. Although there were differences forthe other dimensions as well, they were less stark.
Mean
35
Table 4
Means, Standard Deviations, and Interrelations of theneanb,
cf tprti veness Variables
6 7 8
Variable
1. Predicting future 93 3.33 0.86
Effectiveness Variables
n Mean s.d. 1
trends
2. Evaluatingalternatives
3. Avoiding problem
areas
4. Enhancing management
development
93 3.76 0.72 35
93 3.45 0.83 41 59
92 3.26 0.91 69 43 41
q-i T 46 0.84 38 34 26 37
b. Improving short-term 93 J. 4b u.oh
performance
92 3.67 0.76 40 54 41 50 31
6. Improving long-term
performance
7 . Objective composite5
91 3.48 0.59
8. Sales growth
9. Earnings growth
72 70 80 63 72
87 3.61 0.99 29 11* 14* 26 32 23 35
86 3.58 1.18 14* 01* 13* 12* 41 13* 25 60
10 11 12 13
349 95 26 09* 04* 26 36 26 32 69 54
10. Market share changes 86 3.49 U.95
86 3 40 1.17 16* -06* 03* 15* 35 09* 19 52 79 51
11. Return on investment 85 3.40
c uc ,„ „.90 20 03* 09* 22 45 19 32 82 89
31 33 16* 21 2912 Performance composite 85 3.51 0.90
93 3 41 0.99 28 37 32 32 38 29 45
13. Satisfaction with 9J i -'* i
the planning system
.,„ „,„,«,«,» ,—„ *«. - -«->— - •""" °"es "" s ""' " '
'
bThe reliability of this composite was 0.82.
cThe reliability of this composite was 0.86.
36
Table 5
Discriminant Analysis Results for Grouping Based on Satisfaction
1. Group sizes:
Number of "dissatisfied" planners (Group 1) : 42
Number of "satisfied" planners (Group 2) : 51
2. Significance level of the linear :
***
discriminant function
3. Assumption of equality of group : Not valid
dispersion matrices (p for Box's M) (***)
4. Classification accuracy, %
Group 1 : 78.6
Group 2 : 84.3
Overall : 81.7
5. Accuracy of chance model based on sample
group probabilities, % : 50.5
6. Standardized discriminant function coetficents.
System capability : -0.33
Use of techniques : -0.07
Attention to internal facets : u.05
Attention to external facets : U.50
Functional coverage : -0.17
Resources provided for planning : -0.23
Resistance to planning : 0.71
a The failure of Box's M test for equality of group dispersion matrices suggests
that quadratic classification procedures are more appropriate. However, the
use of a quadratic clarification rule did not lead to a noticeable change in
classification accuracies.
**•p<.0l
37
Table 6
Discriminant Analysis Results for Groupings Based onObjective Fulfilment Variables
Objective fulfillment measure
1. Group Sizes
Group 1: Entirelyunfulfilled. Somewhatunfulfilled, or neutral
Group 2: Somewhatful fi 1 led or enti rely
fulfilled
2. Significance level
of the 1 inear
discriminant function
3. Assumption of equal
group dispersionmatrices (p for Box's M)
4. Classification accuracy, %
linear classification rule
Group 1
Group 2
Overall
5. Accuracy of chancemode) based on samplegroup prior probabilities, X
6. Standardized discriminantfunction coefficents
System capabi 1 ity
Use of techniques
Attention to internal facets
Attention to external facets
Functional coverage
Resources provided forplanning
Resistance to planning
Predictingfuturetrends
42
51
64.3
68.6
66.7
50.5
Evaluating Avoidingalternatives problem
areas
Enhancing Improving Improvingmanagement snort-term long-termdevelopment performance performance
22
71
43
50
48 46
47
30
62
Objectivecomposite
46
45
Not valid
38
Table 7
Discriminant Analysis Results tor Groupings Based on
Performance Relative to tne Competition
Performance measure
Sales
39
Effectiveness Measure
Systemcapabil ity
Objective Fulfillment Variables
Predicting future trends
Evaluating alternatives
Avoiding problem areas
Ennancing managementdevelopment
Improving short-termperformance
Improving long-termperformance
Objective composite
Kelative Performance Variables
Sales growth
Earnings growth
Market share changes
Return on investment
Table 8Relative Importance Rankings of the Planning System
Dimensions in the 13 Discriminant Analysis Runs
Dimension
Dse of Attention to Attention to Functionaltechniques internal facets external facets coverage
Resources Resistance toprovided for planningplanning
Performance composite
Satisfaction Variable
Satisfaction with theplanning system
40
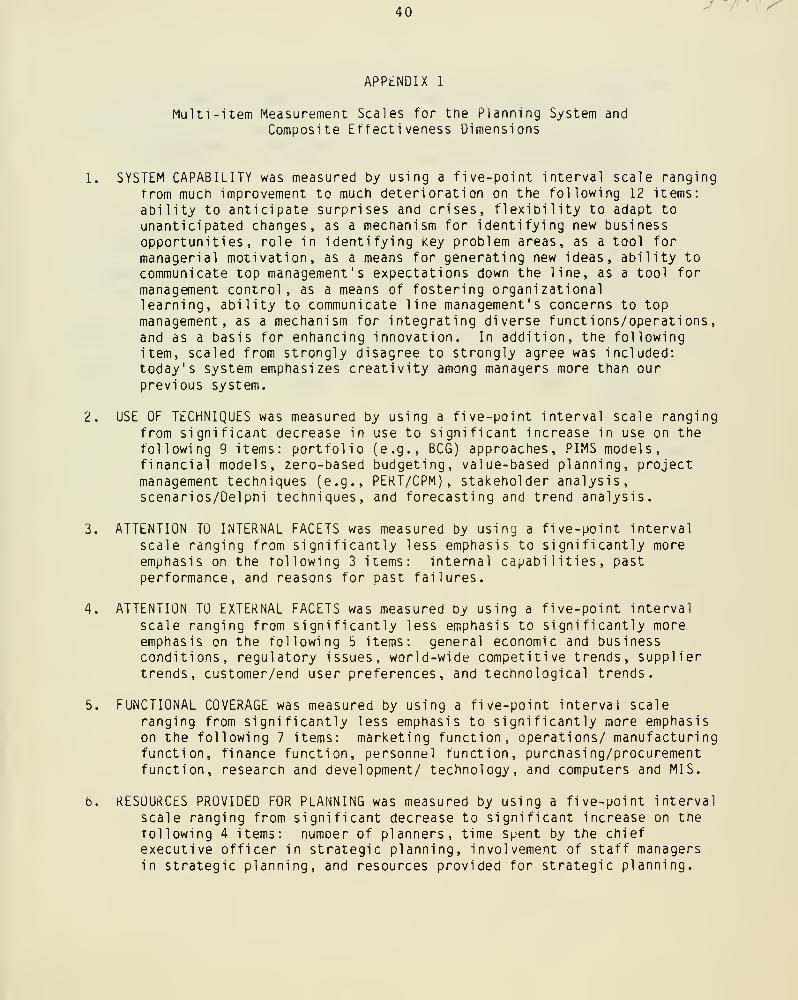
APPENDIX 1
Multi-item Measurement Scales for the Planning System and
Composite Effectiveness Dimensions
1. SYSTEM CAPABILITY was measured by using a five-point interval scale ranging
from much improvement to much deterioration on the following 12 items:
ability to anticipate surprises and crises, flexibility to adapt to
unanticipated changes, as a mechanism for identifying new businessopportunities, role in identifying key problem areas, as a tool for
managerial motivation, as a means for generating new ideas, ability tocommunicate top management's expectations down the line, as a tool for
management control, as a means of fostering organizationallearning, ability to communicate line management's concerns to topmanagement, as a mechanism for integrating diverse functions/operations,and as a basis for enhancing innovation. In addition, the followingitem, scaled from strongly disagree to strongly agree was included:today's system emphasizes creativity among managers more than ourprevious system.
2. USE OF TECHNIQUES was measured by using a five-point interval scale rangingfrom significant decrease in use to significant increase in use on the
following 9 items: portfolio (e.g., BCG) approaches, PIMS models,financial models, zero-based budgeting, value-based planning, projectmanagement techniques (e.g., PEKT/CPM), stakeholder analysis,scenarios/Delphi techniques, and forecasting and trend analysis.
3. ATTENTION TO INTERNAL FACETS was measured by using a five-point interval
scale ranging from significantly less emphasis to significantly moreemphasis on the following 3 items: internal capabilities, pastperformance, and reasons for past failures.
4. ATTENTION TO EXTERNAL FACETS was measured by using a five-point interval
scale ranging from significantly less emphasis to significantly moreemphasis on the following 5 items: general economic and businessconditions, regulatory issues, world-wide competitive trends, suppliertrends, customer/end user preferences, and technological trends.
5. FUNCTIONAL COVERAGE was measured by using a five-point interval scale
ranging from significantly less emphasis to significantly more emphasison the following 7 items: marketing function, operations/ manufacturingfunction, finance function, personnel function, purchasing/procurementfunction, research and development/ technology, and computers and MIS.
6. RESOURCES PROVIDED FOR PLANNING was measured by using a five-point interval
scale ranging from significant decrease to significant increase on the
following 4 items: number of planners, time spent by the chiefexecutive officer in strategic planning, involvement of staff managersin strategic planning, and resources provided for strategic planning.
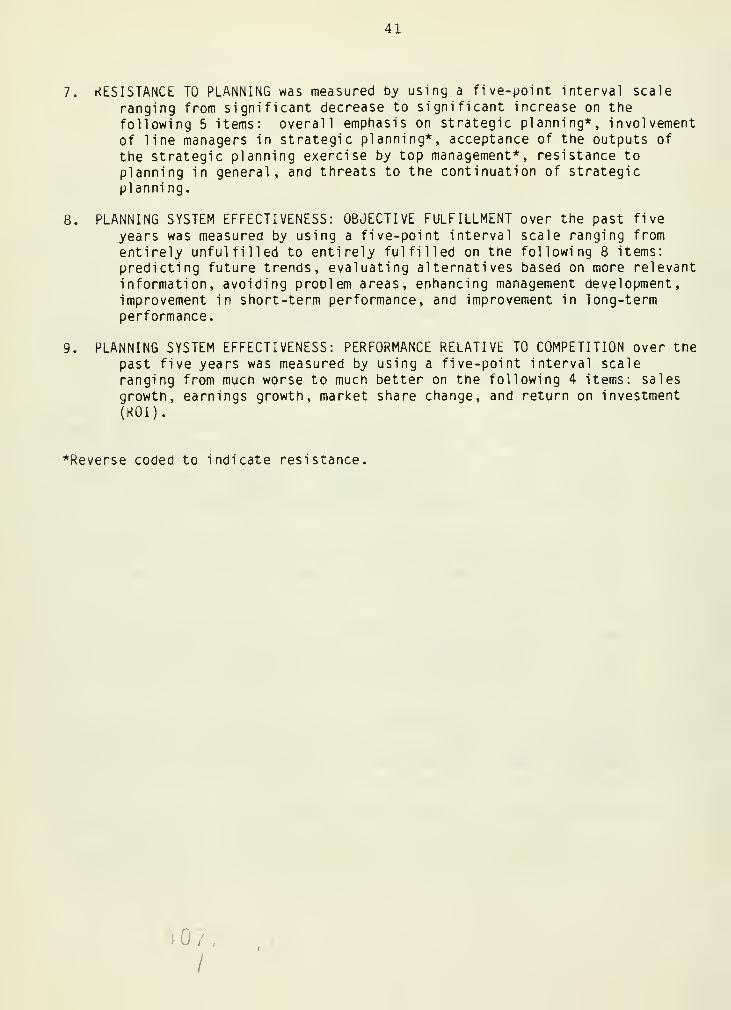
41
7. RESISTANCE TO PLANNING was measured by using a five-point interval scale
ranging from significant decrease to significant increase on the
following 5 items: overall emphasis on strategic planning*, involvement
of line managers in strategic planning*, acceptance of the outputs of
the strategic planning exercise by top management*, resistance to
planning in general, and threats to the continuation of strategicplanni ng.
8. PLANNING SYSTEM EFFECTIVENESS: OBJECTIVE FULFILLMENT over the past five
years was measured by using a five-point interval scale ranging from
entirely unfulfilled to entirely fulfilled on the following 8 items:
predicting future trends, evaluating alternatives based on more relevant
information, avoiding problem areas, enhancing management development,improvement in short-term performance, and improvement in long-termperformance.
9. PLANNING SYSTEM EFFECTIVENESS: PERFORMANCE RELATIVE TO COMPETITION over the
past five years was measured by using a five-point interval scaleranging from much worse to much better on the following 4 items: sales
growth, earnings growth, market share change, and return on investment(KOI).
*Reverse coded to indicate resistance.


MIT LIBRARIES
3 ^60 007EB710 4


![Ranking Decision making units using Fuzzy Multi-Objective ......Multi-objective Linear Programming (MOLP) Veeramani et al. [23] Multi-objective Linear Programming (MOLP) Problems is](https://img.pdfslide.us/doc/110x75/610e91b630eca77d674f86aa/ranking-decision-making-units-using-fuzzy-multi-objective-multi-objective.jpg)

![Research on Key Problems of Multi-objective …...suitable for solving multi-objective optimization problems, and from the birth of the multi-objective evolutionary algorithm [4]](https://img.pdfslide.us/doc/110x75/5fdea634eea5627aa25b2fca/research-on-key-problems-of-multi-objective-suitable-for-solving-multi-objective.jpg)