Embed Size (px)
Citation preview

1
Multi-Muscle FES Force Control of the HumanArm for Arbitrary Goals
Eric M. Schearer,Student Member, IEEE,Yu-Wei Liao, Student Member, IEEE,Eric J. Perreault,Member, IEEE,Matthew C. Tresch,Member, IEEE,William D. Memberg, Robert F. Kirsch,Member, IEEE,
and Kevin M. Lynch,Fellow, IEEE
Abstract—We present a method for controlling a neuropros-thesis for a paralyzed human arm using functional electricalstimulation (FES) and characterize the errors of the controller.The subject has surgically implanted electrodes for stimulatingmuscles in her shoulder and arm. Using input/output data, amodel mapping muscle stimulations to isometric endpoint forcesmeasured at the subject’s hand was identified. We inverted themodel of this redundant and coupled multiple-input multiple-output system by minimizing muscle activations and used thisinverse for feedforward control. The magnitude of the totalRMS error over a grid in the volume of achievable isometricendpoint force targets was 11% of the total range of achievableforces. Major sources of error were random error due to trial-to-trial variability and model bias due to nonstationary systemproperties. Because the muscles working collectively are theactuators of the skeletal system, the quantification of errors inforce control guides designs of motion controllers for multi-joint,multi-muscle FES systems that can achieve arbitrary goals.
I. I NTRODUCTION
FUNCTIONAL electrical stimulation (FES) is a method torestore lost function to persons with paralysis. Although
FES has had success in some applications [1–3], there remainmany challenges. Among these challenges is exploiting the fullcapability of the musculoskeletal system to perform a widerange of tasks. Complex movements such as reaching requirethe coordination of multiple muscles acting across multiplejoints of the skeletal system.
Although controlling multiple muscles with FES potentiallyprovides flexible motor control, that potential has not yet beenfully realized. FES applications requiring multiple muscleshave generally used fixed muscle activation patterns. Forinstance, the FreehandSystem R© [4] provides users control oftheir hand but does so by having only a few stereotyped move-ments. FES controllers for walking [5] and cycling [6] also
This work was supported by NSF grant 0932263, NIH NINDS grantN01-NS-5-2365, and NSF Graduate Fellowship DGE-0824162.
E. M. Schearer and Y. Liao are with the Department of MechanicalEngineering, Northwestern University, Evanston, IL USA
E. J. Perreault and M. C. Tresch are with the Department of BiomedicalEngineering and Department of Physical Medicine and Rehabilitation, North-western University, Evanston, IL USA
W. D. Memberg is with the Department of Biomedical Engineering, CaseWestern Reserve University, Cleveland, OH USA
R. F. Kirsch is with the Department of Biomedical Engineering, CaseWestern Reserve University, Louis Stokes Veterans AffairsMedical Center,and the Department of Orthopedics, MetroHealth Medical Center Cleveland,OH USA
K. M. Lynch is with the Department of Mechanical Engineeringandthe Northwestern Institute on Complex Systems, Northwestern University,Evanston, IL USA
use stereotyped movements. While controllers for stereotypedmovements have restored some function, there is clearly a needfor flexible control strategies that can achieve any arbitrarygoal subject to the constraints of the musculoskeletal system.
There are many challenges to address when designingsuch a flexible FES controller with multiple muscles. First,unlike typical serial-chain robotic manipulators, the controlof different degrees of freedom is not decoupled in humanlimbs: muscles usually act across multiple degrees of freedom.Further, with a large number of muscles needed for flexiblecontrol, there are many redundant ways to achieve a giventask. Finally, with an increasing number of stimulated muscles,there is a potential increase in the nonlinear interactionsbetween muscles due to current spillover and connective tissueinteractions between nearby muscles [7, 8]. The goal of thepresent study is to design and evaluate a feedforward FEScontroller for the production of flexible motor outputs thataddresses these potential challenges.
Previous studies have designed flexible FES controllers withmultiple muscles in order to produce limb movements [9, 10].They use an optimization of effort or power consumptionto specify muscle activations as has been suggested in hu-man motor control literature [11]. While these studies areimportant in achieving the ultimate aim of restoring flexiblemotions via FES, they offer only superficial understanding ofthe many sources of error in multiple-muscle FES control.Limb movements resulting from FES depend on the complexnonlinear dynamics of the musculoskeletal system. Becauseofthis complexity, it is difficult to evaluate the contribution ofdifferent sources of error to FES performance when measuringlimb movements.
In the present study, we evaluate the performance of aflexible FES controller using multiple muscles to produceisometric forces. This is an important preliminary step inachieving flexible motion control. Since measuring isometricforces avoids contributions of complex limb dynamics toevoked motor outputs, we can readily evaluate the contributionof different sources of error to FES performance. Anotherstudy [12] investigates isometric force control of the thumb,but does not thoroughly investigate the various sources of errorof the controller.
In particular, the goals of this study are to quantify thetotal error in multi-muscle force control, quantify the relativecontributions of random error due to trial-to-trial variabilityand of model bias to the total error, and to quantify thecontributions of different sources of model bias in multi-
This is the author’s version of an article that has been published in this journal. Changes were made to this version by the publisher prior to publication.The final version of record is available athttp://dx.doi.org/10.1109/TNSRE.2013.2282903
Copyright (c) 2014 IEEE. Personal use is permitted. For any other purposes, permission must be obtained from the IEEE by emailing [email protected].
2
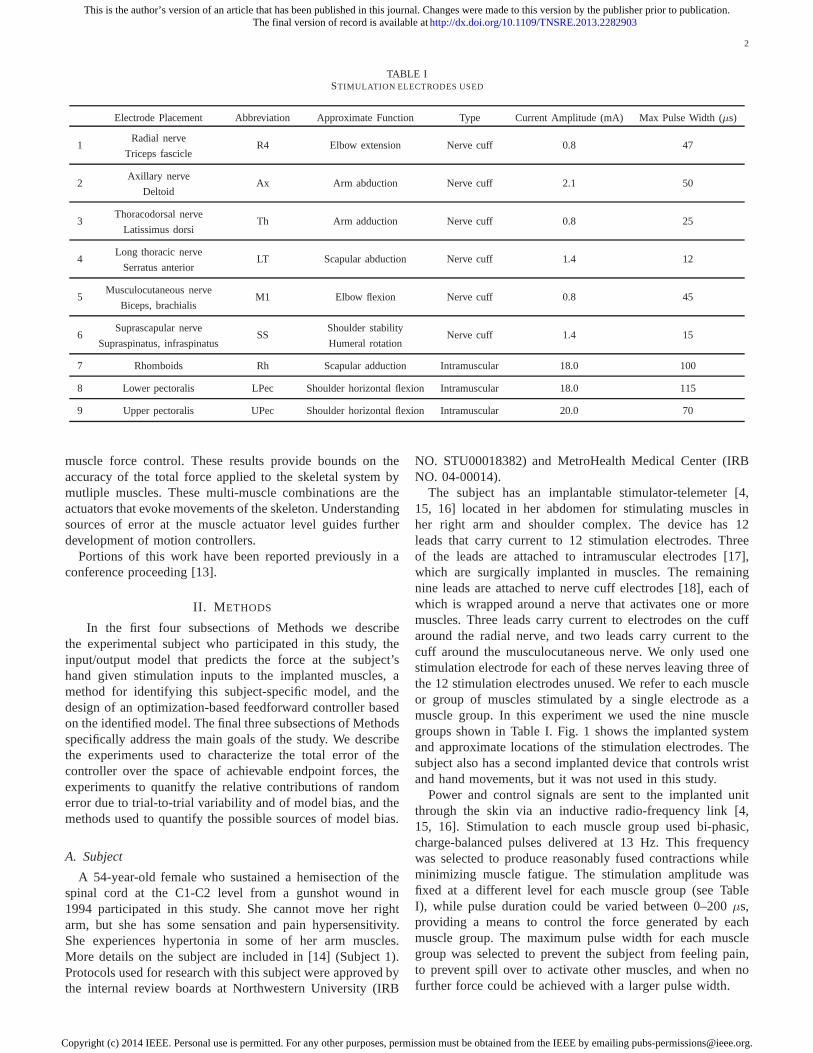
TABLE ISTIMULATION ELECTRODES USED
Electrode Placement Abbreviation Approximate Function Type Current Amplitude (mA) Max Pulse Width (µs)
1Radial nerve
R4 Elbow extension Nerve cuff 0.8 47Triceps fascicle
2Axillary nerve
Ax Arm abduction Nerve cuff 2.1 50Deltoid
3Thoracodorsal nerve
Th Arm adduction Nerve cuff 0.8 25Latissimus dorsi
4Long thoracic nerve
LT Scapular abduction Nerve cuff 1.4 12Serratus anterior
5Musculocutaneous nerve
M1 Elbow flexion Nerve cuff 0.8 45Biceps, brachialis
6Suprascapular nerve
SSShoulder stability
Nerve cuff 1.4 15Supraspinatus, infraspinatus Humeral rotation
7 Rhomboids Rh Scapular adduction Intramuscular 18.0 100
8 Lower pectoralis LPec Shoulder horizontal flexion Intramuscular 18.0 115
9 Upper pectoralis UPec Shoulder horizontal flexion Intramuscular 20.0 70
muscle force control. These results provide bounds on theaccuracy of the total force applied to the skeletal system bymutliple muscles. These multi-muscle combinations are theactuators that evoke movements of the skeleton. Understandingsources of error at the muscle actuator level guides furtherdevelopment of motion controllers.
Portions of this work have been reported previously in aconference proceeding [13].
II. M ETHODS
In the first four subsections of Methods we describethe experimental subject who participated in this study, theinput/output model that predicts the force at the subject’shand given stimulation inputs to the implanted muscles, amethod for identifying this subject-specific model, and thedesign of an optimization-based feedforward controller basedon the identified model. The final three subsections of Methodsspecifically address the main goals of the study. We describethe experiments used to characterize the total error of thecontroller over the space of achievable endpoint forces, theexperiments to quanitfy the relative contributions of randomerror due to trial-to-trial variability and of model bias, and themethods used to quantify the possible sources of model bias.
A. Subject
A 54-year-old female who sustained a hemisection of thespinal cord at the C1-C2 level from a gunshot wound in1994 participated in this study. She cannot move her rightarm, but she has some sensation and pain hypersensitivity.She experiences hypertonia in some of her arm muscles.More details on the subject are included in [14] (Subject 1).Protocols used for research with this subject were approvedbythe internal review boards at Northwestern University (IRB
NO. STU00018382) and MetroHealth Medical Center (IRBNO. 04-00014).
The subject has an implantable stimulator-telemeter [4,15, 16] located in her abdomen for stimulating muscles inher right arm and shoulder complex. The device has 12leads that carry current to 12 stimulation electrodes. Threeof the leads are attached to intramuscular electrodes [17],which are surgically implanted in muscles. The remainingnine leads are attached to nerve cuff electrodes [18], each ofwhich is wrapped around a nerve that activates one or moremuscles. Three leads carry current to electrodes on the cuffaround the radial nerve, and two leads carry current to thecuff around the musculocutaneous nerve. We only used onestimulation electrode for each of these nerves leaving three ofthe 12 stimulation electrodes unused. We refer to each muscleor group of muscles stimulated by a single electrode as amuscle group. In this experiment we used the nine musclegroups shown in Table I. Fig. 1 shows the implanted systemand approximate locations of the stimulation electrodes. Thesubject also has a second implanted device that controls wristand hand movements, but it was not used in this study.
Power and control signals are sent to the implanted unitthrough the skin via an inductive radio-frequency link [4,15, 16]. Stimulation to each muscle group used bi-phasic,charge-balanced pulses delivered at 13 Hz. This frequencywas selected to produce reasonably fused contractions whileminimizing muscle fatigue. The stimulation amplitude wasfixed at a different level for each muscle group (see TableI), while pulse duration could be varied between 0–200µs,providing a means to control the force generated by eachmuscle group. The maximum pulse width for each musclegroup was selected to prevent the subject from feeling pain,to prevent spill over to activate other muscles, and when nofurther force could be achieved with a larger pulse width.
This is the author’s version of an article that has been published in this journal. Changes were made to this version by the publisher prior to publication.The final version of record is available athttp://dx.doi.org/10.1109/TNSRE.2013.2282903
Copyright (c) 2014 IEEE. Personal use is permitted. For any other purposes, permission must be obtained from the IEEE by emailing [email protected].

3
Fig. 1. The implanted stimulator-telemeter device with the12 stimulationelectrodes. A single wire is shown leading to the radial nerve which has threeelectrodes, and a single wire is shown leading to the musculocutaneous nerve,which has two electrodes, so only nine electrodes are visable in this figure. Allother electrodes are single-channel inputs. Nerve-cuff electrodes are markedwith green rectangles and green wires and intramuscular electrodes are markedwith red arrows and red wires.
B. Modeling Approach
Our model predicts the three-dimensional steady-state forceoutput measured at the hand, which we refer to as the endpointforce, given a set of stimulation inputs to each muscle group.The stimulation input to each muscle group is the pulse widthof the initial phase of the bi-phasic charge-balanced pulse. Thismodel was used to estimate the set of all achievable endpointforces and, through inversion, to determine the stimulationinputs required to achieve a desired endpoint force.
During isometric conditions, there is a linear mappingbetween muscle force and endpoint force. In contrast, thestimulation-force properties of muscles are nonlinear. Combin-ing these effects, we used a nonlinear mapping (1) to describethe relationship between muscle stimulation inputsu ∈ R
9
and the endpoint forcef = [fx, fy, fz]T,
f = A(q)g(u,q), (1)
where the directions of the three components off are shownby the right-handed frame in Fig. 2. The arm configurationq ∈ R
5 is the vector of three shoulder joint angles and two el-bow angles. The configuration-dependent linear transformationfrom muscle forces to endpoint forcesA(q) ∈ R
3×9 accountsfor the kinematic Jacobian of the arm and the moment arms ofthe muscle groups about the joints. The columns ofA representthe contributions of the individual muscle groups to each ofthethree components of endpoint force at 100% stimulation. Thenonlinear mappingg(u,q) ∈ R
9 from each of the stimulationinputs to each of the muscle forces is
g(u,q) = [g1(u1,q), g2(u2,q), . . . , g9(u9,q)]T, (2)
wheregj(uj ,q) is the mapping from thej th stimulation inputto thej th muscle force. We refer to this mapping as the musclerecruitment curve. In general,f , A, andg all depend on theconfiguration of the armq, but for these isometric experimentsconducted at a single configuration we drop the dependenceon q and write
f = Ag(u). (3)
Fig. 2. Experimental setup and coordinate frame.
Note that (3) does not include dynamics as we studied onlysteady-state endpoint forces, ignoring transients. Equation (3)is time-invariant as we have taken care in the experiments toprevent time-varying fatigue from playing a role.
We cannot directly measure the forces that the musclesexert on the skeleton, so we use a proxy in definingg(u).We definefj ∈ R as the magnitude of the endpoint forcewhen thej th input is stimulated. If the mapping from muscleforces to endpoint force is linear, and we only stimulate onemuscle group, then the direction of the endpoint force is nearlyconstant for different stimulation levels, and the magnitudeof the endpoint force is proportional to muscle force. Inpreliminary trials, we verified that the force direction remainedapproximately constant when increasing the stimulation level.Since wecan measure the magnitude of the endpoint forcewhen stimulating the muscle groups individually, we use theendpoint force magnitude in our model instead of the forceexerted on the skeleton by the muscle group.
The relationship between each stimulation input and thecorresponding magnitude of the endpoint force outputfjis nonlinear. We chose a sigmoid function to model thisrelationship because it is nonlinear and monotonic,
fj =aj
1 + ebj(cj−uj)−
aj
1 + ebjcj, (4)
where for thej th muscle group,aj ∈ R is the maximum outputof the sigmoid function,bj ∈ R is proportional to the slopeof the sigmoid function at 50% of the maximum output, andcj ∈ R is the input at which the sigmoid function outputs50% of its maximum output. The second term on the right-hand side forces the output to be zero when the input is zero.We then normalizefj by the endpoint force magnitude whenthe maximum stimulation pulse width is applied. Equation (3)uses this normalized value forgj(uj). We normalize so thateachgj(uj) ∈ [0, 1] and represents muscle activation.
Next we exlain how to identifyaj , bj , and cj for eachmuscle group andA for the arm configuration tested.
C. Model Identification Experiments
The model identification experiments took place on Day 1 oftwo days of testing. The subject’s right forearm was strappedinto a cast rigidly attached to a force sensor (JR3 Model
This is the author’s version of an article that has been published in this journal. Changes were made to this version by the publisher prior to publication.The final version of record is available athttp://dx.doi.org/10.1109/TNSRE.2013.2282903
Copyright (c) 2014 IEEE. Personal use is permitted. For any other purposes, permission must be obtained from the IEEE by emailing [email protected].

4
0 0.5 10
0.25
0.5040%
0.75
10%
1.00
time (s)
no
rma
lize
d f
orc
e m
agn
itu
de
20%
30%
50%
60%
70%
80%
90%
100%
stimulation begins
stimulation ends
recorded force = average force over 2nd half of stimulation
(a)
0 20 40 60 80 1000
5
10
15
20
stimulation level (%)
forc
e m
agn
itu
de
(N
)
Data
MLE Fit
(b)
Fig. 3. Example of raw data collected (a) from stimulation ofthe radial nerve, which causes elbow extension, to derive anisometric force recruitment curve(b): In (a) the muscle group is stimulated at increasing stimulation levels. Stimulation starts at 0 s and ends at 1 s. The average force over the last half secondfor each stimulation level is plotted against the stimulation level in (b), and a sigmoid curve is fit to the data points. Note that (a) shows only active forcesdue to stimulation of the muscle group. It does not include passive effects such as gravity or muscle stiffness.
67M25A3-I40) as shown in Fig. 2. The subject’s arm wasat approximately 45 degrees of shoulder elevation measuredin a vertical plane rotated by 70 degrees from the coronalplane, 55 degrees of shoulder internal rotation, 90 degreesof elbow flexion, and zero forearm pronation/supination. Wechose this configuration (q in (1)) because it is useful ineveryday tasks and a configuration for which we expectedthe arm to exert significant endpoint forces in each of themeasurement directions.
To identify the model described by (3) and (4) we used amethod similar to the steady-state step response method [19].We stimulated each muscle group at discrete stimulation pulsewidths and recorded the resulting steady-state endpoint force.We used a fixed transformation from the sensor coordinateframe to the coordinate frame at the third knuckle of the handshown in Fig. 2.
Each of the nine muscle groups was stimulated at constantpulse widths of 10%, 20%, 30%, 40%, 50%, 60%, 70%, 80%,90%, and 100% of its maximum pulse width for a total of90 stimulation trials. A five second rest period followed eachone second stimulation. The order of muscle groups stimulatedand pulse width levels was randomized. The experiment wasseparated into ten blocks of nine different muscle groupsper block, so each muscle group was only stimulated onceduring each 54-second block. This allowed each muscle groupsufficient time to rest before stimulation in the next block.
An example of evoked force vs. time for the ten trialsfor a muscle group is shown in Fig. 3(a). Each point onthe recruitment curve (Fig. 3(b)) is the difference betweenthe force magnitude averaged over the last half second ofstimulation and the force magnitude averaged over the secondbefore stimulation began. Subtracting the force measuredbefore stimulation begins makes this a model for the activesteady-state force generated by stimulating a muscle groupandeliminates passive effects such as gravity or muscle stiffness.Generally the force magnitudes in Fig. 3(a) plateau after 0.5seconds of stimulation. Fluctuations in the force magnitudefor 60%, 80%, and 100% stimulation are due to movementthat results from breathing. The model treats these fluctuations
as noise. Maximum likelihood was used to estimate theparametersaj , bj, andcj for each recruitment curve.
Because we stimulated the muscle groups one-by-one, wesolved for each column ofA in (3) separately. This was doneby a linear least squares fit with no intercept term,
Aj = Fj gj† (5)
where Aj ∈ R3×1 is the column ofA corresponding to
the j th muscle group (Fig. 4),Fj ∈ R3×10 is the matrix of
endpoint force vectors (ten vectors, one for each stimulationlevel) corresponding to thej th muscle group,gj ∈ R
1×10
is a vector of normalized force magnitudes (one for eachstimulation level) corresponding to thej th muscle group, andgj
† is the Moore-Penrose pseudo-inverse ofgj.
D. Feedforward Controller
Using the identified model, we developed a feedforwardcontroller that determines the stimulation inputs that willproduce a desired active endpoint force.
Given a target forcef t, the controller inverts the modelidentified above to compute the stimulation inputsu to be ap-plied to the arm. Because the system is redundant, there is nota unique solution of (3) forg(u). To resolve the redundancywe minimize the sum of squares of muscle activations subjectto the constraints that the model-predicted force equals thetarget force and that the activations are between zero and one:
minimize: ||g(u)||22subject to: Ag(u) = f t
gj(uj) ∈ [0, 1] ∀j.(6)
Having obtained the activationsg(u) required to achieve thetarget endpoint force, the controller inverts the recruitmentcurve (4) to find each required stimulation inputuj . There isevidence that the healthy nervous system uses this minimumactivation strategy [11].
E. Total Error in Multi-Muscle Force Control
We evaluated the accuracy of our controller using a gridof evenly-spaced endpoint force targets over the 3D range
This is the author’s version of an article that has been published in this journal. Changes were made to this version by the publisher prior to publication.The final version of record is available athttp://dx.doi.org/10.1109/TNSRE.2013.2282903
Copyright (c) 2014 IEEE. Personal use is permitted. For any other purposes, permission must be obtained from the IEEE by emailing [email protected].

5
Fig. 4. Graphical description ofA in (3): each vector originating fromthe subject’s hand represents the magnitude and direction of the force at thesubject’s hand when stimulating the corresponding muscle group at 100%.Each vector is a column ofA. Only six muscle groups are labelled in theview on the right because of space considerations. SS is not visable in theview on the right because it has very smallfy andfz components. The blackrings bound the set of achievable endpoint forces in each plane.
of achievable forces. To determine the range of achievableendpoint forces we assumed that each muscle group actsindependently, and can produce a set of forces defined bythe line segment between zero and the maximum 3D forcemeasured during the characterization of its recruitment curve.The set of all achievable forces is then the Minkowski sumof the nine sets of achievable forces of the individual musclegroups. The “volume” of achievable forces is a convex regionand can be seen in 2D slices (Fig. 5).
We constructed a grid of targets (Fig. 5) in the [fx, fy, fz]space with 4.5 N spacing to fill the volume of achievableendpoint forces. Controller performance trials were conductedon two separate days with 48 hours of rest between sessions.This resulted in 69 targets on Day 1 and 66 new targets onDay 2 for a total of 135 unique endpoint force targets. Theorientation of [fx, fy, fz] coordinate systems in which thetargets were computed were different from one day to the next.On Day 1 the order of targets was randomized and divided intothree blocks. The Day 2 targets were randomized in two equalblocks. The blocks were run in succession with a short periodfor data logging between blocks. One trial was run for eachtarget.
Each trial consisted of stimulating the muscle groupscorresponding to the desired target for one second followedby30 seconds of rest to limit any effects of fatigue. The measuredsteady-state force, which was the mean force output over thefinal 0.5 s of stimulation, was recorded. We computed theerror, which is the difference between the predicted and mea-sured steady-state force output, for each target and computedthe root-mean-square (RMS) error over all targets.
F. Random Error and Bias in Multi-Muscle Force Control
To estimate the relative contributions of random error andbias to the total error, we ran several repeated trials atfive different endpoint force targets spanning much of theachievable force space (Fig. 8). On Day 1 a single target(Target 1) was repeated 10 times. On Day 2 four additional
fx
fy
3 N
fz
fy
scale
endpoint force target
Fig. 5. Target forces in controller performance experiments: Black circlesrepresent targets in thexy andyz planes in endpoint force space. If a vectorwere drawn from the subject’s hand to each black circle, thatvector representsthe direction and magnitude of the target force. The black rings bound the setof achievable endpoint forces in each plane.
targets (Targets 2–5) were repeated 15 times each. On Day 2the trials for the first two targets were run in random order inone block and the trials for the last two targets were then runin random order in a second block. The timing of stimulationand rest were the same as in the previous subsection.
Random error was quantified for each target by computingthe covariance of the measured 3D force for the repeated trialsand reporting the square root of the largest eigenvalue. Thisrepresents the standard deviation of the force in the directionof largest variance. Bias error was computed as the differencebetween the target and the mean of the measured force overthe repeated trials at each target.
G. Sources of Model Bias in Multi-Muscle Force Control
Our results indicated that bias errors were larger thanrandom errors for our controller. We therefore investigatedthree possible sources of the observed bias. The first potentialsource is due to system nonstationarity present between thesystem identification experiments on Day 1 and the subsequentcontroller performance experiments on Days 1 and 2. Possiblesources of nonstationarity include fatigue or experimentaloutliers associated with nonstationary events such as musclespasms or postural changes during the system identificationprocess. The second possible source of bias is nonlinearinteractions between muscle groups, which are not consideredin our model (3). These may arise from current spillover orforce transmission between muscle groups. The third sourceof bias is poor model fits due to an insufficient amount of data.
To evaluate the effects of nonstationarities we refit our linearmodel mapping muscle activations to endpoint forces to thecontroller performance experiment data. Then we comparedthe refit model’s ability to predict endpoint forces to that ofthe model that was fit to the original system identification data.The parameters of the model (A in (3)) were identified usingdata from 100 trials randomly-selected from the data set of 135trials, and the model’s performance was evaluated on 30 otherrandomly-selected trials. The superior performance of therefitmodel, if any, indicates differences between the original sys-tem identification data set and the controller performance data.
This is the author’s version of an article that has been published in this journal. Changes were made to this version by the publisher prior to publication.The final version of record is available athttp://dx.doi.org/10.1109/TNSRE.2013.2282903
Copyright (c) 2014 IEEE. Personal use is permitted. For any other purposes, permission must be obtained from the IEEE by emailing [email protected].

6
0 0.5 1
0
1
2
3
4
5
time (s)
forc
e (
N)
fx measured
fx target
fx steady-state
error
stimulation begins
stimulation ends
Fig. 6. Measured force in thex direction vs. time for a typical controllerperformance experiment: The steady-state force is the average of the measuredforce during the final half second of stimulation.
For instance, if muscle properties changed between the sys-tem identification experiments and the controller performanceexperiments, the new refit model should perform better. Weattribute these differences to nonstationary system properties.
The process for refitting the model to the controller perfor-mance experiment data was as follows. As the controller per-formance experiment data includes no information on musclegroups stimulated individually, we could not directly recom-pute recruitment curves. To indirectly recompute recruitmentcurves we fit a Gaussian process model (GPM) [20], whichis a nonlinear function approximator, to the entire 135 datapoint set. Using the GPM we created simulated single musclegroup data and computed recruitment curves based on thesimulated data. Given stimulation inputs from the controllerperformance experiment data, we computed the correspondingmuscle activations using the recomputed recruitment curves.We then refit our linear model (3) to 100 randomly-selectedtrials and evaluated its predictions for 30 other randomly-selected trials.
This cross-validation process was repeated 1000 times,yielding 1000 new linear models. To quantify the effects ofnonstationarities we compared the mean RMS error over thesemodels to the error in the controller performance experiment.
To evaluate the effects of nonlinear interactions, we fitGaussian process models to the same data sets that were usedto refit the linear models, yielding 1000 GPMs. The GPMspredict the endpoint force given the muscle activation. If theGPM, which can capture a wide range of nonlinear interactionsbetween muscles, predicts endpoint forces better than thelinear model, it would suggest that nonlinear interactionsbetween muscles significantly affected controller performance.We used the same cross-validation process for the GPMs aswas described for the linear models and compared the averageRMS error of the GPM models to the average RMS error of thelinear models to evaluate the effects of nonlinear interactions.
Finally, the influence of the amount of data available forfitting the model parameters was assessed by repeating thefitting process with randomly selected data sets having 20, 30,40, 50, 60, 70, 80, 90, and 100 data points. This process wasperformed for both the GPM model and the re-estimated linearmodel, and performance of each model was cross-validated
fx fy fz f2
fx fy fz f2
error (N) achievable range (N)
2.3
46.5
16.2
42.3
26.5
5.24.12.2
Fig. 7. RMS errors in endpoint force compared to the range of achievableendpoint forces over both days of controller performance experiments.
using 30 randomly selected trials not used to fit the model.This process was repeated 1000 times for each size data set.
We trained Gaussian process models using the GPMLtoolbox [21] forMATLAB R©. Our GPMs used a zero meanfunction, a squared exponential covariance function, and aGaussian likelihood function. The model’s hyperparameters —the input length scale, the output covariance and the noise level— were determined by maximizing the marginal likelihood ofthe data, which balances fitting the data well with avoidingmodel complexity.
III. RESULTS
A. Total Error in Multi-Muscle Force Control
The results of a typical controller performance trial areshown in Fig. 6. Shortly after stimulation began the measuredforce began to rise and eventually oscillated around a steady-state value. When stimulation ended, the measured forcereturned close to its pre-stimulation level. Similar trials wereconducted with targets over the entire space of achievableendpoint forces.
The magnitude of RMS error of the controller over the135 evenly-spaced targets was 5.2 N or 11% of the rangeof achievable endpoint forces (Fig. 7). The largest RMS errorwas in the vertical (z) direction. The error was 4.1 N or 26%of the range of achievable vertical forces. The results weresimilar over both days of testing as the magnitude of RMSerror on Day 1 was 5.3 N and on Day 2 was 5.1 N.
The largest errors occurred when undershooting targets inthe vertical (z) direction. This means that muscle groupsproducing force in the vertical direction did not produce asmuch force as the identified model predicted. The largesterrors coincided with stimulation of lower pectoralis and thethoracodorsal nerve which were the primary producers ofvertical force at this arm pose (see Fig. 4). The reasons forthese errors are discussed further in Section IIIC.
B. Random Error and Bias in Multi-Muscle Force Control
The total error reported above reflects both errors due tobias in the feedforward controller and random errors due tovariability of force production across trials. We evaluated thecontributions of these different sources of error by running
This is the author’s version of an article that has been published in this journal. Changes were made to this version by the publisher prior to publication.The final version of record is available athttp://dx.doi.org/10.1109/TNSRE.2013.2282903
Copyright (c) 2014 IEEE. Personal use is permitted. For any other purposes, permission must be obtained from the IEEE by emailing [email protected].

7
fx
fy
3 N
Target 1
Target 2
Target 3
Target 4
Target 5fz
fy
scale
Actual 1
Actual 2
Actual 3
Actual 4
Actual 5
Fig. 8. Scatter plots of repeated controller performance experiments in thexyplane (left) and theyz plane (lower right): Large closed symbols representthe endpoint force targets, and smaller open symbols represent the actualendpoint force measured in repeated experiments. If a vector were drawnfrom the subject’s hand to each symbol, that vector represents the directionand magnitude of the target force for a large closed symbol orthe measuredforce for a smaller open symbol. The black rings bound the setof achievableendpoint forces in each plane. Target 1 was tested on Day 1, and the otherfour targets were tested on Day 2.
repeated trials for five different endpoint force targets.Errors due to model bias were larger than errors due to trial-
to-trial variability. The forces observed on repeated controltrials attempting to produce five different force targets areshown in Fig. 8. For each target, each of the repeated trialsused the identical muscle stimulation pattern. As can be seenin the figure, the desired force and the distribution of forcesactually produced for each target are different. These errorsdue to bias ranged between 2.3–6.0 N (RMS), correspondingto 5–13% of the total range of achievable endpoint forces.The random error due to trial-to-trial variability, as measuredby the distribution of measured forces for each target, wasrelatively smaller, ranging between 0.9 to 1.6 N, or 2–3% ofthe total range of achievable endpoint forces.
C. Sources of Model Bias in Multi-Muscle Force Control
Because model bias errors were larger than random errorswe further investigated the sources of model bias. Wequantified model bias due to nonstationary system properties,nonlinearity of muscle interactions, and the use of limiteddata in system identification.
To estimate model bias due to nonstationary systemproperties, we re-estimated our model 1000 times usingdifferent randomly-selected trials from the controllerperformance experiments. We compared the average RMSerror of the refit models to the RMS error of the originalcontroller.
Re-estimating the model reduced the magnitude of thetotal RMS error to 2.7 N or 2.5 N less than the error ofthe original model. We attribute this 2.5 N difference tononstationary system properties. The error in the verticalforce component was reduced to 1.1 N, or 3.0 N less thanthe vertical component of the error of the original model.This demonstrates that the systematic undershoot mentionedin Section IIIA was greatly reduced using the re-estimatedmodel. Smaller error reductions were observed in the two
Fig. 9. Sources of error in multi-muscle endpoint force control. 1000 linearmodels and 1000 GPMs were fit to randomly-selected test sets from thecontroller performance data set for increasing numbers of data points in thetest set. The average RMS error of the models in predicting endpoint forcesfor data not in the test set is represented by blue circles forthe linear modelsand red circles for the GPMs. The error bars represent two standard deviationsaway from the average of the 1000 models. The solid horizontal black linerepresents the RMS error of the controller that used the model identified on90 data points prior to the controller performance experiments.
horizontal directions. Almost all parameters in the refit linearmodels were significantly different than those originallyidentified for every muscle group.
Despite nonstationarity in all muscle groups, especiallylarge errors coincided with stimulation of lower pectoralis asmentioned in Section IIIA. The decrease in error with the refitmodels was primarily in the vertical direction to which thelower pectoralis contributed significantly. The reason forthisis that the nonstationarity in the lower pectoralis recruitmentcurve occurred at a stimulation level that was very frequentlyused. The range of stimulation of other muscle groups wasmore uniform during the controller performance experiments,so the effects of nonstationarity were diminished.
We found that there was only a modest reduction inerror when the second source of model bias — nonlinearinteractions between muscle groups — was considered. Toshow this we fit a Gaussian Process Model (GPM) to eachof 1000 data sets randomly selected from the controllerperformance experiment data. A GPM can account fornonlinearities as detailed in Section IIG. The average RMSerror of these 1000 GPMs was compared to the averageRMS error of the 1000 linear models described above. Thereduction in average RMS error was from 2.7 N using thelinear model to 2.4 N using the nonlinear GPM (Fig. 9).The difference between the average RMS error of the GPMsand the average RMS error of the linear models was notstatistically significant (see error bars in Fig. 9). This smallimprovement when using the nonlinear GPM suggests thatthe forces produced by individual muscle groups combinedapproximately linearly during the controller performanceexperiments.
Finally, we examined the consequences of estimatingmodels using limited amounts of data. As shown in Fig.9, the prediction error steadily decreased with increasingnumbers of data trials used to identify the model, up untilapproximately 40 data points were used. There were minimal
This is the author’s version of an article that has been published in this journal. Changes were made to this version by the publisher prior to publication.The final version of record is available athttp://dx.doi.org/10.1109/TNSRE.2013.2282903
Copyright (c) 2014 IEEE. Personal use is permitted. For any other purposes, permission must be obtained from the IEEE by emailing [email protected].

8
improvements in model predictions as data sets were increasedbeyond this number for models allowing either linear ornonlinear interactions between muscles.
IV. DISCUSSION
The goal of this research was to quantify the errors inforce productioin associated with using FES to control multi-ple muscles in the human arm. To eliminate complicationsassociated with modeling the relationship between muscleforces and the resulting motions of a multiple-degree-of-freedom limb, we considered only isometric force generationand an empirically determined linear mapping between theforces generated by each muscle and those measured at theendpoint of the arm. This approach allowed us to quantifythe total error associated with multiple muscle control andtoestimate the contributions that could be attributed to nonlinearinteractions between muscles, nonstationary system properties,model biases resulting from the use of limited data during theestimation process, and random errors.
Quantifying errors in isometric force control is a neccessarystep toward motion control of multiple joints. The multi-muscle system applies forces that produce torques accrossmultiple joints. The endpoint force we measured is linearlyrelated to torques about the joints of the arm. In quantifyingthe error in endpoint force relative to the total range of forceoutput, we quantify the expected errors in joint torques relativeto the range of possible joint torques. We have quantified thesteady-state accuracy of the torque actuators of our system.This is especially useful in using well-known robot armcontrol strategies which typically command torques to producedesired motions. For instance, in designing a controller wheretorques are commanded, the expected uncertainty in the torquecommand can be propogated through a simulation model topredict errors in the motion of the arm.
Our work in isometric force control does not address somefactors that may contribute to errors in motion control. Weintentionally did not consider the nonlinear dynamics of theskeletal system in order to isolate the effects of muscle forceproduction. Our steady-state analysis also did not considerthe dynamics of the muscles themselves. Identifying subject-specific models of the muscle dynamics and skeletal dynamicsare critical future steps that will build on our current investi-gation of isometric force generation by mutliple muscles.
The remainder of the discussion focuses on the specificfindings of this study. We found that nonlinear interactionsbetween muscles made only modest contributions to the totalerror of the controller, while random error and errors due tononstationary system properties had more substantial contri-butions. We discuss each of these results and their potentialimplications to the design of FES controllers below.
A. Nonlinear Interactions Between Muscles
The finding of minimal contribution of nonlinear interac-tions between muscles was somewhat surprising as there isevidence to suggest nonlinear interactions exist [7, 8]. Thisresult suggests that nonlinearities due to current spillover
to adjacent muscles or due to connective tissue interactionsbetween muscles have minimal effect on force production bymultiple muscles. A minimal effect of nonlinear interactionsbetween muscles was recently described in similar studiesperformed in the rat [22].
The finding that muscle forces add linearly in a humanFES system greatly simplifies the design of FES controllers.Ifnonlinear interactions were present, more complicated modelsof force production would be required, significantly increasingthe complexity of FES controller design. Note that we selectedthe range of stimulation pulse widths to explicitly avoid cur-rent spillover. Further, nonlinear connective tissue interactionsbetween muscles might become more significant at extremelimb configurations, or during more dynamic conditions notconsidered in these experiments.
B. Errors Due to Nonstationary System Properties
A large source of error in our experiments was due to differ-ences between the forces produced by muscle groups duringthe initial system identification experiments and during thecontroller performance experiments. When these differenceswere accounted for, the total error was reduced by almost50%. These errors imply that the system was nonstationary.Contributions to this behavior could arise from outliers duringthe initial system identification data collection process,suchas those arising from muscle spasms in patients with SCI,changes in stimulation history, fatigue, or significant randomerrors between trials. It is difficult to evaluate if such nonsta-tionarities would be expected consistently for FES controllers,because of the limited data available for these experiments.Nonetheless, these results do emphasize the importance oftracking changes in the muscle response to stimulation overtime to improve FES controller performance. Such changesmight be corrected directly using adaptive control strategiesor accounted for more indirectly using robust feedback con-trollers.
C. Random Error due to Trial-to-Trial Variability
Trial to trial variability contributed approximately 1.6/5.2N (30%) of the total error. If the errors due to any nonlinearinteractions and changes in estimated muscle properties areaccounted for, trial-to-trial variability contributed 1.6/2.5 N(64%) of the total error. This random error might in partbe due to nonstationarities in the physiological state of themusculoskeletal system during the period of the controllerperformance trials. This could arise from fatigue, changesinarousal, reflexes, or muscle spasms.
In addition to these physiological sources, it is also possiblethat some of this random error was due to measurement error.As seen in the raw data trial of Fig. 6, there were considerablefluctuations in the forces that were measured, due in part tothe patient’s respiration. Because of the likely contributionsof such measurement errors, it is likely that the random errorobserved here was an overestimate of the true variability offorce production during FES and should be considered as anupper bound on the amount of random error.
This is the author’s version of an article that has been published in this journal. Changes were made to this version by the publisher prior to publication.The final version of record is available athttp://dx.doi.org/10.1109/TNSRE.2013.2282903
Copyright (c) 2014 IEEE. Personal use is permitted. For any other purposes, permission must be obtained from the IEEE by emailing [email protected].

9
D. Conclusions
The results of this study describe the performance of afeedforward FES controller for the production of flexible mo-tor outputs in humans. We demonstrated the contributions ofdifferent sources of error to the performance of this controller,showing a minimal effect from nonlinear interactions betweenmuscles but greater effects from errors due to nonstationarysystem properties and from trial-to-trial variability.
Although we were able to account for a substantial portionof the observed errors in FES performance, it is importantto note that some unexplained, residual error was observed.If we consider that 0.9–1.6 N of the total error of 2.4N for the nonlinear GPM model was due to trial-to-trialvariability, then there remains approximately 0.8–1.5 N oferror that we have not accounted for. This residual errormight reflect physiological processes, such as muscle fatigueduring the controller performance experiments, which werenot evaluated systematically in these experiments. It thereforeremains possible that the error observed here for feedforwardFES control could be reduced further if this residual errorcould be accounted for and incorporated into the controller.
It is clear that any practical FES system will need to includesome form of feedback control to compensate for errors inforce production, but it is unclear at what level this feedbackshould occur. Feedback can be provided at the highest level bythe user, who is able to grade the level of stimulation throughthe user interface [23, 24]. Alternatively, automatic feedbackcontrol may be used to correct errors in the output [9, 10],which could be the position of the hand or the joint angles ofthe arms. Automatic feedback could also be used at the muscleactuator level to correct errors in force and torque [25].
The results of the present study provide important infor-mation on the characteristics of the internal errors that needto be considered when designing a feedback controller for ahigh-degree-of-freedom system such as the human arm.
REFERENCES
[1] K. T. Ragnarsson, “Functional electrical stimulation afterspinal cord injury: Current use, therapeutic effects andfuture directions,”Spinal Cord, vol. 46, pp. 255–274,2008.
[2] P. H. Peckham and J. S. Knutson, “Functional electricalstimulation for neuromuscular applications,”Annual Re-views in Biomedical Engineering, vol. 7, pp. 327–360,2005.
[3] L. R. Sheffler and J. Chae, “Neuromuscular electri-cal stimulation in neurorehabilitation,”Muscle Nerve,vol. 35, no. 5, pp. 562–590, 2007.
[4] B. Smith, P. H. Peckham, M. W. Keith, and D. D. Roscoe,“An externally powered, multichannel, implantable stim-ulator for versatile control of paralyzed muscle,”IEEETransactions on Biomedical Engineering, vol. 34, no. 7,pp. 499–508, 1987.
[5] D. Zhang and K. Zhu, “Modeling biological motorcontrol for human locomotion with functional electricalstimulation,”Biological Cybernetics, vol. 96, pp. 70–97,2007.
[6] P. Li, Z. Hou, F. Zhang, M. Tan, H. Wang, Y. Hong,and J. Zhang, “An FES cycling control system based onCPG,” in 31st Annual International Conference of theIEEE EMBS, 2009, pp. 1569–1572.
[7] H. Maas and T. G. Sandercock, “Force transmissionbetween synergistic skeletal muscles through connectivetissue linkages,”Journal of Biomedicine and Biotechnol-ogy, 2010, article ID:575672.
[8] P. A. Huijing, “Epimuscular myofascial force transmis-sion: A historical review and implications for new re-search. international society of biomechanics muybridgeaward lecture, taipei, 2007.”Journal of Biomechanics,vol. 42, no. 1, pp. 9–21, 2007.
[9] D. Blana, R. F. Kirsch, and E. K. Chadwick, “Com-bined feedforward and feedback control of a redundant,nonlinear, dynamic musculoskeletal system,”Medical &Biological Engineering & Computing, vol. 47, pp. 533–542, 2009.
[10] T. Watanabe, K. Iibuchi, K. Kurosawa, andN. Hoshimiya, “A method of multichannel PIDcontrol of two-degree-of-freedom wrist joint movementsby functional electrical stimulation,”Systems andComputers in Japan, vol. 34, no. 5, pp. 25–36, 2003.
[11] A. H. Fagg, A. Shah, and A. G. Barto, “A computationalmodel of muscle recruitment for wrist movements,”Jour-nal of Neurophysiology, vol. 88, pp. 3348–3358, 2002.
[12] J. L. Lujan and P. E. Crago, “Automated optimal coordi-nation of multiple-dof neuromuscular actions in feedfor-ward neuroprostheses,”IEEE Transactions on Biomedi-cal Engineering, vol. 56, no. 1, pp. 179–187, 2009.
[13] E. M. Schearer, Y. Liao, E. J. Perreault, M. C. Tresch,W. D. Memberg, R. F. Kirsch, and K. M. Lynch, “Systemidentification for 3D force control of a human armneuroprosthesis using functional electrical stimulation,”in International Conference on Robotics and Automation,2012.
[14] K. H. Polasek, H. A. Hoyen, M. W. Keith, R. F. Kirsch,and D. J. Tyler, “Stimulation stability and selectivity ofchronically implanted multicontact nerve cuff electrodsin the human upper extremity,”IEEE Transactions onNeural Systems and Rehabilitation Engineering, vol. 17,no. 5, pp. 428–437, 2009.
[15] B. Smith, Z. Tang, M. W. Johnson, S. Pourmehdi, M. M.Gazdik, J. R. Buckett, and P. H. Peckham, “An externallypowered, multichannel, implantable stimulator-telemeterfor control of paralyzed muscle,”IEEE Transactions onBiomedical Engineering, vol. 45, no. 4, pp. 463–475,1998.
[16] R. L. Hart, N. Bhadra, F. W. Montague, K. L. Kilgore,and P. H. Peckham, “Design and testing of an advancedimplantable neuroprosthesis with myoelectric control,”IEEE Transactions on Neural Systems and RehabilitationEngineering, vol. 19, no. 1, pp. 45–53, 2011.
[17] W. D. Memberg, P. H. Peckham, and M. W. Keith,“A surgically-implanted intramuscular electrode for andimplantable neuromuscular stimulation system,”IEEETransactions on Rehabilitation Engineering, vol. 2, no. 2,pp. 80–91, 1994.
This is the author’s version of an article that has been published in this journal. Changes were made to this version by the publisher prior to publication.The final version of record is available athttp://dx.doi.org/10.1109/TNSRE.2013.2282903
Copyright (c) 2014 IEEE. Personal use is permitted. For any other purposes, permission must be obtained from the IEEE by emailing [email protected].

10
[18] G. G. Naples and J. T. Mortimer, “A spiral nerve cuffelectrode for peripheral nerve stimulation,”IEEE Trans-actions on Biomedical Engineering, vol. 35, no. 11, pp.905–916, 1988.
[19] W. K. Durfee and K. E. MacLean, “Methods for estimat-ing isometric recruitment curves of electrically stimulatedmuscle,”IEEE Transactions on Biomedical Engineering,vol. 36, no. 7, pp. 654–666, 1989.
[20] C. E. Rasmussen and C. K. I. Williams,Gaussian Pro-cesses for Machine Learning. Cambridge, MA: TheMIT Press, 2006.
[21] C. E. Rasmussen and H. Nickisch, “GPML gaus-sian processes for machine learning toolbox,” 2010,http://mloss.org/software/view/263/.
[22] A. M. Jarc, M. Berniker, and M. C. Tresch, “FES controlof isometric forces in the rat hindlimb using many mus-cles,” IEEE Transactions on Biomedical Engineering,2013, in revision.
[23] C. Ethier, E. R. Oby, M. J. Bauman, and L. E. Miller,“Restoration of grasp following paralysis through brain-controlled stimulation of muscles,”Nature, vol. 485, pp.368–371, 2012.
[24] J. G. Hincapie and R. F. Kirsch, “Feasibility of emg-based neural network controller for an upper extremityneuroprosthesis,”IEEE Transactions on Neural Systemsand Rehabilitation Engineering, vol. 17, no. 1, pp. 80–90, 2009.
[25] M. A. Frankel, B. R. Dowden, V. J. Mathews, R. A.Normann, G. A. Clark, and S. G. Meek, “Multi-inputsingle-output closed-loop isometric force control us-ing asynchronous intrafascicular multi-electrode stimu-lation,” IEEE Transactions on Neural Systems and Re-habilitation Engineering, vol. 19, no. 3, pp. 325–332,2011.
Eric M. Schearer is a Ph.D. candidate in the Depart-ment of Mechanical Engineering at NorthwesternUniversity. He applies machine learning and roboticstechniques to solve system identification and controlproblems to restore human motion after paralysiswith functional electrical stimulation. He is a re-cipient of the NSF Graduate Research Fellowship.He earned a B.S. in Mechanical Engineering andan M.B.A. from the University of Notre Dame andearned an M.S. in Robotics from Carnegie MellonUniversity. He previously worked as a consultant at
Exponent, Inc. and as a Captain in the United States Air Force.
Yu-Wei Liao received the B.S. degree in mechan-ical engineering from National Taiwan University,Taipei, Taiwan, in 2007. He is currently working to-ward the Ph.D. degree in mechanical engineering atNorthwestern University, Evanston, IL. His researchinterests include robotics, human arm biomechanicsand motor control, and neuroprostheses for restora-tion of movements to disabled individuals usingfunctional electrical stimulation.
Eric J. Perreault is a Professor at NorthwesternUniversity with appointments in Biomedical Engi-neering and Physical Medicine and Rehabilitation,and in the Sensory Motor Performance Program atthe Rehabilitation Institute of Chicago. Eric receivedhis B.Eng and M.Eng in Electrical Engineeringfrom McGill University and his Ph.D. in BiomedicalEngineering from Case Western Reserve University.He completed a postdoctoral fellowship in Physiol-ogy at Northwestern University, and was a VisitingProfessor at ETH Zurich. Eric’s research focuses on
the neural and biomechanical factors involved in the control of multi-jointmovement and posture, as well as changes following injury.
Matthew C. Tresch received his B.A. in Psychologyfrom Wesleyan University followed by a Ph.D. fromMIT working in the laboratory of Emilio Bizzi. Hethen worked as a postdoctoral fellow with Ole Kiehnat the University of Copenhagen and as a researchscientist at MIT. He joined Northwestern Universityin 2005, establishing a research program examiningmotor coordination.
William D. Memberg received the B.S.E. degreein bioengineering from the University of Pennsylva-nia and the M.S. degree in biomedical engineeringfrom Case Western Reserve University (CWRU). Heworks as a senior biomedical engineer for CWRU.His research interests include functional electri-cal stimulation, prosthetics, sensors, adaptive equip-ment, and medical instrumentation. Mr. Memberg isalso the founder and President of RePlay for Kids,a nonprofit organization that adapts and repairs toysand assistive devices for children with disabilities.
Robert F. Kirsch obtained his B.S. in ElectricalEngineering from the University of Cincinnati, andM.S. and Ph.D. in Biomedical Engineering fromNorthwestern University. He was a post-doctoralfellow at McGill University. Dr. Kirsch is currentlyProfessor and Interim Chair of Biomedical Engi-neering at Case Western Reserve University and theExecutive Director of the Dept. of Veterans AffairsCenter of Excellence on Functional Electrical Stim-ulation. Dr. Kirsch’s research focuses on restoringmovement to disabled individuals using functional
electrical stimulation (FES) and controlling FES actions via natural neuralcommands. Computer-based models of the human upper extremity are usedto develop new FES approaches. FES user interfaces, including ones based onbrain recordings, are being developed to provide FES users with the abilityto command movements of their own arm.
Kevin M. Lynch is Professor and Chair of Me-chanical Engineering at Northwestern University anda faculty member of the Northwestern Institute onComplex Systems (NICO). His research focuses onrobot manipulation and locomotion, self-organizingmulti-agent systems, bio-inspired sensing and con-trol, and functional electrical stimulation for restora-tion of human function. He is a Senior Editor ofthe IEEE Transactions on Automation Science andEngineering, co-author of The Principles of RobotMotion (MIT Press, 2005), an IEEE fellow, and the
recipient of the IEEE Robotics and Automation Society EarlyCareer Award,Northwestern’s Professorship of Teaching Excellence, andthe NorthwesternEngineering Teacher of the Year award. He earned a B.S.E. in ElectricalEngineering from Princeton University and a Ph.D. in Robotics from CarnegieMellon University.
This is the author’s version of an article that has been published in this journal. Changes were made to this version by the publisher prior to publication.The final version of record is available athttp://dx.doi.org/10.1109/TNSRE.2013.2282903
Copyright (c) 2014 IEEE. Personal use is permitted. For any other purposes, permission must be obtained from the IEEE by emailing [email protected].