Embed Size (px)
Citation preview

Multi-Moji: Combining Thermal, Vibrotactile & Visual Stimuli to Expand the Affective Range of Feedback
Graham Wilson & Stephen A. Brewster Glasgow Interactive Systems Section, School of Computing Science
University of Glasgow, G12 8QQ UK {first.last}@glasgow.ac.uk
ABSTRACT This paper explores the combination of multiple concurrent modalities for conveying emotional information in HCI: temperature, vibration and abstract visual displays. Each mo-dality has been studied individually, but can only convey a limited range of emotions within two-dimensional valence-arousal space. This paper is the first to systematically com-bine multiple modalities to expand the available affective range. Three studies were conducted: Study 1 measured the emotionality of vibrotactile feedback by itself; Study 2 meas-ured the perceived emotional content of three bimodal com-binations: vibrotactile + thermal, vibrotactile + visual and visual + thermal. Study 3 then combined all three modalities. Results show that combining modalities increases the avail-able range of emotional states, particularly in the problematic top-right and bottom-left quadrants of the dimensional model. We also provide a novel lookup resource for design-ers to identify stimuli to convey a range of emotions.
Author Keywords Emotion; thermal feedback; vibration; visual feedback
ACM Classification Keywords H.5.2. Information interfaces and presentation (e.g., HCI): Haptic I/O
INTRODUCTION Emotional experience plays a central role in social commu-nication, motivation and memory, so it is important to sup-port effective emotional expression in HCI. Human displays of emotion are complex and multifaceted, including facial expressions [14], vocal elements [9], body movements [4], tactile (touch, push, squeeze) and thermal (hug, hold hands) sensations [19]. In the absence of physical presence during digital communication, emotion needs to be conveyed through different means. In synchronous communication, fa-cial expressions can be conveyed through video and voice through audio, but these signals are limited and devoid of tactile cues, and people with visual or hearing impairments miss out on cues. During asynchronous communication, such
as text-based messaging, emotion is frequently conveyed us-ing stylized pictorial expressions such as “emoji” (Figure 1), but these are difficult to interpret [26] and unsuitable for vis-ual impairments. They are also different to real affective sig-nals, lacking body movement, sound, touch and temperature.
Figure 1: We expand existing ways of conveying emotion in
digital communication with multimodal feedback.
The fields of social signal processing and multisensory input attempt to detect user emotion through the complex signals in facial expressions, voice and movements. However, little research has gone into conveying emotional states to users, for the purposes of digital communication (e.g., social me-dia), enhancing media (audio, video) or conveying signals to people with sensory impairments. As people of all ages spend increasing amounts of time using digital devices and communicating online [28], it becomes more important to fa-cilitate realistic social expressions.
Research in HCI has looked at how certain individual modal-ities can convey affective information, including thermal feedback [33,34,49], vibration [27,36,53], force feedback [6,37,52] and abstract visual displays [43,44,51]. Unfortu-nately, research shows that the individual modalities are only capable of conveying a limited range of emotional meaning by themselves. In most cases, emotion/affect is measured us-ing the common valence (pleasantness) and arousal (excit-edness) scales from Russell’s circumplex model [31]. Ther-mal [49] and abstract visual [51] feedback have similar emo-tional ranges, while vibrotactile feedback is largely limited to highly arousing or “excited” emotions [36,53], limiting the applicability of these channels in communication. As emo-tion is multimodal, it is important to study how multiple mo-dalities might combine to provide a wider range of emotional expressivity and so support better emotional communication in HCI (illustrated in Figure 1). The word emoji comes from the Japanese words e (“picture”) and moji (“character”). Here we discuss multi-moji: multimodal characters for con-veying emotional information.
Permission to make digital or hard copies of all or part of this work for personal or classroom use is granted without fee provided that copies are not made or distributed for profit or commercial advantage and that copies bear this notice and the full citation on the first page. Copyrights for components of this work owned by others than the author(s) must be honored. Abstracting with credit is permitted. To copy otherwise, or republish, to post on servers or to redistribute to lists, requires prior specific permission and/or a fee. Request permissions from [email protected]. CHI'17, May 06 - 11, 2017, Denver, CO, USA Copyright is held by the owner/author(s). Publication rights licensed to ACM. ACM 978-1-4503-4655-9/17/05…$15.00 DOI: http://dx.doi.org/10.1145/3025453.3025614
To systematically explore the space, this paper presents three studies which measured the perceived emotional meaning, in terms of valence and arousal, conveyed by four different combinations of modalities: 1) vibrotactile + thermal, 2) vi-brotactile + visual, 3) visual + thermal and 4) all three mo-dalities together. We build upon existing feedback designs for each individual modality for a more robust comparison and to identify the effect of combining modalities on the per-ceived emotional meaning. Study 1 recreated previous re-search on the perceived emotional meaning of vibrotactile stimuli [53] to provide a baseline. Study 2 then measured the perceived emotion being conveyed from all three bimodal combinations. Finally, Study 3 combined all three modalities (visual, vibrotactile, thermal) together. The results from the multimodal combinations were compared to the perceived emotionality of the individual channels, to determine if com-bining cues facilitates a wider range of affective expression.
RELATED RESEARCH To improve emotional communication in HCI, researchers have looked at the expressive capabilities of a range of visual and non-visual feedback designs. Our discussion focuses on the three feedback channels most studied in affective HCI: tactile, thermal and visual feedback. It mostly discusses re-search that has taken valence and arousal measurements of cues, as our aim is to compare the affective ranges of indi-vidual modalities to those of multimodal feedback, to deter-mine how to expand affective expression.
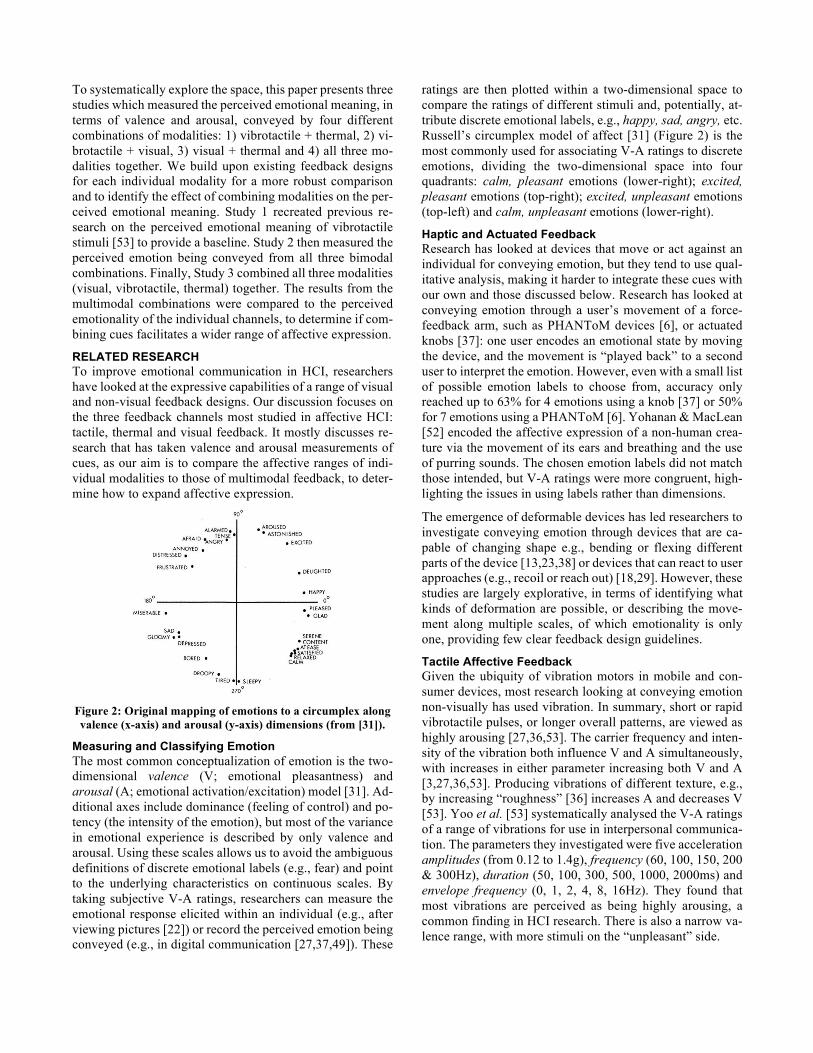
Figure 2: Original mapping of emotions to a circumplex along valence (x-axis) and arousal (y-axis) dimensions (from [31]).
Measuring and Classifying Emotion The most common conceptualization of emotion is the two-dimensional valence (V; emotional pleasantness) and arousal (A; emotional activation/excitation) model [31]. Ad-ditional axes include dominance (feeling of control) and po-tency (the intensity of the emotion), but most of the variance in emotional experience is described by only valence and arousal. Using these scales allows us to avoid the ambiguous definitions of discrete emotional labels (e.g., fear) and point to the underlying characteristics on continuous scales. By taking subjective V-A ratings, researchers can measure the emotional response elicited within an individual (e.g., after viewing pictures [22]) or record the perceived emotion being conveyed (e.g., in digital communication [27,37,49]). These
ratings are then plotted within a two-dimensional space to compare the ratings of different stimuli and, potentially, at-tribute discrete emotional labels, e.g., happy, sad, angry, etc. Russell’s circumplex model of affect [31] (Figure 2) is the most commonly used for associating V-A ratings to discrete emotions, dividing the two-dimensional space into four quadrants: calm, pleasant emotions (lower-right); excited, pleasant emotions (top-right); excited, unpleasant emotions (top-left) and calm, unpleasant emotions (lower-right).
Haptic and Actuated Feedback Research has looked at devices that move or act against an individual for conveying emotion, but they tend to use qual-itative analysis, making it harder to integrate these cues with our own and those discussed below. Research has looked at conveying emotion through a user’s movement of a force-feedback arm, such as PHANToM devices [6], or actuated knobs [37]: one user encodes an emotional state by moving the device, and the movement is “played back” to a second user to interpret the emotion. However, even with a small list of possible emotion labels to choose from, accuracy only reached up to 63% for 4 emotions using a knob [37] or 50% for 7 emotions using a PHANToM [6]. Yohanan & MacLean [52] encoded the affective expression of a non-human crea-ture via the movement of its ears and breathing and the use of purring sounds. The chosen emotion labels did not match those intended, but V-A ratings were more congruent, high-lighting the issues in using labels rather than dimensions.
The emergence of deformable devices has led researchers to investigate conveying emotion through devices that are ca-pable of changing shape e.g., bending or flexing different parts of the device [13,23,38] or devices that can react to user approaches (e.g., recoil or reach out) [18,29]. However, these studies are largely explorative, in terms of identifying what kinds of deformation are possible, or describing the move-ment along multiple scales, of which emotionality is only one, providing few clear feedback design guidelines.
Tactile Affective Feedback Given the ubiquity of vibration motors in mobile and con-sumer devices, most research looking at conveying emotion non-visually has used vibration. In summary, short or rapid vibrotactile pulses, or longer overall patterns, are viewed as highly arousing [27,36,53]. The carrier frequency and inten-sity of the vibration both influence V and A simultaneously, with increases in either parameter increasing both V and A [3,27,36,53]. Producing vibrations of different texture, e.g., by increasing “roughness” [36] increases A and decreases V [53]. Yoo et al. [53] systematically analysed the V-A ratings of a range of vibrations for use in interpersonal communica-tion. The parameters they investigated were five acceleration amplitudes (from 0.12 to 1.4g), frequency (60, 100, 150, 200 & 300Hz), duration (50, 100, 300, 500, 1000, 2000ms) and envelope frequency (0, 1, 2, 4, 8, 16Hz). They found that most vibrations are perceived as being highly arousing, a common finding in HCI research. There is also a narrow va-lence range, with more stimuli on the “unpleasant” side.

A very small number of studies have measured how the ad-dition of vibration modulates the perceived affective content in media. Salminen et al. [32] found that combining positive and negative speech samples with the vibrotactile waveform of that speech made it seem more arousing and dominating. Akshita et al. [3] found that vibration made IAPS images [22] more arousing, but did not influence their valence.
Thermal Affective Feedback There are inherent links between thermal sensation and emo-tion, such as the need for physical warmth for psychosocial development of infants [10,17], or the associations of words such as “loving” to “warm” personalities [5,15]. HCI re-searchers have started to measure the perceived emotional meaning of warm and cool sensations to improve interfaces for media or communication. Qualitative research has ob-served that participants consistently attribute opposite mean-ing to warm and cold: positive experiences and emotions are attributed to warm stimuli and unpleasant ones are attributed to cool [24,39,40,48]. Thermal feedback can also influence the emotional response to images, increasing the subjective enjoyment [25] or increasing (through warmth)/decreasing (through cold) the valence of images [2,16]. Research has also taken V-A ratings of thermal stimuli, to precisely meas-ure emotional content/responses. Salminen et al. [34] rec-orded participants’ emotional response to thermal feedback and found that warm stimuli resulted in lower valence (un-pleasant) and higher arousal responses than cool stimuli. The larger the change (2 to 6°C), the more unpleasant and arous-ing the response.
Wilson et al. [49] expanded on this research by also measur-ing the effect of the rate of temperature change on V-A rat-ings and mapping the responses to two different models of emotion. In contrast to Salminen, the participants were asked to rate the perceived emotion being conveyed by the thermal feedback, rather than their own response. Potentially due to this difference in framing, Wilson et al. found that warm stimuli represented more pleasant emotions than cold, how-ever, other patterns were similar: increasing either the extent of temperature change or the speed of change led to simulta-neous increases in the perceived arousal (i.e., more excited) and decrease in the perceived valence (i.e., more unpleasant). The distribution of stimuli in V-A space is shown in panel G of Figure 5, and is quite limited in its range.
There is a degree of variability in the interpretation of ther-mal feedback across studies. In some, cooling changes are pleasant or positive valence (and warming changes unpleas-ant/negative valence) [33,34,50], while other studies have found the opposite, that warming changes are pleasant/posi-tive and cooling is unpleasant/negative [48,49]. We believe the differences are at least partly due to task framing: what meaning is attached to the stimulus, such as its effect on one’s own emotional state [33,34], describing the stimulus itself [50,53] or the emotion being conveyed by another [49]. Our paper uses the same framing as the studies we take stim-uli from [49,51], so we believe interpretations will persist.
Visual Affective Feedback Outside of emoji ambiguity [26], research has looked at min-imalist or abstract visual feedback designs, leveraging corre-lates of facial activity [44] or inherent psychological associ-ations of colour to affective judgements [1,30,42,45]. Re-search has also identified hedonic perceptions of shape and contour, finding that people have a consistent preference for curved over pointed objects [7,30], possibly due to the inher-ent “threat” of sharp objects [8] (see summary in [51]).
Valtchanov & Hancock [43] used this research to design ab-stract visual feedback to convey to users the affective va-lence (pleasant/unpleasant) of photography scenes. They gained subjective views on an affective “pulsing amoeba”, a circular shape that regularly expanded/contracted, coloured green to convey pleasant scenes, white for neutral and red for unpleasant scenes. The amoeba changed from rounded con-tour and slow pulse (pleasant) to jagged contour and fast pulse (unpleasant). While a more explicitly informative bar-based design was easier to use, the amoeba was successful in creating affective responses, as it was “captivating” and “re-sponsive”, with the jagged shape being “threatening”.
Figure 3: Example abstract visual feedback. Left: jagged
“pulsing amoeba” [51] of different size (starting size, small increase and large increase). Right: coloured smooth amoeba.
Wilson et al. [51] extended this research, analysing how each individual visual design parameter in Valtchanov & Han-cock’s pulsing amoeba influenced the perceived emotion be-ing conveyed, individuating contour (jagged, smooth), pulse size (small, large), pulse rate (slow, fast) and colour (green, red, blue and grey; see Figure 3). They found that blue and green colours were more pleasant (higher valence) than red/grey, and that higher pulse rates or larger pulse sizes were more arousing and more unpleasant. The full distribution of stimulus V-A ratings is shown in panel F of Figure 5.
Limitations & Research Contribution Sound is an important part of expressing many emotions, and psychologists have identified characteristics of vocal expres-sions that convey emotional states [9]. They validated a set of “affective bursts” (short non-verbal expressions) but they can only convey a limited number of discrete emotions and with widely varying accuracy [9]. Little HCI research has studied how to create a range of affective sound cues, and so sound was not included in the current research.
There is a significant lack of truly multimodal affective feed-back, where more than one modality is used simultaneously. Some research has studied the modulation of an emotional response to one modality, through the simultaneous presen-tation of another [2,3,16,32]. However, these studies only ask participants to focus on and rate the one modality, with those ratings potentially altered by the second. The signals are not being treated holistically by participants.

Real human emotional displays are multimodal, yet HCI re-search has not explored how multiple feedback channels might combine to convey emotion. This is especially im-portant given the limited range of emotions that visual [51], vibrotactile [36,53] and thermal feedback [34,49] are capable of conveying individually. Panel H in Figure 5 shows the in-dividual distributions for the three modalities overlaid on a single graph, and several limitations are clear: 1) the modal-ities convey similar ranges of emotions, 2) most points are fairly near the centre and 3) there are very few points in the top-right (pleasant excited emotions) and bottom-left (un-pleasant calm emotions) quadrants. This paper addresses these limitations and provides the following contributions: 1) the first systematic measurement of combining two and three modalities on the perceived emotional meaning; 2) the first comparison of the perceived emotional content in multi-modal stimuli to that of individual modalities. We use the vi-brotactile stimuli from Yoo et al. [53], the thermal stimuli from Wilson et al. [49] and the visual stimuli from Wilson et al. [51], as they provide the widest range of V-A ratings on which to base feedback designs and compare results.
Figure 4: Phone with two 2cm2 Peltier modules and a Haptua-tor Mk II on the back. Device rested in (stimulated) the palm.
EXPERIMENTAL APPARATUS The same hardware was used for all three Studies and exper-imental software ran on a MacBook Pro laptop. The thermal and vibrotactile cues were presented from stimulators at-tached to the back of an Android mobile phone (see Figure 4). A phone was chosen as it represents a common interac-tion form factor that fits well with the study framing (con-veying emotion in digital communication), and has been used in previous research [47,53]. We used a mains-powered Peltier-based thermal stimulator [49] that connected to the laptop over Bluetooth. The Peltiers were attached to metal heatsinks and the base of the heatsinks were stuck to the phone with double-sided adhesive tape. They were posi-tioned so that the Peltiers made good contact with the palm as the device rested on the hand. The Haptuator Mark II was also stuck to the back, above the Peltiers, using double-sided adhesives. The Haptuator was put in the same y-axis orien-tation as Yoo et al., as orientation affects intensity [20], and was driven by sound files played over a 3.5mm cable from the laptop, via an amplifier. White noise was played through headphones to mask any noise from the vibrations. During all three studies, participants sat at a desk with the device resting in the palm of their non-dominant hand so that
the Peltiers made good contact. The haptuator vibrated the entire device so participants felt the vibrations through the Peltiers, collocating both sensations. Visual feedback, and valence/arousal scales, were shown on the screen of a laptop.
STUDY 1: BASELINE VIBROTACTILE STIMULI To be able to reliably compare our results to previous re-search it was important to use the same feedback cues, to produce the same affective interpretations. This was more straightforward for the thermal and visual cues, as they were reproduced using the same Peltier equipment and visual de-signs as the original authors [49,51]. We could produce the same vibration parameters as Yoo et al. [53], however, we were unable to obtain the same Haptuator they used; we were limited to the newer Haptuator Mark II [41]. The specifica-tion details for each model shows they have different charac-teristics, most notably in terms of the rated frequency band-width (50-500Hz for the original vs. 90-1000Hz for Mark II) and the reference acceleration (gravity @ 3V input, 125Hz input): 3.0g (original) vs. 7.5g (Mark II).
Parameter Values A1 A2 A3 Amplitude A1, A2, A3 90Hz 1.7g 3.3g 4.3g Frequency (Hz) 90, 200, 300 200Hz 0.6g 1.0g 1.3g Duration (ms) 100, 1000 300Hz 0.9g 1.2g 2.2g
Table 1: Vibrotactile stimuli used to measure affective ratings from Haptuator Mark II; and Amplitude values (g = gravity).
Therefore, we measured the perceived affectivity (valence and arousal ratings) of some of Yoo et al.’s stimuli using our Mark II, to ensure that we used affectively similar stimuli to them and to provide a baseline for comparing to the com-bined modalities in Studies 2 and 3. As we would only be using a small number of stimuli for each modality in Study 2 and 3, we tested only a subset of 18 of Yoo et al.’s stimuli, shown in Table 1. To avoid damaging the device and produc-ing invalid results from an ostensibly unsupported frequency, we did not use 60Hz, opting for 90Hz instead (the nearest frequency), giving three frequencies (labelled F): 90Hz (F1), 200Hz (F2) and 300Hz (F3). We identified three amplitude values (labelled A1-A3, measured in gravitational accelera-tion, g) which were subjectively similar in intensity across the three carrier frequencies (see Table 1). Durations (D) of 100ms (D1) and 1000ms (D2) were used, as they had signif-icantly different V-A scores [53]. The stimuli were therefore labelled e.g., F1A1D1 to mean 90Hz, amplitude 1, 100ms.
Participants 12 University staff/students (4 F, 8 M) aged 24 to 32 (mean = 28.3) took part in the study, which lasted 15 minutes.
Experimental Design The experimental design used throughout this paper closely followed that of previous unimodal research studies [34,36,49,51,53], to maximise the validity of comparisons. Each of the 18 stimuli were presented twice in a random or-der, with each presentation consisting of three repetitions of the stimulus at 1.5-second intervals. Participants were not able to replay stimuli. Once the stimulus had been presented

to the hand, 7-point valence (“unpleasant” to “pleasant”) and arousal (“low arousal” to “high arousal”) ratings were gained from two dialogue boxes on the laptop screen and the next random stimulus played after three seconds. The Inde-pendent Variables were: Amplitude, Frequency and Dura-tion, and the Dependent Variables were: Valence and Arousal, with the 7-point Likert values converted to -3 to +3.
Results The full distribution of average V-A ratings for each stimulus is shown in panel E of Figure 5 with means for each param-eter listed in Table 2. As in Yoo et al. [53], Valence de-creased as Amplitude increased (Duration made little differ-ence) and arousal increased as Amplitude, Frequency or Du-ration increased. In contrast, we found that increasing Fre-quency decreased Valence. The distribution of stimuli has a roughly equal split in the number of stimuli in the top (ex-cited) and bottom (calm) halves. Slightly more stimuli rest in the left (unpleasant) than in the right (pleasant) but there are large differences between the populations of each quadrant. The top-left and bottom-right quadrants have several stimuli, with few in the top-right and bottom-left, and those in the bottom-left are very close to the centre of the graph.
Amplitude Frequency (Hz) Duration (ms) 1 2 3 90 200 300 100 1000
Valence 0.15 -0.37 -0.62 0.79 -0.30 -1.33 -0.20 -0.36 Arousal -0.40 0.29 0.97 -0.50 0.41 0.96 -0.56 1.13
Table 2: Mean Valence and Arousal ratings (-3 to 3) for each level of the vibrotactile parameters in Study 1.
There are some differences to the results in Yoo et al. [53]. We found a wider but less symmetrical valence range and we found the opposite effect of Frequency: Yoo et al. found in-creasing Frequency led to increasing valence. These differ-ences could be due to the different actuator responses, or cul-tural factors (European vs. South Korean participants), and suggest that affective ratings are sensitive to experimental variability. Studies 2 and 3 use the same stimuli, equipment and experimental framing as previous research, maximising the validity, comparability and generalisation of results.
STUDY 2: TWO-MODALITY COMBINATIONS
Multimodal Feedback Designs This section describes the stimuli chosen to represent each of the three modalities in Studies 2 and 3. Because of the large number of stimuli available in the tactile [53], thermal [49] and visual [51] modalities, and the huge number of potential multimodal combinations, we used only four stimuli for each modality: one that represented each quadrant of the V-A model (all stimuli are shown in Table 3).
Vibrotactile Feedback The four vibrotactile signals came from Study 1, and provide a spread of all three frequencies and both durations, as well as two of the three amplitudes: 1) 90Hz, A1, 100ms (F1A1D1), 2) 90Hz, A3, 1000ms (F1A3D2), 3) 200Hz, A2, 100ms (F2A2D1) & 4) 300Hz, A3, 1000ms (F3A3D2).
Thermal Feedback The thermal stimuli were based on the dimensional distribu-tion from Wilson et al. [49] (Figure 5, panel G) and all changed from a neutral starting skin temperature of 30°C: 1) cool down 8°C at 3°C/sec (shortened to “c83”), 2) warm up 4°C at 3°C/sec (“w43”), 3) cool down 4°C at 3°C/sec (“c43”) and 4) warm up 2°C at 1°C/sec (“w21”). This provided a bal-anced set of stimuli: two warm and two cool; two slow and two fast; and three different temperature deltas. The thermal distribution is concentrated in the bottom-right and top-left quadrants, resulting in an uneven representation, which mul-timodal combinations may help to expand.
Table 3: Stimuli chosen to represent each quadrant in the valence (y-axis)-arousal (x-axis) model of affect in Study 2.
Visual Feedback The visual stimuli were chosen from the distribution in Wil-son et al. [51]. The four animated “amoebas” (Figure 3) used were: 1) Blue-Jagged-Small-Fast (shortened to “BJSF”), 2) Blue-Smooth-Small-Slow (BSSS), 3) Grey-Smooth-Large-Slow (GSLS) and 4) Red-Jagged-Large-Fast (RJLF). Small amoeba increased in size by 20%, large ones increased by 40%. Slow amoebas took 10 secs to grow, fast ones took 1 sec. Like the thermal stimuli, the distribution (Figure 5, panel F) is concentrated in the bottom-right and top-left quadrants, so these are better represented than the top-right/bottom-left.
Combining Stimuli When combining two modalities, all possible stimulus com-binations were used: four from the first modality were each combined with all four from the second modality, giving 16 stimuli per bimodal combination. This allowed us to measure the effect of both complimentary (stimuli from same quad-rant) and conflicting combinations (from opposing va-lence/arousal values) on the perceived emotionality.
Participants 18 students (10 F, 8 M) aged 19-53 (mean = 24.6) were paid £10 for both Study 2 (~45 minutes) and 3 (~15 minutes).
Experimental Design & Procedure The experimental design was the same as Study 1, except it consisted of three Sub-studies, one for each bimodal combi-nation, with different stimuli and different sets of valence and arousal data. All participants took part in all three Sub-studies in a counterbalanced order and each Sub-study con-sisted of a single block where all 16 stimuli were presented twice in a random order. Each stimulus lasted for seven se-conds. If vibration was presented, it was done in the same way as Study 1: played three times at intervals of 1.5 se-
Vibration: 300Hz, A3, 1000ms (F3A3D2)Visual: Red-Jagged-Large-Fast (RJLF)Thermal: -8°C @ 3°C/sec (c83)
Vibration: 90Hz, A3, 1000ms (F1A3D2)Visual: Blue-Jagged-Small-Fast (BJSF)Thermal: +4°C @ 3°C/sec (w43)
Vibration: 200Hz, A2, 100ms (F2A2D1)Visual: Grey-Smooth-Large-Slow (GSLS)Thermal: -4°C @ 3°C/sec (c43)
Vibration: 90Hz, A1, 100ms (F1A1D1)Visual: Blue-Smooth-Small-Slow (BSSS)Thermal: +2°C @ 1°C/sec (w21)
Valence
Arousal

conds. If visual feedback was presented, a 7-second anima-tion of the pulsing amoeba was shown on the laptop screen. If thermal feedback was presented, the Peltiers were set to a common starting temperature of 30°C throughout the Sub-study so that the skin rested at a neutral temperature [21,48]. During a stimulus, the Peltiers changed by the given extent and rate of change over the 7 seconds, before returning to 30°C for 10 seconds before the next trial.
Following each stimulus, the same 7-point Likert scales as in Study 1 were presented on the laptop screen and the partici-pants used a mouse to make their choices. Once all 32 stimuli had been presented, participants were given a 5-minute break before starting the next Sub-study. The Independent Varia-bles were the Vibration, Temperature and Amoeba stimuli shown in Table 3 (depending on the combination), while the Dependent Variables were Valence and Arousal. All Sub-studies were separately analysed in two steps: 1) a two-way repeated-measures MANOVA with Valence and Arousal as combined dependent variables; 2) two 4 x 4 repeated-measures ANOVA, one on the Valence data and one on Arousal, to determine effects on individual measures (effect sizes are shown as ηp
2). To measure participants’ internal re-liability of ratings between the two presentations of the same stimulus, we compared the mean ratings using paired-sam-ples T-tests (including Pearson’s correlation r). The full di-mensional distributions for each bimodal combination are shown in Figure 5 (panels A-C), alongside the distributions for each modality individually (panels E-G), for comparison.
Sub-study 1: Vibrotactile & Thermal Feedback The MANOVA found significant main effects of both Vibra-tion (F(6, 208) = 24.15, p<0.001; Wilks’ L = 0.347, ηp
2 = 0.41)
and Temperature (F(6, 208) = 7.03, p<0.001; Wilks’ L = 0.69, ηp
2 = 0.17) on the combined DVs. Individual ANOVAs found a significant main effect of Vibration on Arousal (F(3,
105) = 62.27, p<0.001, ηp2 = 0.64), with all Vibrations convey-
ing significantly different Arousal levels from each other. There was no effect of Temperature on Arousal, and no in-teraction. There was a significant main effect of Temperature on Valence (F(3, 105) = 11.34, p=0.001, ηp
2 = 0.24): c83 con-veyed significantly lower Valence than all other Tempera-tures, and c43 significantly lower than w21. There was no effect of Vibration on Valence, and no interaction. There were no significant differences in an individual’s ratings of same stimuli in either Valence (t = -0.52, r = 0.67) or Arousal (t = -1.67, r = 0.68), suggesting internal reliability of ratings.
As Panel A in Figure 5 shows, combining thermal and vi-brotactile feedback results in a fairly narrow Valence range but a relatively wide Arousal range. Vibration appears to be largely responsible for the perceived Arousal: increasing ei-ther amplitude or frequency increased arousal, the same as in Study 1 and in Yoo et al. [53]. Temperature appears largely responsible for the perceived Valence, with cool stimuli hav-ing negative/unpleasant valence and warm temperatures hav-ing positive/pleasant valence, as found in [49]. The lack of any interaction effects suggests there were no differences be-tween combining complimentary (same quadrant) vs. con-flicting (different quadrant) stimuli across modalities.
Sub-study 2: Vibrotactile & Visual Feedback The MANOVA found significant main effects of both Vibra-tion (F(6, 208) = 24.53, p<0.001; Wilks’ L = 0.343, ηp
2 = 0.41) and Amoeba (F(6, 208) = 16.47, p<0.001; Wilks’ L = 0.46, ηp
2
-3
-2
-1
0
1
2
3
-3 -2 -1 0 1 2 3
Arousal
Valence
-3
-2
-1
0
1
2
3
-3 -2 -1 0 1 2 3
Arousal
Valence
-3
-2
-1
0
1
2
3
-3 -2 -1 0 1 2 3
Arousal
Valence
Vibration Alone Visual Alone Thermal Alone All Solo Modalities
E F G H
F1A1D1
F1A1D2
F1A2D1
F1A2D2
F1A3D1
F1A3D2
F2A1D1
F2A1D2
F2A2D1
F2A2D2
F2A3D1
F2A3D2
F3A1D1
F3A1D2
F3A2D1
F3A2D2F3A3D1
F3A3D2
-3
-2
-1
0
1
2
3
-3 -2 -1 0 1 2 3
Arousal
Valence
-3
-2
-1
0
1
2
3
-3 -2 -1 0 1 2 3
Arousal
Valence
Vibration & Thermal Vibration & Visual Visual & Thermal All Bimodal Pairs
A B C D
F1A1D1+BJSF
F1A1D1+BSSS
F1A1D1+RJLF
F1A1D1+GSLS
F1A3D2+BJSF
F1A3D2+BSSS
F1A3D2+RJLF
F1A3D2+GSLS F2A2D1+BJSF
F2A2D1+BSSS
F2A2D1+RJLF
F2A2D1+GSLS
F3A3D2+BJSFF3A3D2+BSSS
F3A3D2+RJLF
F3A3D2+GSLS
-3
-2
-1
0
1
2
3
-3 -2 -1 0 1 2 3
Arousal
Valence
F1A1D1+c43
F1A1D1+c83
F1A1D1+w21
F1A1D1+w43
F1A3D2+c43
F1A3D2+c83 F1A3D2+w21
F1A3D2+w43
F2A2D1+c43
F2A2D1+c83
F2A2D1+w21
F2A2D1+w43
F3A3D2+c43
F3A3D2+c83
F3A3D2+w21
F3A3D2+w43
-3
-2
-1
0
1
2
3
-3 -2 -1 0 1 2 3
Arousal
ValenceBJSF+c43
BJSF+c83
BJSF+w21
BJSF+w43
BSSS+c43BSSS+c83
BSSS+w21
BSSS+w43
RJLF+c43
RJLF+c83
RJLF+w21
RJLF+w43
YSLS+c43
YSLS+c83
YSLS+w21
YSLS+w43
-3
-2
-1
0
1
2
3
-3 -2 -1 0 1 2 3
Arousal
Valence
Figure 5: Valence-arousal distributions for stimuli used in Study 2. Panels A-E show data from this paper: Sub-study 1 (A), Sub-study 2 (B), Sub-study 3 (C), Sub-studies 1-3 combined (D) and Vibrotactile stimuli from Study 1(E). Panels F (thermal stimuli
from [49]) and G (visual stimuli from [51]) are from previous research. Panel H shows panels E-G combined.

= 0.32) on the combined DVs. Individual ANOVA found a significant main effect of Vibration on Arousal (F(3, 105) = 64.45, p<0.001, ηp
2 = 0.65), with all Vibrations conveying significantly different Arousal levels from each other. There was also a significant main effect of Amoeba (F(3, 105) = 23.26, p<0.001, ηp
2 = 0.40), as all amoebas conveyed signif-icantly different Arousal levels. There was no interaction ef-fect. There was a significant main effect of Amoeba on Va-lence (F(3, 105) = 10.44, p<0.001, ηp
2 = 0.23): BJSF and BSSS conveyed significantly higher Valence than RJLF and YSLS. There was no effect of Vibration and no interaction. There were no significant differences in an individual’s ratings of same stimuli in either Valence (t = 0.92, r = 0.70) or Arousal (t = -0.15, r = 0.66), suggesting consistent ratings.
The results were similar to the combination of Vibration with Thermal feedback, as there is a narrow Valence range with a wider Arousal range. Both Vibration and the form of the Amoeba influenced Arousal: Vibration did so in the same way as Sub-study 1 (increasing frequency/duration led to in-creased Arousal), and the blue Amoeba conveyed Arousal levels between the red and grey Amoebas, the latter being the only one conveying calm Arousal. Rounded Amoeba had lower Arousal, while jagged ones had higher, in line with previous research [51]. The Visual design also predomi-nantly dictated that Valence ratings, with the blue shapes having positive/pleasant Valence and the red and grey having similarly negative/unpleasant Valence (as in [51]). The lack of interaction effects again shows there were no differences between complimentary and conflicting combinations.
Sub-study 3: Thermal & Visual Feedback The MANOVA found significant main effects of both Amoeba (F(6, 208) = 16.70, p<0.001; Wilks’ L = 0.46, ηp
2 = 0.32) and Temperature (F(6, 208) = 9.95, p<0.001; Wilks’ L = 0.60, ηp
2 = 0.22) on the combined DVs. Individual ANOVA found a significant main effect of Temperature on Arousal (F(3, 105) = 9.61, p<0.001, ηp
2 = 0.21): all conveyed signifi-cantly different Arousal levels (w43 only differed from w21). There was also a significant main effect of Amoeba (F(3, 105) = 26.07, p<0.001, ηp
2 = 0.43), with all conveying sig-nificantly different Arousal levels. There was no interaction.
There was a significant effect of Temperature on Valence (F(3, 105) = 10.95, p<0.001, ηp
2 = 0.24): all conveyed signifi-cantly different Valence values from each other, except when comparing the two warming stimuli. There was also a signif-icant effect of Amoeba on Valence (F(3, 105) = 9.33, p<0.001, ηp
2 = 0.21): BJSF led to higher ratings than RJLF, and BSSS led to higher ratings than both RJLF and YSLS. There were no significant differences in the ratings of same stimuli in Valence (t = 1.62, r = 0.75) or Arousal (t = 0.52, r = 0.67).
The distribution is different to the other Sub-studies: when vibration is not included there is a wider Valence range and a smaller Arousal range, and the points are more dispersed. Also, both modalities influence both dimensions, rather than each dictating one, as was more common in the other combi-
nations. Again, cool, red or grey stimuli had negative Va-lence, while warm or blue stimuli had positive Valence. There were no interaction effects, showing no difference be-tween complimentary vs. conflicting combinations.
Discussion: Comparing to Individual Modalities The top row of Figure 5 shows the valence-arousal distribu-tions for each bimodal combination in Sub-studies 1 to 3 (panels A to C), as well as all 3 overlaid on top (D), to show the range of emotional meaning that can be conveyed. The bottom row shows the distributions for each modality by it-self (vibration in panel E from Study 1, visual in F [51], and thermal in G [49]), as well as all three solo modalities over-laid (panel H). Combining two modalities (A-C) can convey a wider range of emotion, mostly in the top-right (excited pleasant emotions) and bottom-left (calm unpleasant emo-tions) quadrants. There is also a roughly even number and spread of stimuli in each of the four quadrants, although the bottom-left remains slightly sparser. These results are signif-icant and promising, as the top-right and bottom-left quad-rants have proven difficult to access in other research [3,49,51,53], and no other research has found such an even spread of stimuli throughout the model.
It is also clear that combining modalities has different effects on the range of arousal vs. valence that can be conveyed: combining modalities facilitates a slightly wider arousal range but a similar, and sometimes more contracted, valence range. The distributions for combinations involving vibra-tion (panels A and B in Figure 5) are notable for being tall and thin: in the presence of vibration, it appears to be difficult to convey strong pleasantness or unpleasantness. Vibration was primarily responsible for varying arousal in Sub-studies 1 and 2, so it may be that vibration dominates perception/in-terpretation over temperature or abstract visual feedback.
When temperature and visual feedback are combined (panel C), there is a smaller available arousal range than when vi-bration is present, but there is a wider valence range in return. The distribution for vibrotactile feedback alone (panel E) ac-tually has a wider valence range than the two combinations (A, B), which raises the question: why would a combination attenuate the valence of a vibration? There are two factors which go some way to answering this, and they also help ex-plain why we have not seen a wider valence range in general, compared to the individual modalities. The first is that par-ticipants appear to average the perceived emotional meaning from two modalities, rather than sum it; and the second factor is the influence of individual differences.
Emotionality is Averaged, Not Summed To inspect the effects of combining modalities more closely, we took each individual stimulus used in Sub-studies 1 to 3 and compared its V-A values when presented in isolation to the values from each time it was combined. This would show the effect of adding each individual vibrotactile, thermal or visual stimulus (depending on Sub-study) on the perceived emotional meaning. For example, comparing the values for BSSS from [51] and F1A1D1 from Study 1, we can see

where BSSS+F1A1D1 sits relative to those. As this paper is the first to do in-depth analysis of how modalities combine to convey emotion, there was no prior knowledge from which to predict how the combined ratings would differ from the individual ones. The pleasantness and calmness of both BSSS and F1A1D1 could have combined to convey an even calmer and more pleasant emotion. Or the use of two modal-ities could make the emotion more arousing, as there is greater sensory stimulation.
However, it appears that, for most combined stimuli, the per-ceived emotion was simply averaged across the two modal-ities. The perceived valence/arousal when combined were somewhere between the valence/arousal values of the indi-vidual stimuli. Examples of this are shown in the middle pan-els of Figure 6, where the reference individual stimulus is shown (black cross) and the combinations it was included in are shown around it. The distribution on the far right shows the locations of each individual stimulus, for comparison. This averaging of values seems to have contributed to the lack of a wider valence range than individual modalities, as there would always be two stimuli ‘pulling’ on each other.
This effect appears to be weaker on the range of perceived arousal, which is not contracted when combining modalities. But this is only the case when vibration is present, suggesting that the strength and dominance of vibration over arousal has the benefit of maintaining arousal across combinations, but with the detriment of overpowering the second modality that is required to influence valence. Therefore, the “attenuation” of vibrotactile valence, comparing the single modality (panel E, Figure 5) to the combinations (panels A & B), comes from averaging the valence with the thermal or visual stimulus.
There are a few notable exceptions where there does appear to be an additive effect, rather than averaging, particularly when combining F3A3D2 with thermal or visual stimuli. In isolation, F3A3D2 was rated as highly arousing and very low valence. However, the far left of Figure 6 shows all the com-bination stimuli that contain F3A3D2, and two effects have occurred: all the combinations have much higher valence than F3A3D2 by itself, but the vibration has also greatly in-creased the arousal of the non-vibration stimulus. For exam-ple, w21, BSSS and GSLS all have calm arousal by them-selves, but higher arousal for their combinations with
F3A3D2. The combinations in the far left of Figure 6 are all examples of the arousal of F3A3D2 being added to the va-lence of the other modality (thermal/visual).
Other examples primarily involve an additive effect on only one dimension (see Figure 6): valence or arousal. Combining w21+BSSS produces a calmer (but averaged valence) emo-tion than either individually; combining w43+RJLF leads to a higher arousal (but averaged valence) emotion than indi-vidually; and combining GSLS+c43 results in lower valence (but averaged arousal) emotion than individually.
Averaging (and adding) opens up interesting opportunities for interface designers: for a given stimulus type (e.g., vibra-tion), designers can effectively move it around the V-A space by adding other cues, opening a trimodal palette for creating, and adjusting, affective cues. If a user inputs an emoji or oth-erwise indicates a desired emotion, a system using our results can identify where in the dimensional model it sits and choose appropriate stimuli to convey that emotion.
Individual Differences Have A Strong Effect Seifi & Maclean [36] also found quite large individual dif-ferences in their participants’ affective ratings of vibrations. The valence values for all of our 48 combination stimuli had standard deviations of more than 1.2 (up to 2.2, with an av-erage of 1.7). Panels A to C in Figure 5 show that the average valence was little more than ±1, meaning nearly all stimuli were perceived as conveying both pleasant and unpleasant emotions, depending on the participant. These then cancel each other out to produce a more central mean value. We looked at how often each stimulus was rated as “pleasant” (valence of >= 1) vs. “unpleasant” (valence <= -1), to iden-tify which might be more reliable in their interpretation across users, as feedback designs need to rely on predictable interpretation. Research on the interpretation of audible af-fective bursts [9] found reliability (i.e., accuracy) values of between 56% and 86%, and research into the identification of multimodal feedback, such as Earcons [11], Tactons [12] and thermal icons [46] considered identification rates of >75% to be acceptable. Therefore, we considered 75% as the threshold to deem a stimulus reliably “pleasant” or “unpleas-ant” if 75% or more of the subjective valence ratings were >= 1 or <= -1, respectively.
Figure 6: Examples of how perceived emotionality of individual stimuli (black cross) is affected by adding another modality: visual (circle), thermal (triangle), vibration (diamond). Right: valence-arousal values for individual stimuli used in combinations.
F3A3D2 Combinations W21 Combinations C43 Combinations All Constituent Stimuli
F3A3D2
F3A3D2+c43
F3A3D2+c83F3A3D2+w21
F3A3D2+w43
F3A3D2+BSSSF3A3D2+BJSF
F3A3D2+RJLF
F3A3D2+GSLS
-3
-2
-1
0
1
2
3
-3 -2 -1 0 1 2 3
Arousal
Valence
F1A1D1
F1A3D2
F2A2D1
F3A3D2
c43
c83
w21
w43
BJSF
BSSS
RJLF
GSLS
-3
-2
-1
0
1
2
3
-3 -2 -1 0 1 2 3
Arousal
Valence
w21
F1A1D1+w21
F1A3D2+w21
F2A2D1+w21
F3A3D2+w21
BSSS+w21
BJSF+w21RJLF+w21
GSLS+w21
-3
-2
-1
0
1
2
3
-3 -2 -1 0 1 2 3
Arousal
Valence c43
F1A1D1+c43
F1A3D2+c43
F2A2D1+c43
F3A3D2+c43
BSSS+c43
BJSF+c43RJLF+c43
GSLS+c43
-3
-2
-1
0
1
2
3
-3 -2 -1 0 1 2 3
Arousal
Valence

Figure 7: Distributions for reliably interpreted (>75%, green)
and moderately reliable (65-74%, yellow) stimuli.
Only 14 out of the 48 stimuli (shown in green in Figure 7) met the threshold: five from Sub-study 1 (vibration + ther-mal), four from Sub-study 2 (vibration + visual) and five from Sub-study 3 (visual + thermal). A further 17 had relia-bility of 65-74% (Figure 7, yellow), leaving 17 stimuli whose pleasantness interpretation sits near chance level (50%). Ex-amining the reliable vs. unreliable stimuli does not show par-ticularly clear or predictable patterns. In Sub-study 1, warm stimuli are generally more reliably interpreted (in this case as pleasant) than cool stimuli, but this varies with vibration (e.g., F1A1D1 + c83 was reliably unpleasant at 79%). How-ever, this pattern is mirrored in Sub-study 3, as the reliable (unpleasant) stimuli involved cooling, but only when com-bined with the (also unpleasant) RJLF or GSLS amoebas. In Sub-study 2, stimuli with blue amoeba were more reliably interpreted (as pleasant). It should be noted, however, that each participant had strong internal reliability in interpreta-tion, rating the same stimulus similarly across the two presentations in a Sub-study, and our affective ratings closely match those in [49,51], suggesting a level of subjec-tive consistency across studies and across/within people.
Summary Overall, the results from Study 2 are promising. Combining modalities expands the available range of emotions that can be conveyed into previously hard-to-reach areas, and the manner in which combinations are interpreted (averag-ing/adding) can be leveraged to potentially access any posi-tion in the V-A space, provided it is between, or near, two known stimulus positions. However, emotional averaging, and individual differences, mean it remains challenging to reliably convey a full range of emotions.
STUDY 3: THREE-MODALITY COMBINATIONS Having measured the effects of combining two modalities, Study 3 then combined stimuli from all three to investigate how that would influence the emotional range. The method for combining stimuli in Study 2 was systematic: the four stimuli that best represented each of the four quadrants in one modality were taken and combined with all four stimuli of the other modality. This was done to test the effects of com-bining complimentary and conflicting meaning, to see if it
led to ratings otherwise impossible with only one modality. The lack of any significant interaction effects and the appar-ent averaging of emotionality observed in Study 2 led us to a more selective method for choosing trimodal combinations, to maximise the potential range.
Table 4: Trimodal vibrotactile, visual and thermal stimuli.
We first identified the bimodal stimuli from each Sub-study that sat furthest into each quadrant and then added a compo-nent from the 3rd modality (e.g., adding a visual component to a bimodal vibration+thermal pair). The component chosen was that which most frequently appeared in other pairs far into quadrants. The most common components in each quad-rant were: F3A3D2, F1A3D2, c83, c43, RJLF & BJSF (top-left); F3A3D2, F1A3D2, w43, w21, BJSF & BSSS (top-right); F1A1D1, F2A2D1, w43, w21, BJSF & BSSS (bot-tom-right); F2A2D1, F1A1D1, c83, c43 & YSLS (bottom-left). These were then used to create the trimodal stimuli shown in Table 4, in the manner of: F3A3D2+c83 (Sub-study 1) plus F3A3D2+RJLF (S-s. 2) plus RJLF+c83 (S-s. 3) = F3A3D2+RJLF+c83.
Experimental Design & Procedure Study 3 was completed by 12 of the same participants (9 fe-male, 3 male) as Study 2, in a session carried out one week later. The hardware and experimental design were the same as Study 2, except that only one condition was completed (~15 minutes). Due to the selective nature of the stimulus set, there were uneven numbers of individual stimuli, meaning we could not carry out a balanced statistical analysis.
Results The distribution for the trimodal stimuli is shown on the left of Figure 8. The values do not show a markedly different va-lence or arousal range compared to two-modality combina-tions, although the bottom-right stimuli sit slightly outside the bimodal range, as does one in the bottom-left. The arousal range is also slightly smaller, despite the presence of vibration; it may be that the dominance vibration exerts over one other modality is lessened when two other modalities are present. The three stimuli in each quadrant are the three stim-uli chosen to represent each quadrant, so our selective ap-proach has limited the pulling effects of stimuli far apart in valence/arousal, although averaging (this time between the positions of bimodal stimuli) was still seen. Combining three modalities did not lead to any additive effects on perceived emotionality. Anecdotally, some participants said it was con-fusing to process three modalities at once, and in our future research we will look at the processing, and relative impact, of each part of a trimodal stimulus.
F1A3D2+c83
F2A2D1+c43
F2A2D1+c83
F3A3D2+c43
F3A3D2+c83
F1A3D2+BJSF
F1A3D2+BSSS
F3A3D2+BJSFF3A3D2+RJLF
BJSF+w21
BJSF+w43
BSSS+c83
BSSS+w43
F1A1D1+c83
F1A1D1+w21
F1A3D2+w21
F2A2D1+w21
F3A3D2+w21
F1A1D1+BJSF
F1A1D1+BSSS
F2A2D1+BJSF
F2A2D1+BSSS
BSSS+w21
RJLF+c43
RJLF+c83
YSLS+c43
YSLS+c83
-3
-2
-1
0
1
2
3
-3 -2 -1 0 1 2 3
Arousal
Valence
F3A3D2+RJLF+c83F1A3D2+RJLF+c43F1A3D2+BJSF+c83
F3A3D2+BJSF+w43F3A3D2+BSSS+w21F1A3D2+BJSF+w43
F2A2D1+GSLS+c83F1A1D1+GSLS+c43F1A3D2+GSLS+c43
F1A1D1+BSSS+w21F1A1D1+BJSF+w43F2A2D1+BSSS+w43
Valence
Arousal

GENERAL DISCUSSION Our multimodal combinations, or multi-moji, have led to a wider range of conveyable emotional states than individual modalities are capable of, mostly in the top-right and bottom-left quadrants of the valence-arousal model [31], which have traditionally been the areas most poorly covered by feedback in HCI [3,49,51,53]. This means that UI designers now have a much richer set of possible emotional cues to use, to expand the affective range of feedback. Combining stimuli appears to complicate the interpretation of signals and, in the case of the averaging of emotionality, combining stimuli may act to reduce the emotional range, compared to individual stimuli. However, averaging also provides designers with a multi-modal palette: a method to convey potentially any emotional state, as long as it is positioned between known stimuli. In general, vibration is limited to influencing the perceived arousal and, while thermal or visual feedback influence va-lence, their ability to do so may be hindered by the domi-nance of the vibrotactile sensation. Combining three modal-ities expands the total affective range over what is possible with two, again in the problematic top-right, bottom-left quadrants, and it appears to reduce the dominance of the vi-brotactile stimulus, maintaining a better valence range.
Feedback Design Guidelines We have synthesised and distilled the results from Studies 1 to 3, and their comparisons to previous unimodal research, to produce guidelines for how to best convey affective states using different feedback modalities.
Distributions as Lookup Tables The distributions in this paper can be used as ‘lookup tables’ for designers wishing to convey particular emotional mean-ing through multimodal feedback e.g., by matching the posi-tion (or angle) of an emotion on the circumplex to the posi-tion of a stimulus, or simply choosing the stimulus that sits closest to a desired level of pleasantness/excitedness. Be-cause of the multiple modalities, stimuli can be chosen based on the technology available or the capabilities of the user.
Combining Modalities Increases Affective Range Through a trimodal palette, combining two or three modali-ties can increase the available affective range of a display, in comparison to single modalities, particularly in terms of
arousal and in accessing 1) excited pleasant and 2) calm un-pleasant emotional states. The modalities chosen can be tai-lored based on what state is required, as vibration expands the arousal range, while thermal/visual expands valence.
Three Modalities Temper Vibration, But Could Confuse When vibration is presented with another modality, it can dominate the overall interpretation, potentially contracting the available valence. Combining three modalities appears to temper this dominance, allowing for a more balanced va-lence and arousal range. However, presenting three concur-rent modalities may be perceptually taxing on users.
Averaged Emotionality Can Be Leveraged When combining modalities, the emotionality of the constit-uent elements is generally averaged. While this can act to limit the accessible range compared to additive effects, it also means that a desired emotional state can be conveyed by combining two adjacent stimuli.
Individual Differences Should Be Considered People are in favour of customizing their affective notifica-tions [35] and so, given the range of interpretations, it is rec-ommended that a system utilising multimodal affective feed-back should provide an initial calibration phase. Participants can either rate example stimuli, or choose ones to fit an af-fective state, to tailor the feedback to their views.
CONCLUSIONS The research in this paper represents the first systematic in-vestigation into the effects of combining two and three mo-dalities on the perceived emotion of stimuli, as a way of ex-panding the affective bandwidth of interfaces in HCI. Com-bining modalities led to a larger affective range than individ-ual modalities, particularly in areas of the valence-arousal model that have previously been poorly covered. Vibration mostly influences arousal, while thermal and visual feedback mostly influence valence, but combining all three modalities together tempers the dominating influence of vibration. Our research provides a novel and flexible resource for designers to look up how they can convey a range of emotional states using different combinations of available modalities.
ACKNOWLEDGEMENTS This work was funded by the EC ABBI project (#611452).
111BJSF+43
111BSSS+21111YSLS-43
132BJSF-83132BJSF+43
132RJLF-43
132YSLS-43
221BSSS+43221YSLS-83
332BJSF+43
332BSSS+21
332RJLF-83
-3
-2
-1
0
1
2
3
-3 -2 -1 0 1 2 3
Arousal
Valence
-3
-2
-1
0
1
2
3
-3 -2 -1 0 1 2 3
Arousal
Valence
-3
-2
-1
0
1
2
3
-3 -2 -1 0 1 2 3
Arousal
Valence
-3
-2
-1
0
1
2
3
-3 -2 -1 0 1 2 3
Arousal
Valence
All Trimodal Stimuli (Study 3) All Bimodal (Study 2) + Trimodal All Stimuli (Study 2 and 3) Approximated Circumplex
A B C D
Figure 8: Panel A: distribution for trimodal stimuli. Panel B: trimodal stimuli overlaid with all bimodal distributions (Panel D in Figure 5). Panel C: All stimuli from this paper (Panel B overlaid on individual modality distributions (Figure 5, panel
H). Panel D: Isolating stimuli around outside of range in an approximate circumplex [31].

REFERENCES 1. Francis Adams and Charles Osgood. 1973. A Cross-
Cultural Study of the Affective Meanings of Color. Journal of Cross-Cultural Psychology 4, 2: 135–156. http://doi.org/0803973233
2. Moses Akazue, Martin Halvey, Lynne Baillie, and Stephen Brewster. 2016. The Effect of Thermal Stimuli on the Emotional Perception of Images. Proceedings of the SIGCHI Conference on Human Factors in Computing Systems (CHI ’16), 4401–4412. http://doi.org/10.1145/2858036.2858307
3. Akshita, Harini Sampath, Bipin Indurkhya, Eunhwa Lee, and Yudong Bae. 2015. Towards Multimodal Affective Feedback : Interaction between Visual and Haptic Modalities. Proceedings of the SIGCHI Conference on Human Factors in Computing Systems (CHI ’15), 2043–2052. http://doi.acm.org/10.1145/2702123.2702288
4. Betsy App, Daniel N McIntosh, Catherine L Reed, and Matthew J Hertenstein. 2011. Nonverbal channel use in communication of emotion: how may depend on why. Emotion 11, 3: 603–617. http://doi.org/10.1037/a0023164
5. Solomon E Asch. 1946. Forming impressions of personality. Journal of abnormal psychology 41: 258–290. http://doi.org/10.1037/h0060423
6. Jeremy N Bailenson, Nick Yee, Scott Brave, Dan Merget, and David Koslow. 2007. Virtual interpersonal touch: expressing and recognizing emotions through haptic devices. Human-Computer Interaction 22: 325–353. http://doi.org/10.1080/07370020701493509
7. Moshe Bar and Maital Neta. 2006. Humans prefer curved visual objects. Psychological Science 17, 8: 645–648. http://doi.org/10.1111/j.1467-9280.2006.01759.x
8. Moshe Bar and Maital Neta. 2007. Visual elements of subjective preference modulate amygdala activation. Neuropsychologia 45, 10: 2191–200. http://doi.org/10.1016/j.neuropsychologia.2007.03.008
9. Pascal Belin, Sarah Fillion-Bilodeau, and Frédéric Gosselin. 2008. The Montreal Affective Voices: a validated set of nonverbal affect bursts for research on auditory affective processing. Behavior research methods 40, 2: 531–539. http://doi.org/10.3758/BRM.40.2.531
10. John Bowlby. 1969. Attachment and Loss. Hogarth Press, London.
11. Stephen A. Brewster, Peter C. Wright, and Alistair D.N. Edwards. 1995. Experimentally derived guidelines for the creation of earcons. Adjunct Proceedings of HCI 1995, 155–159.
12. Lorna Brown, Stephen Brewster, and Helen Purchase. 2006. Multidimensional Tactons for Non-Visual Information Presentation in Mobile Devices.
Proceedings of the International Conference on Human-Computer Interaction with Mobile Devices and Services (MobileHCI ’06), 231–238. papers://c80d98e4-9a96-4487-8d06-8e1acc780d86/Paper/p79
13. Jessica Dawson, Oliver Schneider, Joel Ferstay, et al. 2013. It’s alive!: exploring the design space of a gesturing phone. Proceedings of Graphics Interface 2013, 205–212. http://dl.acm.org/citation.cfm?id=2532164
14. Paul Ekman. 1993. Facial Expression and Emotion. American Psychologist 48, 4: 376–379.
15. Susan T. Fiske, Amy J.C. Cuddy, and Peter Glick. 2007. Universal dimensions of social cognition: warmth and competence. Trends in Cognitive Sciences 11, 2: 77–83. http://doi.org/10.1016/j.tics.2006.11.005
16. Martin Halvey, Michael Henderson, Stephen A. Brewster, Graham Wilson, and Stephen A. Hughes. 2012. Augmenting Media with Thermal Stimulation. Proceedings of International Workshop on Haptic and Audio Interaction Design (HAID ’12), 91–100. http://dx.doi.org/10.1007/978-3-642-32796-4_10
17. Harry F. Harlow. 1958. The Nature of Love. American Psychologist 13: 673–685.
18. Fabian Hemmert, Matthias Löwe, Anne Wohlauf, and Gesche Joost. 2013. Animate mobiles. Proceedings of the 7th International Conference on Tangible, Embedded and Embodied Interaction - TEI ’13: 267. http://doi.org/10.1145/2460625.2460669
19. Matthew J Hertenstein, Rachel Holmes, Margaret McCullough, and Dacher Keltner. 2009. The communication of emotion via touch. Emotion 9, 4: 566–573. http://dx.doi.org/10.1037/a0016108
20. Inwook Hwang, Jongman Seo, Myongchan Kim, and Seungmoon Choi. 2013. Vibrotactile perceived intensity for mobile devices as a function of direction, amplitude, and frequency. IEEE Transactions on Haptics 6, 3: 352–362. http://doi.org/10.1109/TOH.2013.2
21. L Jones and M Berris. 2002. The Psychophysics of Temperature Perception and Thermal-Interface Design. Proceedings of the International Symposium on Haptic Interfaces for Virtual Environment and Teleoperator Systems (HAPTICS), 137–142. papers://c80d98e4-9a96-4487-8d06-8e1acc780d86/Paper/p591
22. Peter J Lang, Margaret M Bradley, and BN Cuthbert. 2008. International Affective Picture System (IAPS): Technical Manual and Affective Ratings. Gainesville, FL.
23. Jung Min Lee, SY Jeong, and Ju DY. 2015. Emotional Interaction and Notification of Flexible Handheld Devices. Proceedings of the SIGCHI Conference on Human Factors in Computing Systems (CHI ’15), 2025–2030.
24. Wonjun Lee and Youn-kyung Lim. 2012. Explorative

research on the heat as an expression medium: focused on interpersonal communication. Personal and Ubiquitous Computing 16: 1039–1049. http://dx.doi.org/10.1007/s00779-011-0424-y
25. Markus Löchtefeld, Nadine Lautemann, Sven Gehring, and Antonio Krüger. 2014. ambiPad – Enriching Mobile Digital Media With Ambient Feedback. Proceedings of the International Conference on Human-Computer Interaction with Mobile Devices and Services (MobileHCI ’14), 295–298.
26. Hannah Miller, Jacob Thebault-Spieker, Shuo Chang, Isaac Johnson, Loren Terveen, and Brent Hecht. 2016. “Blissfully happy” or “ready to fight”: Varying Interpretations of Emoji. Proceedings of ICWSM 2016.
27. Marianna Obrist, Sriram Subramanian, Elia Gatti, Benjamin Long, and Thomas Carter. 2015. Emotions Mediated Through Mid-Air Haptics. Proceedings of the SIGCHI Conference on Human Factors in Computing Systems (CHI ’15), 2053–2062. http://doi.acm.org/10.1145/2702123.2702361
28. Ofcom. 2015. Time spent online doubles in a decade. Media Use and Attitudes 2015. Retrieved September 18, 2016 from http://consumers.ofcom.org.uk/news/time-spent-online-doubles/
29. Esben W Pedersen, Sriram Subramanian, and Kasper Hornbæk. 2014. Is My Phone Alive?: A Large-scale Study of Shape Change in Handheld Devices Using Videos. Proceedings of the SIGCHI Conference on Human Factors in Computing Systems (CHI ’14): 2579–2588. http://doi.org/10.1145/2556288.2557018
30. AT Poffenberger and BE Barrows. 1924. The Feeling Value of Lines. Journal of Applied Psychology 8, 2: 187–205.
31. James A Russell. 1980. A Circumplex Model of Affect. Journal of Personality and Social Psychology 39, 6: 1161–1178. http://dx.doi.org/10.1037/h0077714
32. Katri Salminen, Veikko Surakka, Jani Lylykangas, et al. 2012. Tactile modulation of emotional speech samples. Advances in Human-Computer Interaction 2012. http://doi.org/10.1155/2012/741304
33. Katri Salminen, Veikko Surakka, Jukka Raisamo, et al. 2011. Emotional Responses to Thermal Stimuli. Proceedings of ICMI 2011, 193–196. http://doi.acm.org/10.1145/2070481.2070513
34. Katri Salminen, Veikko Surakka, Jukka Raisamo, et al. 2013. Cold or hot? How thermal stimuli are related to human emotional system? Proceedings of International Workshop on Haptic and Audio Interaction Design (HAID ’13) 7989: 20–29. http://doi.org/10.1007/978-3-642-41068-0_3
35. Hasti Seifi, Chamila Anthonypillai, and Karon E. Maclean. 2014. End-user customization of affective tactile messages: A qualitative examination of tool
parameters. IEEE Haptics Symposium, HAPTICS: 251–256. http://doi.org/10.1109/HAPTICS.2014.6775463
36. Hasti Seifi and Karon E. Maclean. 2013. A first look at individuals’ affective ratings of vibrations. Proceedings of World Haptics 2013, 605–610. http://doi.org/10.1109/WHC.2013.6548477
37. Jocelyn Smith and Karon MacLean. 2007. Communicating emotion through a haptic link: Design space and methodology. International Journal of Human-Computer Studies 65: 376–387. http://www.sciencedirect.com/science/article/pii/S1071581906001911
38. Paul Strohmeier, Juan Pablo Carrascal, Bernard Cheng, Margaret Meban, and Roel Vertegaal. 2016. An Evaluation of Shape Changes for Conveying Emotions. Proceedings of the SIGCHI Conference on Human Factors in Computing Systems (CHI ’16), 3781–3792. http://doi.org/10.1145/2858036.2858537
39. Katja Suhonen, Sebastian Muller, Jussi Rantala, Kaisa Vaananen-Vainio-Mattila, Roope Raisamo, and Vuokko Lantz. 2012. Haptically Augmented Remote Speech Communication: A Study of User Practices and Experiences. Proceedings of the Nordic Conference on Human-Computer Interaction (NordiCHI ’12), 361–369. http://doi.acm.org/10.1145/2399016.2399073
40. Katja Suhonen, Kaisa Väänänen-Vainio-Mattila, and Kalle Mäkelä. 2012. User experiences and expectations of vibrotactile, thermal and squeeze feedback in interpersonal communication. Proceedings of the Annual BCS Interaction Specialist Group Conference on People and Computers (BCS-HCI ’12), 205–214. http://dl.acm.org/citation.cfm?id=2377916.2377939
41. TactileLabs. Haptuator Mark II Specification. Retrieved August 16, 2016 from http://tactilelabs.com/wp-content/uploads/2012/07/TL002-09-A_v1.01.pdf
42. Patricia Valdez and Albert Mehrabian. 1994. Effects of color on emotions. Journal of Experimental Psychology 123, 4: 394–409. http://doi.org/10.1037/0096-3445.123.4.394
43. Deltcho Valtchanov and Mark Hancock. 2015. EnviroPulse : Providing Feedback about the Expected Affective Valence of the Environment. Proceedings of the SIGCHI Conference on Human Factors in Computing Systems (CHI ’15), 2073–2082.
44. Hanna Venesvirta, Veikko Surakka, Yulia Gizatdinova, et al. 2015. Emotional Reactions to Point-Light Display Animations. Interacting with Computers, 1973: iwv028. http://doi.org/10.1093/iwc/iwv028
45. T W Whitfield and T J Wiltshire. 1990. Color psychology: a critical review. Genetic, social, and general psychology monographs 116, 4: 385–411. http://www.ncbi.nlm.nih.gov/pubmed/2289687
46. Graham Wilson, Stephen Brewster, Martin Halvey, and

Stephen Hughes. 2012. Thermal Icons: Evaluating Structured Thermal Feedback for Mobile Interaction. Proceedings of the International Conference on Human-Computer Interaction with Mobile Devices and Services (MobileHCI ’12), 309–312. papers://c80d98e4-9a96-4487-8d06-8e1acc780d86/Paper/p9328
47. Graham Wilson, Stephen Brewster, Martin Halvey, and Stephen Hughes. 2013. Thermal Feedback Identification in a Mobile Environment. Proceedings of International Workshop on Haptic and Audio Interaction Design (HAID ’13), Article 2. papers://c80d98e4-9a96-4487-8d06-8e1acc780d86/Paper/p9329
48. Graham Wilson, Gavin Davidson, and Stephen Brewster. 2015. In the Heat of the Moment : Subjective Interpretations of Thermal Feedback During Interaction. Proceedings of the SIGCHI Conference on Human Factors in Computing Systems (CHI ’15), 2063–2072. http://doi.acm.org/10.1145/2702123.2702219
49. Graham Wilson, Dobromir Dobrev, and Stephen A Brewster. 2016. Hot Under the Collar: Mapping Thermal Feedback to Dimensional Models of Emotion. Proceedings of the SIGCHI Conference on Human Factors in Computing Systems (CHI ’16), 4838–4849.
50. Graham Wilson, Martin Halvey, Stephen A Brewster, and Stephen A Hughes. 2011. Some Like it Hot? Thermal Feedback for Mobile Devices. Proceedings of the SIGCHI Conference on Human Factors in Computing Systems (CHI ’11), 2555–2564. http://doi.acm.org/10.1145/1978942.1979316
51. Graham Wilson, Pietro Romeo, and Stephen A Brewster. 2016. Mapping Abstract Visual Feedback to a Dimensional Model of Emotion. Proceedings of the SIGCHI Conference on Human Factors in Computing Systems (CHI ’16) Extended Abstracts.
52. Steve Yohanan and Karon E. MacLean. 2011. Design and assessment of the haptic creature’s affect display. Proceedings of Human-robot interaction 2011, 473. http://doi.org/10.1145/1957656.1957820
53. Yongjae Yoo, Taekbeom Yoo, Jihyun Kong, and Seungmoon Choi. 2015. Emotional Responses of Tactile Icons : Effects of Amplitude , Frequency , Duration , and Envelope. Proceedings of World Haptics 2015, 235–240. http://dx.doi.org/10.1109/WHC.2015.7177719


![Chronic Pancreatitis Associated Acute Respiratory Failuremedcraveonline.com/MOJI/MOJI-05-00149.pdf · Chronic Pancreatitis Associated Acute Respiratory ... [1,2]. Acute respiratory](https://img.pdfslide.us/doc/110x75/5ca432de88c993ad338b9ab4/chronic-pancreatitis-associated-acute-respiratory-f-chronic-pancreatitis-associated.jpg)


![BMC Neuroscience - cec.uchile.clclperez/papers/A critical experimental study of the...as diabetes, stroke, etc. [5-11]. Vibrotactile excitation is the most widely used form of Vibrotactile](https://img.pdfslide.us/doc/110x75/5e0f13757f4e255e4250eecd/bmc-neuroscience-cec-clperezpapersa-critical-experimental-study-of-theas.jpg)

![Vibrotactile sense in median 071218 - lup.lub.lu.selup.lub.lu.se/search/ws/files/5318626/1057210.pdf · "Vibrotactile sense in median and ulnar nerve ... [large fibre neuropathy]](https://img.pdfslide.us/doc/110x75/5b1693297f8b9a4a6d8cc088/vibrotactile-sense-in-median-071218-luplubluseluplublusesearchwsfiles5318626.jpg)