Embed Size (px)
Citation preview

Multi-level proteomics reveals host-perturbation strategies of
SARS-CoV-2 and SARS-CoV
Alexey Stukalov1*, Virginie Girault1*, Vincent Grass1*, Valter Bergant1*, Ozge Karayel2*, Christian Urban1*, Darya A. Haas1*, Yiqi Huang1, Lila Oubraham1, Anqi Wang1, Sabri M. Hamad1, Antonio Piras1, Maria Tanzer2, Fynn M. Hansen2, Thomas Enghleitner3, Maria Reinecke4, 5, Teresa M. Lavacca1, Rosina Ehmann6, 7, Roman Wölfel6, 7, Jörg Jores8, Bernhard Kuster4, 5, Ulrike Protzer1, 7, Roland Rad3, John Ziebuhr9, Volker Thiel10, Pietro Scaturro1,11, Matthias Mann2 and Andreas Pichlmair1, 7, §
1Technical University of Munich, School of Medicine, Institute of Virology, 81675 Munich, Germany, 2Department of Proteomics and Signal transduction, Max-Planck Institute of Biochemistry, Martinsried/Munich, 82152, Germany, 3Institute of Molecular Oncology and Functional Genomics and Department of Medicine II, School of Medicine, Technical University of Munich, 81675 Munich, Germany, 4Chair of Proteomics and Bioanalytics, Technical University of Munich, 85354 Freising, Germany, 5German Cancer Consortium (DKTK), Munich partner site and German Cancer Research Center, (DKFZ) Heidelberg, Germany, 6Bundeswehr Institute of Microbiology, 80937 Munich, Germany, 7German Center for Infection Research (DZIF), Munich partner site, Germany, 8Institute of Veterinary Bacteriology, Department of Infectious Diseases and Pathobiology, University of Bern, Bern, Switzerland, 9Justus Liebig University Giessen, Institute of Medical Virology, 35392 Giessen, Germany, 10Institute of Virology and Immunology (IVI), Bern, Switzerland & Department of Infectious Diseases and Pathobiology, University of Bern, Bern, Switzerland, 11Systems Arbovirology, Heinrich Pette Institute, Leibniz Institute for Experimental Virology, Hamburg, Germany.
* these authors contributed equally
§Corresponding author: Andreas Pichlmair, PhD, DVM Technical University Munich, Faculty of Medicine Institute of Virology - Viral Immunopathology Schneckenburger Str. 8 D-81675 Munich, Germany
.CC-BY 4.0 International licenseavailable under a(which was not certified by peer review) is the author/funder, who has granted bioRxiv a license to display the preprint in perpetuity. It is made
The copyright holder for this preprintthis version posted June 17, 2020. ; https://doi.org/10.1101/2020.06.17.156455doi: bioRxiv preprint

Abstract:
The sudden global emergence of SARS-CoV-2 urgently requires an in-depth understanding of
molecular functions of viral proteins and their interactions with the host proteome. Several omics
studies have extended our knowledge of COVID-19 pathophysiology, including some focused on
proteomic aspects1–3. To understand how SARS-CoV-2 and related coronaviruses manipulate the host
we here characterized interactome, proteome and signaling processes in a systems-wide manner. This
identified connections between the corresponding cellular events, revealed functional effects of the
individual viral proteins and put these findings into the context of host signaling pathways. We
investigated the closely related SARS-CoV-2 and SARS-CoV viruses as well as the influence of
SARS-CoV-2 on transcriptome, proteome, ubiquitinome and phosphoproteome of a lung-derived
human cell line. Projecting these data onto the global network of cellular interactions revealed
relationships between the perturbations taking place upon SARS-CoV-2 infection at different layers
and identified unique and common molecular mechanisms of SARS coronaviruses. The results
highlight the functionality of individual proteins as well as vulnerability hotspots of SARS-CoV-2,
which we targeted with clinically approved drugs. We exemplify this by identification of kinase
inhibitors as well as MMPase inhibitors with significant antiviral effects against SARS-CoV-2.
Main text:
To identify interactions of SARS-CoV-2 and SARS-CoV with cellular proteins, we transduced A549
lung carcinoma cells with lentiviruses expressing individual HA-tagged viral proteins (Figure 1a;
Extended data Fig. 1a; Supplementary Table 1). Affinity purification followed by mass spectrometry
analysis (AP-MS) and statistical modelling of the MS1-level quantitative data allowed identification
of 1484 interactions between 1086 cellular proteins and 24 SARS-CoV-2 and 27 SARS-CoV bait
proteins (Figure 1b; Extended data Fig. 1b; Supplementary Table 2). The resulting virus-host
interaction network revealed a wide range of cellular activities intercepted by SARS-CoV-2 and
SARS-CoV (Figure 1b; Extended data Table 1; Supplementary Table 2). In particular, we discovered
.CC-BY 4.0 International licenseavailable under a(which was not certified by peer review) is the author/funder, who has granted bioRxiv a license to display the preprint in perpetuity. It is made
The copyright holder for this preprintthis version posted June 17, 2020. ; https://doi.org/10.1101/2020.06.17.156455doi: bioRxiv preprint

that SARS-CoV-2 targets a number of key cellular regulators involved in innate immunity (ORF7b-
MAVS, -UNC93B1), stress response components (N-HSPA1A) and DNA damage response mediators
(ORF7a-ATM, -ATR) (Figure 1b; Extended data Fig. 1c - e). Overall, SARS-CoV-2 interacts with
specific protein complexes contributing to a range of biological processes (Supplementary Table 2).
To evaluate the consequences of these interactions on cellular proteostasis, we proceeded with the total
proteome analysis of A549 cells expressing the 54 individual viral proteins (Figure 1a, d;
Supplementary Table 3). The analysis of the proteome changes induced by each viral protein and
consideration of the interactions of this respective protein provided direct insights into their functions.
For instance, we confirmed that ORF9b of SARS-CoV-2 leads to a dysregulation of mitochondrial
functions (Figure 1d; Supplementary Table 3), as was previously reported for SARS-CoV4, correlating
with the binding of ORF9b of both viruses to TOMM70 (Figure 1b; Supplementary Table 2)1, a
known regulator of mitophagy5, which was not yet known for SARS-CoV ORF9b. Importantly, this
approach identified novel SARS-CoV-2 activities, such as the regulation of proteins involved in
cholesterol metabolism by NSP6 (Figure 1d; Supplementary Table 3). Despite the high similarity of
SARS-CoV-2 and SARS-CoV6, these datasets allow to discriminate the commonalities and differences
of both viruses, which may in part explain the characteristics in pathogenicity and transmission
capabilities. By comparing the AP-MS data of homologous SARS-CoV-2 and SARS-CoV proteins,
we identified significant differences in the enrichment of individual host targets, highlighting potential
virus-specific interactions (Figure 1b (edge color); Figure 1c; Extended data Fig. 1f - h;
Supplementary Table 2). For instance, we could recapitulate the known interaction between SARS-
CoV NSP2 and prohibitins (PHB, PHB2)7, whereas their enrichment was not observed for NSP2 of
SARS-CoV-2 (Extended data Fig. 1g). Alternatively, we found that ORF8 of SARS-CoV-2, but not its
SARS-CoV homolog, binds specifically to the TGFB1-LTBP1 complex (Extended data Fig. 1f, h).
To obtain information on the concerted activity of the viral proteins during infection, we infected
ACE2-expressing A549 cells (Extended data Fig. 2a-b) with SARS-CoV-2, and profiled the impact of
viral infection on mRNA transcription, protein abundance, ubiquitination and phosphorylation in a
time-resolved manner (Figure 2a – e; Supplementary Tables 4 - 7; Methods). In line with previous
reports8,9, we did not observe major upregulation of type-I interferons and related genes at the mRNA
.CC-BY 4.0 International licenseavailable under a(which was not certified by peer review) is the author/funder, who has granted bioRxiv a license to display the preprint in perpetuity. It is made
The copyright holder for this preprintthis version posted June 17, 2020. ; https://doi.org/10.1101/2020.06.17.156455doi: bioRxiv preprint
level (e.g. IFNB, IFIT3, MX1; Extended data Fig. 2c – d; Supplementary Table 4), suggesting active
viral inhibition of this system. In contrast, SARS-CoV-2 upregulated NF-κB and stress responses, as
inferred from the induction of IL6, CXCL2 and JUNs and transcription factor enrichment analysis
(Extended data Fig. 2c – e; Supplementary Tables 4, 8; Methods). At the proteome level, we found
1053 regulated proteins (Figure 2a - b). Most notably, SARS-CoV-2 infection failed to induce an
interferon response pattern indicative for an appropriate cellular antiviral response in this dataset
(Extended data Fig. 2f; Supplementary Table 5). We complemented these data with global MS
analysis of protein ubiquitination, which revealed 884 sites that were differentially regulated after
SARS-CoV-2 infection (Figure 2a and c, Extended data Fig. 2f; Supplementary Table 6). A number of
proteins displayed both differential abundance and dynamic ubiquitination patterns in an infection-
dependent manner (e.g. mediators of caveolar-mediated endocytosis signaling) (Figure 2c; Extended
data Fig. 2f; Supplementary Tables 5, 6, 8). Notably, EFNB1, POLR2B, TYMS and DHFR showed
concomitant ubiquitination and a decrease at the protein level (Figure 2c; Extended data Fig. 2f;
Supplementary Tables 5, 6). Moreover, we identified two upregulated ubiquitination sites on ACE2,
including one previously unknown (K702) (Figure 2c; Extended data Fig. 2f - i), suggesting an
alternative post-translational mechanism of its degradation upon SARS-CoV-2 infection besides the
cleavage by matrix metalloproteinases10,11. We identified multiple yet undescribed ubiquitination sites
on viral proteins, which may be tied to the interactions with several E3 ligases observed in the
interactome (e.g. ORF3 and TRIM47, WWP1/2, STUB1; M and TRIM7; NSP13 and RING1)
(Extended data Fig. 2j; Supplementary Table 2, 6) and likely indicative of cross-talks between
ubiquitination and viral protein functions. Moreover, in the phosphoproteomic analysis, we mapped
multiple novel phosphorylation sites on viral proteins (M, N, S and ORF9b), which correspond to
known recognition motifs of GSK3, CSNKs, GPCR, AKT, CAMKs, and ERKs (Extended data Fig.
2k; Supplementary Table 7). Of 11,847 total quantified phosphorylation sites, 1483 showed significant
changes after SARS-CoV-2 infection (Extended data Fig. 2l; Supplementary Table 7). The regulation
of known phosphosites suggests an involvement of central kinases known to modulate key cellular
pathways, e.g. EPHA2 – focal adhesion, RPS6Ks – cell survival, CDKs – cell cycle progression, AKT
– cell growth, survival and motility, p38, JNK, ERK – stress responses, ATM, and CHEK1/2 – DNA
.CC-BY 4.0 International licenseavailable under a(which was not certified by peer review) is the author/funder, who has granted bioRxiv a license to display the preprint in perpetuity. It is made
The copyright holder for this preprintthis version posted June 17, 2020. ; https://doi.org/10.1101/2020.06.17.156455doi: bioRxiv preprint
damage response, during virus infection (Extended data Fig. 2l, m; Supplementary Tables 7, 8).
Intriguingly, we could also observe an interplay of phosphorylation and ubiquitination on YAP1, a
downstream regulatory target of Hippo signaling (Figure 2d), underlining the value of testing different
post-translational modifications simultaneously. Combining these datasets, describing different aspects
of SARS-CoV-2 infection, allowed us to determine the key pathways perturbed during the infection,
such as stress and DNA damage response, regulation of transcription and cell junction organization, at
various levels (Figure 2e, see Methods).
The systematic interactome and proteome profiling of individual viral proteins provided us with the
opportunity to gain deeper understanding of their molecular mechanisms. For each viral protein, we
mapped the collected data onto the global network of cellular interactions12 and applied a network
diffusion approach13. Such analysis identifies short links of known protein-protein interactions,
signaling and regulation events that connect the interactors of the viral protein with the proteins
affected by its expression (Figure 3a, Extended data Fig. 3a, b; Supplementary Data 1).The
connections predicted using the real data were significantly shorter than for the randomized data,
confirming both relevance of the approach and the data quality (Extended data Fig. 3a, b). Amongst
many other findings, this approach pointed towards the potential mechanisms of autophagy regulation
by ORF3 and NSP6; the modulation of innate immunity by M, ORF3 and ORF7b; and the Integrin-
TGFβ-EGFR-RTK signaling perturbation by ORF8 of SARS-CoV-2 (Figure 3b - d, Supplementary
Data 1). Enriching these subnetworks with the SARS-CoV-2 infection-dependent mRNA abundance,
protein abundance, phosphorylation and ubiquitination (Figure 3a) allowed us to gain unprecedented
insights into the regulatory mechanisms employed by SARS-CoV-2 (Figure 3e, Extended data Fig. 3c,
e). For instance, this analysis confirmed a role of NSP6 in autophagy14 and revealed a significant
inhibition of autophagic flux by ORF3 leading to the accumulation of autophagy receptors (SQSTM1,
GABARAPL2, NBR1, CALCOCO2, MAP1LC3B, TAX1BP1), also observed in virus-infected cells
(SQSTM1, MAP1LC3B) (Figure 3e - i). This inhibition may be explained by the interaction of ORF3
with the HOPS complex (VPS11, -16, -18, -39, -41), which is essential for autophagosome-lysosome
fusion, as well as by the differential phosphorylation of regulatory sites of key components (AKT1,
AKT1S1, SQSTM1, RPS6). The inhibition of the interferon response observed at transcriptional and
.CC-BY 4.0 International licenseavailable under a(which was not certified by peer review) is the author/funder, who has granted bioRxiv a license to display the preprint in perpetuity. It is made
The copyright holder for this preprintthis version posted June 17, 2020. ; https://doi.org/10.1101/2020.06.17.156455doi: bioRxiv preprint

proteome levels was similarly explained by the network diffusion analysis (Extended data Fig. 3c),
demonstrating that multiple proteins of SARS-CoV-2 are employed in the disruption of antiviral
immunity. Additional functional experiments corroborated the inhibition of interferon induction or
signaling by ORF3, ORF6, ORF7a, ORF7b, ORF9b (Extended data Fig. 3d). Upon virus infection, we
observed upregulation of TGFβ and EGFR pathways, which modulate cell survival, motility and
innate immune responses (Extended data Fig. 3e - g). Besides promoting virus replication, activation
of these pathways has been implicated in fibrosis15,16, one of the hallmarks of COVID-1917.
Specifically, our network diffusion analysis revealed the connection between the binding of ORF8 and
ORF3 to TGFβ-associated factors (TGFB1, TGFB2, LTBP1, TGFBR2, FURIN, BAMBI) and the
virus-induced upregulation of fibrinogens, fibronectin, SERPINE1 and integrin(s) (Extended data Fig.
3e, h)18. The phosphorylation of SMAD1/5, and ERK, JNK, p38 cascade activation, as well as an
increased expression of MMPs, DUSPs, JUN, and EGR1 are indicative of TGFβ and EGFR pathway
regulation. In turn, they are known to be potentiated by the increased integrin signaling and activation
of YAP-dependent transcription19, which we observed upon SARS-CoV-2 infection (Extended data
Fig. 3e).
Taken together, the viral-host protein-protein interactions and pathway regulations observed at
multiple levels identify potential vulnerability points of SARS-CoV-2 that could be targeted by well-
characterized selective drugs for antiviral therapies. To test their antiviral efficacy, we established
time-lapse fluorescent microscopy of SARS-CoV-2 GFP-reporter virus infection20. Inhibition of virus
replication by type-I interferon treatment corroborated the necessity for SARS-CoV-2 to block this
pathway and confirmed the reliability of this screening approach (Figure 4a)9,21. We tested a panel of
48 drugs modulating the pathways perturbed by the virus for their effects on SARS-CoV-2 replication
(Figure 4b, Supplementary Table 9). Notably, B-RAF (Sorafenib, Regorafenib, Dabrafenib), JAK1/2
(Baricitinib) and MAPK (SB 239063) inhibitors, among others, led to a significant increase of virus
growth in our in vitro infection setting (Figure 4b, Extended data Fig. 4, Supplementary Table 9). In
contrast, inducers of DNA damage (Tirapazamine, Rabusertib) or the mTOR inhibitor (Rapamycin)
led to suppression of the virus. The highest antiviral effect was seen for Gilteritinib (a designated
FLT3/AXL inhibitor), Ipatasertib (AKT inhibitor), Prinomastat and Marimastat (matrix
.CC-BY 4.0 International licenseavailable under a(which was not certified by peer review) is the author/funder, who has granted bioRxiv a license to display the preprint in perpetuity. It is made
The copyright holder for this preprintthis version posted June 17, 2020. ; https://doi.org/10.1101/2020.06.17.156455doi: bioRxiv preprint
metalloproteinases inhibitors) (Figure 4b - e, Extended data Fig. 4, Supplementary Table 9).
Remarkably, these compounds profoundly inhibited replication of SARS-CoV-2 while having no or
minor influence on cell growth (Extended data Fig. 4, Supplementary Table 9). These inhibitors may
perturb host pathways required by the virus or influence viral protein activity through post-
translational modifications. Notably, we identified AKT as a potential kinase phosphorylating SARS-
CoV-2 protein N (Extended data Fig. 2k), indicating the possibility of a direct influence of Ipatasertib
on the viral protein.
This drug screen demonstrates the value of our combined dataset that profiles the infection of SARS-
CoV-2 at multiple levels. Further exploration of these rich data by the scientific community and
investigating the interplay between different -omics levels will substantially advance our knowledge of
coronavirus biology, in particular on the pathogenicity caused by highly virulent strains such as
SARS-CoV-2 and SARS-CoV. Moreover, this resource may streamline the search for antiviral
compounds and serve as a base for intelligent design of combination therapies that aim at targeting the
virus from multiple, synergistic angles, thus potentiating the effect of individual drugs while
minimizing side-effects on healthy tissues.
.CC-BY 4.0 International licenseavailable under a(which was not certified by peer review) is the author/funder, who has granted bioRxiv a license to display the preprint in perpetuity. It is made
The copyright holder for this preprintthis version posted June 17, 2020. ; https://doi.org/10.1101/2020.06.17.156455doi: bioRxiv preprint
Acknowledgements
We thank Stefan Pöhlmann for sharing ACE2 plasmids and Robert Baier for technical assistance, Juan
Pancorbo and Johannes Albert-von der Gönna from the Leibniz Supercomputing Centre (www.lrz.de)
for technical assistance. We further thank the Karl Max von Bauernfeind - Verein for support for the
screening microscope. Work in the author’s laboratories was supported by an ERC consolidator grant
(ERC-CoG ProDAP, 817798), the German Research Foundation (PI 1084/3, PI 1084/4) and the
German Federal Ministry of Education and Research (COVINET) to A.P. This work was also
supported by the German Federal Ministry of Education and Research (CLINSPECT-M) to BK. AW
was supported by the China Scholarship Council (CSC). The work of J.Z. was supported by the
German Research Foundation (SFB1021, A01 and B01; KFO309, P3), the State of Hessen through the
LOEWE Program (DRUID, B02) and the German Ministry for Education and Research (COVINET).
.CC-BY 4.0 International licenseavailable under a(which was not certified by peer review) is the author/funder, who has granted bioRxiv a license to display the preprint in perpetuity. It is made
The copyright holder for this preprintthis version posted June 17, 2020. ; https://doi.org/10.1101/2020.06.17.156455doi: bioRxiv preprint

Figure legends:
Figure 1 | Joint analysis of SARS-CoV-2 and SARS-CoV protein-protein virus-host
interactomes. (a) Experimental design to systematically compare the AP-MS interactomes and
induced host proteome changes of the homologous SARS-CoV-2 and SARS-CoV viral proteins, with
ORF3 homologs of HCoV-NL63 and HCoV-229E as reference for pan coronavirus specificity. (b)
Combined virus-host protein interaction network of SARS-CoV-2 and SARS-CoV measured by
affinity-purification coupled to mass spectrometry. Homolog viral proteins are displayed as one node.
Shared and virus-specific interactions are denoted by the edge color. (c) The numbers of unique and
shared host interactions between the homologous proteins of SARS-CoV-2 and SARS-CoV. (d) Gene
Ontology Biological Processes enriched among the cellular proteins that are up- (red arrow) or down-
(blue arrow) regulated upon overexpression of individual viral proteins.
Figure 2 | Orthogonal profiling of SARS-CoV-2 infection. (a) Time-resolved profiling of SARS-
CoV-2 infection by multiple -omics methods. The plot shows normalized MS intensities of three
SARS-CoV-2 viral proteins over time. (b) Numbers of distinct transcripts, proteins, ubiquitination and
phosphorylation sites, up- or down-regulated at the indicated time points after infection, as identified
using data independent (DIA) or dependent (DDA) acquisition methods. (c) Volcano plot showing
ubiquitination sites regulated at 24h after SARS-CoV-2 infection. Viral proteins are marked in orange.
Selected significant ubiquitination sites (Student’s t-test, two-tailed, permutation-based FDR < 0.05,
S0 = 0.1, n = 4) are marked in black. (d) Scatter plot of phosphorylation and ubiquitination sites on
Yes-associated protein (YAP1) regulated upon SARS-CoV-2 infection. Presented are fold changes
compared to mock at 6, 24, and 30 hours after infection. S61 and S127 dephosphorylation lead to
nuclear translocation, S131 phosphorylation regulates protein stability. Phosphorylation of S289 and
S367 is involved in cell cycle regulation. K321 deubiquitination leads to a decrease in YAP1
activation. (e) Reactome pathways enriched in up- (red arrow) or downregulated (blue arrow)
transcripts, proteins, ubiquitination- and phosphorylation sites (Fisher’s exact test, unadjusted). DIA
MS measurements are marked in grey, DDA in black.
.CC-BY 4.0 International licenseavailable under a(which was not certified by peer review) is the author/funder, who has granted bioRxiv a license to display the preprint in perpetuity. It is made
The copyright holder for this preprintthis version posted June 17, 2020. ; https://doi.org/10.1101/2020.06.17.156455doi: bioRxiv preprint
Figure 3 | Network diffusion approach identifies molecular pathways linking protein-protein
interactions with downstream changes in the host proteome. (a) Network diffusion approach to
identify functional connections between the host targets of a viral protein and downstream proteome
changes followed by the integration of RNA expression, protein abundance, ubiquitination and
phosphorylation changes upon SARS-CoV-2 infection to streamline the identification of affected host
pathways. (b-d) Subnetworks of the network diffusion predictions linking host targets of (b) SARS-
CoV-2 ORF3 to the accumulation of factors involved in autophagy, (c) ORF7b to the factors involved
in innate immunity and (d) ORF8 to the factors involved in TGFβ signaling. (e) Overview of
perturbations to host-cell autophagy, induced by distinct proteins of SARS-CoV-2, derived from the
network diffusion model and overlaid with the changes in protein levels, ubiquitination and
phosphorylation induced by SARS-CoV-2 infection. (f-i) Western blot of autophagy-associated factors
MAP1LC3B-II and SQSTM1 accumulation upon SARS-CoV-2 ORF3 expression in (f) HEK293R1
and (g-i) SARS-CoV-2 infection of A549-ACE2 cells. (h) Profile plot of SQSTM1 MS intensity and
(i) line diagram showing SQSTM1 mRNA level relative to RPLP0 tested by qRT-PCR upon SARS-
CoV-2 infection.
Figure 4 | SARS-CoV-2-targeted pathways, revealed by multi-omics profiling approach, allow
systematic testing of novel antiviral therapies. (a) A549-ACE2 cells, exposed for 6h to the specified
concentrations of interferon alpha and infected with SARS-CoV-2-GFP reporter virus (MOI 3). GFP
signal and cell confluency were analysed by live-cell imaging for 48h. Line diagrams show virus
growth over time of GFP-positive vs total cell area with indicated mean of four biological replicates.
(b) A549-ACE2 cells were treated with the indicated drugs 6h prior to infection with SARS-CoV-2-
GFP (MOI 3). Scatter plot represents GFP vs total cell area signal (y-axis) versus cell confluency in
uninfected control treatments (x-axis) at 48h after infection. A confluence cutoff of -0.2 log2 fold
change was applied to remove cytotoxic compounds. (c-e) as (a) but line diagrams showing virus
replication after (c) Prinomastat, (d) Ipatasertib and (e) Gilteritinib pre-treatment. Asterisks indicate
significance to control treatment (Wilcoxon test; p-value ≤ 0.01).
.CC-BY 4.0 International licenseavailable under a(which was not certified by peer review) is the author/funder, who has granted bioRxiv a license to display the preprint in perpetuity. It is made
The copyright holder for this preprintthis version posted June 17, 2020. ; https://doi.org/10.1101/2020.06.17.156455doi: bioRxiv preprint
Extended data Figure 1 | Expression of viral proteins in transduced A549 cells induces changes
to the host proteome.
(a) Expression of HA-tagged viral proteins, in stably transduced A549 cells, used in AP-MS and
proteome expression measurements. (b) The extended version of the virus-host protein-protein
interaction network with 24 SARS-CoV-2 and 27 SARS-CoV proteins, as well as ORF3 of HCoV-
NL63 and ORF4 and 4a of HCoV-229E, used as baits. Host targets regulated upon viral protein
overexpression or SARS-CoV-2 infection (based on the analysis of all data of this study) are
highlighted (see the in-plot legend). (c-f) Co-precipitation experiments in HEK 293T cells showing a
specific enrichment of (c) endogenous MAVS co-precipitated with c-term HA-tagged ORF7b of
SARS-CoV-2 and SARS-CoV (negative controls: SARS-CoV-2 ORF6-HA, ORF7a-HA), (d) ORF7b-
HA of SARS-CoV-2 and SARS-CoV co-precipitated with SII-HA-UNC93B1 (control precipitation:
SII-HA-RSAD2), (e) endogenous HSPA1A co-precipitated with N-HA of SARS-CoV-2 and SARS-
CoV (control: SARS-CoV-2 ORF6-HA) and (f) endogenous TGFβ with ORF8-HA of SARS-CoV-2
vs ORF8-HA, ORF8a-HA, ORF8b-HA of SARS-CoV or ORF9b-HA of SARS-CoV-2. (g, h)
Differential enrichment of proteins in (g) NSP2 and (h) ORF8 of SARS-CoV-2 (x-axis) vs SARS-CoV
(y-axis) AP-MS experiments.
Extended data Table 1 | Functional annotations of the protein-protein interaction network of
SARS-CoV-2 and SARS-CoV (AP-MS). Proteins identified as SARS-CoV-2 and/or SARS-CoV host
binders via AP-MS (Figure 1b) were assemble in functional groups based on functional enrichment
analysis of GOBP, GPCC, GPMF and Reactome terms (Supplementary table 2)
Extended data Figure 2 | Validation of the in vitro SARS-CoV-2 infection model and tracking of
virus-specific changes at the multi-omics level. (a) Western blot showing ACE2-HA expression
levels in A549 cells untransduced (wt) or transduced with ACE2-HA encoding lentivirus. (b) mRNA
expression levels of SARS-CoV-2 N relative to RPLP0 as measured by qRT-PCR upon infection of wt
A549 and A549-ACE2 cells at the indicated MOIs. Mean +/- standard deviation of three biological
replicates are shown. (c) Volcano plot of mRNA expression changes of A549-ACE2 cells, infected
with SARS-CoV-2 at an MOI of 3, shown as a fold change versus mock at 24 h.p.i.. Selected
.CC-BY 4.0 International licenseavailable under a(which was not certified by peer review) is the author/funder, who has granted bioRxiv a license to display the preprint in perpetuity. It is made
The copyright holder for this preprintthis version posted June 17, 2020. ; https://doi.org/10.1101/2020.06.17.156455doi: bioRxiv preprint
significant hits are marked in black (Wald test, n=3). (d) Expression levels, as measured by qRT-PCR,
of SARS-CoV-2 N and host transcripts relative to RPLP0 after infection of A549-ACE2 cells at MOI
of 3 at indicated time points after infection with indicated mean +/- standard deviation (n=3). ND: not
detectable. (e) Transcription factor enrichment analysis of up- (red arrow) and down- (blue arrow)
regulated genes in A549-ACE2 cells infected with SARS-CoV-2 for indicated time periods (Fisher’s
exact test, unadjusted). (f) Volcano plot of protein abundance changes at 24 h.p.i. in comparison to
mock measured by proteome profiling (DDA MS). Viral proteins are highlighted in orange, selected
significant hits are marked in black (Student’s t-test, two-tailed, permutation-based FDR < 0.05, S0 =
0.1, n = 4). (g) Total levels of ACE2 protein at 6 and 24 hours (top) and its ubiquitination at indicated
sites (bottom) at 24 hours after infection with SARS-CoV-2 as measured by proteome and diGly
proteome profiling (DDA MS). (h) Western blot showing the expression levels of SARS-CoV-2
proteins, ACE2-HA and ACTB in A549-ACE2 cells at indicated time points post-infection with
SARS-CoV-2 compared to mock. (i) Stable expression of ACE2 mRNA transcript relative to RPLP0,
as measured by qRT-PCR, after SARS-CoV-2 infection (MOI 3) of A549-ACE2 cells at indicated
time points post-infection with indicated mean +/- standard deviation of three biological replicates. (j)
Mapping the ubiquitination sites of SARS-CoV-2 proteins and measuring their regulation (DDA MS
of diGly PTMs) in SARS-CoV-2-infected A549-ACE2 cells (MOI 3) at 24 h.p.i., highlighting the
binding of TRIM47 to SARS-CoV-2 ORF3 and TRIM7 to SARS-CoV-2 M as examples of potential
E3 ubiquitin ligases driving ubiquitination and associated with the shown proteins. (k) Mapping the
phosphorylation sites of SARS-CoV-2 N and measuring their regulation (DDA MS) in SARS-CoV-2-
infected A549-ACE2 cells (MOI 3) at 24 h.p.i.. The host kinases potentially driving the
phosphorylation on the shown sites are indicated. (l) Volcano plot of phosphorylation sites regulation
indicated as a log2 -fold change compared to mock as measured by phosphoproteome profiling (DDA
MS). Viral proteins are marked in orange. Selected significant hits (Student’s t-test, two-tailed,
permutation-based FDR < 0.05, S0 = 0.5, n = 3) are marked in black. (m) The enrichment of host
kinases known to regulate the phosphorylation sites identified by phosphoproteome profiling (DIA and
DDA MS) of infected A549-ACE2 cells (MOI 3) at the indicated time points after infection (Fisher’s
exact test, unadjusted). DIA measurements are marked in grey, DDA in black.
.CC-BY 4.0 International licenseavailable under a(which was not certified by peer review) is the author/funder, who has granted bioRxiv a license to display the preprint in perpetuity. It is made
The copyright holder for this preprintthis version posted June 17, 2020. ; https://doi.org/10.1101/2020.06.17.156455doi: bioRxiv preprint
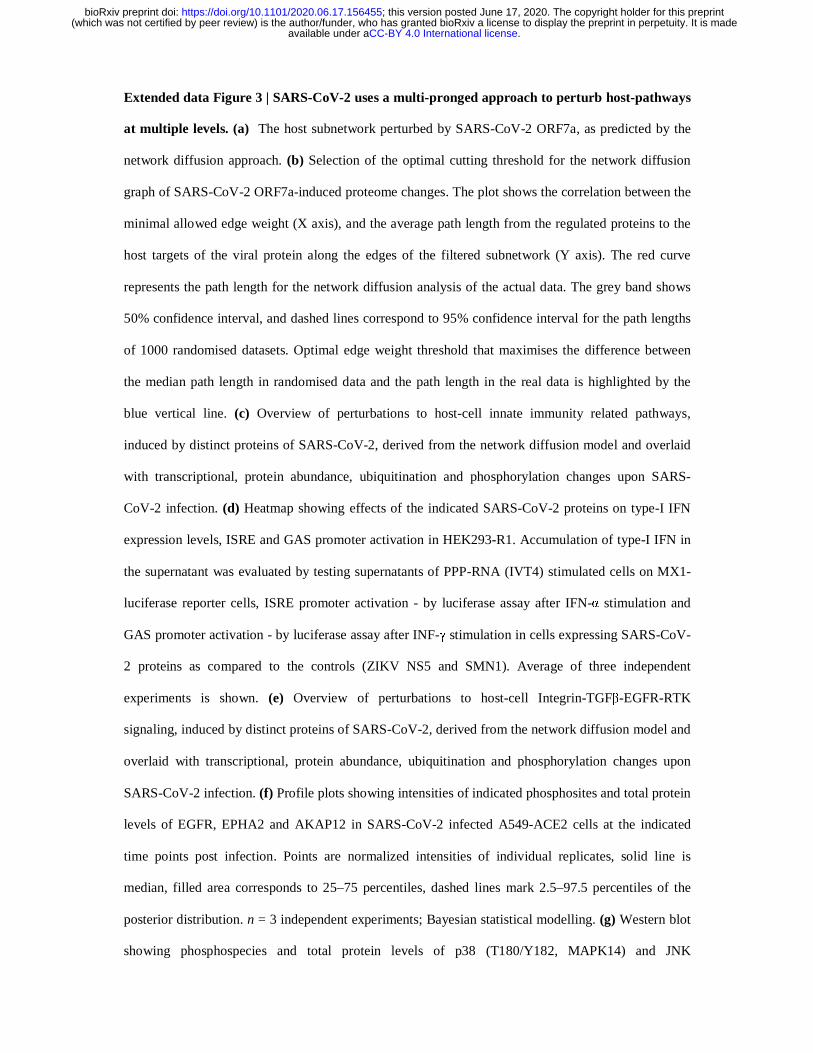
Extended data Figure 3 | SARS-CoV-2 uses a multi-pronged approach to perturb host-pathways
at multiple levels. (a) The host subnetwork perturbed by SARS-CoV-2 ORF7a, as predicted by the
network diffusion approach. (b) Selection of the optimal cutting threshold for the network diffusion
graph of SARS-CoV-2 ORF7a-induced proteome changes. The plot shows the correlation between the
minimal allowed edge weight (X axis), and the average path length from the regulated proteins to the
host targets of the viral protein along the edges of the filtered subnetwork (Y axis). The red curve
represents the path length for the network diffusion analysis of the actual data. The grey band shows
50% confidence interval, and dashed lines correspond to 95% confidence interval for the path lengths
of 1000 randomised datasets. Optimal edge weight threshold that maximises the difference between
the median path length in randomised data and the path length in the real data is highlighted by the
blue vertical line. (c) Overview of perturbations to host-cell innate immunity related pathways,
induced by distinct proteins of SARS-CoV-2, derived from the network diffusion model and overlaid
with transcriptional, protein abundance, ubiquitination and phosphorylation changes upon SARS-
CoV-2 infection. (d) Heatmap showing effects of the indicated SARS-CoV-2 proteins on type-I IFN
expression levels, ISRE and GAS promoter activation in HEK293-R1. Accumulation of type-I IFN in
the supernatant was evaluated by testing supernatants of PPP-RNA (IVT4) stimulated cells on MX1-
luciferase reporter cells, ISRE promoter activation - by luciferase assay after IFN-α stimulation and
GAS promoter activation - by luciferase assay after INF-γ stimulation in cells expressing SARS-CoV-
2 proteins as compared to the controls (ZIKV NS5 and SMN1). Average of three independent
experiments is shown. (e) Overview of perturbations to host-cell Integrin-TGFβ-EGFR-RTK
signaling, induced by distinct proteins of SARS-CoV-2, derived from the network diffusion model and
overlaid with transcriptional, protein abundance, ubiquitination and phosphorylation changes upon
SARS-CoV-2 infection. (f) Profile plots showing intensities of indicated phosphosites and total protein
levels of EGFR, EPHA2 and AKAP12 in SARS-CoV-2 infected A549-ACE2 cells at the indicated
time points post infection. Points are normalized intensities of individual replicates, solid line is
median, filled area corresponds to 25–75 percentiles, dashed lines mark 2.5–97.5 percentiles of the
posterior distribution. n = 3 independent experiments; Bayesian statistical modelling. (g) Western blot
showing phosphospecies and total protein levels of p38 (T180/Y182, MAPK14) and JNK
.CC-BY 4.0 International licenseavailable under a(which was not certified by peer review) is the author/funder, who has granted bioRxiv a license to display the preprint in perpetuity. It is made
The copyright holder for this preprintthis version posted June 17, 2020. ; https://doi.org/10.1101/2020.06.17.156455doi: bioRxiv preprint
(T183/Y185, MAPK8) in SARS-CoV-2 infected A549-ACE2 cells. (h) Profile plots of total protein
levels of ITGA3, SERPINE1 and FN1 in SARS-CoV-2 infected A549-ACE2 cells at 6 and 24 hours
post infection with indicated median and confidence intervals. n = 4 independent experiments.
Extended data Figure 4 | Drug screen, focusing on pathways perturbed by SARS-CoV-2 on
several levels, reveals potential candidates for use in antiviral therapy. (a) A549-ACE2 cells were
pre-treated for 6h or treated at the time of infection with SARS-CoV-2-GFP reporter virus (MOI 3).
GFP signal and cell growth were evaluated for 48h by live cell imaging using an Incucyte S3 platform.
Heatmap show the cell growth rate over time in uninfected conditions, and GFP signal vs total cell
confluency and normalized to the signal measured in control treatment (water, DMSO), over time.
Only treatments with significant effects on SARS-CoV-2-GFP are shown. Asterisks indicate
significance to control treatment (Wilcoxon test; p-value ≤ 0.05).
References
1. Gordon, D. E. et al. A SARS-CoV-2 protein interaction map reveals targets for drug repurposing. Nature 1–13 (2020) doi:10.1038/s41586-020-2286-9.
2. Bojkova, D. et al. Proteomics of SARS-CoV-2-infected host cells reveals therapy targets. Nature 1–8 (2020) doi:10.1038/s41586-020-2332-7.
3. Messner, C. B. et al. Ultra-high-throughput clinical proteomics reveals classifiers of COVID-19 infection. Cell Systems (2020) doi:10.1016/j.cels.2020.05.012.
4. Shi, C.-S. et al. SARS-Coronavirus Open Reading Frame-9b Suppresses Innate Immunity by Targeting Mitochondria and the MAVS/TRAF3/TRAF6 Signalosome. The Journal of Immunology 193, 3080–3089 (2014).
5. Heo, J.-M. et al. Integrated proteogenetic analysis reveals the landscape of a mitochondrial-autophagosome synapse during PARK2-dependent mitophagy. Science Advances 5, eaay4624 (2019).
6. Lu, R. et al. Genomic characterisation and epidemiology of 2019 novel coronavirus: implications for virus origins and receptor binding. The Lancet 395, 565–574 (2020).
7. Cornillez-Ty, C. T., Liao, L., Yates, J. R., Kuhn, P. & Buchmeier, M. J. Severe Acute Respiratory Syndrome Coronavirus Nonstructural Protein 2 Interacts with a Host Protein Complex Involved in Mitochondrial Biogenesis and Intracellular Signaling. Journal of Virology 83, 10314–10318 (2009).
8. Chu, H. et al. Comparative replication and immune activation profiles of SARS-CoV-2 and SARS-CoV in human lungs: an ex vivo study with implications for the pathogenesis of COVID-19. Clin Infect Dis doi:10.1093/cid/ciaa410.
.CC-BY 4.0 International licenseavailable under a(which was not certified by peer review) is the author/funder, who has granted bioRxiv a license to display the preprint in perpetuity. It is made
The copyright holder for this preprintthis version posted June 17, 2020. ; https://doi.org/10.1101/2020.06.17.156455doi: bioRxiv preprint
9. Blanco-Melo, D. et al. Imbalanced Host Response to SARS-CoV-2 Drives Development of COVID-19. Cell 181, 1036-1045.e9 (2020).
10. Heurich, A. et al. TMPRSS2 and ADAM17 Cleave ACE2 Differentially and Only Proteolysis by TMPRSS2 Augments Entry Driven by the Severe Acute Respiratory Syndrome Coronavirus Spike Protein. J Virol 88, 1293–1307 (2014).
11. Lambert, D. W. et al. Tumor Necrosis Factor-α Convertase (ADAM17) Mediates Regulated Ectodomain Shedding of the Severe-acute Respiratory Syndrome-Coronavirus (SARS-CoV) Receptor, Angiotensin-converting Enzyme-2 (ACE2). J. Biol. Chem. 280, 30113–30119 (2005).
12. Wu, G., Dawson, E., Duong, A., Haw, R. & Stein, L. ReactomeFIViz: a Cytoscape app for pathway and network-based data analysis. F1000Res 3, 146 (2014).
13. Reyna, M. A., Leiserson, M. D. M. & Raphael, B. J. Hierarchical HotNet: identifying hierarchies of altered subnetworks. Bioinformatics 34, i972–i980 (2018).
14. Cottam, E. M., Whelband, M. C. & Wileman, T. Coronavirus NSP6 restricts autophagosome expansion. Autophagy 10, 1426–1441 (2014).
15. Andrianifahanana, M. et al. ERBB receptor activation is required for profibrotic responses to transforming growth factor beta. Cancer Res. 70, 7421–7430 (2010).
16. Pittet, J.-F. et al. TGF-β is a critical mediator of acute lung injury. J Clin Invest 107, 1537–1544 (2001).
17. Mo, X. et al. Abnormal pulmonary function in COVID-19 patients at time of hospital discharge. European Respiratory Journal (2020) doi:10.1183/13993003.01217-2020.
18. Zavadil, J. et al. Genetic programs of epithelial cell plasticity directed by transforming growth factor-β. Proc Natl Acad Sci U S A 98, 6686–6691 (2001).
19. Qin, Z., Xia, W., Fisher, G. J., Voorhees, J. J. & Quan, T. YAP/TAZ regulates TGF-β/Smad3 signaling by induction of Smad7 via AP-1 in human skin dermal fibroblasts. Cell Commun. Signal 16, 18 (2018).
20. Thao, T. T. N. et al. Rapid reconstruction of SARS-CoV-2 using a synthetic genomics platform. Nature 1–8 (2020) doi:10.1038/s41586-020-2294-9.
21. Mantlo, E., Bukreyeva, N., Maruyama, J., Paessler, S. & Huang, C. Antiviral activities of type I interferons to SARS-CoV-2 infection. Antiviral Res 179, 104811 (2020).
Material and Methods Cell lines and reagents
HEK293T, A549, Vero E6 and HEK293R1 cells and their respective culturing conditions were described previously22. All cell lines were tested to be mycoplasma-free. Expression constructs for C-terminal HA tagged viral ORFs were synthesised (Twist Bioscience and BioCat) and cloned into pWPI vector as described previously23 with the following modifications: starting ATG codon was added, internal canonical splicing sites were replaced with synonymous mutations and C-terminal HA-tag, followed by amber stop codon, was added to individual viral open reading frames. C-terminally hemagglutinin(HA)-tagged ACE2 sequence was amplified from an ACE2 expression vector (kindly provided by Stefan Pöhlmann)24 into the lentiviral vector pWPI-puro. A549 cells were transduced twice, and ACE2-expressing A549 (ACE2-A549) cells were selected with puromycin. Lentiviruses
.CC-BY 4.0 International licenseavailable under a(which was not certified by peer review) is the author/funder, who has granted bioRxiv a license to display the preprint in perpetuity. It is made
The copyright holder for this preprintthis version posted June 17, 2020. ; https://doi.org/10.1101/2020.06.17.156455doi: bioRxiv preprint
production, transduction of cells and antibiotic selection were performed as described previously23. RNA-isolation (Macherey-Nagel NucleoSpin RNA plus), reverse transcription (TaKaRa Bio PrimeScript RT with gDNA eraser) and RT-qPCR (Thermo-Fisher Scientific PowerUp SYBR green) were performed as described previously25. RNA-isolation for NGS applications was performed according to manufacturer’s protocol (Qiagen RNeasy mini kit, RNase free DNase set). For detection of protein abundance by western blotting, HA-HRP (Sigma-Aldrich), ACTB-HRP (Santa Cruz), ATM, MAP1LC3B, MAVS, HSPA1A, TGFβ and SQSTM1, phospho-JNK (T183/Y185), JNK, phospho-p38 (T180/Y182), p38 (Cell Signaling), SARS-CoV-2 (Sino Biological) antibodies were used. For AP-MS and AP-WB applications, HA-beads (Sigma-Aldrich and Thermo Fisher Scientific) and Streptactin II beads (IBA Lifesciences) were used. Secondary Abs: HRP and WB imaging was performed as described previously25. For the stimulation of cells in the reporter assay, recombinant human interferon-α (IFN-α) was a kind gift from Peter Stäheli, recombinant human IFN-γ were purchased from PeproTech and IVT4 was produced as described before26. All compounds tested during the viral inhibitor assay are listed in Suppl. Table 9.
Virus strains, stock preparation, plaque assay and in vitro infection
SARS-CoV-2-MUC-IMB-1 and SARS-CoV-2-GFP strains20 were produced by infecting Vero E6 cells cultured in DMEM medium (10% FCS, 100 ug/ml Streptomycin, 100 IU/ml Penicillin) for 2 days (MOI 0,01). Viral stock was harvested and spun twice (1000g/10min) before storage at -80°C.Titer of viral stock was determined by plaque assay. Confluent monolayers of VeroE6 cells were infected with serial five-fold dilutions of virus supernatants for 1 h at 37�°C. The inoculum was removed and replaced with serum-free MEM (Gibco, Life Technologies) containing 0.5% carboxymethylcellulose (Sigma-Aldrich). Two days post-infection, cells were fixed for 20 minutes at room temperature with formaldehyde directly added to the medium to a final concentration of 5%. Fixed cells were washed extensively with PBS before staining with H2O containing 1% crystal violet and 10% ethanol for 20 minutes. After rinsing with PBS, the number of plaques was counted and the virus titer was calculated.
A549-ACE2 cells were infected with SARS-CoV-2-MUC-IMB-1 strain (MOI 3) for the subsequent experiments. At each time point, the samples were washed once with 1x TBS buffer and harvested in SDC lysis buffer (100 mM Tris HCl pH 8.5; 4% SDC) or 1x SSB lysis buffer (62.5 mM Tris HCl pH 6.8; 2% SDS; 10% glycerol; 50 mM DTT; 0.01% bromophenol blue) or RLT (Qiagen) for proteome-phosphoproteome-ubiquitinome,western blot, and transcriptome analyses, respectively. The samples were heat-inactivated and frozen at -80°C until further processing, as described in the following sections.
Affinity purification mass spectrometric analyses of SARS-COV-2, SARS-COV and HCoV protein expressing A549 cells
For the determination of SARS-COV-2, SARS-COV and partial HCoV interactomes, four replicate affinity purifications were performed for each HA-tagged viral protein. A549 cells (6×10⁶ cells per 15-cm dish) were transduced with HA-tagged SARS-COV-2, SARS-COV or HCoV protein coding lentivirus and harvested three days post transduction. Cell pellets of two 15-cm dishes were lysed in lysis buffer (50 mM Tris-HCl pH 7.5, 100 mM NaCl, 1.5 mM MgCl2, 0.2% (v/v) NP-40, 5% (v/v) glycerol, cOmplete protease inhibitor cocktail (Roche), 0.5% (v/v) 750 U/µl Sm DNAse) and sonicated (5 min, 4°C, 30 sec on, 30 sec off, low settings; Bioruptor, Diagenode SA). Following normalization of protein concentrations cleared lysates, virus protein-bound host proteins were enriched by adding 50 µl anti-HA-agarose slurry (Sigma-Aldrich, A2095) with constant agitation for 3h at 4°C. Non-specifically bound proteins were removed by four subsequent washes with lysis buffer followed by three detergent-removal steps with washing buffer (50 mM Tris-HCl pH 7.5, 100 mM NaCl, 1.5 mM MgCl2, 5% (v/v) glycerol). Enriched proteins were denatured, reduced, alkylated and digested by addition of 200 µl digestion buffer (0.6 M GdmCl, 1 mM TCEP, 4 mM CAA, 100 mM Tris-HCl pH 8, 0.5 µg LysC (WAKO Chemicals), 0.5 µg trypsin (Promega) at 30°C overnight. Peptide purification on StageTips with three layers of C18 Empore filter discs (3M) and subsequent
.CC-BY 4.0 International licenseavailable under a(which was not certified by peer review) is the author/funder, who has granted bioRxiv a license to display the preprint in perpetuity. It is made
The copyright holder for this preprintthis version posted June 17, 2020. ; https://doi.org/10.1101/2020.06.17.156455doi: bioRxiv preprint
mass spectrometry analysis was performed as described previously22,23. Briefly, purified peptides were loaded onto a 20�cm reverse-phase analytical column (75�µm diameter; ReproSil-Pur C18-AQ 1.9�µm resin; Dr. Maisch) and separated using an EASY-nLC 1200 system (Thermo Fisher Scientific) with a 90 min gradient (80% acetonitrile, 0.1% formic acid; 5% (80% acetonitrile) to 30% for 65�min, 30% to 95% for 10�min, wash out at 95% for 5�min, readjustment to 5% in 10�min) at a flow rate of 300 nl�per min. Eluting peptides were directly analyzed on a Q-Exactive HF mass spectrometer (Thermo Fisher Scientific) with data-dependent acquisition including repeating cycles of one MS1 full scan (150-2,000�m/z, R�=�60,000 at 200�m/z) followed by 15 MS2 scans of the highest abundant isolated and higher-energy collisional dissociation fragmented peptide precursors.
Proteome analyses of SARS-COV-2, SARS-COV and HCoV protein expressing cells
For the determination of proteome changes in A549 cells expressing SARS-COV-2, SARS-COV or HCoV proteins, a fraction of 1×10⁶ lentivirus-transduced cells from the affinity purification samples were lysed in guanidinium chloride buffer (6 M GdmCl, 10 mM TCEP, 40 mM CAA, 100 mM Tris-HCl pH 8), boiled at 95°C for 8 min and sonicated (10 min, 4°C, 30 sec on, 30 sec off, high settings). Protein concentrations of cleared lysates were normalized to 50 µg and proteins were pre-digested with 1 µg LysC at 37°C for 1h followed by a 1:10 dilution (100 mM Tris-HCl pH 8) and overnight digestion with 1 µg trypsin at 30°C. Peptide purification on StageTips with three layers of C18 Empore filter discs (3M) and subsequent mass spectrometry analysis was performed as described previously22,23. Briefly, 300 ng of purified peptides were loaded onto a 50 cm reversed phase column (75 μm inner diameter, packed in house with ReproSil-Pur C18-AQ 1.9 μm resin [Dr. Maisch GmbH]). The column temperature was maintained at 60°C using a homemade column oven. A binary buffer system, consisting of buffer A (0.1% formic acid (FA)) and buffer B (80% ACN, 0.1% FA), was used for peptide separation, at a flow rate of 300 nl/min. An EASY-nLC 1200 system (Thermo Fisher Scientific), directly coupled online with the mass spectrometer (Q Exactive HF-X, Thermo Fisher Scientific) via a nano-electrospray source, was employed for nano-flow liquid chromatography. Peptides were eluted by a linear 80 min gradient from 5% to 30% buffer B (0.1% v/v formic acid, 80% v/v acetonitrile), followed by a 4 min increase to 60% B, a further 4 min increase to 95% B, a 4 min plateau phase at 95% B, a 4 min decrease to 5% B and a 4 min wash phase of 5% B. To acquire MS data, the data-independent acquisition (DIA) scan mode operated by the XCalibur software (Thermo Fisher) was used. DIA was performed with one full MS event followed by 33 MS/MS windows in one cycle resulting in a cycle time of 2.7 seconds. The full MS settings included an ion target value of 3 x 10⁶ charges in the 300 – 1650 m/z range with a maximum injection time of 60 ms and a resolution of 120,000 at m/z 200. DIA precursor windows ranged from 300.5 m/z (lower boundary of first window) to 1649.5 m/z (upper boundary of 33rd window). MS/MS settings included an ion target value of 3 x 10⁶ charges for the precursor window with an Xcalibur-automated maximum injection time and a resolution of 30,000 at m/z 200.
To generate the proteome library for DIA measurements purified peptides from the first replicates and the fourth replicates of all samples were pooled separately and 25 µg of peptides from each pool were fractionated into 24 fractions by high pH reversed-phase chromatography as described earlier27. During each separation, fractions were concatenated automatically by shifting the collection tube every 120 seconds. In total 48 fractions were dried in a vacuum centrifuge, resuspended in buffer A* (0.3% TFA/ 2% ACN) and subsequently analyzed by a top12 data-dependent acquisition (DDA) scan mode using the same LC gradient and settings. The mass spectrometer was operated by the XCalibur software (Thermo Fisher). DDA scan settings on full MS level included an ion target value of 3 x 10⁶ charges in the 300 – 1650 m/z range with a maximum injection time of 20 ms and a resolution of 60,000 at m/z 200. At the MS/MS level the target value was 105 charges with a maximum injection time of 60 ms and a resolution of 15,000 at m/z 200. For MS/MS events only, precursor ions with 2-5 charges that were not on the 20 s dynamic exclusion list were isolated in a 1.4 m/z window. Fragmentation was performed by higher-energy C-trap dissociation (HCD) with a normalized collision energy of 27eV.
Infected proteome-phosphoproteome time-course
.CC-BY 4.0 International licenseavailable under a(which was not certified by peer review) is the author/funder, who has granted bioRxiv a license to display the preprint in perpetuity. It is made
The copyright holder for this preprintthis version posted June 17, 2020. ; https://doi.org/10.1101/2020.06.17.156455doi: bioRxiv preprint
Frozen cell lysates of infected A549-ACE2 harvested at 3, 6, 12, 18, 24 and 30h post infection were thawed on ice and boiled for 5 min at 95 degrees. Lysates were transferred to a 96-well plate (Covaris) and sonicated for 5 min. Protein concentrations were estimated by tryptophan assay28 and protein material was equalized to 200 µg per sample. CAA (10 mM) and TCEP (40 mM) along with trypsin (1:100 w/w, Sigma-Aldrich) and LysC (1/100 w/w, Wako) were added to the samples that were digested at 37°C overnight. Peptides were desalted using SDB-RPS cartridges (PreOmics).
Briefly, samples were mixed with 300 µl 1% TFA in isopropanol, loaded onto cartridges and washed with 200 µl 1% TFA in isopropanol and 200 µl 0.2% TFA. Peptides were eluted with 150 µl of 1.25% Ammonium hydroxide (NH4OH)/ 80% ACN and 10 µl aliquots were taken and dried separately for global proteome analysis. The rest was dried using a SpeedVac centrifuge (Eppendorf, Concentrator plus) and resuspended in 105 µl of equilibration buffer (1% TFA/ 80% ACN) for phosphopeptide enrichment. The AssayMAP Bravo robot (Agilent) performed the enrichment for phosphopeptides by priming AssayMAP cartridges (packed with 5 µl Fe(III)-NTA) with 1 % TFA in 99 % ACN followed by equilibration in equilibration buffer and loading of peptides. Enriched phosphopeptides were eluted with 1 % Ammonium hydroxide, dried in a vacuum centrifuge and resuspended in 1 % FA buffer. Evotips were activated by wetting in 40 ml 1-propanol in Evotipbox and subsequently washed with 100 µl of 0.1% FA. Peptides were loaded onto tips which were subsequently washed with 100 µl of 0.1 % FA. The tips were then loaded with 100 µl 0.1 % FA and centrifuged very shortly.
To generate the proteome library for DIA measurements cells were lysed in 4 % SDC and 100 mM Tris pH 8.4, followed by sonication, protein quantification, reduction, and alkylation and desalting using SDB-RPS cartridges (see above). 100 µg of peptides were fractionated into 24 fractions by high pH reversed-phase chromatography as described earlier27. Fractions were concatenated automatically by shifting the collection tube every 120 seconds and subsequently dried in a vacuum centrifuge and resuspended in buffer A* (0.3% TFA/ 2% ACN).
To generate the library for phosphoproteome DIA measurements A549 cells were treated with 100 ng/ml Calyculin and 2 mM Sodium orthovanadate for 20 min. Cells were lysed and treated as for the proteome library generation. After overnight digestion, peptides were desalted using Sepax Extraction columns. 5.5 mg of desalted peptides were fractionated into 84 fractions on a C18 reversed-phase column (4.6 x 150 mm, 3.5 µm bead size) under basic conditions using a Shimadzu UFLC operating at 1 ml/minute. Buffer A (2.5 mM Ammoniumbicarbonat in MQ) and Buffer B (2.5 mM ABC in 80% CAN) were used to separate peptides on a linear gradient of 2.5% B to 44% B for 64 minutes and 44% B to 75% B for 5 minutes before a rapid increase to 100% B which was kept for 5 minutes. Fractions were subsequently concatenated into 24 fractions and lyophilized. Phosphopeptides of these 24 fractions were enriched using the AssayMAP Bravo robot and loaded on Evotips. Another 5.5 mg of desalted peptides were split into 24 samples and enriched for phosphopeptides by the AssayMAP Bravo robot. Eluted phoshopeptides were combined, dried and fractionated into 24 fractions by neutral pH reversed-phase chromatography27. Fractions were dried and loaded on Evotips as described above.
Infected proteome-phosphoproteome-diGly-proteome (6 and 24hr)
Frozen cell lysates of infected A549-ACE2 harvested at 6 and 24h post infection were thawed on ice and sonicated for 1 min (Branson Sonifierer). Protein concentrations were estimated by tryptophan assay28. To reduce and alkylate proteins, samples were incubated for 5 min at 45°C with CAA and TCEP, final concentrations of 10 mM and 40 mM, respectively. Samples were digested overnight at 37°C using trypsin (1:100 w/w, Sigma-Aldrich) and LysC (1/100 w/w, Wako).
For proteome analysis, 10 µg of peptide material were desalted using SDB-RPS StageTips (Empore) (2). Briefly, samples were diluted with 1% TFA in isopropanol to a final volume of 200 µl and loaded onto StageTips, subsequently washed with 200 µl of 1% TFA in isopropanol and 200 µl 0.2% TFA/ 2% ACN. Peptides were eluted with 60 µl of 1.25% Ammonium hydroxide (NH4OH)/ 80% ACN and dried using a SpeedVac centrifuge (Eppendorf, Concentrator plus). They were resuspended in buffer A* prior to LC-MS/MS analysis. Peptide concentrations were measured optically at 280nm (Nanodrop
.CC-BY 4.0 International licenseavailable under a(which was not certified by peer review) is the author/funder, who has granted bioRxiv a license to display the preprint in perpetuity. It is made
The copyright holder for this preprintthis version posted June 17, 2020. ; https://doi.org/10.1101/2020.06.17.156455doi: bioRxiv preprint
2000, Thermo Scientific) and subsequently equalized using buffer A*. 500ng peptide was subjected to LC-MS/MS analysis.
To generate phosphoproteome data, the EasyPhos protocol was used for the enrichment of phosphopeptides29. Briefly, samples were adjusted with the lysis buffer to a volume of 300 µl, transferred into a 96-deep-well plate and mixed with 100 µl 48% TFA, 8 mM KH2PO4. Phosphopeptides were captured by 5 min incubation at 40°C with 5 mg TiO2 beads. Thereafter, beads were washed 5 times with 5% TFA/ 60% isopropanol, followed by a transfer in 0.1% TFA/ 60% isopropanol into C8 StageTips. Phosphopeptides were eluted twice with 30 µl 20% NH4OH/ 40% ACN and concentrated for 30 min at 45°C using a SpeedVac centrifuge. Concentrated samples were immediately diluted with 100 µl 1% TFA in isopropanol and transferred into SDB-RPS StageTips. Peptides were washed, eluted and dried as described above. Dried peptides were resuspended in 6 µl buffer A* and 5 µl was subjected to LC-MS/MS analysis.
For diGly peptide enrichment, samples were four-fold diluted with 1% TFA in isopropanol and loaded onto SDB-RPS cartridges (Strata™-X-C, 30 mg/ 3 ml, Phenomenex Inc), pre-equilibrated with 4 ml 30% MeOH/1% TFA and washed with 4 ml 0.2% TFA. Samples were washed twice with 4 ml 1% TFA in isopropanol, once with 0.2% TFA/ 2% ACN and eluted twice with 2 ml 1.25% NH4OH/ 80% ACN. Eluted peptides were diluted with ddH2O to a final ACN concentration of 35%, snap frozen and lyophilized. Lyophilized peptides were reconstituted in IAP buffer (50 mM MOPS, pH 7.2, 10 mM Na2HPO4, 50 mM NaCl) and the peptide concentration was estimated by tryptophan assay. K-�-GG remnant containing peptides were enriched using the PTMScan® Ubiquitin Remnant Motif (K-�-GG) Kit (Cell Signaling Technology). Crosslinking of antibodies to beads and subsequent immunopurification was performed with slight modifications as previously described30. Briefly, two vials of crosslinked beads were combined and equally split into 16 tubes (~31 µg of antibody per tube). Equal peptide amounts (800 µg) were added to crosslinked beads and the volume was adjusted with IAP buffer to 1 ml. After 1h of incubation at 4°C and gentle agitation, beads were washed twice with cold IAP and 5 times with cold ddH2O. Thereafter, peptides were eluted twice with 50 µl 0.15% TFA. Eluted peptides were desalted and dried as described for proteome analysis with the difference that 0.2% TFA instead of 1%TFA in isopropanol was used for the first wash. Eluted peptides were resuspended in 9 µl buffer A* and 4 µl was subjected to LC-MS/MS analysis.
DDA Measurements
Samples were loaded onto a 50 cm reversed phase column (75 μm inner diameter, packed in house with ReproSil-Pur C18-AQ 1.9 μm resin [Dr. Maisch GmbH]). The column temperature was maintained at 60°C using a homemade column oven. A binary buffer system, consisting of buffer A (0.1% formic acid (FA)) and buffer B (80% ACN plus 0.1% FA), was used for peptide separation, at a flow rate of 300 nl/min. An EASY-nLC 1200 system (Thermo Fisher Scientific), directly coupled online with the mass spectrometer (Q Exactive HF-X, Thermo Fisher Scientific) via a nano-electrospray source, was employed for nano-flow liquid chromatography.
For proteome measurements, we used a gradient starting at 5% buffer B and stepwise increasing to 30% in 95 min, 60% in 5 min and 95% in 5 min. The mass spectrometer was operated in Top12 data-dependent mode (DDA) with a full scan range of 300-1650 m/z at 60,000 resolution with an automatic gain control (AGC) target of 3e6 and a maximum fill time of 20ms. Precursor ions were isolated with a width of 1.4 m/z and fragmented by higher-energy collisional dissociation (HCD) (NCE 27%). Fragment scans were performed at a resolution of 15,000, an AGC of 1e5 and a maximum injection time of 60 ms. Dynamic exclusion was enabled and set to 30 s.
For phosphopeptide samples 5µl were loaded and eluted with a gradient starting at 3% buffer B and stepwise increased to 19% in 60 min, 41% in 30 min, 36% in 39 min and 95% in 5 min. The mass spectrometer was operated in Top10 DDA with a full scan range of 300-1600 m/z at 60,000 resolution with an AGC target of 3e6 and a maximum fill time of 120 ms. Precursor ions were isolated with a width of 1.4 m/z and fragmented by HCD (NCE 28%). Fragment scans were performed at a resolution
.CC-BY 4.0 International licenseavailable under a(which was not certified by peer review) is the author/funder, who has granted bioRxiv a license to display the preprint in perpetuity. It is made
The copyright holder for this preprintthis version posted June 17, 2020. ; https://doi.org/10.1101/2020.06.17.156455doi: bioRxiv preprint
of 15,000, an AGC of 1e5 and a maximum injection time of 50 ms. Dynamic exclusion was enabled and set to 30 s.
For the analysis of K-�-GG peptide samples, we use a gradient starting at 3% buffer B and stepwise increased to 7% in 6 min, 20% in 49 min, 36% in 39 min, 45% in 10 min and 95% in 4 min. The mass spectrometer was operated in Top12 DDA with a full scan range of 300-1350 m/z at 60,000 resolution with an AGC target of 3e6 and a maximum fill time of 20ms. Precursor ions were isolated with a width of 1.4 m/z and fragmented by HCD (NCE 28%). Fragment scans were performed at a resolution of 30,000, an AGC of 1e5 and a maximum injection time of 110 ms. Dynamic exclusion was enabled and set to 15 s.
DIA Measurements
Samples were loaded onto a 15 cm reversed phase column (150 μm inner diameter, packed in house with ReproSil-Pur C18-AQ 1.9 μm resin [Dr. Maisch GmbH]), which was kept in a homemade column oven at 60°C. Peptides were separated by the Evosep One LC system using the pre-programmed 44 minutes gradient for proteome samples and the 21 minutes gradient for phosphoproteome samples. The same gradients were used for the acquisition of proteome and phosphoproteome library fractions. The Evosep One system was coupled to a Q Exactive HF-X Orbitrap (Thermo Fisher Scientific) via a nano-electrospray source.
The proteome and phosphoproteome fractions we used to build the libraries were measured in DDA mode. To acquire proteome fractions the mass spectrometer was operated in Top15 data-dependent mode with a full scan range of 300-1650 m/z at 60,000 resolution, an automatic gain control (AGC) target of 3e6 and a maximum fill time of 20ms. For the generation of the phosphoproteome library the mass spectrometer was operated in Top12 data-dependent mode (DDA) with a full scan range of 300-1650 m/z at 60,000 resolution, an automatic gain control (AGC) target of 3e6 and a maximum fill time of 25ms. For both libraries precursor ions were isolated with a width of 1.4 m/z and fragmented by higher-energy collisional dissociation (HCD) (NCE 27%). Fragment scans were performed at a resolution of 15,000, an AGC of 1e5 and a maximum fill time of 28 ms. Dynamic exclusion was enabled and set to 30 s for the proteome library and 20 s for the phosphoproteome library.
For proteome and phosphoproteome DIA measurements, full MS resolution was set to 60,000 with a full scan range of 300-1650 m/z, a maximum fill time of 60 ms and an automatic gain control (AGC) target of 3e6. One full scan was followed by 32 windows with a resolution of 30,000 and a maximum fill time of 54 ms for proteome measurements and 40 windows for phosphoproteome measurements with a resolution of 15,000 and maximum fill time of 28 ms in profile mode. Precursor ions were fragmented by higher-energy collisional dissociation (HCD) (NCE 27%).
Data-processing of affinity purification, (phospho)proteome and ubiquitinome LC-MS/MS analyses
Raw MS data files of experiments conducted in DDA mode were processed with MaxQuant (version 1.6.14) using the standard settings and label-free quantification enabled (LFQ min ratio count 1, normalization type none, stabilize large LFQ ratios disabled). For profiling of post-translational modifications, additional variable modifications for ubiquitination (GlyGly(K)) and phosphorylation (Phospho(STY)) were added. Spectra were searched against forward and reverse sequences of the reviewed human proteome including isoforms (UniprotKB, release 10.2019) and SARS-COV-2, SARS-COV and HCoV proteins by the built-in Andromeda search engine31.
For AP-MS data, the alternative protein group definition was used: only the peptides identified in AP-MS samples could be regarded as protein group-specific, protein groups that differed by the single specific peptide or had less than 25% different specific peptides were merged to extend the set of peptides used for protein group quantitation and reduce the number of protein isoform-specific interactions.
.CC-BY 4.0 International licenseavailable under a(which was not certified by peer review) is the author/funder, who has granted bioRxiv a license to display the preprint in perpetuity. It is made
The copyright holder for this preprintthis version posted June 17, 2020. ; https://doi.org/10.1101/2020.06.17.156455doi: bioRxiv preprint
For the experiments conducted in DIA mode, Spectronaut version 13 (Biognosys) was used to generate the proteome and phosphoproteome libraries from DDA runs by combining files of respective fractionations using the human fasta file (Uniprot, 2019, 42,431 entries). For the generation of the proteome library default settings were left unchanged. For the phosphoproteome library generation 2 x 24 files received by both fractionation strategies were combined and phosphorylation at Serine/Threonine/Tyrosine was added as variable modification to default settings. Maximum number of fragment ions per peptide was increased from 6 to 25. Proteome DIA files were analyzed using the proteome library with default settings and disabled cross run normalization. Phospho DIA files were analyzed using the phosphoproteome library using default settings with disabled PTM localization filter and cross run normalization. To search for viral proteins, we also generated the “hybrid” spectral library by merging DDA proteome library with a direct-DIA library generated from the DIA analysis of DIA proteome samples. For this search, the sequences of viral proteins were added to the human fasta file.
Bioinformatic analysis
Unless otherwise specified, the bioinformatic analysis was done in R (version 3.6), Julia (version 1.4) and Python (version 3.8) using a collection of in-house scripts (available upon request).
Statistical analysis of MS data
For all MS datasets, except DDA phosphoproteome and ubiquitinome data, the Bayesian linear random effects models were used to define how the abundances of proteins change between the conditions. To specify and fit the models we employed msglm R package (https://github.com/innatelab/msglm), which depends on rstan package (version 2.19)32 for inferring the posterior distribution of the model parameters. In all the models, the effects corresponding to the experimental conditions have regularized horseshoe+ priors33, while the batch effects have normally distributed priors. Laplacian distribution was used to model the instrumental error of MS intensities. For each MS instrument used, the heteroscedastic intensities noise model was calibrated with the technical replicate MS data of the instrument. These data were also used to calibrate the logit-based model of missing MS data (the probability that the MS instrument will fail to identify the protein given its expected abundance in the sample). The model was fit using unnormalized MS intensities data. Instead of transforming the data by normalization, the inferred protein abundances were scaled by the normalization multiplier of each individual MS sample to match the expected MS intensity of that sample. This allows taking the signal-to-noise variation between the samples into account when fitting the model. Due to high computational intensity, the model was applied to each protein group separately. For all the models, 4000 iterations (2000 warmup + 2000 sampling) of the No-U-Turn Markov Chain Monte Carlo were performed in 7 or 8 independent chains, every 4th sample was collected for posterior distribution of the model parameters. For estimating the statistical significance of protein abundance changes between the two experimental conditions, the P-value was defined as the probability that a random sample from the posterior distribution of the first condition would be smaller (larger) than a random sample drawn from the second condition. No multiple hypothesis testing corrections were applied, since this is handled by the choice of the model priors.
Statistical analysis of AP-MS data and filtering for specific interactions
Given the sparsity of the AP-MS data (each peptide is quantified in a small fraction of experiments), to take advantage of the missing data modeling by msglm, the statistical model was applied directly to the MS1 intensities of protein group-specific LC peaks (evidence.txt table of MaxQuant output). In R GLM formula language, the model could be specified as
.CC-BY 4.0 International licenseavailable under a(which was not certified by peer review) is the author/funder, who has granted bioRxiv a license to display the preprint in perpetuity. It is made
The copyright holder for this preprintthis version posted June 17, 2020. ; https://doi.org/10.1101/2020.06.17.156455doi: bioRxiv preprint
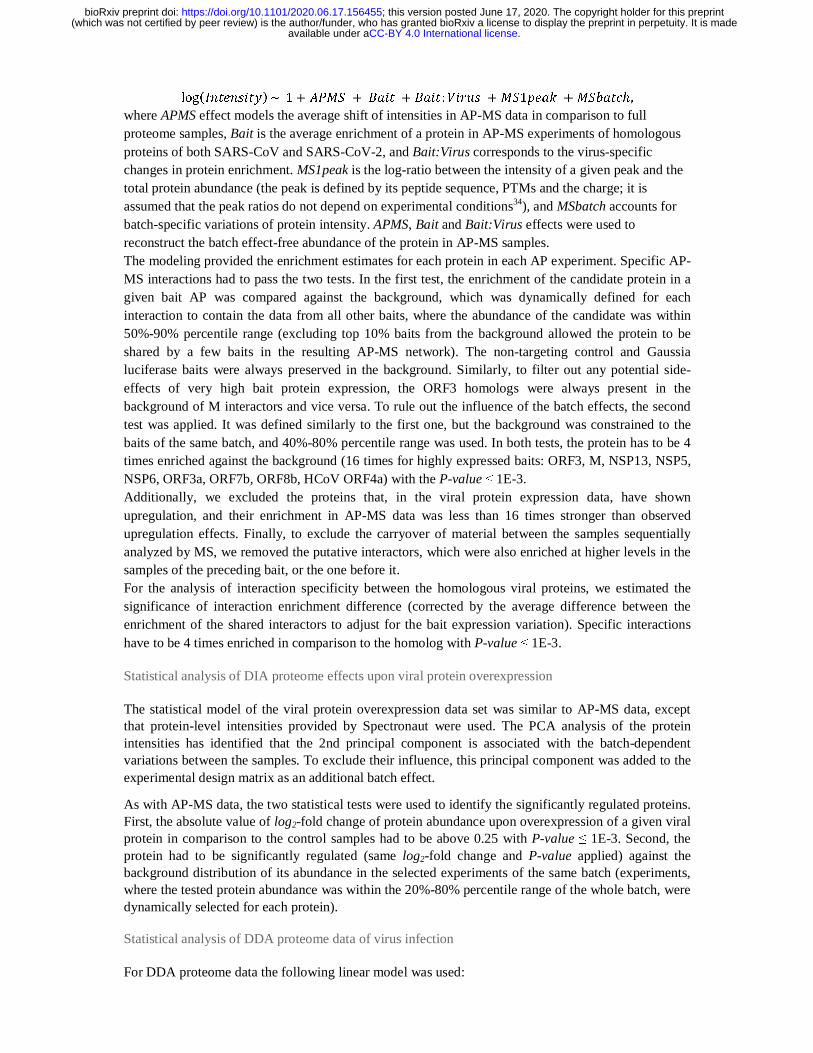
log��������� ~ 1 � ���� � ��� � ���: ��� � ��1���� � �������, where APMS effect models the average shift of intensities in AP-MS data in comparison to full proteome samples, Bait is the average enrichment of a protein in AP-MS experiments of homologous proteins of both SARS-CoV and SARS-CoV-2, and Bait:Virus corresponds to the virus-specific changes in protein enrichment. MS1peak is the log-ratio between the intensity of a given peak and the total protein abundance (the peak is defined by its peptide sequence, PTMs and the charge; it is assumed that the peak ratios do not depend on experimental conditions34), and MSbatch accounts for batch-specific variations of protein intensity. APMS, Bait and Bait:Virus effects were used to reconstruct the batch effect-free abundance of the protein in AP-MS samples. The modeling provided the enrichment estimates for each protein in each AP experiment. Specific AP-MS interactions had to pass the two tests. In the first test, the enrichment of the candidate protein in a given bait AP was compared against the background, which was dynamically defined for each interaction to contain the data from all other baits, where the abundance of the candidate was within 50%-90% percentile range (excluding top 10% baits from the background allowed the protein to be shared by a few baits in the resulting AP-MS network). The non-targeting control and Gaussia luciferase baits were always preserved in the background. Similarly, to filter out any potential side-effects of very high bait protein expression, the ORF3 homologs were always present in the background of M interactors and vice versa. To rule out the influence of the batch effects, the second test was applied. It was defined similarly to the first one, but the background was constrained to the baits of the same batch, and 40%-80% percentile range was used. In both tests, the protein has to be 4 times enriched against the background (16 times for highly expressed baits: ORF3, M, NSP13, NSP5, NSP6, ORF3a, ORF7b, ORF8b, HCoV ORF4a) with the P-value ≤ 1E-3. Additionally, we excluded the proteins that, in the viral protein expression data, have shown upregulation, and their enrichment in AP-MS data was less than 16 times stronger than observed upregulation effects. Finally, to exclude the carryover of material between the samples sequentially analyzed by MS, we removed the putative interactors, which were also enriched at higher levels in the samples of the preceding bait, or the one before it. For the analysis of interaction specificity between the homologous viral proteins, we estimated the significance of interaction enrichment difference (corrected by the average difference between the enrichment of the shared interactors to adjust for the bait expression variation). Specific interactions have to be 4 times enriched in comparison to the homolog with P-value ≤ 1E-3.
Statistical analysis of DIA proteome effects upon viral protein overexpression
The statistical model of the viral protein overexpression data set was similar to AP-MS data, except that protein-level intensities provided by Spectronaut were used. The PCA analysis of the protein intensities has identified that the 2nd principal component is associated with the batch-dependent variations between the samples. To exclude their influence, this principal component was added to the experimental design matrix as an additional batch effect.
As with AP-MS data, the two statistical tests were used to identify the significantly regulated proteins. First, the absolute value of log2-fold change of protein abundance upon overexpression of a given viral protein in comparison to the control samples had to be above 0.25 with P-value ≤ 1E-3. Second, the protein had to be significantly regulated (same log2-fold change and P-value applied) against the background distribution of its abundance in the selected experiments of the same batch (experiments, where the tested protein abundance was within the 20%-80% percentile range of the whole batch, were dynamically selected for each protein).
Statistical analysis of DDA proteome data of virus infection
For DDA proteome data the following linear model was used:
.CC-BY 4.0 International licenseavailable under a(which was not certified by peer review) is the author/funder, who has granted bioRxiv a license to display the preprint in perpetuity. It is made
The copyright holder for this preprintthis version posted June 17, 2020. ; https://doi.org/10.1101/2020.06.17.156455doi: bioRxiv preprint
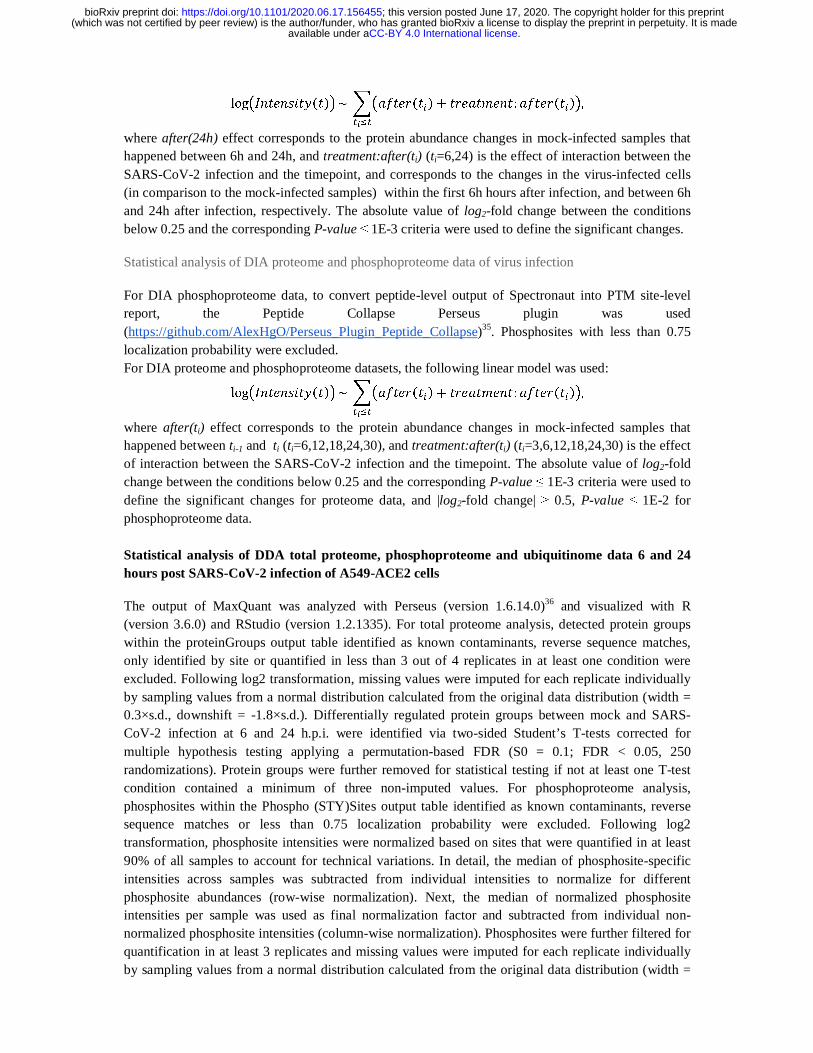
log!����������" ~ #!�$������� � �����%���: �$�������"����
, where after(24h) effect corresponds to the protein abundance changes in mock-infected samples that happened between 6h and 24h, and treatment:after(ti) (ti=6,24) is the effect of interaction between the SARS-CoV-2 infection and the timepoint, and corresponds to the changes in the virus-infected cells (in comparison to the mock-infected samples) within the first 6h hours after infection, and between 6h and 24h after infection, respectively. The absolute value of log2-fold change between the conditions below 0.25 and the corresponding P-value ≤ 1E-3 criteria were used to define the significant changes.
Statistical analysis of DIA proteome and phosphoproteome data of virus infection
For DIA phosphoproteome data, to convert peptide-level output of Spectronaut into PTM site-level report, the Peptide Collapse Perseus plugin was used (https://github.com/AlexHgO/Perseus_Plugin_Peptide_Collapse)35. Phosphosites with less than 0.75 localization probability were excluded. For DIA proteome and phosphoproteome datasets, the following linear model was used:
log!����������" ~ #!�$������� � �����%���: �$�������"����
, where after(ti) effect corresponds to the protein abundance changes in mock-infected samples that happened between ti-1 and ti (ti=6,12,18,24,30), and treatment:after(ti) (ti=3,6,12,18,24,30) is the effect of interaction between the SARS-CoV-2 infection and the timepoint. The absolute value of log2-fold change between the conditions below 0.25 and the corresponding P-value ≤ 1E-3 criteria were used to define the significant changes for proteome data, and |log2-fold change| ≥ 0.5, P-value ≤ 1E-2 for phosphoproteome data. Statistical analysis of DDA total proteome, phosphoproteome and ubiquitinome data 6 and 24 hours post SARS-CoV-2 infection of A549-ACE2 cells
The output of MaxQuant was analyzed with Perseus (version 1.6.14.0)36 and visualized with R (version 3.6.0) and RStudio (version 1.2.1335). For total proteome analysis, detected protein groups within the proteinGroups output table identified as known contaminants, reverse sequence matches, only identified by site or quantified in less than 3 out of 4 replicates in at least one condition were excluded. Following log2 transformation, missing values were imputed for each replicate individually by sampling values from a normal distribution calculated from the original data distribution (width = 0.3×s.d., downshift = -1.8×s.d.). Differentially regulated protein groups between mock and SARS-CoV-2 infection at 6 and 24 h.p.i. were identified via two-sided Student’s T-tests corrected for multiple hypothesis testing applying a permutation-based FDR (S0 = 0.1; FDR < 0.05, 250 randomizations). Protein groups were further removed for statistical testing if not at least one T-test condition contained a minimum of three non-imputed values. For phosphoproteome analysis, phosphosites within the Phospho (STY)Sites output table identified as known contaminants, reverse sequence matches or less than 0.75 localization probability were excluded. Following log2 transformation, phosphosite intensities were normalized based on sites that were quantified in at least 90% of all samples to account for technical variations. In detail, the median of phosphosite-specific intensities across samples was subtracted from individual intensities to normalize for different phosphosite abundances (row-wise normalization). Next, the median of normalized phosphosite intensities per sample was used as final normalization factor and subtracted from individual non-normalized phosphosite intensities (column-wise normalization). Phosphosites were further filtered for quantification in at least 3 replicates and missing values were imputed for each replicate individually by sampling values from a normal distribution calculated from the original data distribution (width =
.CC-BY 4.0 International licenseavailable under a(which was not certified by peer review) is the author/funder, who has granted bioRxiv a license to display the preprint in perpetuity. It is made
The copyright holder for this preprintthis version posted June 17, 2020. ; https://doi.org/10.1101/2020.06.17.156455doi: bioRxiv preprint
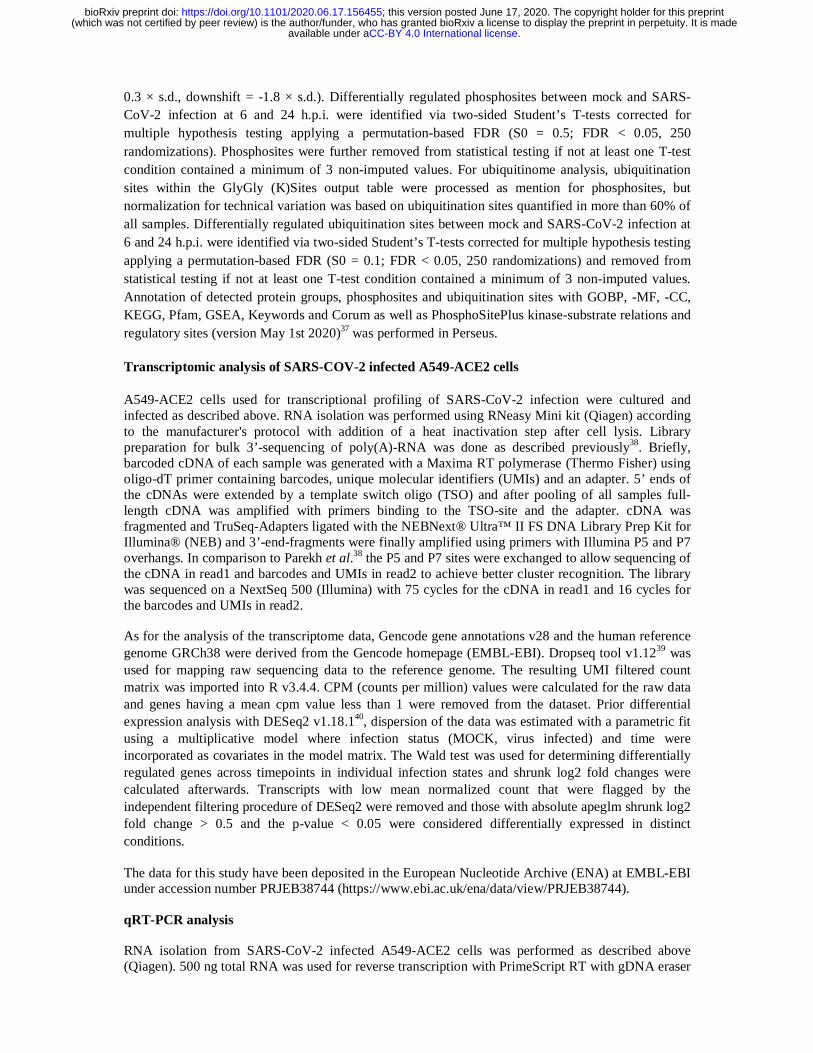
0.3 × s.d., downshift = -1.8 × s.d.). Differentially regulated phosphosites between mock and SARS-CoV-2 infection at 6 and 24 h.p.i. were identified via two-sided Student’s T-tests corrected for multiple hypothesis testing applying a permutation-based FDR (S0 = 0.5; FDR < 0.05, 250 randomizations). Phosphosites were further removed from statistical testing if not at least one T-test condition contained a minimum of 3 non-imputed values. For ubiquitinome analysis, ubiquitination sites within the GlyGly (K)Sites output table were processed as mention for phosphosites, but normalization for technical variation was based on ubiquitination sites quantified in more than 60% of all samples. Differentially regulated ubiquitination sites between mock and SARS-CoV-2 infection at 6 and 24 h.p.i. were identified via two-sided Student’s T-tests corrected for multiple hypothesis testing applying a permutation-based FDR (S0 = 0.1; FDR < 0.05, 250 randomizations) and removed from statistical testing if not at least one T-test condition contained a minimum of 3 non-imputed values. Annotation of detected protein groups, phosphosites and ubiquitination sites with GOBP, -MF, -CC, KEGG, Pfam, GSEA, Keywords and Corum as well as PhosphoSitePlus kinase-substrate relations and regulatory sites (version May 1st 2020)37 was performed in Perseus.
Transcriptomic analysis of SARS-COV-2 infected A549-ACE2 cells
A549-ACE2 cells used for transcriptional profiling of SARS-CoV-2 infection were cultured and infected as described above. RNA isolation was performed using RNeasy Mini kit (Qiagen) according to the manufacturer's protocol with addition of a heat inactivation step after cell lysis. Library preparation for bulk 3’-sequencing of poly(A)-RNA was done as described previously38. Briefly, barcoded cDNA of each sample was generated with a Maxima RT polymerase (Thermo Fisher) using oligo-dT primer containing barcodes, unique molecular identifiers (UMIs) and an adapter. 5’ ends of the cDNAs were extended by a template switch oligo (TSO) and after pooling of all samples full-length cDNA was amplified with primers binding to the TSO-site and the adapter. cDNA was fragmented and TruSeq-Adapters ligated with the NEBNext® Ultra™ II FS DNA Library Prep Kit for Illumina® (NEB) and 3’-end-fragments were finally amplified using primers with Illumina P5 and P7 overhangs. In comparison to Parekh et al.38 the P5 and P7 sites were exchanged to allow sequencing of the cDNA in read1 and barcodes and UMIs in read2 to achieve better cluster recognition. The library was sequenced on a NextSeq 500 (Illumina) with 75 cycles for the cDNA in read1 and 16 cycles for the barcodes and UMIs in read2.
As for the analysis of the transcriptome data, Gencode gene annotations v28 and the human reference genome GRCh38 were derived from the Gencode homepage (EMBL-EBI). Dropseq tool v1.1239 was used for mapping raw sequencing data to the reference genome. The resulting UMI filtered count matrix was imported into R v3.4.4. CPM (counts per million) values were calculated for the raw data and genes having a mean cpm value less than 1 were removed from the dataset. Prior differential expression analysis with DESeq2 v1.18.140, dispersion of the data was estimated with a parametric fit using a multiplicative model where infection status (MOCK, virus infected) and time were incorporated as covariates in the model matrix. The Wald test was used for determining differentially regulated genes across timepoints in individual infection states and shrunk log2 fold changes were calculated afterwards. Transcripts with low mean normalized count that were flagged by the independent filtering procedure of DESeq2 were removed and those with absolute apeglm shrunk log2 fold change > 0.5 and the p-value < 0.05 were considered differentially expressed in distinct conditions.
The data for this study have been deposited in the European Nucleotide Archive (ENA) at EMBL-EBI under accession number PRJEB38744 (https://www.ebi.ac.uk/ena/data/view/PRJEB38744).
qRT-PCR analysis
RNA isolation from SARS-CoV-2 infected A549-ACE2 cells was performed as described above (Qiagen). 500 ng total RNA was used for reverse transcription with PrimeScript RT with gDNA eraser
.CC-BY 4.0 International licenseavailable under a(which was not certified by peer review) is the author/funder, who has granted bioRxiv a license to display the preprint in perpetuity. It is made
The copyright holder for this preprintthis version posted June 17, 2020. ; https://doi.org/10.1101/2020.06.17.156455doi: bioRxiv preprint

(Takara). For relative transcript quantification PowerUp SYBR Green (Applied Biosystems) was used. Primer sequences can be provided upon request.
Gene Set Enrichment Analysis
We have used Gene Ontology, Reactome and other EnrichmentMap gene sets of human proteins41 as well as protein complexes annotations from IntAct Complex Portal (version 2019.11)42 and CORUM (version 2019)43. To find the nonredundant collection of annotations describing the unique and shared features of multiple experiments in a dataset, we have used Julia package OptEnrichedSetCover.jl (https://github.com/alyst/OptEnrichedSetCover.jl), which employs evolutionary multi-objective optimization technique to find a collection of annotation terms that have both significant enrichments in the individual experiments and minimal pairwise overlaps. For transcription factor enrichment analysis the significantly regulated transcripts were submitted to ChEA3 web-based application44. Transcription factor – target gene set libraries from ENCODE were used45. Transcriptome, proteome, ubiquitinome and phosphoproteome changes along with unchanged transcripts/proteins/sites were submitted to the core ingenuity pathway analysis (IPA) (www.ingenuity.com). The following cut-offs were used for differentially expressed transcripts: the absolute values of apeglm-shrunk log2 fold change > 0.5, the p-value < 0.05. Transcripts with low mean normalized count that were flagged by the independent filtering procedure of DESeq2 were removed prior pathway analysis. The following cut-offs were used for differentially expressed proteins or regulated sites: p-value <0.05 and absolute log2 fold change ≥ 0.5. Ingenuity knowledge base was used as a reference dataset, only experimentally observed findings were used for confidence filtering, additionally human species and A549-ATCC cell line filters were set. Input datasets were used to identify the most significant canonical pathways and upstream regulators (in case of transcriptome). Right-tailed Fisher’s exact test with Benjamini-Hochberg’s correction was used to calculate p-values, which are presented in Supplementary Table 3.
Prediction of Functional Links between AP-MS and viral protein overexpression data
To systematically detect functional interactions, which may connect the cellular targets of each viral protein with the downstream changes it induces on proteome level, we have used the network diffusion-based HierarchicalHotNet method13 as implemented in Julia package HierarchicalHotNet.jl (https://github.com/alyst/HierarchicalHotNet.jl). Specifically, for network diffusion with restart, we used the ReactomeFI network (version 2019)12 of cellular functional interactions, reversing the direction of functional interaction (e.g. replacing kinase→substrate interaction with substrate→kinase). The proteins with significant abundance changes upon bait overexpression (|median(log2-fold change)| ≥ 0.25, P-value ≤ 1E-3 both in the comparison against the controls and against the baits of the same batch) were used as the sources of signal diffusion with weights set to
&'median�log� fold-change�' · 'log�� P-value', and the restart probability was set to 0.4. To find the
optimal cutting threshold of the resulting hierarchical tree of strongly connected components (SCCs) of the weighted graph corresponding to the stationary distribution of signal diffusion and to confirm the relevance of predicted functional connections, the same procedure was applied to 1000 random permutations of vertex weights as described in Reyna et al.13 (vertex weights are randomly shuffled between the vertices with similar in- and out-degrees). Since cutting the tree of SCCs at any threshold t (keeping only the edges with weights above t) and collapsing each resulting SCC into a single node
.CC-BY 4.0 International licenseavailable under a(which was not certified by peer review) is the author/funder, who has granted bioRxiv a license to display the preprint in perpetuity. It is made
The copyright holder for this preprintthis version posted June 17, 2020. ; https://doi.org/10.1101/2020.06.17.156455doi: bioRxiv preprint
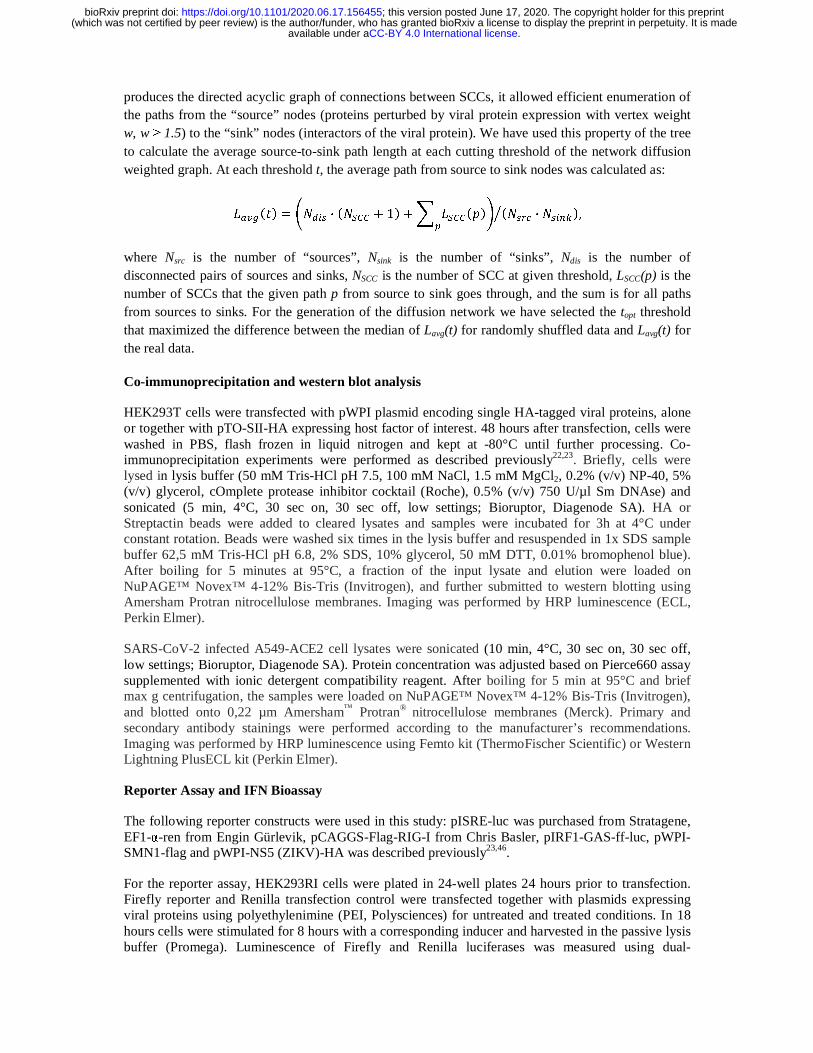
produces the directed acyclic graph of connections between SCCs, it allowed efficient enumeration of the paths from the “source” nodes (proteins perturbed by viral protein expression with vertex weight w, w ≥ 1.5) to the “sink” nodes (interactors of the viral protein). We have used this property of the tree to calculate the average source-to-sink path length at each cutting threshold of the network diffusion weighted graph. At each threshold t, the average path from source to sink nodes was calculated as:
/����� 0 12�� · �2� � 1� � # /� ����
3 �2��� · 2�����4 , where Nsrc is the number of “sources”, Nsink is the number of “sinks”, Ndis is the number of disconnected pairs of sources and sinks, NSCC is the number of SCC at given threshold, LSCC(p) is the number of SCCs that the given path p from source to sink goes through, and the sum is for all paths from sources to sinks. For the generation of the diffusion network we have selected the topt threshold that maximized the difference between the median of Lavg(t) for randomly shuffled data and Lavg(t) for the real data.
Co-immunoprecipitation and western blot analysis
HEK293T cells were transfected with pWPI plasmid encoding single HA-tagged viral proteins, alone or together with pTO-SII-HA expressing host factor of interest. 48 hours after transfection, cells were washed in PBS, flash frozen in liquid nitrogen and kept at -80°C until further processing. Co-immunoprecipitation experiments were performed as described previously22,23. Briefly, cells were lysed in lysis buffer (50 mM Tris-HCl pH 7.5, 100 mM NaCl, 1.5 mM MgCl2, 0.2% (v/v) NP-40, 5% (v/v) glycerol, cOmplete protease inhibitor cocktail (Roche), 0.5% (v/v) 750 U/µl Sm DNAse) and sonicated (5 min, 4°C, 30 sec on, 30 sec off, low settings; Bioruptor, Diagenode SA). HA or Streptactin beads were added to cleared lysates and samples were incubated for 3h at 4°C under constant rotation. Beads were washed six times in the lysis buffer and resuspended in 1x SDS sample buffer 62,5 mM Tris-HCl pH 6.8, 2% SDS, 10% glycerol, 50 mM DTT, 0.01% bromophenol blue). After boiling for 5 minutes at 95°C, a fraction of the input lysate and elution were loaded on NuPAGE™ Novex™ 4-12% Bis-Tris (Invitrogen), and further submitted to western blotting using Amersham Protran nitrocellulose membranes. Imaging was performed by HRP luminescence (ECL, Perkin Elmer).
SARS-CoV-2 infected A549-ACE2 cell lysates were sonicated (10 min, 4°C, 30 sec on, 30 sec off, low settings; Bioruptor, Diagenode SA). Protein concentration was adjusted based on Pierce660 assay supplemented with ionic detergent compatibility reagent. After boiling for 5 min at 95°C and brief max g centrifugation, the samples were loaded on NuPAGE™ Novex™ 4-12% Bis-Tris (Invitrogen), and blotted onto 0,22 µm Amersham™ Protran® nitrocellulose membranes (Merck). Primary and secondary antibody stainings were performed according to the manufacturer’s recommendations. Imaging was performed by HRP luminescence using Femto kit (ThermoFischer Scientific) or Western Lightning PlusECL kit (Perkin Elmer).
Reporter Assay and IFN Bioassay
The following reporter constructs were used in this study: pISRE-luc was purchased from Stratagene, EF1-α-ren from Engin Gürlevik, pCAGGS-Flag-RIG-I from Chris Basler, pIRF1-GAS-ff-luc, pWPI-SMN1-flag and pWPI-NS5 (ZIKV)-HA was described previously23,46.
For the reporter assay, HEK293RI cells were plated in 24-well plates 24 hours prior to transfection. Firefly reporter and Renilla transfection control were transfected together with plasmids expressing viral proteins using polyethylenimine (PEI, Polysciences) for untreated and treated conditions. In 18 hours cells were stimulated for 8 hours with a corresponding inducer and harvested in the passive lysis buffer (Promega). Luminescence of Firefly and Renilla luciferases was measured using dual-
.CC-BY 4.0 International licenseavailable under a(which was not certified by peer review) is the author/funder, who has granted bioRxiv a license to display the preprint in perpetuity. It is made
The copyright holder for this preprintthis version posted June 17, 2020. ; https://doi.org/10.1101/2020.06.17.156455doi: bioRxiv preprint
luciferase-reporter assay (Promega) according to the manufacturer’s instructions in a microplate reader (Tecan).
Total amounts of IFN-α/β in cell supernatants were measured by using 293T cells stably expressing the firefly luciferase gene under the control of the mouse Mx1 promoter (Mx1-luc reporter cells)47. Briefly, HEK293RI cells were seeded, transfected with pCAGGS-flag-RIG-I plus viral protein constructs and stimulated as described above. Cell supernatants were harvested in 8 hour. Mx1-luc reporter cells were seeded into 96-well plates in triplicates and were treated 24 hours later with supernatants. At 16 hours post incubation, cells were lysed in the passive lysis buffer (Promega), and luminescence was measured with a microplate reader (Tecan). The assay sensitivity was determined by a standard curve.
Viral inhibitors assay
A549-ACE2 cells were seeded into 96-well plates in DMEM medium (10% FCS, 100 ug/ml Streptomycin, 100 IU/ml Penicillin) one day before infection. Six hours before infection, or at the time of infection, the medium was replaced with 100ul of DMEM medium containing either the compounds of interest or DMSO as a control. Infection was performed by adding 10ul of SARS-CoV-2-GFP (MOI 3) per well and plates were placed in the IncuCyte S3 Live-Cell Analysis System where whole well real-time images of mock (Phase channel) and infected (GFP and Phase channel) cells were captured every 4h for 48h. Cell viability (mock) and virus growth (mock and infected) were assessed as the cell confluence per well (Phase area) and GFP area normalized on cell confluence per well (GFP area/Phase area) respectively using IncuCyte S3 Software (Essen Bioscience; version 2019B Rev2).
References
22. Hubel, P. et al. A protein-interaction network of interferon-stimulated genes extends the innate immune system landscape. Nat. Immunol. 20, 493–502 (2019).
23. Scaturro, P. et al. An orthogonal proteomic survey uncovers novel Zika virus host factors. Nature 561, 253–257 (2018).
24. Hoffmann, M. et al. SARS-CoV-2 Cell Entry Depends on ACE2 and TMPRSS2 and Is Blocked by a Clinically Proven Protease Inhibitor. Cell 181, 271-280.e8 (2020).
25. Gebhardt, A. et al. The alternative cap-binding complex is required for antiviral defense in vivo. PLoS Pathog. 15, e1008155 (2019).
26. Goldeck, M., Schlee, M., Hartmann, G. & Hornung, V. Enzymatic synthesis and purification of a defined RIG-I ligand. Methods Mol. Biol. 1169, 15–25 (2014).
27. Kulak, N. A., Geyer, P. E. & Mann, M. Loss-less Nano-fractionator for High Sensitivity, High Coverage Proteomics. Mol. Cell Proteomics 16, 694–705 (2017).
28. Kulak, N. A., Pichler, G., Paron, I., Nagaraj, N. & Mann, M. Minimal, encapsulated proteomic-sample processing applied to copy-number estimation in eukaryotic cells. Nat. Methods 11, 319–324 (2014).
29. Humphrey, S. J., Karayel, O., James, D. E. & Mann, M. High-throughput and high-sensitivity phosphoproteomics with the EasyPhos platform. Nat Protoc 13, 1897–1916 (2018).
30. Udeshi, N. D., Mertins, P., Svinkina, T. & Carr, S. A. Large-scale identification of ubiquitination sites by mass spectrometry. Nat Protoc 8, 1950–1960 (2013).
31. Tyanova, S., Temu, T. & Cox, J. The MaxQuant computational platform for mass spectrometry-based shotgun proteomics. Nat Protoc 11, 2301–2319 (2016).
32. Carpenter, B. et al. Stan: A Probabilistic Programming Language. Journal of Statistical Software 76, 1–32 (2017).
.CC-BY 4.0 International licenseavailable under a(which was not certified by peer review) is the author/funder, who has granted bioRxiv a license to display the preprint in perpetuity. It is made
The copyright holder for this preprintthis version posted June 17, 2020. ; https://doi.org/10.1101/2020.06.17.156455doi: bioRxiv preprint
33. Bhadra, A., Datta, J., Polson, N. G. & Willard, B. The Horseshoe+ Estimator of Ultra-Sparse Signals. Bayesian Anal. 12, 1105–1131 (2017).
34. Goeminne, L. J. E., Gevaert, K. & Clement, L. Peptide-level Robust Ridge Regression Improves Estimation, Sensitivity, and Specificity in Data-dependent Quantitative Label-free Shotgun Proteomics. Mol. Cell Proteomics 15, 657–668 (2016).
35. Bekker-Jensen, D. B. et al. Rapid and site-specific deep phosphoproteome profiling by data-independent acquisition without the need for spectral libraries. Nat Commun 11, 787 (2020).
36. Tyanova, S. et al. The Perseus computational platform for comprehensive analysis of (prote)omics data. Nat. Methods 13, 731–740 (2016).
37. Hornbeck, P. V. et al. PhosphoSitePlus: a comprehensive resource for investigating the structure and function of experimentally determined post-translational modifications in man and mouse. Nucleic Acids Res 40, D261–D270 (2012).
38. Parekh, S., Ziegenhain, C., Vieth, B., Enard, W. & Hellmann, I. The impact of amplification on differential expression analyses by RNA-seq. Sci Rep 6, 25533 (2016).
39. Macosko, E. Z. et al. Highly Parallel Genome-wide Expression Profiling of Individual Cells Using Nanoliter Droplets. Cell 161, 1202–1214 (2015).
40. Love, M. I., Huber, W. & Anders, S. Moderated estimation of fold change and dispersion for RNA-seq data with DESeq2. Genome Biology 15, 550 (2014).
41. Merico, D., Isserlin, R., Stueker, O., Emili, A. & Bader, G. D. Enrichment map: a network-based method for gene-set enrichment visualization and interpretation. PLoS ONE 5, e13984 (2010).
42. Meldal, B. H. M. et al. Complex Portal 2018: extended content and enhanced visualization tools for macromolecular complexes. Nucleic Acids Res. 47, D550–D558 (2019).
43. Giurgiu, M. et al. CORUM: the comprehensive resource of mammalian protein complexes-2019. Nucleic Acids Res. 47, D559–D563 (2019).
44. Keenan, A. B. et al. ChEA3: transcription factor enrichment analysis by orthogonal omics integration. Nucleic Acids Res. 47, W212–W224 (2019).
45. Landt, S. G. et al. ChIP-seq guidelines and practices of the ENCODE and modENCODE consortia. Genome Res. 22, 1813–1831 (2012).
46. Vogt, C. et al. The interferon antagonist ML protein of thogoto virus targets general transcription factor IIB. J. Virol. 82, 11446–11453 (2008).
47. Jorns, C. et al. Rapid and simple detection of IFN-neutralizing antibodies in chronic hepatitis C non-responsive to IFN-alpha. J. Med. Virol. 78, 74–82 (2006).
.CC-BY 4.0 International licenseavailable under a(which was not certified by peer review) is the author/funder, who has granted bioRxiv a license to display the preprint in perpetuity. It is made
The copyright holder for this preprintthis version posted June 17, 2020. ; https://doi.org/10.1101/2020.06.17.156455doi: bioRxiv preprint
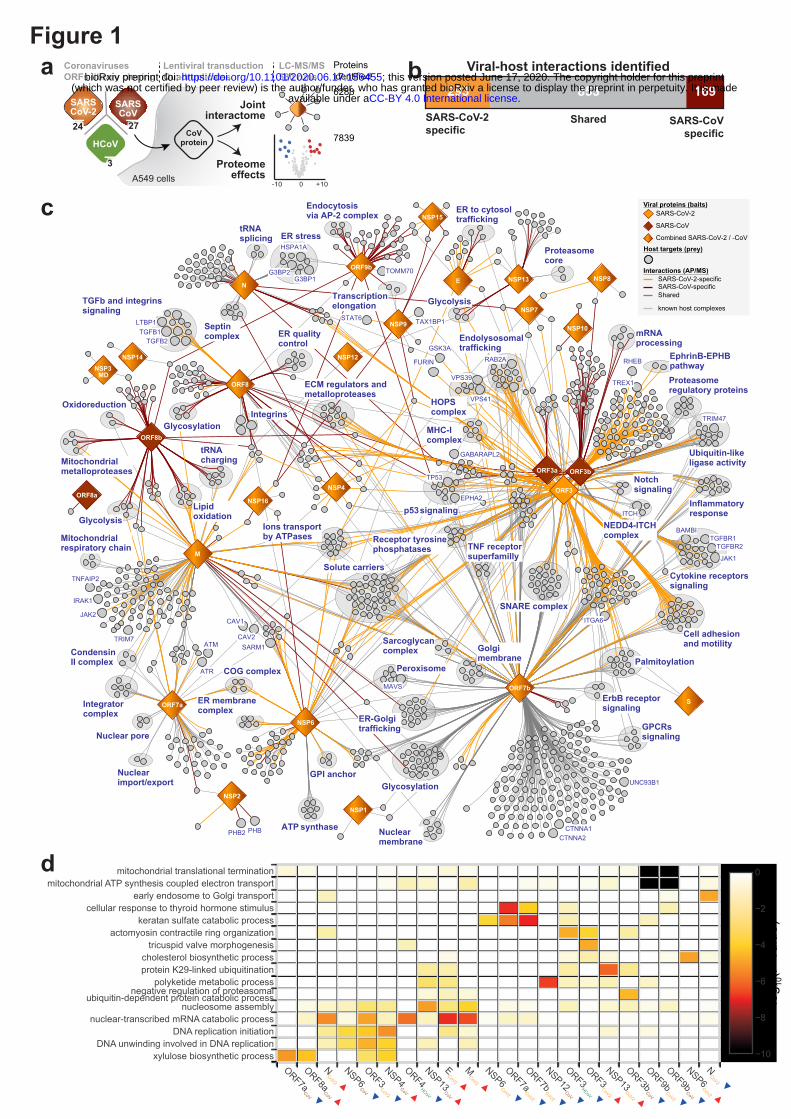
Figure 1a
c
d
b293 853 169
Viral-host interactions identified
SARS-CoV-2specific
SARS-CoVspecific
Shared
ORF7a CoV ▼
ORF8a CoV ▲
N CoV2 ▲NSP6 CoV ▼
ORF3 CoV2 ▼
NSP4 CoV ▲
ORF4 HCoV ▼
NSP13 CoV ▲
E CoV2 ▲M CoV2 ▲
NSP6 CoV2 ▼
ORF7a CoV2 ▼
ORF7b CoV2 ▼
NSP12 CoV ▼
ORF3 HCoV ▼
ORF3 CoV2 ▲
NSP13 CoV2 ▲
ORF3b CoV ▼
ORF9b CoV2 ▼
ORF9b CoV ▼
NSP6 CoV2 ▲
N CoV2 ▼
xylulose biosynthetic processDNA unwinding involved in DNA replication
DNA replication initiationnuclear-transcribed mRNA catabolic process
nucleosome assemblynegative regulation of proteasomal
ubiquitin-dependent protein catabolic processpolyketide metabolic process
protein K29-linked ubiquitinationcholesterol biosynthetic process
tricuspid valve morphogenesisactomyosin contractile ring organization
keratan sulfate catabolic processcellular response to thyroid hormone stimulus
early endosome to Golgi transportmitochondrial ATP synthesis coupled electron transport
mitochondrial translational termination
−10
−8
−6
−4
−2
0
log 1
0(P-v
alue
)
ORF7b
ORF7a
NSP1
ATM
RHEB
TRIM7
ORF8b
M
NSP7
ITGA6
GSK3A
CTNNA2
NSP6
FURIN
CAV1
ORF3a
IRAK1
NSP10
NSP16
ORF8
NSP12
UNC93B1
STAT6
ATR
TREX1
CAV2
PHB2
NSP9
N
TAX1BP1
CTNNA1
NSP14
NSP13
ORF9b
E
S
PHB
NSP2
SARM1
ORF8a
TOMM70
ORF3b
ORF3
NSP8
GABARAPL2
NSP15
NSP3MD
TNFAIP2
NSP4
JAK2
Solute carriers
Ions transportby ATPases
Peroxisome
MAVS
SNARE complex
GPCRssignaling
ER stressHSPA1A
G3BP2G3BP1
MHC-Icomplex
Notchsignaling
Endolysosomaltrafficking
RAB2A
HOPScomplex
VPS41
VPS39 Proteasome regulatory proteins
Proteasomecore
Ubiquitin-likeligase activity
TRIM47
Mitochondrialmetalloproteases
tRNAcharging
ECM regulators andmetalloproteases
ATP synthase
ER membrane complex
Endocytosisvia AP-2 complex
GPI anchor
Integratorcomplex
Septincomplex
Glycolysis
Glycolysis
Nuclearimport/export
tRNAsplicing
Mitochondrialrespiratory chain
CondensinII complex
Glycosylation
Glycosylation
Lipidoxidation
Palmitoylation
mRNAprocessing
Oxidoreduction
Nuclear pore
Nuclearmembrane
Transcriptionelongation
ER qualitycontrol
Inflammatoryresponse
Cytokine receptorssignaling
JAK1
TGFBR2TGFBR1
BAMBI
TGFb and integrinssignaling
TGFB2TGFB1
LTBP1
Integrins
TNF receptorsuperfamilly
p53signaling
TP53
EPHA2
Receptor tyrosinephosphatases
COG complex
Golgimembrane
ER to cytosoltrafficking
Sarcoglycancomplex
ErbB receptorsignaling
EphrinB-EPHBpathway
NEDD4-ITCHcomplex
ITCH
Cell adhesionand motility
ER-Golgitrafficking
Viral proteins (baits)
Interactions (AP/MS)
Host targets (prey)Combined SARS-CoV-2 / -CoV
SARS-CoV
Shared
known host complexes
SARS-CoV-specificSARS-CoV-2-specific
SARS-CoV-2
CoVprotein
A549 cells0 +10-10
Jointinteractome
Proteomeeffects
6288
7839
Lentiviral transductionQuadruplicates
LC-MS/MS580 runs
CoronavirusesORFs library cloning
Proteinsidentified
SARSCoV
SARSCoV-2
HCoV
24
3
27
.CC-BY 4.0 International licenseavailable under a(which was not certified by peer review) is the author/funder, who has granted bioRxiv a license to display the preprint in perpetuity. It is made
The copyright holder for this preprintthis version posted June 17, 2020. ; https://doi.org/10.1101/2020.06.17.156455doi: bioRxiv preprint
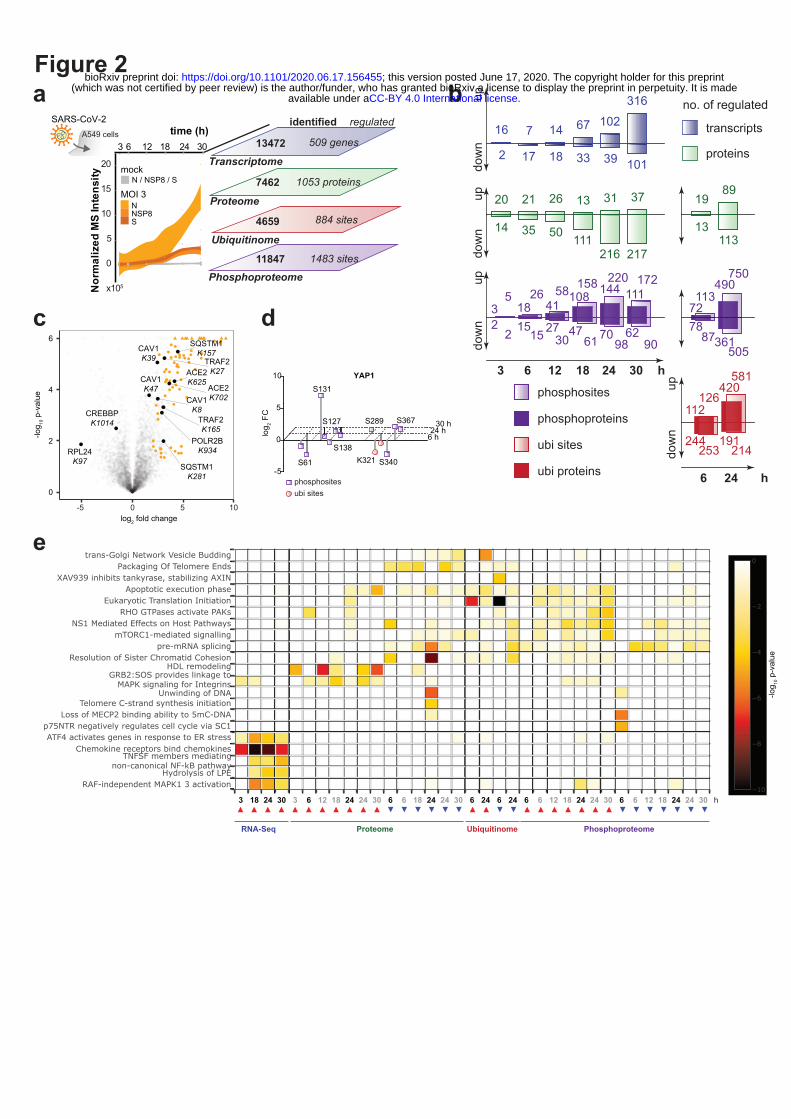
Figure 2a b
cx105
identified regulated
Transcriptome
Proteome
Ubiquitinome
Phosphoproteome
13472 509 genes
7462 1053 proteins
4659 884 sites
11847 1483 sites
time (h)3 6 12 18 24 30
0
5
10
15
20
Nor
mal
ized
MS
Inte
nsity N / NSP8 / S
NNSP8S
mock
MOI 3
SARS-CoV-2A549 cells
e
POLR2BK934RPL24
K97
CAV1K39
CAV1K47
CAV1K8
TRAF2K165
TRAF2K27
SQSTM1K157
SQSTM1K281
CREBBPK1014
ACE2K625
ACE2K702
0
2
4
6
log2 fold change
-log 10
p-v
alue
-5 0 5 10
d
3▲
18▲
24▲
30▲
3▲
6▲
12▲
18▲
24▲
24▲
30▲
6▼
6▼
18▼
24▼
24▼
30▼
6▲
24▲
6▼
24▼
6▲
6▲
12▲
18▲
24▲
24▲
30▲
6▼
12▼
18▼
24▼
24▼
30▼
RNA-Seq Proteome Ubiquitinome Phosphoproteome
h
-log 10
p-v
alue
RAF-independent MAPK1 3 activationHydrolysis of LPE
TNFSF members mediatingnon-canonical NF-kB pathway
Chemokine receptors bind chemokinesATF4 activates genes in response to ER stress
p75NTR negatively regulates cell cycle via SC1Loss of MECP2 binding ability to 5mC-DNA
Telomere C-strand synthesis initiationUnwinding of DNA
GRB2:SOS provides linkage toMAPK signaling for Integrins
HDL remodelingResolution of Sister Chromatid Cohesion
pre-mRNA splicingmTORC1-mediated signalling
NS1 Mediated Effects on Host PathwaysRHO GTPases activate PAKs
Eukaryotic Translation InitiationApoptotic execution phase
XAV939 inhibits tankyrase, stabilizing AXINPackaging Of Telomere Ends
trans-Golgi Network Vesicle Budding
−10
−8
−6
−4
−2
0
6▼
transcripts16 7 14 67 102316
2 17 18 33 39 101
20 21 26 13 31 37
14 35 50 111216 217
1989
13113
3 6 12 18 24 30
3 18 41108 144 1115 26 58 158 220 172
215 27 47 70 622 15
30 61 98 90
72
490113
750
7836187
505
6 24
112
420126
581
244 191253 214
proteins
phosphosites
phosphoproteins
ubi sites
ubi proteins
h
h
24 h
-5
0
5
10
K321 S340
S367
S138
S131
S61
S289S127
log 2 F
C
30 h6 h
YAP1
phosphositesubi sites
updo
wn
updo
wn
updo
wn
updo
wn
no. of regulated.CC-BY 4.0 International licenseavailable under a(which was not certified by peer review) is the author/funder, who has granted bioRxiv a license to display the preprint in perpetuity. It is made
The copyright holder for this preprintthis version posted June 17, 2020. ; https://doi.org/10.1101/2020.06.17.156455doi: bioRxiv preprint
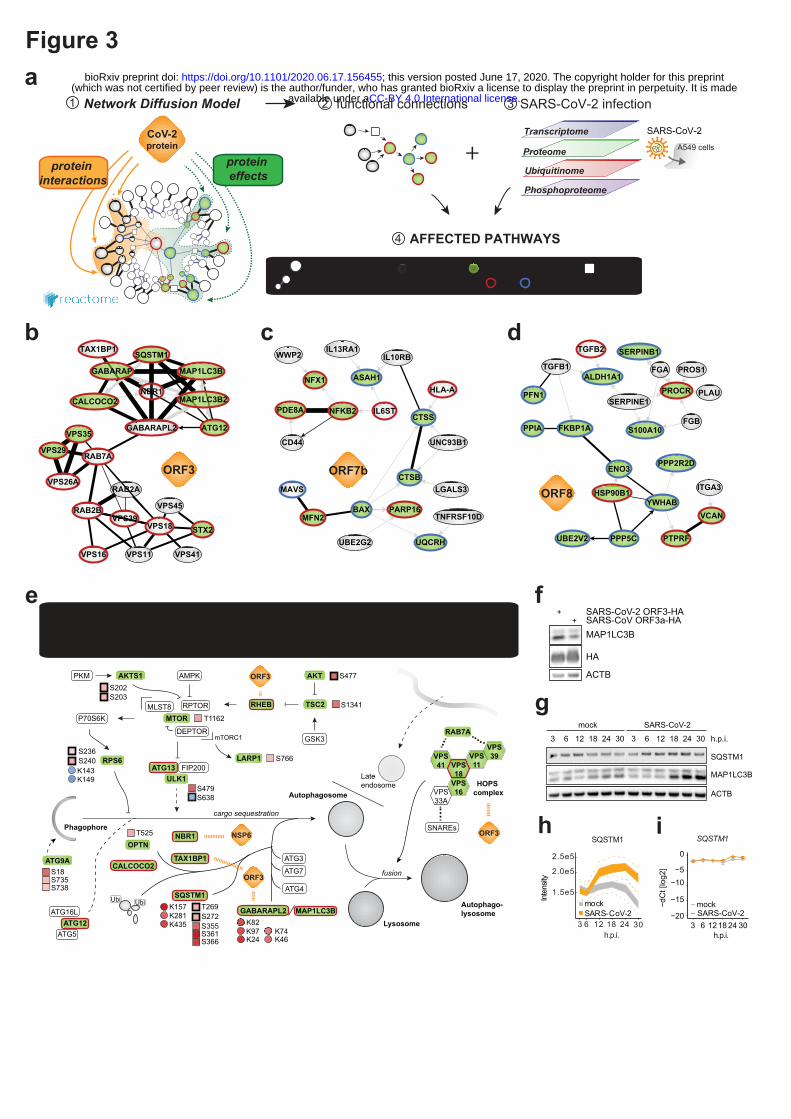
Figure 3
db c
fe
HA
MAP1LC3B
ACTB
SARS-CoV ORF3a-HA+SARS-CoV-2 ORF3-HA+
MAP1LC3B
h.p.i.30241812633024181263
SARS-CoV-2mock
SQSTM1
ACTB
i
g
−20
−15
−10−5
0
3 6 1218 24 30
−dC
t [lo
g2]
mockSARS-CoV-2
SQSTM1
h.p.i.
a
CoV-2protein
protein interactions
protein effects
+Ubiquitinome
Phosphoproteome
Proteome
SARS-CoV-2
A549 cells
Network Diffusion Model1 functional connections2 SARS-CoV-2 infection3
AFFECTED PATHWAYS4
Lysosome
Autophagosome
Autophago-lysosome
fusion
Phagophore
UbiUbi
cargo sequestration
VPS41 VPS
18
VPS11
VPS39
VPS16VPS
33A
HOPS complex
mTORC1
-2 -1 0 1 2 3 4 5
S479S638
T269S272S355S361S366
K157K281K435 K82
K97K24
K74K46
S1341
S477S202S203
S18S735S738
S766
PKM AKTS1 AMPK
GABARAPL2
ATG4
ATG7ATG3
SQSTM1
NBR1
ATG16LATG12
ATG5
ATG9A
ULK1FIP200ATG13
LARP1
P70S6K
RPTORMLST8MTOR
DEPTOR
RHEB TSC2
AKT
GSK3
SNAREs
RAB7A
ORF3
RPS6
Late endosome
MAP1LC3B
T1162
S236S240
ORF3
CALCOCO2
OPTN
TAX1BP1
ORF3
NSP6T525
log2 fold changePhospho(S/T) site regulatory site
known siteUbi(K) site unknownsite up-/downregulated
interaction
SARS-CoV-2 infection SARS-CoV-2 proteins
K143K149
hSQSTM1
1.5e5
2.0e5
2.5e5
Inte
nsity
mockSARS-CoV-2
3 6 12 18 24 30h.p.i.
interactor regulated proteinup down
linkingprotein
global cellularnetwork
Transcriptome
ORF3
ORF8
ORF7b ENO3
FKBP1A
HSP90B1
PFN1
PPIA
PPP5C
S100A10
UBE2V2
YWHAB
PPP2R2D
ALDH1A1
PTPRF
VCAN
PROCR
SERPINB1
FGA
FGB
ITGA3
PLAU
PROS1
SERPINE1
TGFB1
TGFB2
ATG12
CALCOCO2
GABARAP
GABARAPL2
MAP1LC3B
MAP1LC3B2NBR1
RAB2B
RAB7A
SQSTM1
STX2
TAX1BP1
VPS18
VPS26A
VPS29
VPS35
VPS39
RAB2A
VPS11VPS16 VPS41
VPS45 BAX
CTSB
CTSS
MFN2
NFKB2PDE8A
UQCRH
ASAH1NFX1
PARP16
CD44
HLA-A
IL10RBIL13RA1
IL6ST
LGALS3MAVS
TNFRSF10D
UBE2G2
UNC93B1
WWP2
.CC-BY 4.0 International licenseavailable under a(which was not certified by peer review) is the author/funder, who has granted bioRxiv a license to display the preprint in perpetuity. It is made
The copyright holder for this preprintthis version posted June 17, 2020. ; https://doi.org/10.1101/2020.06.17.156455doi: bioRxiv preprint
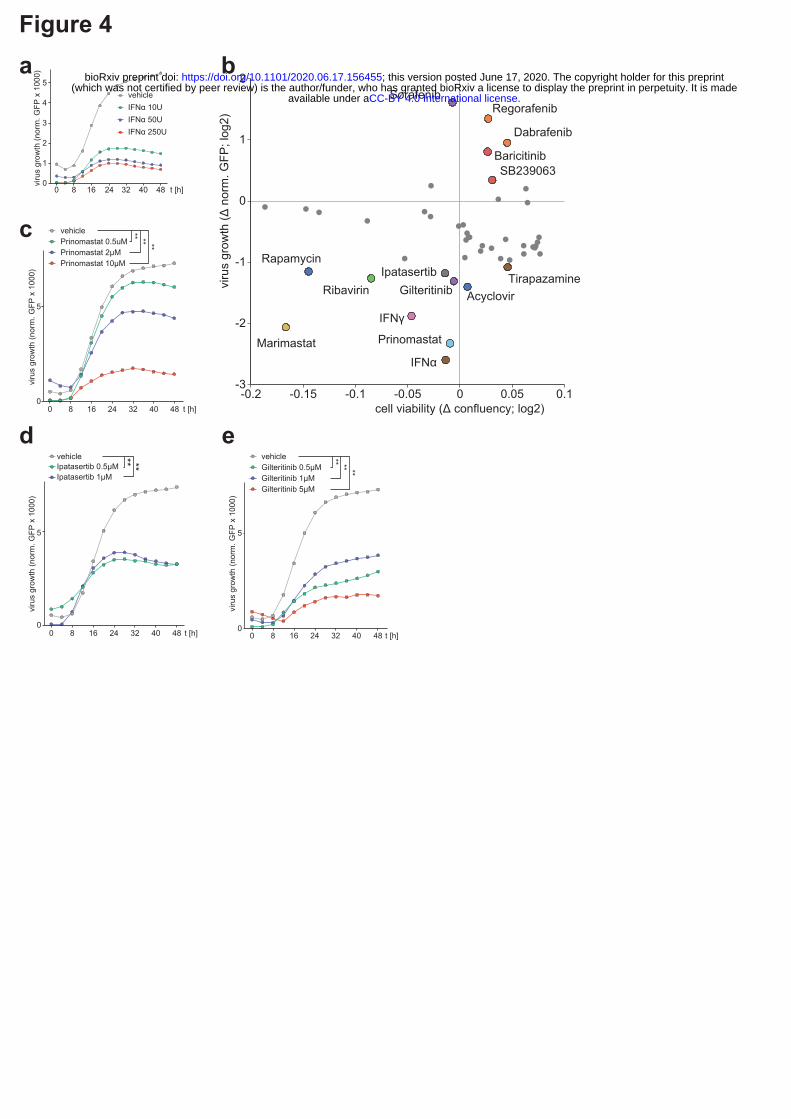
Figure 4b
IFNγ
IFNα
Acyclovir Tirapazamine
Sorafenib
SB239063
Ribavirin
Regorafenib
Rapamycin
Prinomastat Marimastat
Ipatasertib Gilteritinib
Dabrafenib
Baricitinib
-0.2 -0.15 -0.1 -0.05 0 0.05 0.1-3
-2
-1
0
1
2
cell viability (Δ confluency; log2)
viru
s gr
owth
(Δ n
orm
. GFP
; log
2)
0
5
0 8 16 24 32 40 48 t [h]
d
a
0 8 16 24 32 40 480
1
2
3
4
5
IFNα 50UIFNα 250U
IFNα 10Uvehicle
t [h]
c
0 8 16 24 32 40 48 t [h]0
5
Prinomastat 10µMPrinomastat 2µMPrinomastat 0.5uMvehicle ** ** **
0 8 16 24 32 40 48 t [h]0
5
viru
s gr
owth
(nor
m. G
FP x
100
0)
e
Gilteritinib 5µMGilteritinib 1µMGilteritinib 0.5µMvehicle ** ** **
**
Ipatasertib 1µMIpatasertib 0.5µM
**
vehicle
viru
s gr
owth
(nor
m. G
FP x
100
0)vi
rus
grow
th (n
orm
. GFP
x 1
000)
viru
s gr
owth
(nor
m. G
FP x
100
0)
.CC-BY 4.0 International licenseavailable under a(which was not certified by peer review) is the author/funder, who has granted bioRxiv a license to display the preprint in perpetuity. It is made
The copyright holder for this preprintthis version posted June 17, 2020. ; https://doi.org/10.1101/2020.06.17.156455doi: bioRxiv preprint
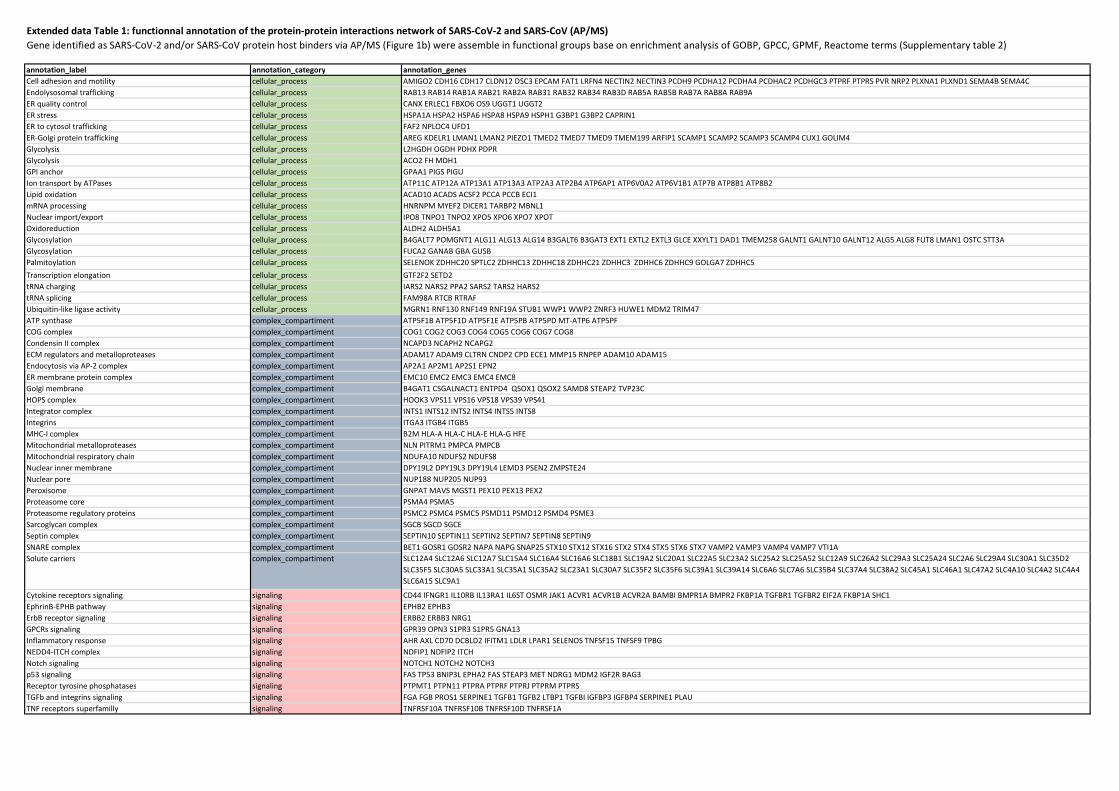
annotation_label annotation_category annotation_genesCell adhesion and motility cellular_process AMIGO2 CDH16 CDH17 CLDN12 DSC3 EPCAM FAT1 LRFN4 NECTIN2 NECTIN3 PCDH9 PCDHA12 PCDHA4 PCDHAC2 PCDHGC3 PTPRF PTPRS PVR NRP2 PLXNA1 PLXND1 SEMA4B SEMA4CEndolysosomal trafficking cellular_process RAB13 RAB14 RAB1A RAB21 RAB2A RAB31 RAB32 RAB34 RAB3D RAB5A RAB5B RAB7A RAB8A RAB9AER quality control cellular_process CANX ERLEC1 FBXO6 OS9 UGGT1 UGGT2ER stress cellular_process HSPA1A HSPA2 HSPA6 HSPA8 HSPA9 HSPH1 G3BP1 G3BP2 CAPRIN1ER to cytosol trafficking cellular_process FAF2 NPLOC4 UFD1ER-Golgi protein trafficking cellular_process AREG KDELR1 LMAN1 LMAN2 PIEZO1 TMED2 TMED7 TMED9 TMEM199 ARFIP1 SCAMP1 SCAMP2 SCAMP3 SCAMP4 CUX1 GOLIM4Glycolysis cellular_process L2HGDH OGDH PDHX PDPRGlycolysis cellular_process ACO2 FH MDH1GPI anchor cellular_process GPAA1 PIGS PIGUIon transport by ATPases cellular_process ATP11C ATP12A ATP13A1 ATP13A3 ATP2A3 ATP2B4 ATP6AP1 ATP6V0A2 ATP6V1B1 ATP7B ATP8B1 ATP8B2Lipid oxidation cellular_process ACAD10 ACADS ACSF2 PCCA PCCB ECI1mRNA processing cellular_process HNRNPM MYEF2 DICER1 TARBP2 MBNL1Nuclear import/export cellular_process IPO8 TNPO1 TNPO2 XPO5 XPO6 XPO7 XPOTOxidoreduction cellular_process ALDH2 ALDH5A1Glycosylation cellular_process B4GALT7 POMGNT1 ALG11 ALG13 ALG14 B3GALT6 B3GAT3 EXT1 EXTL2 EXTL3 GLCE XXYLT1 DAD1 TMEM258 GALNT1 GALNT10 GALNT12 ALG5 ALG8 FUT8 LMAN1 OSTC STT3AGlycosylation cellular_process FUCA2 GANAB GBA GUSBPalmitoylation cellular_process SELENOK ZDHHC20 SPTLC2 ZDHHC13 ZDHHC18 ZDHHC21 ZDHHC3 ZDHHC6 ZDHHC9 GOLGA7 ZDHHC5Transcription elongation cellular_process GTF2F2 SETD2tRNA charging cellular_process IARS2 NARS2 PPA2 SARS2 TARS2 HARS2tRNA splicing cellular_process FAM98A RTCB RTRAFUbiquitin-like ligase activity cellular_process MGRN1 RNF130 RNF149 RNF19A STUB1 WWP1 WWP2 ZNRF3 HUWE1 MDM2 TRIM47ATP synthase complex_compartiment ATP5F1B ATP5F1D ATP5F1E ATP5PB ATP5PD MT-ATP6 ATP5PFCOG complex complex_compartiment COG1 COG2 COG3 COG4 COG5 COG6 COG7 COG8Condensin II complex complex_compartiment NCAPD3 NCAPH2 NCAPG2ECM regulators and metalloproteases complex_compartiment ADAM17 ADAM9 CLTRN CNDP2 CPD ECE1 MMP15 RNPEP ADAM10 ADAM15Endocytosis via AP-2 complex complex_compartiment AP2A1 AP2M1 AP2S1 EPN2ER membrane protein complex complex_compartiment EMC10 EMC2 EMC3 EMC4 EMC8Golgi membrane complex_compartiment B4GAT1 CSGALNACT1 ENTPD4 QSOX1 QSOX2 SAMD8 STEAP2 TVP23CHOPS complex complex_compartiment HOOK3 VPS11 VPS16 VPS18 VPS39 VPS41Integrator complex complex_compartiment INTS1 INTS12 INTS2 INTS4 INTS5 INTS8Integrins complex_compartiment ITGA3 ITGB4 ITGB5MHC-I complex complex_compartiment B2M HLA-A HLA-C HLA-E HLA-G HFEMitochondrial metalloproteases complex_compartiment NLN PITRM1 PMPCA PMPCBMitochondrial respiratory chain complex_compartiment NDUFA10 NDUFS2 NDUFS8Nuclear inner membrane complex_compartiment DPY19L2 DPY19L3 DPY19L4 LEMD3 PSEN2 ZMPSTE24Nuclear pore complex_compartiment NUP188 NUP205 NUP93Peroxisome complex_compartiment GNPAT MAVS MGST1 PEX10 PEX13 PEX2Proteasome core complex_compartiment PSMA4 PSMA5Proteasome regulatory proteins complex_compartiment PSMC2 PSMC4 PSMC5 PSMD11 PSMD12 PSMD4 PSME3Sarcoglycan complex complex_compartiment SGCB SGCD SGCESeptin complex complex_compartiment SEPTIN10 SEPTIN11 SEPTIN2 SEPTIN7 SEPTIN8 SEPTIN9 SNARE complex complex_compartiment BET1 GOSR1 GOSR2 NAPA NAPG SNAP25 STX10 STX12 STX16 STX2 STX4 STX5 STX6 STX7 VAMP2 VAMP3 VAMP4 VAMP7 VTI1ASolute carriers complex_compartiment SLC12A4 SLC12A6 SLC12A7 SLC15A4 SLC16A4 SLC16A6 SLC18B1 SLC19A2 SLC20A1 SLC22A5 SLC23A2 SLC25A2 SLC25A52 SLC12A9 SLC26A2 SLC29A3 SLC25A24 SLC2A6 SLC29A4 SLC30A1 SLC35D2
SLC35F5 SLC30A5 SLC33A1 SLC35A1 SLC35A2 SLC23A1 SLC30A7 SLC35F2 SLC35F6 SLC39A1 SLC39A14 SLC6A6 SLC7A6 SLC35B4 SLC37A4 SLC38A2 SLC45A1 SLC46A1 SLC47A2 SLC4A10 SLC4A2 SLC4A4 SLC6A15 SLC9A1
Cytokine receptors signaling signaling CD44 IFNGR1 IL10RB IL13RA1 IL6ST OSMR JAK1 ACVR1 ACVR1B ACVR2A BAMBI BMPR1A BMPR2 FKBP1A TGFBR1 TGFBR2 EIF2A FKBP1A SHC1EphrinB-EPHB pathway signaling EPHB2 EPHB3ErbB receptor signaling signaling ERBB2 ERBB3 NRG1GPCRs signaling signaling GPR39 OPN3 S1PR3 S1PR5 GNA13 Inflammatory response signaling AHR AXL CD70 DCBLD2 IFITM1 LDLR LPAR1 SELENOS TNFSF15 TNFSF9 TPBGNEDD4-ITCH complex signaling NDFIP1 NDFIP2 ITCHNotch signaling signaling NOTCH1 NOTCH2 NOTCH3p53 signaling signaling FAS TP53 BNIP3L EPHA2 FAS STEAP3 MET NDRG1 MDM2 IGF2R BAG3Receptor tyrosine phosphatases signaling PTPMT1 PTPN11 PTPRA PTPRF PTPRJ PTPRM PTPRSTGFb and integrins signaling signaling FGA FGB PROS1 SERPINE1 TGFB1 TGFB2 LTBP1 TGFBI IGFBP3 IGFBP4 SERPINE1 PLAUTNF receptors superfamilly signaling TNFRSF10A TNFRSF10B TNFRSF10D TNFRSF1A
Extended data Table 1: functionnal annotation of the protein-protein interactions network of SARS-CoV-2 and SARS-CoV (AP/MS)Gene identified as SARS-CoV-2 and/or SARS-CoV protein host binders via AP/MS (Figure 1b) were assemble in functional groups base on enrichment analysis of GOBP, GPCC, GPMF, Reactome terms (Supplementary table 2)
.CC-BY 4.0 International licenseavailable under a(which was not certified by peer review) is the author/funder, who has granted bioRxiv a license to display the preprint in perpetuity. It is made
The copyright holder for this preprintthis version posted June 17, 2020. ; https://doi.org/10.1101/2020.06.17.156455doi: bioRxiv preprint
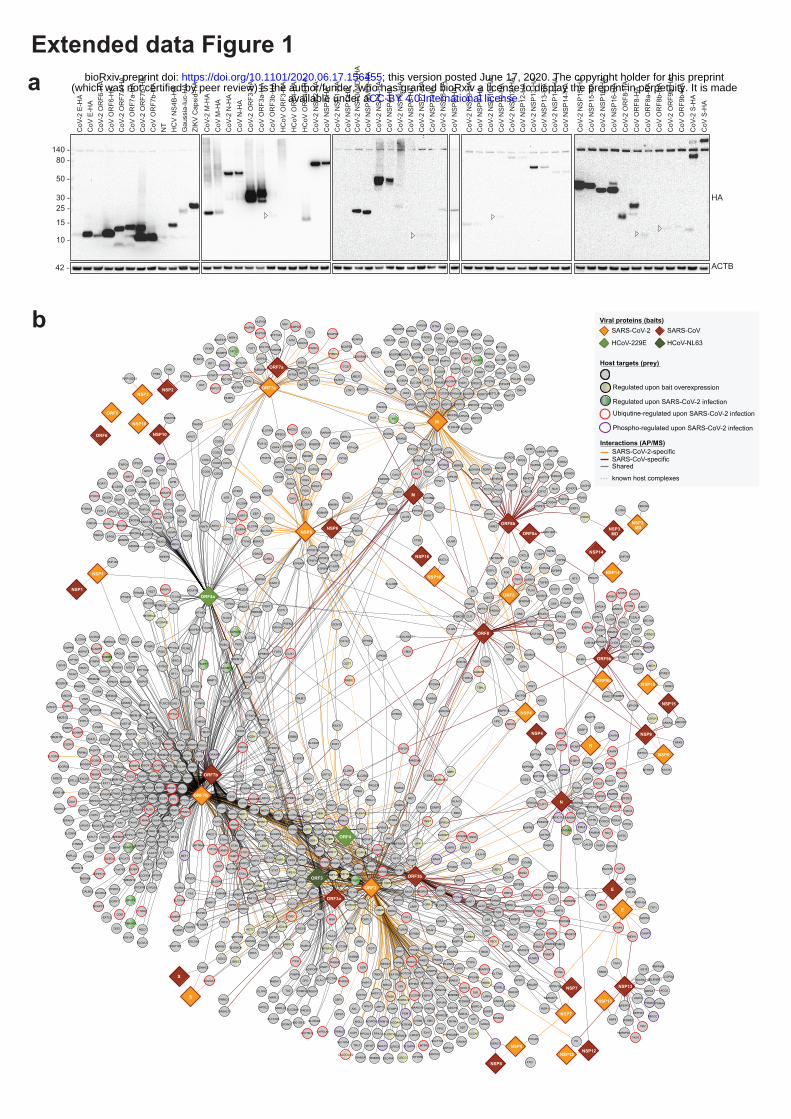
Extended data Figure 1a
b
CoV
-2 O
RF6
-HA
CoV
E-H
AC
oV-2
E-H
A
HA
CoV
OR
F6-H
A
80 -140 -
50 -
30 -25 -
15 -
10 -
CoV
-2 O
RF7
b-H
AC
oV O
RF7
a-H
AC
oV-2
OR
F7a-
HA
CoV
OR
F7b-
HA
Gau
ssia
-luc-
HA
HC
V N
S4B-
HA
NT
ZIKV
Cap
sid-
HA
CoV
-2 N
-HA
CoV
M-H
AC
oV-2
M-H
A
CoV
N-H
A
CoV
OR
F3b-
HA
CoV
OR
F3a-
HA
CoV
-2 O
RF3
-HA
HC
oV O
RF3
-HA
CoV
-2 N
SP2-
HA
HC
oV O
RF4
a-H
AH
CoV
OR
F4-H
A
CoV
NSP
2-H
A
CoV
-2 N
SP3(
MD
)-HA
CoV
NSP
1-H
AC
oV-2
NSP
1-H
A
CoV
NSP
3(M
D)-H
A
CoV
-2 N
SP6-
HA
CoV
NSP
4-H
AC
oV-2
NSP
4-H
A
CoV
NSP
6-H
A
CoV
-2 N
SP8-
HA
CoV
NSP
7-H
AC
oV-2
NSP
7-H
A
CoV
-2 N
SP10
-HA
CoV
NSP
9-H
AC
oV-2
NSP
9-H
A
CoV
NSP
10-H
A
CoV
-2 N
SP13
-HA
CoV
NSP
12-H
AC
oV-2
NSP
12-H
A
CoV
NSP
13-H
A
CoV
NSP
14-H
AC
oV-2
NSP
14-H
A
CoV
-2 N
SP16
-HA
CoV
NSP
15-H
AC
oV-2
NSP
15-H
A
CoV
NSP
16-H
A
CoV
OR
F8a-
HA
CoV
OR
F8-H
AC
oV-2
OR
F8-H
A
CoV
OR
F8b-
HA
CoV
-2 S
-HA
CoV
OR
F9b-
HA
CoV
-2 O
RF9
b-H
A
CoV
S-H
A
CoV
NSP
8-H
A
42 - ACTB
Interactions (AP/MS)
Shared
known host complexes
SARS-CoV-specificSARS-CoV-2-specific
Viral proteins (baits)
HCoV-229E
SARS-CoVSARS-CoV-2
HCoV-NL63
Host targets (prey)
Ubiqutine-regulated upon SARS-CoV-2 infection
Regulated upon SARS-CoV-2 infection
Phospho-regulated upon SARS-CoV-2 infection
Regulated upon bait overexpression
ORF7b
ORF7a
NSP1
NSP1
NF1
IPO11
PPP1R12B
SS18
FKBP9
GPR89A
TRIM47
ADCY6
ABCC10
SLK
B4GALT1
ATM
ATP8B1
RNF8
PCCA
IGFBP3
GOLM1
RAP1GDS1
TMUB1
SEC31A
SEPTIN10SRPRA
CCNT1
DENND11
TMEM237
ABCB8
RHEB
ACVR2A
UBIAD1
PROCR
TGOLN2
STOML2
NSF
CD99L2
ADGRA3
PLEKHG4
RFT1
SEPTIN9
TRIM7
ORF8b
LDLR
NRG1
VPS13A
SLC4A2
ADAM15
KLHDC2
SEPTIN2
SLC4A10
AP2A1
BMPR1A
TPD52
MPZL1
LSS
FKBP8
CLU
M
PMEPA1
SHC1
HPCAL1
SLC29A3
RNF19A
SLC35D2
TCEAL4
FAS
ATP2B4
ATP7B
SPNS1 GNA13
ACSF2
CAMSAP2
KIAA0355
PRPF40B
TGFB2
TMEM254
PTPA
MARC1
MOB4
VAMP4
TNIP1
MYEF2
USP9X
B4GALT7
SELENOK
HOOK2
TM9SF3
FOCAD
XPO6
PGAP2
ZDHHC3 SUGT1
LSM14A
LRP12
APP
NCAPH2
SELENOF
COG5
NSP7
HNRNPDL
C19orf25
MAGED1
ACVR1B
CAVIN2
NACA
ALDH5A1
STX2
TVP23C
HSP90AB4P
ATP2A3
ITGA6
RHBDD3
RNF145
TP53
CYB5A
TM9SF1
NCDN
DTNB
FGA
TGFB1
STRAP
SYMPK
CLTRN
ACADS
NCAPG2
MICOS13
CYBRD1
SEPHS1
BMPR2
VPS18
LCLAT1
MGLL
ACO2
EVI5
ABCB10
REEP6 ZNF250
ANXA6
GSK3A
TMEM248
HMOX2
AP2M1
SCARB1
ITGB4
SEMA4C
NDUFB5
RINT1
DPAGT1
PSME3
EPHB2
MCFD2
DPY19L3
EVA1C
MET
NEMF
TBC1D20
TGFBI
APOL2
CSGALNACT1PKN1
EMC10 FPGS
BCAP31
MYOF
NRSN2
UBQLN1
CTNNA2
TMTC4
FAM49B
TSKU
TMED7
MTFR1L
NFE2L2
NOVA1
ATP12A
NSP6
HFE
METTL16
SLC39A14
DLG1
ADIPOR1
VAMP3
BSCL2
VPS41
ATP13A3
NR2C2
ERBB2
MBNL1
PRRC1
CIP2A
GINM1
LRIG3
SLC4A4
IMPA2
FLRT3
USP34
IMMP1L
ZDHHC5
TNFRSF10B
ERGIC2
EPN2
DDT
PPA2
SPINT2
MTCH1
TAZ
CLIP1
NEO1
FURIN
SLC37A4
LMAN1
DICER1
USO1GOLGB1
CAV1
CNEP1R1
CAPRIN1ADGRG1
L2HGDHTHADA
RUFY2
DAD1
SHTN1
PDS5B
PXMP4
LTBR
ATG9A
TNPO3
AGMAT
PCDH9
RIF1
ENTPD4
SLC38A2
CCAR2
PVR
ORF3a
KIAA0930
TTF1
ZMPSTE24
MGRN1
LMO7
DGLUCY
RAB3D
DNAJB1
MICA
LMCD1
SNX27
GALNT12
VPS26A
UGCG
SLC16A4
AGPAT3
NDFIP2
NCOA4
IRAK1
EPHA2
MARCKS
SEPTIN8
VDAC2
HDGF
TNPO1
SGSM3
SCAMP1
ATE1
SORT1
NEK9
MEAK7
SAMD8
SLC35B4
NEDD1
MTX1
STAM2
IGFBP4
HMGCR
TMEM106C
PTDSS2
UGGT2
PLAU
DSC3
PPIC
BNIP3L
TTYH3
LAPTM4A
RBFOX2
CRIM1
PPP2R1B
HSPA9
LRP10
GPI
GPX8
PLP2
HSPA1A
ORC4
DYNC2H1
ATL2
CYP51A1
ITM2C
ADPGK
ZNRF3
ATP11C
STIP1
GNAQ
AP2S1
HSPE1
SLC29A4
MALL
GUSB
NSP10
HSPA6
UPK3B
PDHX
PCDHAC2
ATP5F1E
MDN1
EIF2A
EIF2S3
PI4K2A
NUP93
GNPAT
GALNT10
UNC13D
PIGU
PLPP6
TMF1
C2CD2
MDH1
ATP5F1B
DLGAP4
SARS2
NETO2
NSP16
CD97
TWSG1
MTPN
ORF8
CYP4F8
TBL2
IFNGR1
POMT1
CSDE1
TUSC3
ENTPD6
MDM2
JAK1
NAA10
EPG5
VTI1A
UBE3C
CASC4
ODR4
LDAH
NDC1
MED24
SERPINE1
MRPL1
LPAR1
BICRA
TOM1L1
ALG5
MIPEP
ANO6
PTPRF
DHRS7
TRO
PASK
PIGO
LRP11
VEZT
CDH16
PRXL2A
NSP12
ORF4a
CCDC115
NDUFS2
UNC93B1
CA12
CD38
QSOX1
ZDHHC20
CYP2S1
SGCE
ATP8B2
TM9SF4
EZR
GFM1
STEAP3
CERS2
MGST1
PSEN2
TMEM135
PALM
MOSPD2
ALG11
COPG2
NBEAL2
EXOC6B
RAB21
EMC2
PEX2
PTPRA
SEPTIN7
POLD3
MAPRE1
TNFRSF21
EFHD2
ATXN10
PRPF39
CNDP2
GTF2F2
FBXO2
TSN
GGH
LRRC8D
BAG2
C5
TMEM70
RAB34
NDUFB11
ADAM17
SERPINE2
BTAF1
RAB14
PPP4R2
COG3
ORAI1
RTCB
HIGD2A
AKR1B1
NPTX1
SNAP25
UFD1
TRIM9
TGFBR2
MTHFD1
MACO1
MAP4
TGFBR1
DRAM2
ADGRG6
FASTKD1
TCTN3
ZDHHC18
COQ8B
MAN2A1
DEGS1
PCNP
S1PR3
GEMIN6
PRKCSH
SETD2
UNC50
METTL7B
SLC6A15
CALU
FDFT1
HSD17B12 LRFN4
SCAMP2
PSMC5
PLIN3
MT-ATP6
TNFRSF1A
RAB32
TBRG4
BMERB1
YIPF4
HLA-DMB
TMEM87A
EXOC8
CLASP1
GOLGA7
ARSE
CTTN
PCDHGC3
IARS2
ELOVL6
RELL1
YKT6
SLC16A6
GALNT1
TMEM156
BAG5
LPCAT3
TRIM59
RAD17
SLC39A1
KIAA0319
SPG11
PDS5A
PSMD11
PNKD
SELENBP1
VTI1B
FADS2
MAN1B1
INTS5
PSMA4
GBA
DYM
SCAMP4
MTHFD1L
TMED10
PMM2
ACP2
XPO4
UBL3
TOR3A
GLMN
ATP13A1
AHR
STAT6
TTI1
C1QL1
ANGPT4
ATR
CNTNAP3B
AXL
SLC12A4
AKR7A2
PNPLA2
ANKIB1
RMND1
PIGT
DDX39BCS
P3H4
ITCH
TREX1
SPIRE1
SLC45A1
LRP8
RBM4B
ELOVL5
BCAMUBE2G2
NTS
FH
TSPAN14
CAV2
RB1CC1
EXTL2
IL6ST
CD99
IL13RA1
UPK1B
SMCHD1
ARHGEF2
HACD2
HOOK3
OPN3
ERBB3
AMIGO2
TARS2
ACAT1
RNF213
OPA3
RNF149
ADAM10
TKFC
CCDC9
PHB2
DCAKDPGM1
MFSD3
SGCD
PEG10
NSP9
TMED4
ACVR1
TRIM16
N
NPLOC4
PTGR1
EMC4
TAX1BP1
ZDHHC21
TOR1A
TPBG
FADS3
AKR1A1
ZDHHC6
FKRP
CANX
APOOL
FSCN1
STX10
SLC2A6
CTNNA1
B2M
PRPS2
STT3A
NSP14
EBP
ECE1
ERLEC1
INTS2
RABL3
HSPA2
NSP13
FANCI
SCAMP3
CELSR2
NBAS
VPS53
IGF2R
SIGMAR1
BZW1
PFKP
GCNT3
ORF9b
DTYMK
PPA1
SLC46A1
SLC22A5
NUBPL
STX4
GOLGA5
USP8
TMEM41A
E
NDFIP1
DYNC1LI1
UBE4A
RAB5B
HIBADH
VMP1
LMAN2
NIPA1CNTNAP3
SELENOS
TMEM30B
MTFP1
CHD8
ERMP1
DIS3
VASP
APH1A
ORF6
GAL3ST1
CEMIP2
MUC13
ATP6V0A2
WDFY3
COG1
POMGNT1
PLXND1
NBR1
BLM
INTS8
S
COG2
CTDNEP1
RAB34
HARS2
DOCK5
PDIA3
ATRIP
CBR1
PTGES
CDH17
VPS45
LRRN2
CYP1B1
APOB
ACAD10
MMP15
ALDH1A2
PSMC4
CD70
PCDHA12ITM2B
CLCN7
ORF3
PACC1
WBP2
FAM20C
VPS8
C15orf61
KIAA0232
TMEM168
PTPMT1
TMEM164
PSMA5
RBM5
DCBLD2
TTC27
CNNM3
HNRNPM
PHPT1
ZBTB20
CALCOCO1
PYCR3
DOLK
MRPL28
NUDT19
BMPR1B
C6orf120
ELMO2
BZW2
NSP14
DHCR7
SNX17
HDHD5
GLO1
ST8SIA4
RNF130
MFSD5
MFSD10
AGO3
IL31RA
PON3
FAM8A1
TIMM10B
ITPRIPL2
ZDHHC9
SLC23A2
SLC30A5
FKBP4
FXYD2
SLC7A6
XPOT
ZNF148
HSD17B8
SMC6
STEAP2
SLC23A1
BRI3BP
TMEM68SLC6A6
SLC35A2
HLA-G
GNS
CACNG6
PITRM1
UCHL1
SLC25A24
LEMD3
TNFSF15
KIAA0754
SGPP1
BROX
PHB
ORF4
BLVRA
TMEM192
CLPTM1L
WWP2
FAM98A
CHST14
FKBP3
STX7
SCAP
SLC35F2
NSP2
TOR1AIP2
QSOX2
FAM50A
G3BP2
SLC25A2
DOCK1
TMX1
NR5A2
PLD3
STUB1
IPO13
FBXO6
SLC30A1
DTWD2
ECI1
RHBDD2
PMPCA
SLC12A6
TMEM11
MFSD8
PTPRJ
SLC19A2
COG8
SLC30A7
GPR37
ZFPL1
TMED2
MFAP3L
SLC35F5
CLDN1
MROH1
ALDH2
PROS1
PSMD4
BRAT1
RPL39
LMAN2L
STAG2
FAM234A
MAFG
HSPA8
TBCB
NAPG
HINT1 BAMBI
EPN1
SARM1
ARFGEF2
GET4
NUP188
RTRAF
WDR83
SLC35F6
REEP5
LTN1
ORF8a
SYNGR3
WFS1
ATP5PB
VPS11
RAB8A
SLC47A2
HLA-C
OGDH
PYROXD2
OBI1
UHRF1BP1L
NUP205
SLC26A2
PLIN2 BICC1
RAB5A
AHCYL1
TOMM70
IFITM1
EGFL7
EMC8
HAX1
TRAPPC5
ATP5PF
DIPK1A
ATP5PD
CD81
EPHB3
TMPPE
RBPMSTAMM41
TLCD4
TMEM177
PEX10
ARFIP1
RAB1A
SNX2
ZW10
EMC3
GOSR1
ENDOD1
TARBP2
TUT1
UGGT1
LSG1
PCDHA4
ORF3b
ORF3
SCFD1
SFXN5
PFDN2
FANCD2
CANT1
MYRF
OAT
NDUFA12
LIMCH1
SLC35A1
PC
C1orf159
B3GALT6
DGAT1
PISD
NOTCH1
TACO1
SLC20A1
SPCS1
STX5
NSP8
HERC1
CALCOCO2
TIMELESS
GPD2
OSTC
GABARAPL2
MLF2
FAT1
SMS
OCIAD2
TRPM4
ORF6
BSCL2
XPO7
DERL3
TMEM199
CLDN12
DAGLB
SDF4
CYB5D2
FUT8
GPR39
COMT
M
TOR1B
GOLIM4
IPO8
SEC61G
HAUS6
NECTIN3
LTBP1
C16orf58
COG4
CTSB
LETMD1
EFNB1
TMEM258
NSP15
PMPCB
ALG6
ALG8
PDLIM1
EXT2
LRRC47
RDH14
COQ6
PRPF40A
SLC18B1
VPS39TCIRG1
FAM241B
DNAJA2
ORF9b
TNPO2
CLGN
NSP6
TMEM245
PRAF2
MSMO1
NSP3MD
TBCE
NSP16
DHCR24ABHD10
ATP6AP1
ABHD5
PIGS
SMIM1
ZDHHC13
HSPA1L
BAG3
SRXN1
TIMM17A
MCM3AP
SDF2
TBC1D8
SLC9A1
ACO1
SAYSD1
PEX13
STEAP1B
TMEM223
B4GAT1PTPRM
CEP170B
GORASP2
DNAAF5
LRFN1
COPS4
SOAT1
OSMR
MUL1
RETREG2
VSIR
NCEH1
TNFRSF10D
PDE4DIP
PLXNA1
TNFSF9
LRRC8A
NSP3MD
TAPT1
EEA1
STARD3NL
NME3
SLC12A7
DPY19L4
XXYLT1
PSAT1
RBFOX3
ADAM9
SURF4
ADCY9
SLC15A4
PTPN11
WDR83OS
S
NT5C3A
EXOG
CDK5RAP3
SCAI
INTS1
NPC1
COTL1
ANXA5
RAB13
TYW1
HAVCR1
RAD23B
TMEM159
NCAPD3
SSBP1
FUCA2
ACADSB
ELF3
ARFGEF1
IL10RB
C4orf3
NSP8
PPP2R5A
SUMF2
CMIP
CALD1
PDPR
SLC33A1
GPAT4
SCARA5
SQLE
ANXA4
RHBDF2
CXCL5
MT-ND4
VAMP7
HMGN1
RAB31
KCT2
ELOVL7
FKBP1A
WDR72
TM4SF1
XPO5
SEC61B
JAGN1
MSN
N
TMEM214
NOTCH3
VKORC1L1
NUBP2
SCCPDH
FAM20B
CAVIN1
LSR
TM9SF2
ABHD16A
G3BP1SEPTIN11
NSP12
TNFAIP2
SEMA4B
EXTL3
ORF7b
TMEM97
BAG6
S1PR5
GUF1
SCFD2
STK11IP
CPD
KYNU
NARS2
PTDSS1
ROR1
CALML5
C11orf24
HLA-E
SEC23IP
EEF1A2
SNX1
RETREG3
ATP6V1B1
KDELR1
HLA-A
NOTCH2
TIMM17B
RABGAP1L
NSP4
DOCK6
FBXO46
INTS4
GEMIN8
VAMP2
CKAP4
PSMC2
CHPT1
NLRX1
GJA1
STXBP3
FAF2
ECHDC3
COG6
RAB7ABET1
MT-CO2
PIP4P2
CAV2
TMEM221
RAB9A
RBM33
GNAL
RHOB
FXR1
RANBP6
PCCB
NECTIN3
TAF4
LPCAT4
E
NSP13
HLA-A
NSP9
CRYZ
LGALS3
IDH1CAP1
PEX6
STX6
CAAP1
NOP53
SYPL1
FGB
STRA6
PTRH2
HSPA13
AREG
SLC12A9
PSMD12
COG7LMBRD2
SPTLC2
INTS12
EXT1
NDUFS8
STX12
SAAL1
LRBA
DNAJB2
TNFRSF10A
ALG14
HMGCS2
MAIP1
EML4
CAV1
GCLC
NDUFA10
EPCAM
NSP7
HSPA5
TLCD1
NSP4
NDRG1
MRC2
VPS16
RNPEP
BAG4
TRIR
GLCE
JAK2
SIRT3
NLN
TMED9
NSP10
AK4
HPS6
NSP15
WWP1
B3GAT3
FANCG
TMEM256
ATP5F1D
NSP2
GOSR2
ITGA3
FITM2
PAQR5
ITGB5
TRAFD1
GPAA1
ORF8
PRKDC
GGT7
SGCB
NAPA
CLINT1
FGFR1
DDR1
GBF1
ALG13
GGT1
HUWE1
STX16
CD44
SLC25A52
MARK2
NECTIN2
SMPD4
OS9
RAB2A
NPEPPS
YIF1B
NRP2
PTPRS
HSPH1
HM13
CUX1
HLA-C
GANAB
ORF7a
MAVS
PON2
SULT1A3
SPAG9ST7
CLASP2
UGT1A9
CLCC1
HTATIP2
LGR4
RTN4
HMGA1
SEC16A
KIF5C
DPY19L2
.CC-BY 4.0 International licenseavailable under a(which was not certified by peer review) is the author/funder, who has granted bioRxiv a license to display the preprint in perpetuity. It is made
The copyright holder for this preprintthis version posted June 17, 2020. ; https://doi.org/10.1101/2020.06.17.156455doi: bioRxiv preprint
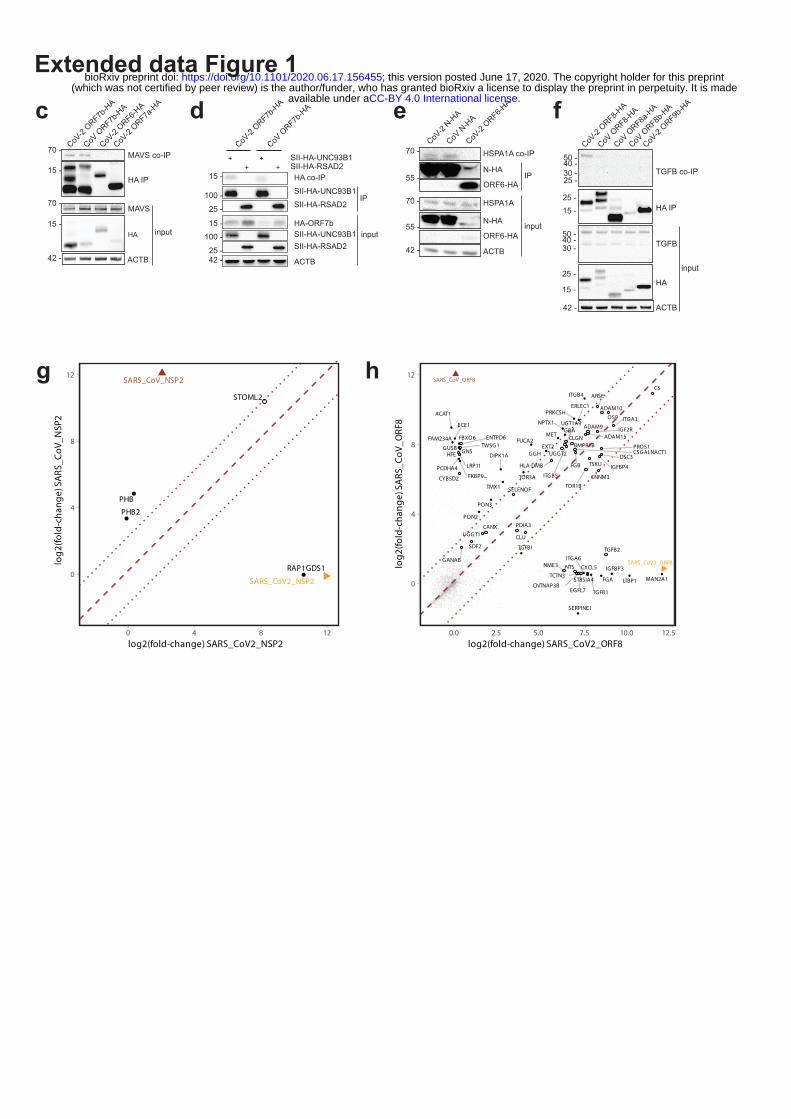
Extended data Figure 1
c
g
d e f
SII-HA-RSAD2SII-HA-UNC93B1
42 -
CoV O
RF7b-H
A
CoV-2
ORF7b-H
A
input
IP
++++
100 -
25 -
15 -
15 -
100 -
25 -
HA co-IPSII-HA-UNC93B1SII-HA-RSAD2
HA-ORF7bSII-HA-UNC93B1SII-HA-RSAD2
ACTB
CoV-2
ORF6-HA
CoV N
-HA
CoV-2
N-HA
input
HSPA1A co-IP70 -
70 - HSPA1A
ORF6-HA
ORF6-HA55 -
N-HA
55 -N-HA
42 -
IP
ACTB
CoV-2
ORF6-HA
CoV O
RF7b-H
A
CoV-2
ORF7b-H
A
input
70 -MAVS
MAVS co-IP70 -
HA15 -
15 -HA IP
42 -
CoV-2
ORF7a-H
A
ACTB
h
CoV O
RF8a-H
A
CoV O
RF8-HA
CoV-2
ORF8-HA
input
TGFB co-IP
HA IP
CoV O
RF8b-H
A
ACTB
CoV-2
ORF9b-H
A
50 -40 -30 -25 -
50 -40 -30 -
25 -15 -
25 -
15 -
42 -
TGFB
HA
RAP1GDS1
STOML2
PHB2
PHB
SARS_CoV2_NSP2
SARS_CoV_NSP2
0
4
8
12
0 4 8 12log2(fold-change) SARS_CoV2_NSP2
log2
(fold
-cha
nge)
SA
RS_C
oV_N
SP2
FKBP9...
IGFBP3
ADAM15
CLU
TGFB2
SELENOF
ITGA6
FGA
TGFB1
ITGB4
MET
TGFBI
CSGALNACT1
TSKU
HFE
IGFBP4
DSC3
GUSB TWSG1
SARS_CoV_ORF8
ENTPD6
SERPINE1
LRP11
GGH
C5
NPTX1
TCTN3 MAN2A1
PRKCSH
HLA-DMB
ARSE
TOR3A
CNTNAP3B
NTS
ACAT1ADAM10
CANX
ECE1
ERLEC1
IGF2R
PDIA3
CNNM3
BMPR1B
PON3
GNS
TMX1
FBXO6
PROS1FAM234A
EGFL7
DIPK1A
UGGT1
PCDHA4
CYB5D2TOR1B
LTBP1
EXT2CLGN
SDF2
NME3
ADAM9
FUCA2
CXCL5
FGB
ITGA3
ITGB5
SARS_CoV2_ORF8
OS9
GANAB
PON2
UGT1A9
0
4
8
12
0.0 2.5 5.0 7.5 10.0 12.5log2(fold-change) SARS_CoV2_ORF8
log2
(fold
-cha
nge)
SA
RS_C
oV_O
RF8
ST8SIA4
GBA
UGGT2
.CC-BY 4.0 International licenseavailable under a(which was not certified by peer review) is the author/funder, who has granted bioRxiv a license to display the preprint in perpetuity. It is made
The copyright holder for this preprintthis version posted June 17, 2020. ; https://doi.org/10.1101/2020.06.17.156455doi: bioRxiv preprint
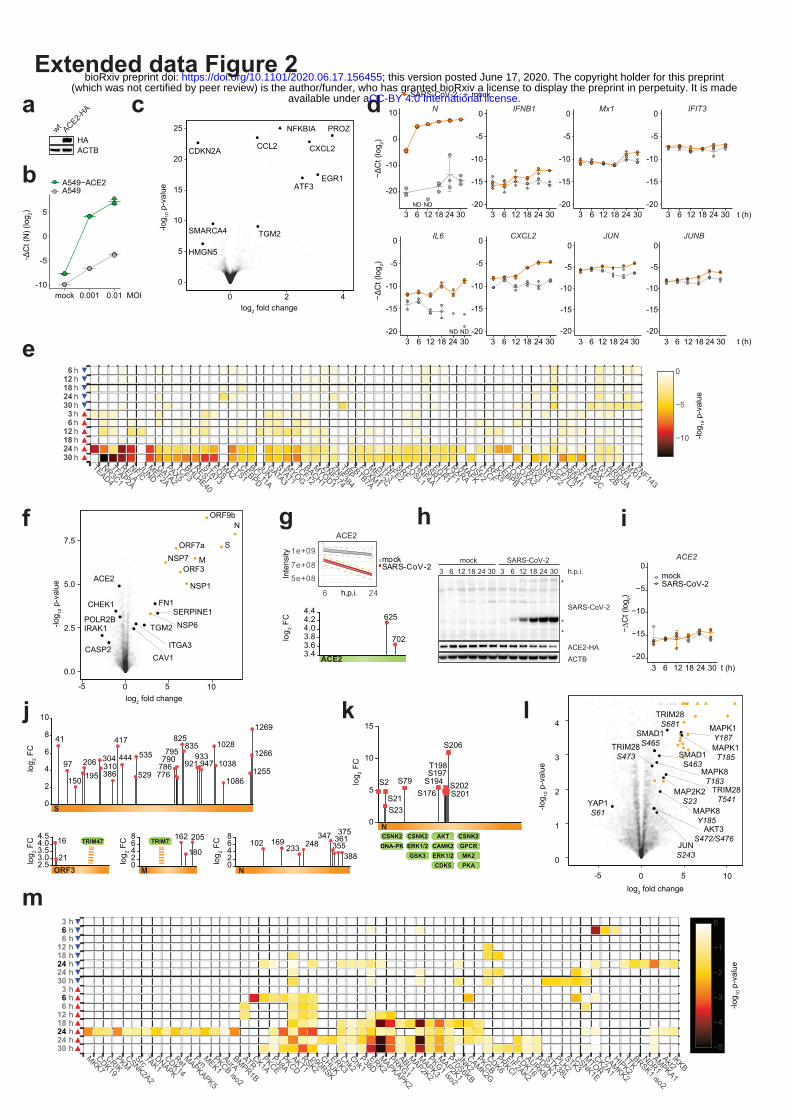
log2 fold change
NSP7
CHEK1 FN1SERPINE1
S
ORF3M
NSP6
ORF7a
N
NSP1
ORF9b
TGM2
ITGA3
POLR2B
CASP2
IRAK1
CAV1
ACE2
0.0
2.5
5.0
7.5
-5 0 5 10
-log 10
p-v
alue
a mockSARS-CoV-2
b −ΔC
t (lo
g 2)
-10
-5
0
5
mock 0.001 0.01 MOI
-ΔC
t (N
) (lo
g 2)
A549A549−ACE2
NDND
-20
-10
0
10
3 6 12 18 24 30
N
-20
-15
-10
-5
0 IFNB1
3 6 12 18 24 30
Mx1
-20
-15
-10
-5
0
3 6 12 18 24 30
IFIT3
-20
-15
-10
-5
0
3 6 12 18 24 30
IL6
-20
-15
-10
-5
0
3 6 12 18 24 30
CXCL2
-20
-15
-10
-5
0
3 6 12 18 24 30 t (h)
ACTBHA
wt ACE2-HA
Extended data Figure 2
k
i
j
SARS-CoV-2
ACTBACE2-HA
30241812633024181263 h.p.i.mock SARS-CoV-2
*
**
f g h
6 24
5e+087e+08
1e+09
h.p.i.
Inte
nsity mock
SARS-CoV-2
ACE2
l
m
e
t (h)
−ΔC
t (lo
g 2)
PROZ
EGR1
CXCL2
ATF3
NFKBIA
TGM2
CCL2
SMARCA4
HMGN5
CDKN2A
0
5
10
15
20
25
log2 fold change
-log 10
p-v
alue
0 2 4
JUNB
3 6 12 18 24 30-20
-15
-10
-5
0
3 6 12 18 24 30-20
-15
-10
-5
0JUN
dc
NDND
−20
−15
−10
−5
0
3 6 12 18 24 30
−∆C
t (lo
g 2)
mockSARS-CoV-2
t (h)
ACE2
3.43.63.84.04.24.4
625
702log 2 F
C
MAP2K2S23YAP1
S61
TRIM28S473
TRIM28T541
JUNS243
TRIM28S681
SMAD1S463
SMAD1S465
AKT3S472/S476
MAPK1T185
MAPK8T183
MAPK1Y187
MAPK8Y185
0
1
2
3
4
log2 fold change
-log 10
p-v
alue
-5 0 5 10
S0
2
4
6
8
10
41
97
150 195206 304
310386
417
444
529
535
776786790795
825835
921933
947
1028
1038
10861255
1266
1269
log 2 F
C
ORF3
TRIM47
2.53.03.54.04.5 16
21log 2 F
C
ACE2
N02468
102 169233 248
347355361375
388log 2 F
C
M
TRIM7
02468 162
180
205
log 2 F
C
N
DNA-PKCSNK2CSNK2 AKT
CAMK2ERK1/2CDK5
CSNK2GPCRMK2PKA
ERK1/2GSK3
0
5
10
15
S176S79
S21 S201S2
S23
S206
S194S197
S202
T198
log 2 F
C
TEAD4
NR3C1
TFAP2A
RELANFIC
JUNDMEF2A
GATA2
PAX5TCF3
BHLHE40
RESTSTAT3
FOSMAZ
ETS1CEBPD
BCL11A
JUNGATA3
STAT1MYOG
TCF12
BACH1
MYOD1
ZNF274
ZNF384
TBPZBTB7A
FOXM1
MEF2C
ATF3NFE2
SRFFOSL1
HNF4A
ESR1EGR1
IKZF1RXRA
MAFKUSF2
CTCFRFX5
CEBPB
FOSL2
FOXA2
PBX3USF1
NR2F2
TCF7L2
PRDM1
E2F1TFAP2C
MAXGTF2B
ARID3A
IRF1MXI1
ZNF143
30 h ▲24 h ▲18 h ▲12 h ▲
6 h ▲3 h ▲
30 h ▼24 h ▼18 h ▼12 h ▼
6 h ▼
−10
−5
0
-log 10
p-v
alue
MKK7CDK19
CRIKPKM
CSNK2A2
SrcTAK1
DNAPK
CDK14
RetMAPKAPK5
FynMEK1
PKCB iso2
AurABMPR1B
ATRCK1A
PKCEP38A
PKCDAKT1
RSK2p90RSK
CHUKERK3
Chk2Chk1
P38DERK2
MAPKAPK2
PRKG1
ABL1MAP2K2
MAPK3
PKG1 iso2
MAP2K1
P70S6KB
JNK2CAMK2G
PKCBCDK6
PRKCI
EIF2AK2
CDK16
AURKB
PDPK1
STK38L
PLK2STK3
CSNK1E
MTORCK2A1
CAMKK2
HIPK2TTK
BRSK1 iso2
NDR1AMPKA1
Akt2IKKB
30 h ▲ 24 h ▲ 24 h ▲ 18 h ▲ 12 h ▲ 6 h ▲ 6 h ▲ 3 h ▲ 30 h ▼ 24 h ▼ 24 h ▼ 18 h ▼ 12 h ▼ 6 h ▼ 6 h ▼ 3 h ▼
−5
−4
−3
−2
−1
0
-log 10
p-v
alue
.CC-BY 4.0 International licenseavailable under a(which was not certified by peer review) is the author/funder, who has granted bioRxiv a license to display the preprint in perpetuity. It is made
The copyright holder for this preprintthis version posted June 17, 2020. ; https://doi.org/10.1101/2020.06.17.156455doi: bioRxiv preprint

Extended data Figure 3
c
e
d
f
gh.p.i.30241812633024181263
SARS-CoV-2mock
p38-T180/Y182p38JNK-T183/Y185
JNK
ACTB
h
1e7
3e75e7
1e51e61e71e8
1e41e51e61e71e8
6 24h.p.i. 6 24h.p.i. 6 24h.p.i
ITGA3 SERPINE1 FN1mockSARS-CoV-2
Inte
nsity
3e5
1e6
3e6
3e35e3
1e4
AKAP12 S286
3e2
1e33e3
3e5
1e63e6
EPHA2 S897
1e21e31e41e51e6
EGFR S991
Type IIFN ISRE GAS
NSP1
NSP13
ORF3
ORF6
ORF7a
ORF7b
ORF9b
ZIKV-NS5
control: SMN1
control: SMN1unstimulated
0%
50%
100%
120%
% o
f stim
ulat
ed c
ontro
l
AKAP12EPHA2EGFR
3024181263h.p.i.
3024181263h.p.i.
3024181263h.p.i.
NUCLEUS
IL6TNFCXCL2
IFN-αIFN-β
ILIFN
CXCL
TNF
CYTOPLASM
ISGsIFIT1MX1
IL6
IFN
IFN
IFNAR
SARS-CoV-2
IL6STIL6R
IL6
IRF9
STAT2STAT1
IRF9
STAT2STAT1
IRF3 IRF3
IRF3
IRF3 TBK1
MAVS
RIG-IMDA5
TLRs
IRAK1TRAF6
MYD88
ORF3
M
ENDOSOME
MITOCHONDRION
JAK1/2
TANK
STAT1/3
STAT3
IKBKGTRAF2TBK1
ORF7b
NFKB
NFKB
M JAK2 JAK1
ORF3
ITCH
S222
S727
K27K165
UNC93B1
K446
ORF7b
ORF7b
NUCLEUS
COL7A1FGGFGBFN1SERPINE1ITGA3
SMAD
RAS
RAF
SMAD1
TLN1PXN
PTK2VCL
YAP
RTKsITGA/ITGB
CYTOPLASMMMP24AMOTL2LATS2COL7A1TEAD1IER2
YAP
TRAF6
NFKB
MAPK8MAPK14
GOLGI
JUNFOSEGR1DUSPsMMPsPTGS2
NFKB
ECM
LTBP1
TGFB
TGFB
ORF8
FURIN
LTBP1
TGFB
TGFB
LAP
LAP
TGFB
TGFB
ORF3
ORF3
TGFBR
BAMBI
EGFRECM
MAPK3MAPK1
MAP2K1MAP2K2
PLCG1PI3K
AP-1
SMAD5S465
S463
S463
S465
T180Y182
T183Y185 T185
Y187
T202T207
S23
S1248
S991S995
S1225
K802
S864S910
S126S130S137
S61S340S127
S131
S138
K708
S477AKT
SERPINE1ITGA3
-2 -1 0 1 2 3 4log2 fold change
Phospho(S/T) site regulatory siteknown siteUbi(K) site
-3
SARS-CoV-2 infection SARS-CoV-2 proteins
up-/downregulatedinteraction
-4 -2 0 2 4 6 8 10
log2 fold changePhospho(S/T/Y) site regulatory site
known siteUbi(K) siteup-/downregulatedinteraction
SARS-CoV-2 infection SARS-CoV-2 proteins
Inte
nsity
Inte
nsity
a b
1e5
5e4
3e4
TEAD
mockSARS-CoV-2
K321
SAR
S-C
oV-2
0.001 0.002 0.003
2k
4k
6k
8k
10k
12k
14k
Minimal Edge Weight
Aver
age
Path
Len
gth
permuted
real
BRD4
EPHA2
NCK1
CDH1
ARHGAP35
AP1M1
APOB
CTSC
SEC23B SEC24B
SEC24C
STX12
STX7
TRIP10
VAMP8
CAPZA1
COG8ATM
BARD1
BAX
CTSA
CTSBCTSD
CTSS
ERCC3
GABARAPL2
GLB1
HDAC6
HIST1H2AH
HIST2H2AB
HUS1
LAMP2
MFN2
MLH1
MVB12A
NBR1
NFKB2
NR4A1
PDE8A
PFKM
PKM
PRKDC
SQSTM1
STARD3
TARDBP
UBTF
CTSH
FEM1A
FEM1C
DCAF1
ATP6V1G1
FBXO30
ZNRF2
ARIH1
DCP1A
DDX6
EIF4G1
RIOK3
RPS15
SMG8
DDX39B
U2SURP
POLR3C
CETN3
MAEA
RMND5A
STK25
MFGE8
VCAN
CTPS1
FASN
GFPT2
AKAP9
PLK1
NRCAM
ASNS
ELF3
KXD1
TXNDC5
FLOT1
MYL6B
NDUFA3
NDUFV2
DPYSL4
DPYSL5
NES
DUSP3
UBE2S
FOXA2
TGIF1
TECR
FUNDC2
PGAM5
TLN2
KANSL3
UQCRH
PIP4P1
IGF2BP3
ASAH1
NUCB1
FTL
ECHS1
GAMT
DERL2
SH3GLB2
MUC5AC
FBXL2
DPP7
MANBA
GGH
TOR1B
TSR2
DDI2
AGO3
STK11IP
RIC8B
JAGN1
HEXA HEXB
BCHE
NFX1
PARP16
YIPF1
AHNAK2 MYOF
PTK7
NPC2
PGM5
CA12
ANPEP
SLC35B2
KLF16
TBC1D10A
ZCCHC8
MORC2
PPT1
HMGN5
NTHL1
COL28A1
NIF3L1
CNP
ALAD
CTIF
METTL14
SLC4A2
PRR11
LAPTM4A
ABCC3
ABHD5
ACVR1
ADCY9
AREG
ATP6AP1
B2M
BCAM
BCAP31BET1
BMPR1A
BNIP3L
CALML5
CD44
CD70
CELSR2
CKAP4
CTNNA1 CTNNA2
CUX1
DIS3
EFNB1
ERBB2
FAM20C FAS
FH
FXYD2
GALNT1
GJA1
GNA13
GOLGA5 GOLGB1
GOLIM4
GORASP2
GOSR1
GOSR2
GPR39
HLA-A
IGF2R
IL10RB
IL13RA1
IL6ST
ITCH
ITGA6
KDELR1
LDLR
LGALS3
LGR4
LMAN1
LPAR1
LTBR
MAVS
MET
NAPA
NAPB
NAPG
NCEH1
NDFIP1
NDFIP2
NDUFB11
NOTCH2
NOTCH3
ORAI1
PCDHAC2
PEX10
PEX13PEX2
PLIN2
PLXND1
PMEPA1
PNPLA2
PSEN2
PTPN11
PTPRF
PTPRJ
PTPRM
PTRH2
PVR
RAB13
RAB1A
RAB5A
RAB7A
RNF19A
S1PR3
SCAP
SCARA5
SCARB1
SCFD1
SEC61B
SEC61G
SELENOS
SGCB
SGCD
SGCE
SLC26A2
SNAP25
SORT1
SPTLC2
SRPRA
STRA6
STUB1
STX10
STX16
STX2
STX4
STX5
STX6
SYMPK
TCIRG1
TGOLN2
TIMELESSTMED10
TMED2
TMED7
TMED9
TMX1
TNFRSF10D
TNFRSF1A
TUSC3 TVP23B
UBE2G2
UNC93B1
VAMP3
VAMP4
VAMP7
VPS45VTI1A
WWP2
ZMPSTE24
ReactomeFIInteractionNetworkDiffusionFlow
Target of Viral ProteinRegulated ProteinIntermediate Link
.CC-BY 4.0 International licenseavailable under a(which was not certified by peer review) is the author/funder, who has granted bioRxiv a license to display the preprint in perpetuity. It is made
The copyright holder for this preprintthis version posted June 17, 2020. ; https://doi.org/10.1101/2020.06.17.156455doi: bioRxiv preprint
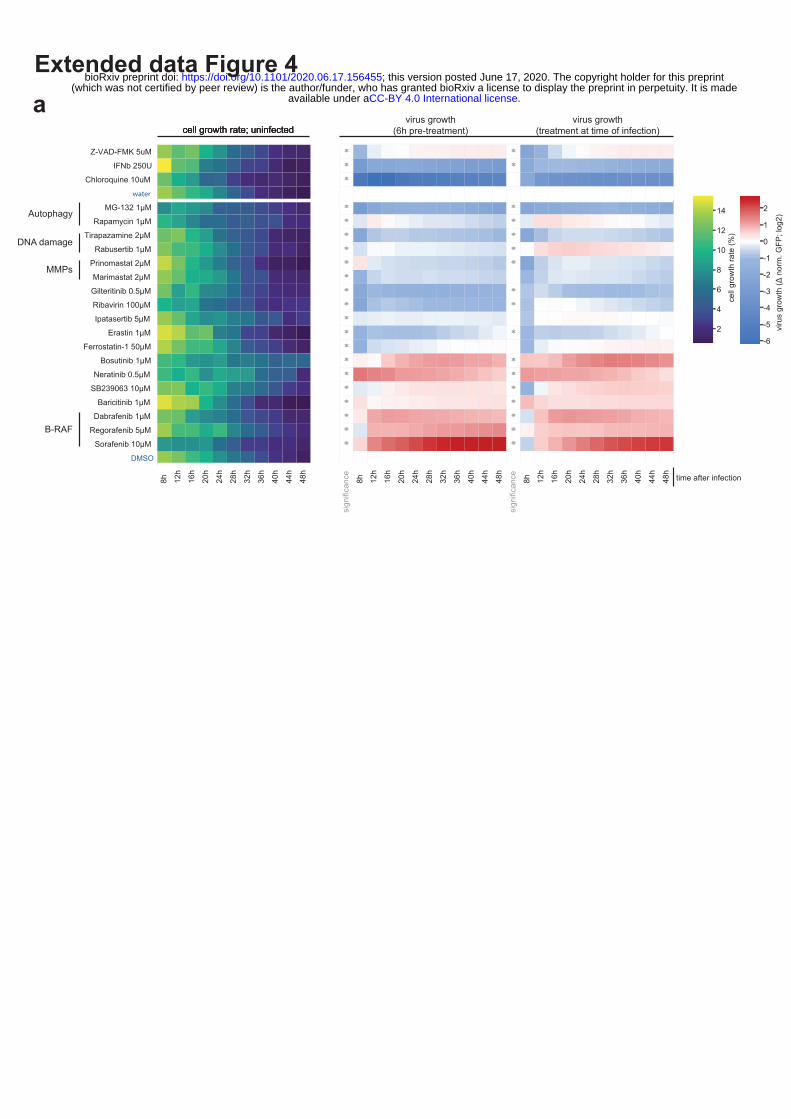
Extended data Figure 4a
8h
cell growth rate; uninfectedcell growth rate; uninfected
12h
16h
20h
24h
28h
32h
36h
40h
44h
48h
moc
k 0h
Z-VAD-FMK 5uM
IFNb 250U
Chloroquine 10uM
water
MG-132 1µM
Rapamycin 1µM
Tirapazamine 2µM
Rabusertib 1µM
Prinomastat 2µM
Marimastat 2µM
Gilteritinib 0.5µM
Ribavirin 100µM
Ipatasertib 5µM
Erastin 1µM
Ferrostatin-1 50µM
Bosutinib 1µM
Neratinib 0.5µM
SB239063 10µM
Baricitinib 1µM
Dabrafenib 1µM
Regorafenib 5µM
Sorafenib 10µM
DMSO
sign
ifica
nce
8h 12h
16h
20h
24h
28h
32h
36h
40h
44h
48h
sign
ifica
nce
8h 12h
16h
20h
24h
28h
32h
36h
40h
44h
48h
2
4
6
8
10
12
14
cell
grow
th ra
te (%
)
-6
-5
-4
-3
-2
-1
0
1
2Autophagy
DNA damage
MMPs
B-RAF
viru
s gr
owth
(Δ n
orm
. GFP
; log
2)
cell growth rate; uninfectedvirus growth
(6h pre-treatment)virus growth
(treatment at time of infection)
time after infection
.CC-BY 4.0 International licenseavailable under a(which was not certified by peer review) is the author/funder, who has granted bioRxiv a license to display the preprint in perpetuity. It is made
The copyright holder for this preprintthis version posted June 17, 2020. ; https://doi.org/10.1101/2020.06.17.156455doi: bioRxiv preprint