Embed Size (px)
DESCRIPTION
Multi-Indicator Cluster Survey in Macedonia- Breastfeeding Patterns in Children 0-24 Months. Some demographic and health indicators*. Total number of the population 2.007.523 Annual number of live births 27.309 Birth rate-14.1%0 Infant mortality rate14.9%0 Perinatal mortality rate18.7%0 - PowerPoint PPT Presentation
Citation preview

Multi-Indicator Cluster Survey in Macedonia-Breastfeeding Patterns in Children 0-24 Months

Some demographic and health indicators*
Total number of the population
2.007.523Annual number of live births
27.309Birth rate-14.1%0 Infant mortality rate14.9%0Perinatal mortality rate18.7%0
* 1999

Health and nutritional survey 1994Breastfeeding rate and nutritional patterns in infants
Exclusive breastfeeding rate (0-4 months) -8.1%
Predominant breasfeeding rate 70.4%
Stop breastfeeding rate 21.6%
59% (first weeks)
26.9% (5-8 weeks)
14.1%(9-13 weeks)
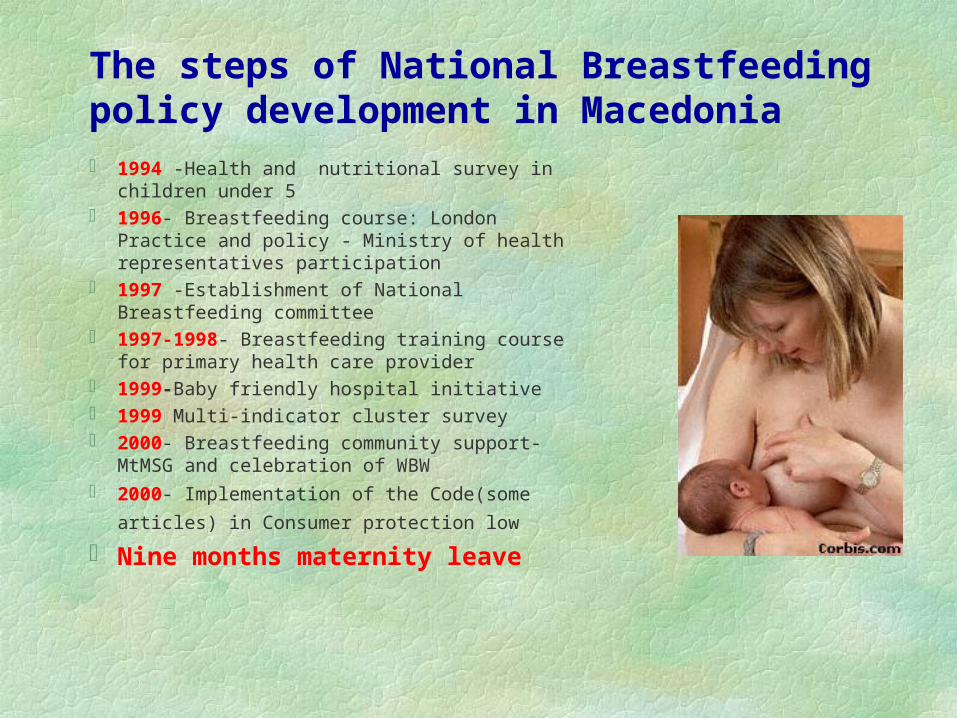
The steps of National Breastfeeding policy development in Macedonia 1994 -Health and nutritional survey in children under
5 1996- Breastfeeding course: London Practice and
policy - Ministry of health representatives participation 1997 -Establishment of National Breastfeeding
committee 1997-1998- Breastfeeding training course for primary
health care provider 1999-Baby friendly hospital initiative 1999 Multi-indicator cluster survey 2000- Breastfeeding community support- MtMSG and
celebration of WBW 2000- Implementation of the Code(some articles) in
Consumer protection low Nine months maternity leave

Multi-Indicator cluster survey 1999
Main objective achievement of the goals of the
World Summit for Children
Specific objective nutritional status of mother and
children micronutrient deficiencies evaluation of feeding patterns
of infants and small children

The information of infant feeding pattern was collected with 24 hour recall questionnaire using the following indicators:
Exclusive breast feeding rate (0-4 m)
Exclusive breast feeding rate (0-6 m)
Predominant breast feeding rate (0-4 m)
Predominant breast feeding rate (0-6 m)
Timely complementary feeding (6-9m)
Continued breast feeding at 1 year

Prevalence of breastfeeding in children 0-24 months by population strata
Breastfeeding Total
Yes NoUrbanRow %95% CI
62592.5
87.4-97.5
517.5
2.5-12.6
676100
RuralRow %95% CI
60991.0
86.5-95.5
609.0
4.5-13.5
669100
TotalRow %95% CI
123491.8
88.4-95.3
1118.2
4.7-11.6
1345100
Pearson Chi -square :0.9, p=0.34

Feeding pattern of Children 0-4 m and 0-6 m by Population strata
0-4 months
Exclusive Predominant Non breastfed Breastfed + otherenergetic foods
Total
Urban 46.8 37.8 14.4 0.9 100
Rural 42.7 34.1 20.7 2.4 100
Total 45.3 36.5 16.7 1.5 100
0-6 monthsExclusive Predominant Non breastfed Breastfed + other
energetic foodsTotal
Urban 38.6 31.9 29.9 0.6 100
Rural 33.6 27.9 35 3.6 100
Total 36.6 30.3 31.3 1.8 100
Pearson Chi -square :5.24, p=0.15

Prevalence of Exclusive Breastfeeding in Children 0-24 m, by Population strata
0
10
20
30
40
50
60
70
80
1 2 3 4 5 6 7 12 13-24
ruralurban
Age in months
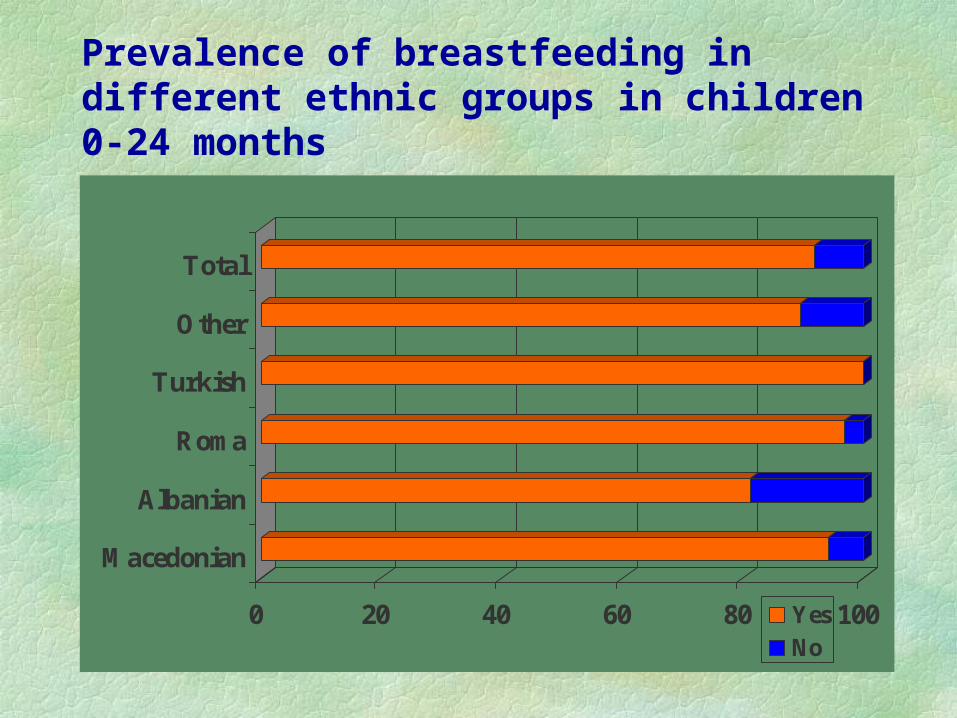
Prevalence of breastfeeding in different ethnic groups in children 0-24 months
0 20 40 60 80 100
Macedonian
Albanian
Roma
Turkish
Other
Total
YesNo

Prevalence of exclusive breastfeeding in different ethnic groups in children 0-6 months
0 20 40 60 80 100 120
Macedonian
Albanian
Roma
Turkish
Other
Total YesNo

Habit of breastfeeding in children 0-24 months by population strata
0 20 40 60 80 100 120
URBAN
RURAL
TOTAL
on demandat fixed interval
at fixed interval 4.6 1.5 3.4
on demand 95.4 98.5 96.6
URBAN RURAL TOTAL

0-6 months 7-12 months 13-24 months
1
2
3
urban
rural
Median number of suckling during the night in children 0-24 m , per population strata
A g e
total

1
2
3
4
5
6
0-6 7-12 13-24
Age in months
urbanruraltotal
Median number of suckling during the day in children 0-24 m,by population strata

Time lapse after birth for breastfeeding children 0-24 months by population strata
0
20
40
60
80
URBANRURALTOTAL
URBAN 3.3 29.9 66.9
RURAL 12.8 27.8 59.3
TOTAL 7.4 29 63.6
30 min 6 hours >6 hours

Reasons for breastfeedig cessation for children 0-24 by population strata
0 20 40 60 80 100
No milk
Mother's illness
Baby's illness
No wight
No time
Pregnancy
totalruralurban

Progress towards the achievement of the goals for year 2000 of the world summit for children
Year 2000 goal
Year 2000 goal 1994 MIKS 1999 MIKS Progress
Empowerment of allwomen to breastfeedtheir children exclusi-vely for four to six months and to continue breastfeeding, with complementary food, well into the second year
0-4 monthsExclusive
BF 8%
Predominant BF =78%
0-4 monthsExclusive
BF 45%
Predominant BF =34%
Goodachievement of the goalthat still needseducationalefforts

NATIONAL REPORT CARD ON BREASTFEEDING*
GLOPAR - Global Participatory Action Research Project by WABA
Indicators Score Rate
EBFR at 6 months 4National breastfeeding policy 10% of BFH 8Implementation of ICMBS 9Maternity leave 9 m 10
Total 41

SCORE RATING
41-50 - Excellent 36-40 - Very Good 31-35 - Good 26-30 - Average 21-25 - Poor 16-20 - Bad 11-15 - Vary Bad 0-10 - Terrible Excellent
41


NUTRITIONAL SURVEY IN REFUGEE CAMPS IN MACEDONIA B.Ancevska MD, N.Janeva MD, K.Venovska MD
Collaborative Study : AAA. UNHCR, UNICEF, IMCH
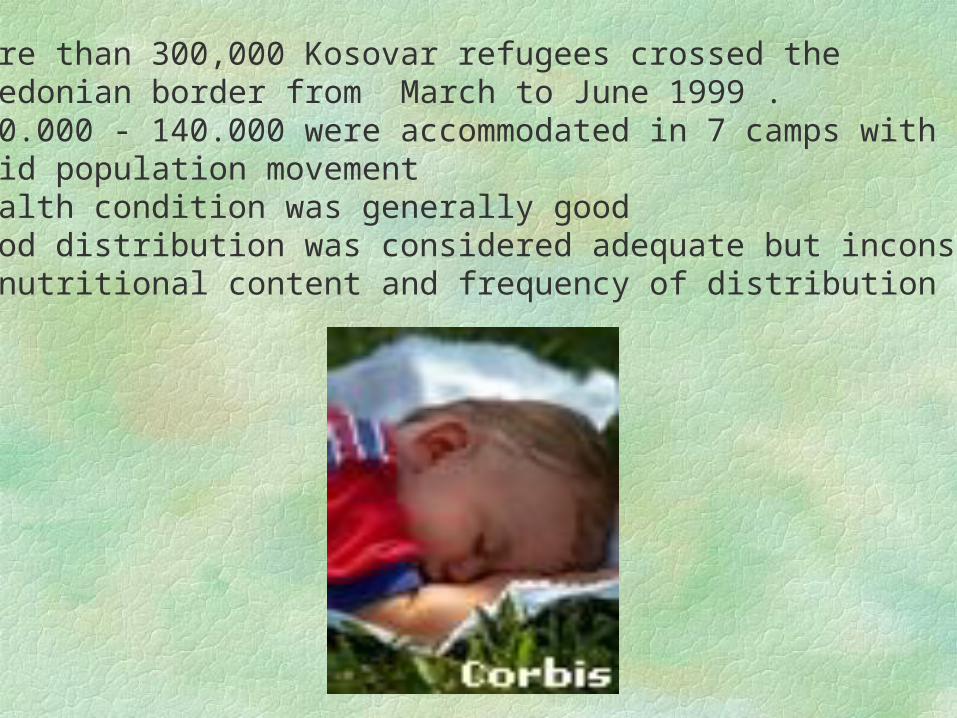
•More than 300,000 Kosovar refugees crossed the Macedonian border from March to June 1999 . •120.000 - 140.000 were accommodated in 7 camps with rapid population movement•Health condition was generally good •Food distribution was considered adequate but inconsistentin nutritional content and frequency of distribution

Goals an objective of the surveythe survey was designed to span several sectors of refugee needs in order to provide recommendations to international organizations serving the refugees in camps in R.M
Specific objective among children under 5 years of age
determine the nutritional status estimate the prevalence of breast feeding and infant feeding practice estimate the prevalence of diarrhea and ARI estimate the immunization coverage

Sampling methodology and sample size
A systematic random sample of household was taken, a household being defined as a group of persons occupying the some structure and sharing the household resourcesThe survey population included 1421 households and 1001 children under 5 years Research tool -questionnaire for interviewing caregivers of young children “ Are you breast feeding your child?”“ Are you feeding your child with infant formula?”
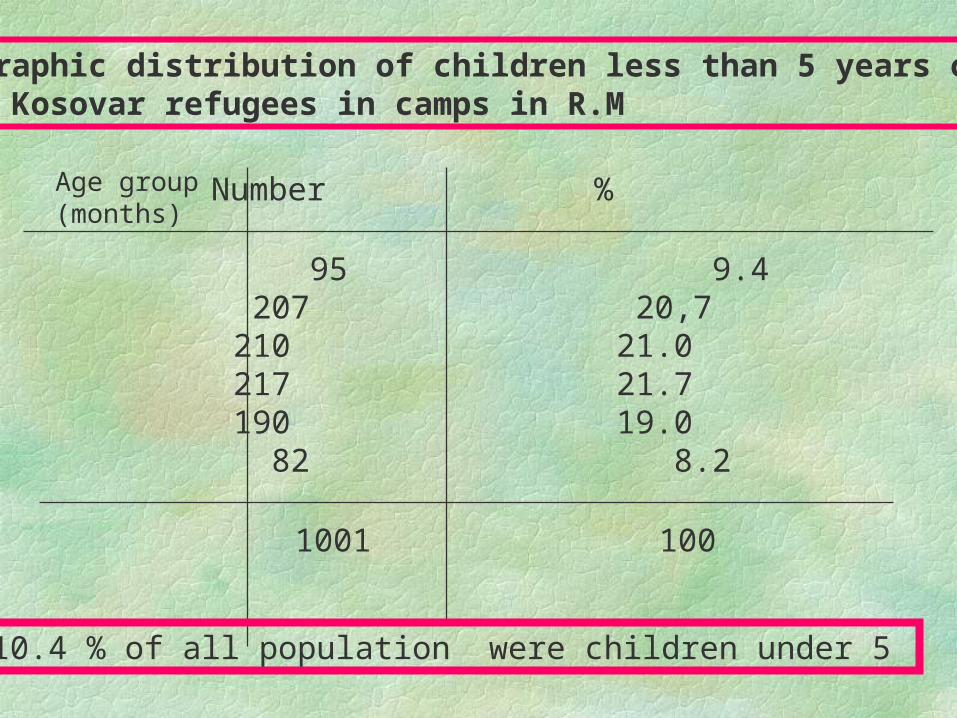
Demographic distribution of children less than 5 years of ageamong Kosovar refugees in camps in R.M
Age group(months)
0- 5 95 9.46-17 207 20,718-29 210 21.030-41 217 21.742-53 190 19.054-59 82 8.2
Number %
Total 1001 100
10.4 % of all population were children under 5

Infant feeding among children < 12 months
BF Formula Both NeitherAge group N % N % N % N %
< 4 months 40 70 3 5 1 1 13 23
4- 7 months 36 51 10 14 4 6 21 30
8-11 months 34 43 11 14 2 3 32 41
All ages 110 53 24 12 7 3 56 32
23

What food those 23% of infants under 4 months received
cow’s milk bread and biscuits

BABY FOOD DONATION*
infant formula baby cereals dehydrated baby meals jars of fruits and mix meal for weaning purpose
* A calculation of the quantities of formula at the and of July. 99 indicate that there was enough to feed approximately 22% of the infants fin the refugee population for 6 months
* Violation of the International Code of Marketing of Breast Milk Substitutes
* Source of donation-unknown

Infant feeding intervention in Macedonia during refugee crisis
Mother and baby - station5 day training programme to provide PHC training for NGO health workers with one day allocated for breast feedingOn job training for NGO health staff in campsAvailability of training material with appropriateinformation about breast feeding UNICEF Initiative to store infant formula donation


![THE FORMER YUGOSLAV REPUBLIC OF MACEDONIA ...Macedonia. Migration Flows in Modern Macedonia. Skopje. 14 Malgorzata Markiewicz [2006]: Migration and Remittances in Macedonia. Center](https://img.pdfslide.us/doc/110x75/5fa5020ac1ba4c3ab23aefc2/the-former-yugoslav-republic-of-macedonia-macedonia-migration-flows-in-modern.jpg)