Embed Size (px)
Citation preview

Issue-2Volume-1 October-2013 Pages-8 www.uni-mysore.ac.in
Multi Dimensional Approach to Measure Poverty-Arjun.R
Poverty wasdefined by one-dimen-sional measures, such asIncome. As a result ofconceptual evolution inunderstanding poverty itwas realized that no oneindicator alone can capture the multiple aspects thatconstitute poverty. The Multidimensional PovertyIndex (MPI) was published for the first time in the2010 UNDP Report. It uses micro data from house-hold surveys. It includes several factors that con-stitute poor people’s experience of deprivation–such as poor health, lack of education, inadequateliving standard, lack of income (as one of severalfactors considered), disempowerment, poor quality
What makes a household“Multidimensionally” poor?
Why Income and Empowerment notincluded?
Mainly due to data constraints. Income povertydata come from different surveys, and thesesurveys often do not have information on healthand nutrition. The Demographic and HealthSurveys (DHS surveys) collect data on women’sempowerment for some countries, but not everyDHS survey includes empowerment.
One deprivation alone may not represent poverty.the MPI requires a household to be deprived inmultiple indicators at the same time. A person ismultidimensionally poor if the weighted indicatorsin which he or she is deprived add up to at least33%.
What data is used in the MPI?The MPI relies on three main databases that are publicly available and comparable for most developingcountries: the Demographic and Health Survey (DHS), the Multiple Indicators Cluster Survey (MICS),and the World Health Survey (WHS).
(Continued page-8)
of work and threat from violence. The MPI identi-fies overlapping deprivations at the household levelacross the same three dimensions as the HumanDevelopment Index (living standards, health, andeducation) and shows the average number of poorpeople and deprivations with which poor households
contend. Each person ina given household is clas-sified as poor or non-poordepending on the numberof deprivations his or herhousehold experiences.Multidimentional mea-sure can incorporate a
range of indicators to capture the complexity ofPoverty and better inform policies to relieve it thatis appropriate to the society and the situation.
The Multidimensional Poverty approachcan be adapted using indicators and weights thatmake sense at the country level to createcustomized national poverty measures. The MPIcan be useful as a guide to helping governmentstailor a poverty measure that reflects multiple local
indicators data. In 2009 Mexico, became the firstcountry to adopt a Multidimensional povertymeasure reflecting multiple deprivations on thehousehold level. The global MPI estimates areconstrained by need for comparability. Nationalteams can use the
Inside...Multi Dimensional,
Poverty anObstacle...Page-2
1/4 of UrbanPopulation...Page-3
Rural Poverty..Page-4Planning Commission
of India..Page-4Poverty
Estimation..Page-5Poverty Ratio..Page-6
No & % ofPopulation B.P.L
2011-12Rural-24.53 %. 92.80
lakhUrban-15.25%. 36.96
LakhTotal – 20.91 %.
129.76 Lakh
Karnataka Poverty2011-12
State specificPoverty Lines for
2011-12Rural- Rs 902
Urban-Rs 1,089
Average MonthlyPer Capita
Expenditure(MPCE)as per Mixed
Reference Period(MRP) for 2011-12
Rural –1395.10Urban- 2898.94

PAGE-2ABHYUDAYA October-2013
Poverty an Obstacle to Economic Development: A DebatePoverty is one of the root causes of several socio-
economic problems, Poverty alleviation is one of the main agendaof nation to attain the statuesque of being prosperous anddeveloped country. Thus, poverty elimination is a matter offundamental significance. There are two inter-related aspectsof poverty-Urban and Rural. The main causes of urban povertyis predominantly impoverishment of rural peasantry that forcesthem to migrate to big cities to find livelihood. In this process,they lose even the open space or habitat they had in villages,albeit without food and other basic amenities. It is indeed avery paradoxical situation, when wealth and prosperity is
concentrated in a few homes while millions have to go to bedwithout food. This does affect economy.
The Fig. shows—in very simplistic terms—how a cycleof poverty related to hunger keeps a person or household poorin one of the world’s developing countries. Lower per capitaincomes make it extremely difficult for poor nations to save andinvest, a condition that perpetuates low productivity and lowincomes. Furthermore, rapid population growth may quickly ab-sorb increases in per capita real income and thereby may ne-gate the possibility of breaking out of the underdevelopmentcircle. Poverty is a biggest hurdle in the way of economic
-Shivaprasad .B.M
(Continued page- 7)
-Nandeesha.H.KThere are two kinds of Poverty,
Relative and Absolute Poverty. They aremeasured in dissimilar methods in differentcountries. The initial effort to estimatepoor was initiated by Dadabhai Naorojiin his account “Poverty and Un-BritishRule in India” in which he estimated asubsistence-based poverty line as earlyas 19th centuryu of 1867-68 prices.
The Planning Commission releasethe poverty estimates in India. How it ismeasured? Poverty is measured based onconsumer expenditure surveys of theNational Sample Survey Organization(NSSO). The official Indian povertymeasures, released by the IPC (IndianPlanning Commission), are based on consumerexpenditure surveys and are measured asheadcount ratios (HCR) – the ratio of thenumber of poor to the total population.
IPC has changed its methodologyfor constructing these poverty lines quitea few times since the 1960s. From thelate-1970s to the mid 1990s they reliedupon a methodology proposed by TheTask Force 1979 (Government of India1979), which derived poverty lines froman assumed minimum requirement forcalories, separately for the rural and theurban sector (More specifically, 2400
Approach to the Conception and Measuring of Povertycalories per capita per day in the ruralsector, and 2100 calories per capita per dayin the urban sector). The chosen povertyline for each sector, applied uniformly toall states, were set to the actual monthlyexpenditure level of the households aroundthe two calorie norms. Therefore, theapproach implied that the poverty lineswere partly structural (based on the calorienorm), and partly behavioral.
Poverty MeasuresHead Count Ratio (HCR): Proportionof total population that falls below povertythreshold income or expenditure based oneither National Poverty Line (NPL) orDollar-a-day PL.Poverty Gap Index (PGI): Unlike HCR,it gives us a sense of how the poor are. Itis equivalent to income gap below PL perhead of total population, and expressed asa percentage of the Poverty Line.Squared Poverty Gap index (SPG):Adds the dimension of inequality amongthe poor to the poverty gap index. For agiven value of the PGI, population withgreater dispersion of income among poorindicates a higher value for the SPG.Poverty Line
For 1973-74 poverty line was fixedat Rs. 49 and Rs.56 for rural and urbanareas respectively. Later using anappropriate price index (CPIAL for rural
India, CPIIW for urban). Monthly percapita consumption expenditure of Rs.356and Rs.539 for rural and urban areasrespectively was fixed for 2004-05. Morethan a quarter of India’s populationremains below Poverty Line in 2004-05consisting 28.3% Rural and 25.7%Urban, 27.5% total absolute 302 millionin 2004-05. Poverty Line in India
Earlier, India used to define thepoverty line based on a method definedby a task force in 1979. It was based onexpenditure for buying food worth 2,400calories in rural areas and 2,100 caloriesin urban areas. In 2011, the SureshTendulkar Committee defined the povertyline on the basis of monthly spending onfood, education, health, electricity andtransport. According to this estimate, aperson who spends Rs.27.2 in rural areasand Rs.33.3 in urban areas a day isdefined as living below the poverty line.A family of five that spends less thanRs.4,080 and Rs.5,000 in rural and urbanareas respectively are considered belowthe poverty line. This approach has beencriticized for fixing lower expenditurelevels.
Source: UNDP, Indian EconomicSurvey, Planning Commission of India
Who does Poverty Estimation in India?

ABHYUDAYA PAGE-3
Below Poverty Line Population in Urban IndiaOctober-2013
Urban Poverty can be identified with people who areunemployed, under-employed, employed in low productivityoccupations, such as porterage and street peddling, in insecurejobs and in jobs with very low wages. In most of the metropolitancities, migrant workers also fall under the poor group. Again,in urban areas as well as in rural areas, the incidence of povertyis high in the category of casual workers. Urban poverty is amajor challenge; India gets exacerbated by substantial rate ofpopulation growth, high rate of migration from the rural areasand mushrooming of slum pockets. Migration alone accountsfor about 40 % of the growth in urban population. Poverty hasbecome synonymous with slums. The relationship is bilaterali.e. slums also breed poverty. This vicious circle never ends.One-fourth urban population in India lives below poverty line.For example cities like Mumbai, Delhi, Calcutta and Bangaloreare the major hub of urban poverty with a lot of slums croppingaround inside the city limits.
The culture and value aspect of poverty breeds and transmitslarger implications for the overall quality of life. Cities andtowns generally show the following characteristics:
Very fast rate of population growth due to rural-urbanmigration for lack of adequate job opportunities in rural areasand small towns.
Rapid increase in the scale of urban poverty anddeprivation. Increasingly deficient infrastructure andservices e.g. housing Facility, water supply, sanitation,education, health etc.
Growing shortage of productive jobs.
Chronic shortage of financial, managerial and technicalresources and
Growing gap between the rich and the poor, between theurban elite and poverty stricken rural and urban poor.
SL No. States Monthly per capita(Rs.) in Urban 1 Andhra Pradesh 1,009 2 Gujarat 1,152 3 Karnataka 1,089 4 Kerala 987 5 Tamil Nadu 937
All India 2477.02 Source: http://planningcommission.nic.in/news/pre_pov2307.pdf
Table: 2.Number and Percentage of Urban Populationbelow poverty line by states – 2011-12
(Tendulkar Methodology)
Sl.No
States
Urban % of persons No. of persons
(Lakhs) 1 Andhra Pradesh 5.81 16.98 2 Gujarat 10.14 26.88 3 Karnataka 15.25 36.96 4 Kerala 4.97 8.46 5 Tamil Nadu 6.54 23.40 All India 13.70 531.25 Source: http://planningcommission.nic.in/news/pre_pov2307.pdf
Table: 1.State specific Urban Poverty Lines for 2011-12
Though Gujarat and Karnataka have better monthlyper capita incomes of Rs 1,152 & 1,089 the percentage of urbanpoverty is 10.14% & 15.25% respectively in these states ishighest when compared with the other states like Kerala TamilNadu, Andhra Pradesh which have lesser monthly per capitaincome than Gujarat and Karnataka. Reasons behind such abovestatistical development may be found in their respective state‘sHuman Development Model.
“Overcoming poverty is not a task of charity,it is an act of justice. Like Slavery andApartheid, poverty is not natural. It is man-made and it can be overcome and eradicatedby the actions of human beings. Sometimesit falls on a generation to be great. YOU
-Nelson Mandela
-Deepa T.M.
Source: Planing commission of India-2013
can be that great generation. Let your greatness blossom.”
Social Aspect of Poverty
Source: http://planningcommission.nic.in/news/pre_pov2307.pdf
Source: http://planningcommission.nic.in/news/pre_pov2307.pdf
Bandra Slum, Mumbai
Courtesy: geographyblog

ABHYUDAYA PAGE-4October-2013
In Rural areas, the major group of the poor consistsof landless agricultural labourers and those who own or haveaccess to very meagre lands that they are forced into wagelabour to earn subsistence. It may be noted that rural poverty islower in regions where the level of agricultural output per headis higher, and vice versa.
Rural Poverty Decline to 25.7%
SL.NO.
States
Rural %age of persons
No. of persons (lakhs)
1. Kerala 9.14 15.48 2. Tamil Nadu 15.83 59.23 3. Andra Pradesh 10.96 61.80 4. Gujarat 21.54 75.35 5. Karnataka 24.53 92.80
All over India 25.70 2166.58 Source: http://planningcommission.nic.in/news/pre_pov2307.pdf
Table 2:Number and Percentage of Population Below Poverty Lineby States-2011-12 (Tendulkar Methodology)
Rural poverty -Migration Courtesy :http://members.tripod.com
Monthly per capita of Rural Kerala is Rs 1,018 whichis highest compared to the lowest of Rs 860 in Andhra Pradeshagainst 9.14% of persons rural poverty of Kerala a lowest inrank compared to Karnataka which records 24.53% of ruralpersons living in poverty. Here we have three adjacentneighbouring states to do comparison. The rural man powerof all these three states depended on agriculture and alliedactivities but there per capita income as well as the ruralpercentage scale is in wide range discrepancy. The factorsfor such wide differed statistics on scale is not just the Natural,Economic, Social circumstances rather it seems the characterof political factors is invariably a cause.
Estimates for 2011-12
The estimates of state wise poverty lines for rural andurban areas for 2011-12 are given in Table 1. The percentageand number of persons below poverty line for all States forrural areas, urban areas and combined are given in Table-2.The all India poverty ratio is obtained as state-populationweighted average poverty ratio, and the all India poverty lineis the per capita per month expenditure that corresponds tothe all India poverty ratio.
SL.NO.
States
Monthly Per Capita(Rs.) Rural
1. Kerala 1.018 2. Gujarath 932 3. Karnataka 902 4. Tamil Nadu 880 5. Andra Pradesh 860
All over India 816 Source: http://planningcommission.nic.in/news/pre_pov2307.pdf
Table 1: State Specific Poverty Lines for 2011-12
Planning Commission of India: Formation and FunctionsThe Planning Commission was
set up by a Resolution of the Governmentof India in March 1950 in pursuance ofdeclared objectives of the Government topromote a rapid rise in the standard ofliving of the people by efficient exploitationof the resources of the country, increasingproduction and offering opportunities to all foremployment in the service of the community.The Planning Commission was charged withthe responsibility of making assessment of
all resources of the country, augmentingdeficient resources, formulating plans forthe most effective and balanced utilizationof resources and determining priorities.Jawaharlal Nehru was the first Chairmanof the Planning Commission.
The first Five-year Plan waslaunched in 1951 and two subsequent five-year plans were formulated till 1965, whenthere was a break because of the Indo-Pakistan Conflict. Two successive yearsof drought, devaluation of the currency,a
general rise in prices and erosion ofresources disrupted the planning processand after three Annual Plans between1966 and 1969, the fourth Five-year planwas started in 1969. The Eighth Plancould not take off in 1990 due to the fastchanging political situation at the Centreand the years 1990-91 and 1991-92 weretreated as Annual Plans. The Eighth Planwas finally launched in 1992 after theinitiation of structural adjustment policies.
-P.S.Mahamad Musstaf
-Kiranbabu.P
(Continued page- 7)
Source: Planing Commission of India-2013
Source: http://planningcommission.nic.in/news/pre_pov2307.pdf
Source: http://planningcommission.nic.in/news/pre_pov2307.pdf

ABHYUDAYA PAGE-5October-2013
Formation of Tendulkar Committee for Poverty EstimationTendulkar Committee was set up in National
Development Council meet of March 2009, to look into themethodology for estimating Poverty followed by widespreadcriticism on Planning Commission producing unrealistically lowpoverty estimates based on incorrect method of povertyestimation; as a result, Government of India claimed largereduction in poverty, both in rural and urban India.
By 2004-05 nearly two-thirds of urban persons werein poverty, unable to spend enough to obtain even a modestnutrition standard of 2100 calories energy daily while therural population similarly was not able to afford the officialrural nutrition norm of 2400 calories and the poverty hadreached 87 %, the highest ever in three decades. Since somepeople think 2400 calories is ‘too high’ for a rural norm eventhough it is the official norm, we can consider 2200 calories:70 % of rural persons were unable to reach this levelcompared to 59 % in 1993-4, so poverty whatever the normapplied, has risen sharply. The official Planning Commissionpoverty estimates using the same consumption spending datahowever were very low, only 28.3 % rural and 25.7 % urbanin 2004-5. The public was not informed that the Commissionhad quietly abandoned its own declared nutrition norms longago in actual practice, and its low poverty estimates werepossible only by taking such unrealistically low ‘Poverty Lines’that the nutritional level it permitted by 2004-05 was only1820 calories rural and 1795 calories urban, far below itsown stated norms.
Tendulkar Committee got a sizable opportunity toaccurate the estimation procedure and regains the ethical positionof the Commission. Unfortunately it has chosen to throw awaythe opportunity and stay with the bogus procedure, which isfundamentally disloyal to the interests of the Indian people sinceit automatically produces false poverty reduction when theground reality is the opposite. The Committee has retained theexisting grossly unrealistic urban Poverty Line of Rs.18 per day(by taking the mixed-recall-period it is raised by Rs.1 per daybut this does not affect nutrition since the extra spending is onnon-food items). It betrays the interests of the Indian peopleby explicitly justifying the lowering of the urban nutrition standardto 1795 calories actually obtainable at this poverty line, from theearlier 2100 calories norm, saying that the United Nations Foodand Agriculture Organization has declared below 1800 caloriesto be an adequate norm for India. But 1800 calories is muchlower than the norm it had given earlier and much lower thanthe norms which continue to be applied to more developed
countries. Why should the Planning Commission give up the2100 calories norm which had been set after careful considerationby a nutrition expert group on the basis of the Indian Council forMedical Research recommendations? This is simply trying tojustify the unjustifiable, the steady lowering of thestandard which has produced the false urban poverty declinein the economic reforms period because the urban poverty linehas been lowered to a level allowing below 1800 calories perday. In the states of Assam, Punjab and Kerala the official urbanpoverty lines are even lower than the average and allowed calorieintake of only 1485,1435 and 1300 calories respectively.
The Tendulkar Committee’s onlyattempt to appease criticism is to raisethe poverty line for rural India from justbelow Rs.12 per day to Rs.13.8 per dayon a comparable basis to the earlierpoverty lines (on mixed recall basis itis raised by a further Rs.1 per day but thisis not relevant for the nutrition standardsince it is the extra recorded spending on
non-food items). This raises the rural poverty percentage to 41.8for 2004-5. It has reworked the poverty percentage for 1993-4to be 50.1 thus obtaining the same order of ‘decline’ in povertyas before over the reforms period. Those who are hailing therise in the rural poverty estimate to 41.8 as a positive move, donot realise that in a matter of a mere 12 to 15 months from now,when the results of the 66th Round data for 2009-10 becomeavailable, the Planning Commission will once more claim ruralpoverty reduction from its new 41.8 percent to, at an informedguess, around 35-36 %. In reality rural poverty would haverisen in the last five years given the effects of world recessionand of rapid food price inflation. But the Commission will estimateand claim poverty reduction nevertheless just as before, becauseit has retained fully the basic logical error in its estimationprocedure. In fact the new method suggested by the TendulkarCommittee of calculating price indices with a lower weight forfood is likely to understate the actual rise in the cost of living, toan even greater extent than earlier price indices did.
“If the misery of the poor be causednot by the laws of nature, but by ourinstitutions, great is our sin.”
- Charles Darwin
-Sreenivasa.D
Suresh Tendulkar
Source: The Expert Group to Review the Methodology for Estimationof Poverty, Gov. of India Planning Commission November, 2009
ABHYUDAYA PAGE-6October-2013
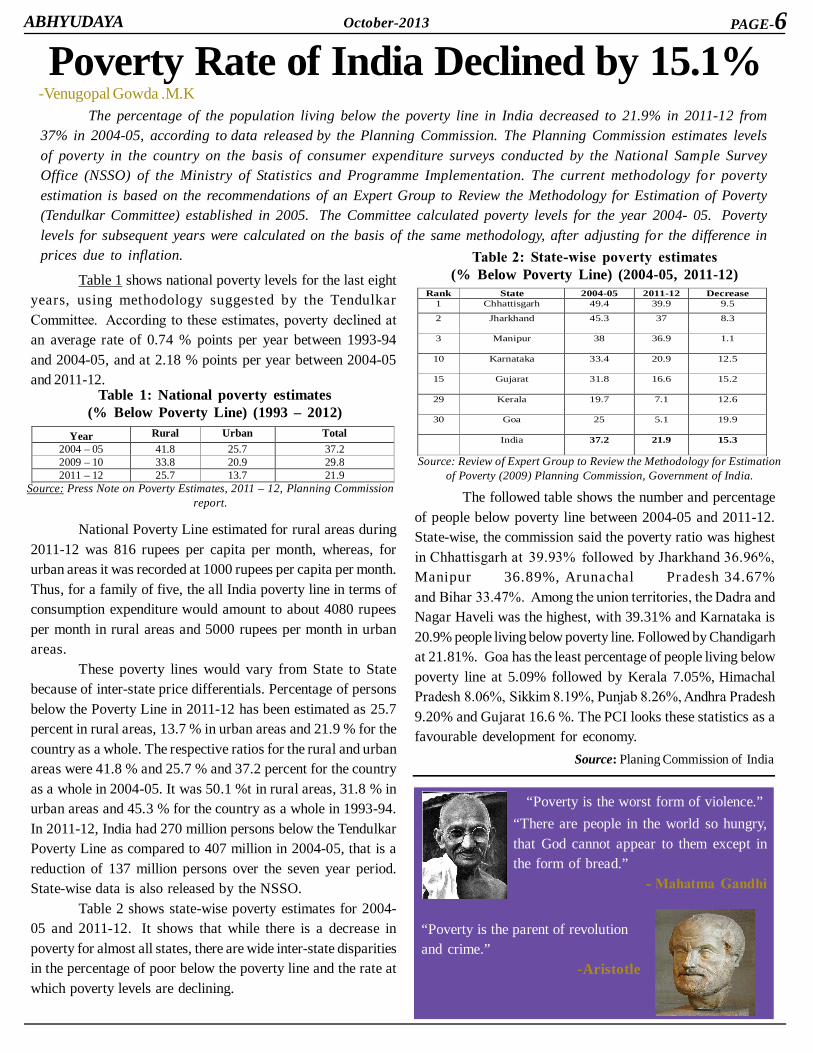
Poverty Rate of India Declined by 15.1%
Rank State 2004-05 2011-12 Decrease 1 Chhattisgarh 49.4 39.9 9.5
2 Jharkhand
45.3 37 8.3
3 Manipur
38 36.9 1.1
10 Karnataka
33.4 20.9 12.5
15 Gujarat
31.8 16.6 15.2
29 Kerala
19.7 7.1 12.6
30 Goa
25 5.1 19.9
India
37.2 21.9 15.3
Source: Review of Expert Group to Review the Methodology for Estimation
The followed table shows the number and percentageof people below poverty line between 2004-05 and 2011-12.State-wise, the commission said the poverty ratio was highestin Chhattisgarh at 39.93% followed by Jharkhand 36.96%,Manipur 36.89%, Arunachal Pradesh 34.67%and Bihar 33.47%. Among the union territories, the Dadra andNagar Haveli was the highest, with 39.31% and Karnataka is20.9% people living below poverty line. Followed by Chandigarhat 21.81%. Goa has the least percentage of people living belowpoverty line at 5.09% followed by Kerala 7.05%, HimachalPradesh 8.06%, Sikkim 8.19%, Punjab 8.26%, Andhra Pradesh9.20% and Gujarat 16.6 %. The PCI looks these statistics as afavourable development for economy.
Year Rural Urban Total 2004 – 05 41.8 25.7 37.2 2009 – 10 33.8 20.9 29.8 2011 – 12 25.7 13.7 21.9
Source: Press Note on Poverty Estimates, 2011 – 12, Planning Commission
National Poverty Line estimated for rural areas during2011-12 was 816 rupees per capita per month, whereas, forurban areas it was recorded at 1000 rupees per capita per month.Thus, for a family of five, the all India poverty line in terms ofconsumption expenditure would amount to about 4080 rupeesper month in rural areas and 5000 rupees per month in urbanareas.
These poverty lines would vary from State to Statebecause of inter-state price differentials. Percentage of personsbelow the Poverty Line in 2011-12 has been estimated as 25.7percent in rural areas, 13.7 % in urban areas and 21.9 % for thecountry as a whole. The respective ratios for the rural and urbanareas were 41.8 % and 25.7 % and 37.2 percent for the countryas a whole in 2004-05. It was 50.1 %t in rural areas, 31.8 % inurban areas and 45.3 % for the country as a whole in 1993-94.In 2011-12, India had 270 million persons below the TendulkarPoverty Line as compared to 407 million in 2004-05, that is areduction of 137 million persons over the seven year period.State-wise data is also released by the NSSO.
Table 2 shows state-wise poverty estimates for 2004-05 and 2011-12. It shows that while there is a decrease inpoverty for almost all states, there are wide inter-state disparitiesin the percentage of poor below the poverty line and the rate atwhich poverty levels are declining.
Table 1: National poverty estimates(% Below Poverty Line) (1993 – 2012)
Table 2: State-wise poverty estimates(% Below Poverty Line) (2004-05, 2011-12)Table 1 shows national poverty levels for the last eight
years, using methodology suggested by the TendulkarCommittee. According to these estimates, poverty declined atan average rate of 0.74 % points per year between 1993-94and 2004-05, and at 2.18 % points per year between 2004-05and 2011-12.
“Poverty is the worst form of violence.” “There are people in the world so hungry,that God cannot appear to them except inthe form of bread.”
- Mahatma Gandhi
“Poverty is the parent of revolutionand crime.”
-Aristotle
-Venugopal Gowda .M.K
Source: Planing Commission of India
The percentage of the population living below the poverty line in India decreased to 21.9% in 2011-12 from37% in 2004-05, according to data released by the Planning Commission. The Planning Commission estimates levelsof poverty in the country on the basis of consumer expenditure surveys conducted by the National Sample SurveyOffice (NSSO) of the Ministry of Statistics and Programme Implementation. The current methodology for povertyestimation is based on the recommendations of an Expert Group to Review the Methodology for Estimation of Poverty(Tendulkar Committee) established in 2005. The Committee calculated poverty levels for the year 2004- 05. Povertylevels for subsequent years were calculated on the basis of the same methodology, after adjusting for the difference inprices due to inflation.
Source: Press Note on Poverty Estimates, 2011 – 12, Planning Commissionreport.
Source: Review of Expert Group to Review the Methodology for Estimationof Poverty (2009) Planning Commission, Government of India.

ABHYUDAYA PAGE-7October-2013
Planning Commission of India: Formation and Functions...For the first eight Plans the emphasis was on a growing
public sector with massive investments in basic and heavyindustries, but since the launch of the Ninth Plan in 1997, theemphasis on the public sector has become less pronouncedand the current thinking on planning in the country, in general,is that it should increasingly be of an indicative nature.
Tendulkar Committee was set up in NationalDevelopment Council meet in March 2009, to look into themethodology for estimating poverty followed by widespreadcriticism on Planning Commission producing unrealistically lowpoverty estimates based on incorrect method of povertyestimation, as a result of when Government of India claimedlarge reduction in poverty, both in rural and urban India. Incontrast of unemployment situation in worse station gettingfood grain consumption and cloth consumption were declining,average calorie intake as well as protein intake showed declineand there was considerable agrarian distress.Organization
The Prime Minister is the Chairman of the PlanningCommission, which works under the overall guidance of theNational Development Council. The Deputy Chairman and thefull time Members of the Commission, as a composite body,provide advice and guidance to the subject divisions for theformulation of Five Year Plans, Annual Plans, State Plans,Monitoring Plan Programmes, Projects and Schemes.The Planning Commission functions through several Divisions,
each headed by a Senior Officer.1.Chairman2.Deputy Chairman3.Minister of State4.Members
5.Secretary6.Senior Officials7.Grievance Officers
Divisions1.Agriculture2.Communication, IT& Information3.Decentralized planning, Panchayati Raj and Special AreaProgramme (Including Western Ghat Secretariat)4.Development Policy & Perspective Planning5.Direct Benefit Transfer6.Environment & Forests (Including Climate Change Cell)7.Financial Resources8.Health, Family Welfare & Nutrition9.Housing and Urban Affairs (including Home Affairs Cell)10.Human Resources Development11.Industries12.Infrastructure13.International Economics14.International Relations Cell15.Labour, Employment & Manpower16.Minerals17.Minorities Division18.Plan Coordination and Management19.Power & Energy20.Project Appraisal & Management21.Rural Development22.Science & Technology23.Social Justice and Social Welfare24.Socio-Economic Research25.State Plans (Including Island Development Authority)26.Transport and Tourism27.Village and Small Enterprises28.Voluntary Action Cell29.Water Resources Division30. Women & Child Development31Programme Evaluation Organization
Source: 1.www.planningcommssion.nic.in2.Understanding the poverty line, The Hindu,06/08/2013
Poverty an Obstacle to Economic Development: A Debate...
(continued from Page-4)
(continued from page-2)
Source: Todaro, M. P. – Economic Development in the ThirdWorld, Thirlwal, A. P. – Growth and Development.
development.Economist RangerNurkse in his work ‘Problems ofCapital Formation in UnderdevelopedCountries’ argues “a country is poorbecause it is poor”. Being poor, a coun-try has little ability or incentive to save.Low saving leads to low level of in-vestment and to deficiency of capital.
The low investment leads to low level of productivity. Whenthe productivity per worker is low, the real income willobviously be low and hence the poverty and vicious circle iscomplete.
On the side of demand when people have low real
income, the demand for goods is boundto be small. In the small size of market,there is no incentive of invest in real orhuman capital. When the rate of invest-ment is low, the productivity of the fac-tors of production is bound to be low.Low productivity leads to low per capi-tal income, which is rapidly absorbed bythe rising population growth. The coun-
try, therefore, remain poor. In this respect poverty is an ob-stacle to Economic Development.

ABHYUDAYA PAGE-8October-2013
(continued from page 1)
Published by Prof. N. Usha Rani, Coordinator , UGC- UPE-Focus Area-II, Vijnana Bhavan, Manasagangotri, University of Mysore, Mysore-570006Printed by University of Mysore, Mysore-570006
University with Potential for Excellence of University Grants Commission was awarded to the University of Mysore inthe disciplines of Science and Social Science. In social science, the focus area of study is ‘Media and Social Development:A Case Study of Karnataka’. The Newsletter ABHYUDAYA is an initiative to create awareness in the area of media andsocial development by encouraging Project Fellows to submit contributions in interdisciplinary areas of social sciences.Core Committee of UGC UPE Focus Area-IIProf.N.Usha rani, Prof.Y.S.Siddegowda, Prof.Muzaffar H.Assadi, Prof.R.Indira, Prof.Krishne Gowda, Prof.M.Indira,Dr.M.Devaraj, Prof.Chandrashekar, Prof.Ramesh, Dr.Nanjunda, Dr.Navitha Thimmaiah.Editor: Prof.N.Usha Rani; Executive Editors: Prof.Y.S.Siddegowda & Prof.Muzaffar H.AssadiResearch Scholar Editor: Arjun.R, Designer: Venugopal Gowda M.K.
ABHYUDAYA Newsletter is published monthly by the University Grants Commission assisted UPE - University withPotential for Excellence - Focus Area-II Project of the University of Mysore, Mysore, India. The opinions expressed by theauthors do not necessarily reflect the views of the publishers. Submissions: Email; [email protected]
Absolute Poverty : A person living in absolute poverty is not able to satisfy his or her minimumDeprivation: A lack of welfare, often understood in terms of material goods and resources but equally applicable to psychologicalfactors, relative to the local community or the wider society or nation to which an individual, family or group belongs .Human Poverty Index (HPI): A composite index introduced by UNDP in 1997, which focuses on those who do not achieveminimum standards of health, education and living conditions.Poverty Headcount : Refers to the proportion of individuals, households or families that falls under the poverty line. Dividesthe number of people identified as poor by the total number of people in the community.Poverty Spell: The period of time spent in poverty. In longitudinal studies, often the duration of poverty and the causes ofthe transition out of poverty are analysed .Poverty Trends: How aggregate poverty levels change over time Public Goods, good that is provided for users collectively.
Glossary
indicators and weights thatmake sense. At the country level,however, the multidimensional povertyapproach to assessing deprivations at thehousehold level can be tailored usingcountry-specific data and indicators toprovide a richer picture of poverty at thecountry level. The MPI methodology tobe modified to generate nationalMultidimensional Poverty Measures thatreflects local culture, economic, climaticand other factors. The international MPIwas devised as an analytical tool tocompare acute poverty across nations.
Source: UNDP Report -2010&11
Poverty does not have one cleardefinition because it is multi-faceted con-cept that has drawn the attention of bothEconomists and the Sociologists. Accord-ing to Human Rights Commission’s Re-port, the concept of poverty can be statedin three different ways. The first and mosteffective definition of poverty is that Pov-erty is situation in which there is dearth ofessential facilities, resulting from inad-equate income’. Thereis a socially ac-cepted minimum level of living in everysociety. Those who live below this mini-mum level are said to live in poverty.
The second definition of povertyis based on basic or fundamental needs,i.e. a failure to meet the basic humanneeds; or to remain deprived from suchneeds is a state of poverty. The basic hu-man needs include not only food, clothing
and dwelling, but also health and educa-tion. The third way of defining povertyis in respect of lack of opportunities.Shifting from the traditional base of fun-damental needs & income, the moderndefinition of poverty is based on the lackof opportunities. According to the mod-ern connotation, poverty does not merelymean lack of adequate income or inabil-ity to meet basic human needs. Somepeople do have a potential to cross theborders of poverty. They have goodhealth and can live a productive life how-ever; still they are deprived of suitableopportunities. The tacit denial of oppor-tunities pushes them into unemploymentresulting in loss of income and finallyinability to meet the basic human needs.Here, the emphasis is shifted from theindividual to the surroundings.
-Gayathri.R
Multi Dimensional Approach ...
Source: Human Rights Commission of India-Khalil Gibran
Poverty is a veilthat obscures the face ofgreatness. An appeal is amask covering the face oftribulation.
Understanding the term ‘Poverty’