Embed Size (px)
Citation preview
Multi-core Programming
Threading Methodology

2
Topics
• A Generic Development Cycle
3
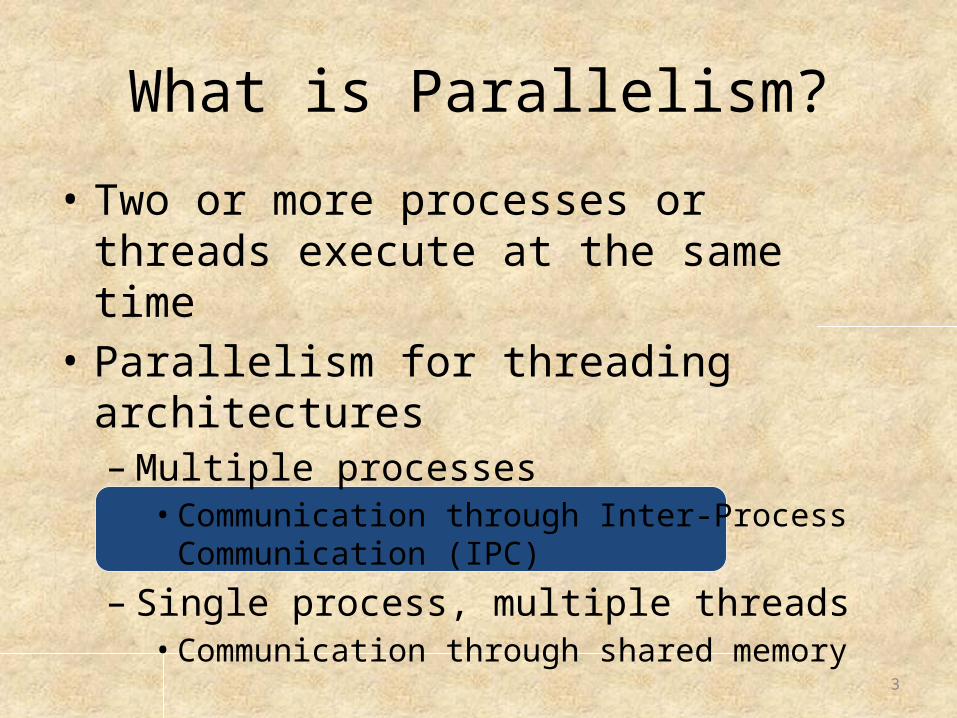
What is Parallelism?
• Two or more processes or threads execute at the same time
• Parallelism for threading architectures– Multiple processes
• Communication through Inter-Process Communication (IPC)
– Single process, multiple threads• Communication through shared memory
4
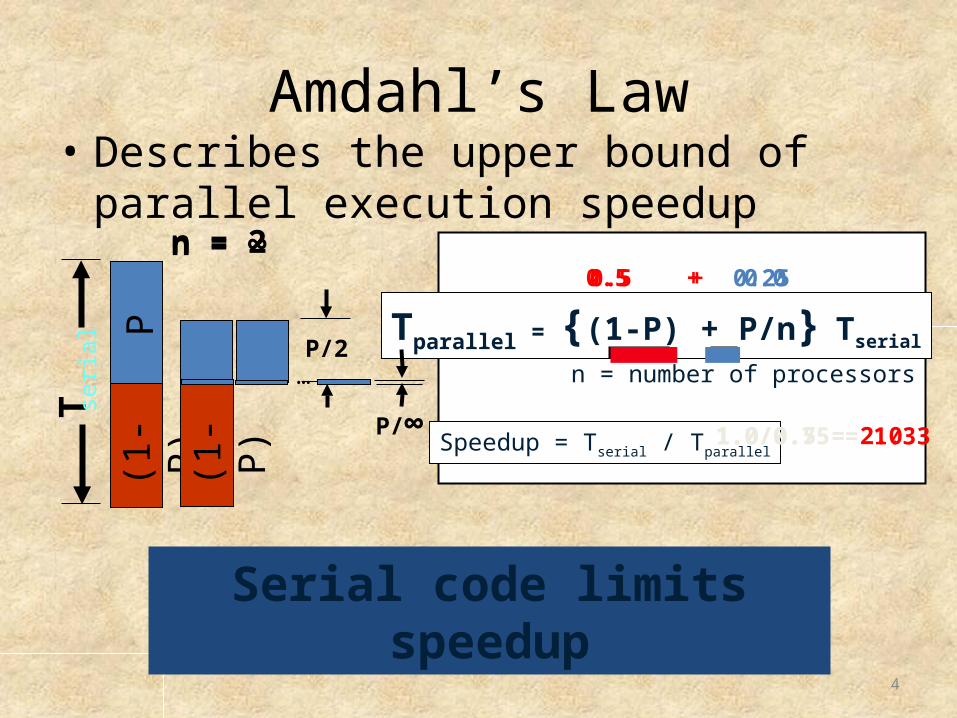
n = number of processors
Tparallel = {(1-P) + P/n} Tserial
Speedup = Tserial / Tparallel
Amdahl’s Law• Describes the upper bound of parallel
execution speedup
Serial code limits speedup
(1-P
)P
Tse
rial
(1-P
)
P/2
0.5 + 0.25
1.0/0.75 = 1.33
n = 2n = ∞
P/∞
…
0.5 + 0.0
1.0/0.5 = 2.0
5
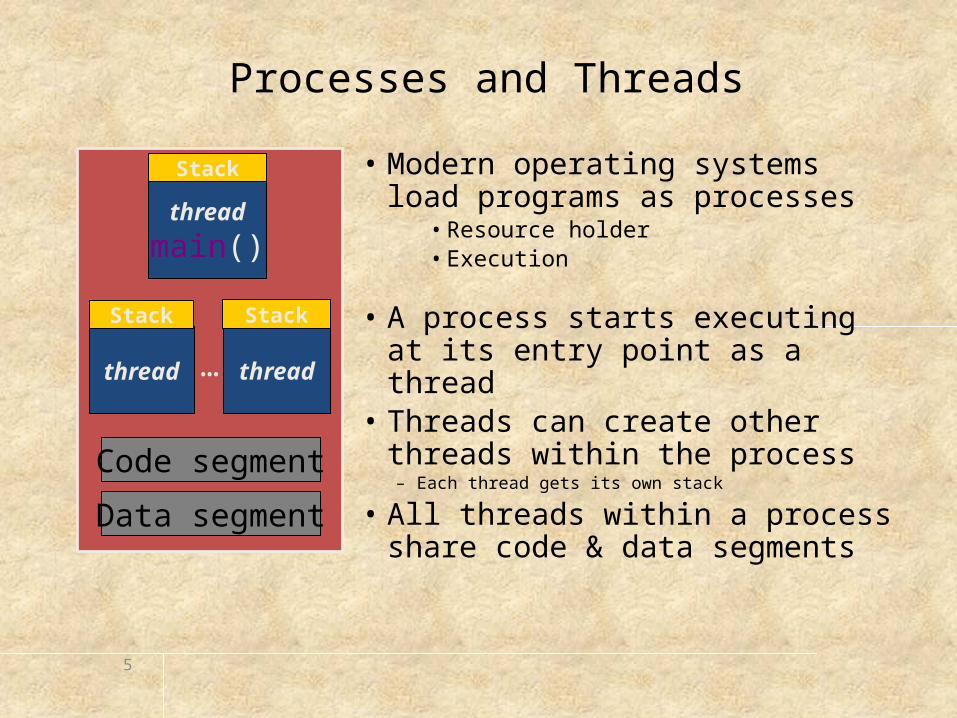
Processes and Threads
• Modern operating systems load programs as processes
• Resource holder• Execution
• A process starts executing at its entry point as a thread
• Threads can create other threads within the process– Each thread gets its own stack
• All threads within a process share code & data segments
Code segment
Data segment
thread
main()
…thread thread
Stack Stack
Stack
6
Threads – Benefits & Risks
• Benefits– Increased performance and better resource
utilization• Even on single processor systems - for hiding latency
and increasing throughput
– IPC through shared memory is more efficient• Risks
– Increases complexity of the application– Difficult to debug (data races, deadlocks, etc.)
7
Commonly Encountered Questions with Threading Applications
• Where to thread?• How long would it take to thread?• How much re-design/effort is required?• Is it worth threading a selected region?• What should the expected speedup be?• Will the performance meet expectations?• Will it scale as more threads/data are added?• Which threading model to use?
8
Development Methodology
• Analysis– Find computationally intense code
• Design (Introduce Threads)– Determine how to implement threading solution
• Debug for correctness– Detect any problems resulting from using threads
• Tune for performance– Achieve best parallel performance
9
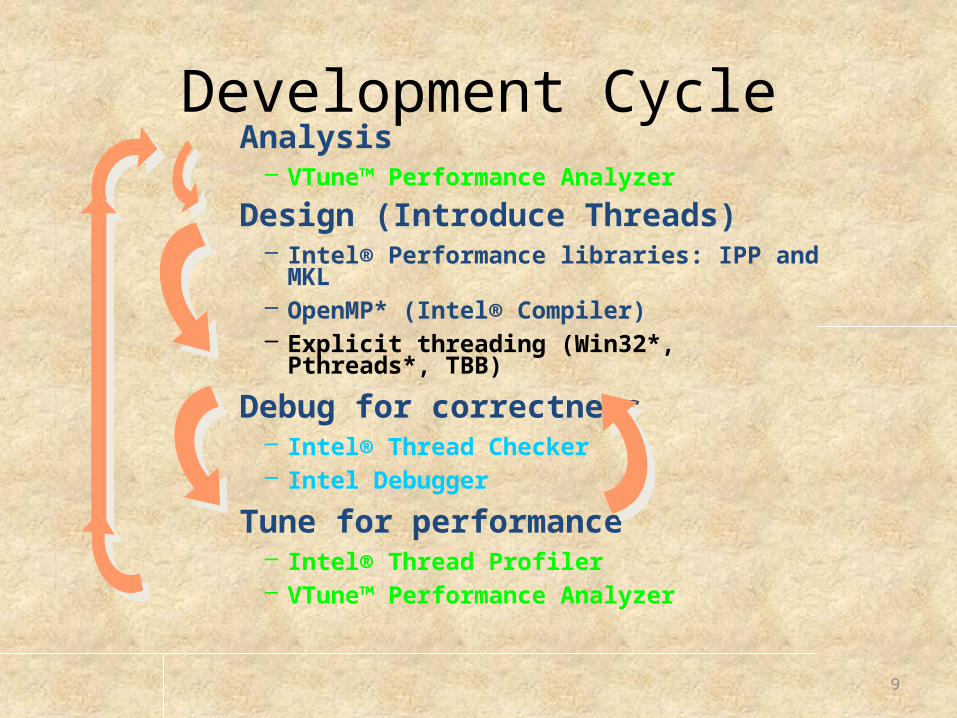
Development Cycle Analysis
– VTune™ Performance Analyzer
Design (Introduce Threads)– Intel® Performance libraries: IPP and MKL– OpenMP* (Intel® Compiler)– Explicit threading (Win32*, Pthreads*, TBB)
Debug for correctness– Intel® Thread Checker– Intel Debugger
Tune for performance– Intel® Thread Profiler– VTune™ Performance Analyzer
Threaded Programming Methodology 10
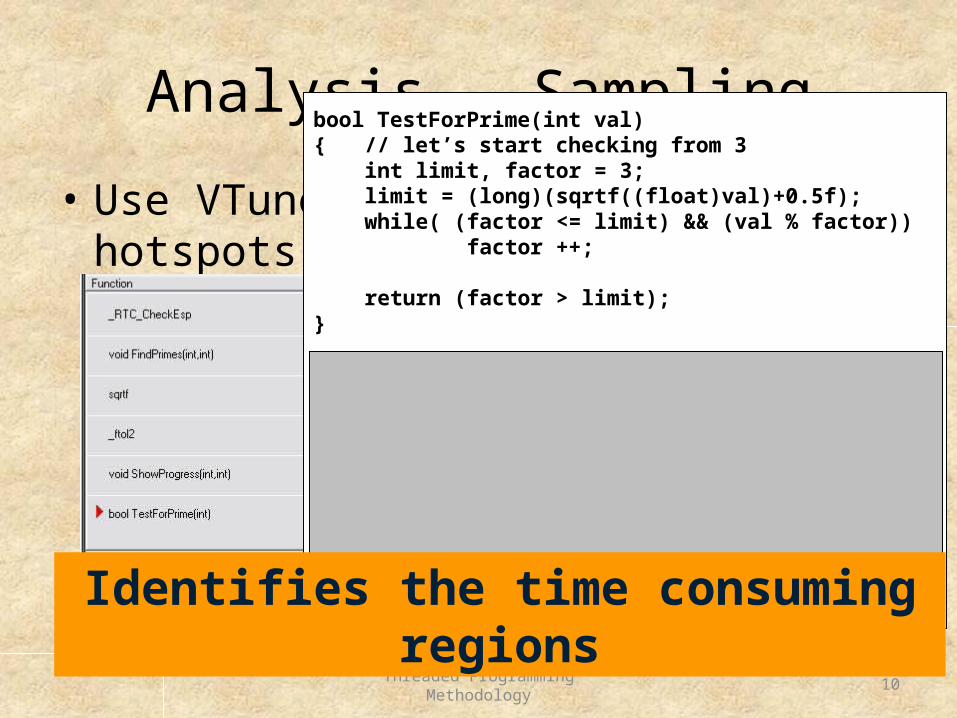
Analysis - Sampling
• Use VTune Sampling to find hotspots in application
bool TestForPrime(int val){ // let’s start checking from 3 int limit, factor = 3; limit = (long)(sqrtf((float)val)+0.5f); while( (factor <= limit) && (val % factor)) factor ++;
return (factor > limit);}
void FindPrimes(int start, int end){ // start is always odd int range = end - start + 1; for( int i = start; i <= end; i+= 2 ){ if( TestForPrime(i) ) globalPrimes[gPrimesFound++] = i; ShowProgress(i, range); }}Identifies the time consuming regions
Threaded Programming Methodology 11
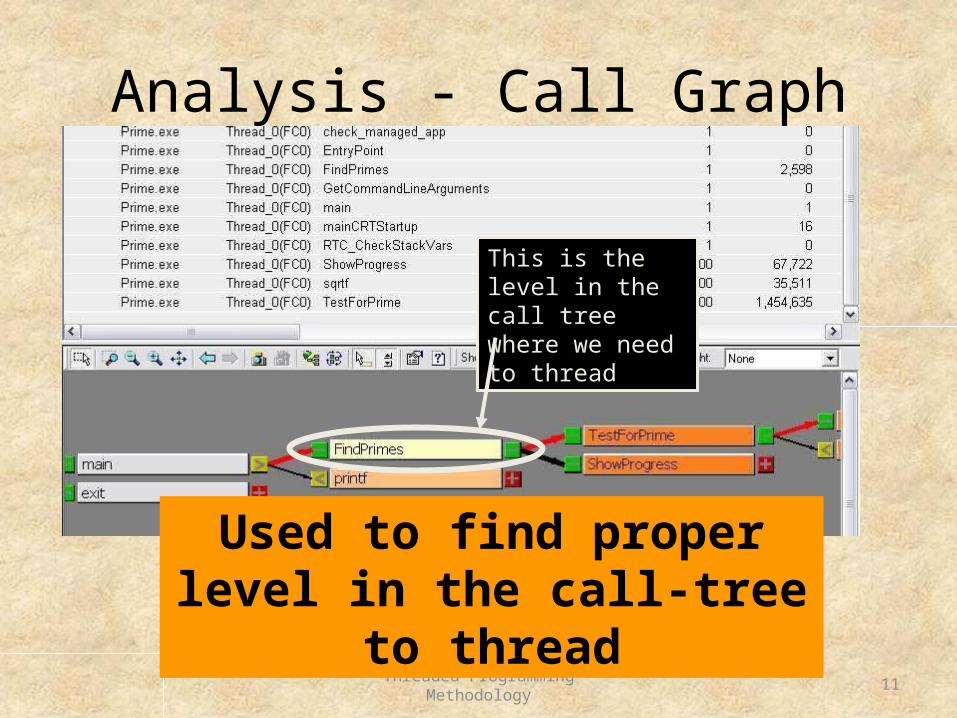
Analysis - Call Graph
This is the level in the call tree where we need to thread
Used to find proper level in the call-tree to thread
Threaded Programming Methodology 12
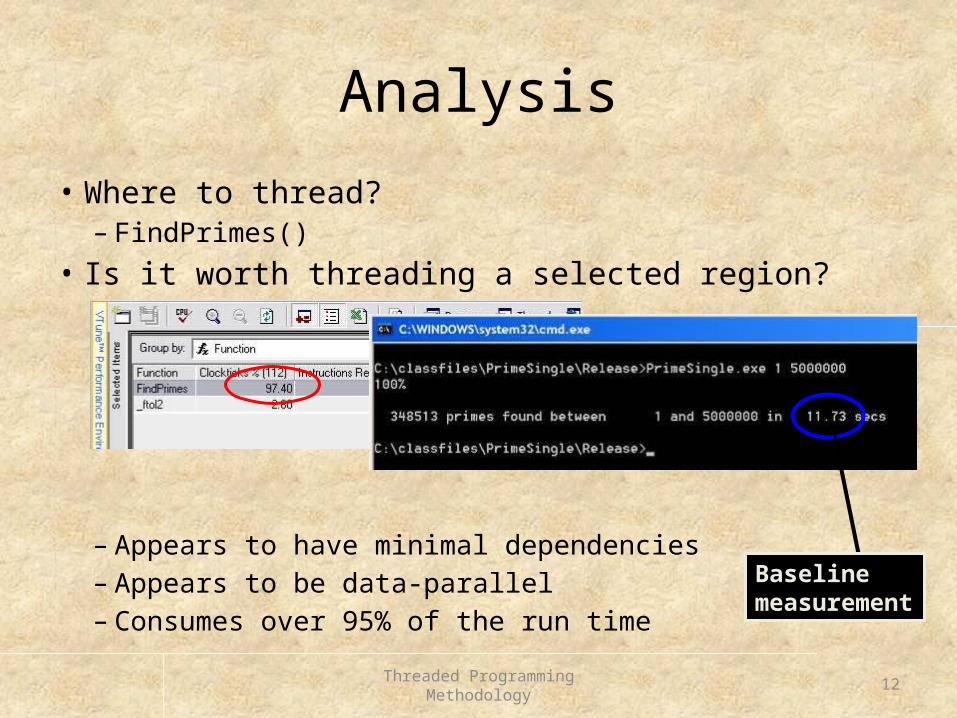
Analysis
• Where to thread?– FindPrimes()
• Is it worth threading a selected region?
– Appears to have minimal dependencies– Appears to be data-parallel– Consumes over 95% of the run time
Baseline measurement
13
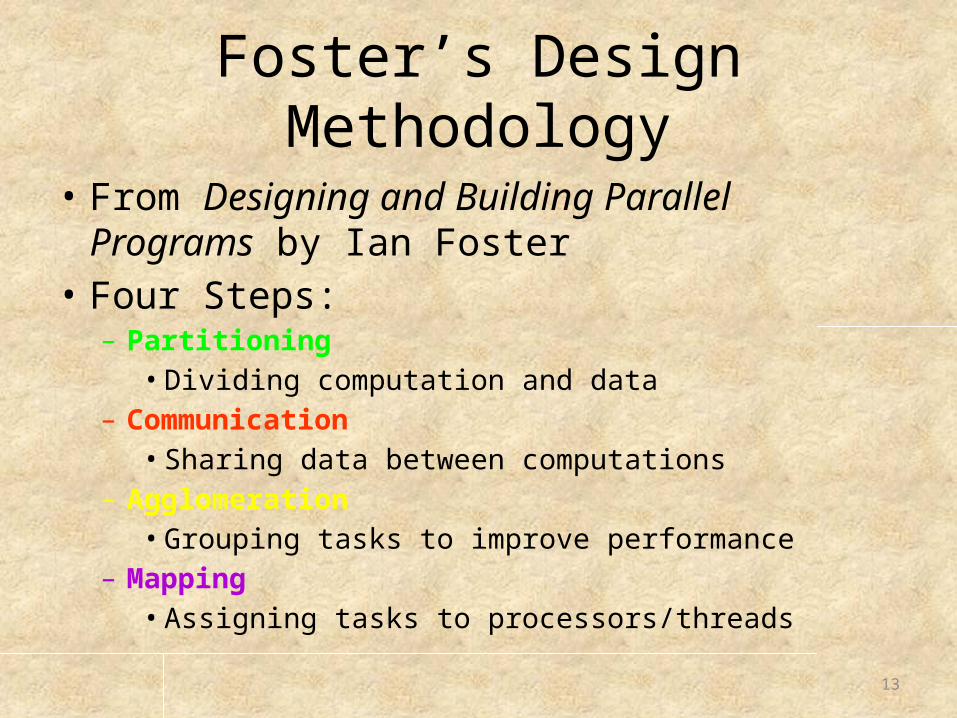
Foster’s Design Methodology
• From Designing and Building Parallel Programs by Ian Foster
• Four Steps:– Partitioning
• Dividing computation and data– Communication
• Sharing data between computations– Agglomeration
• Grouping tasks to improve performance– Mapping
• Assigning tasks to processors/threads
14
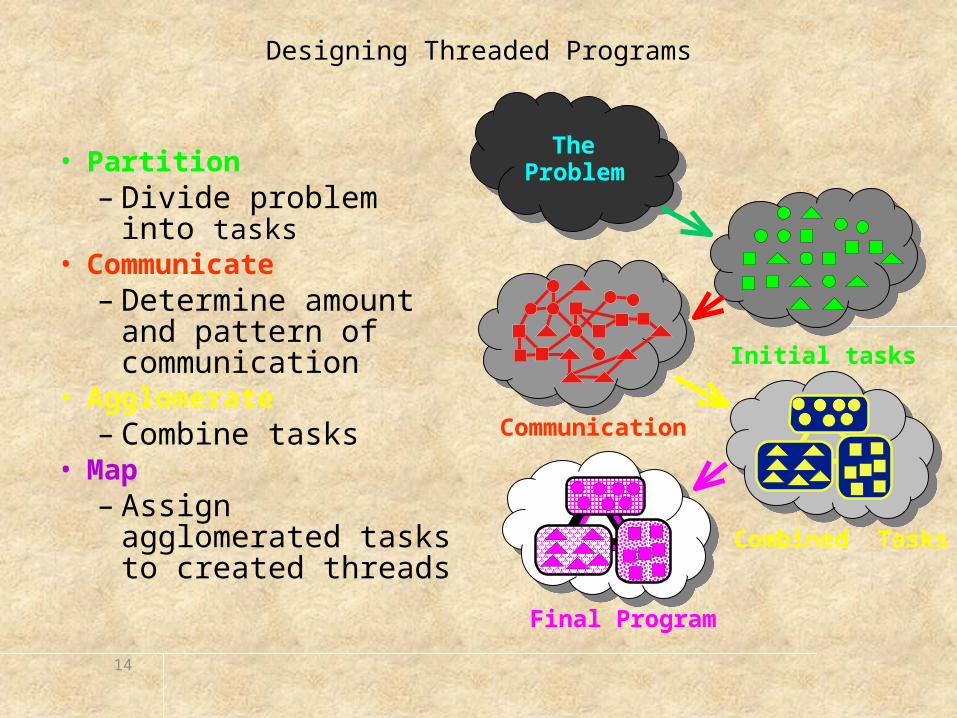
Designing Threaded Programs
• Partition– Divide problem into
tasks• Communicate
– Determine amount and pattern of communication
• Agglomerate– Combine tasks
• Map– Assign agglomerated
tasks to created threads
TheProblem
Initial tasks
Communication
Combined Tasks
Final Program
15
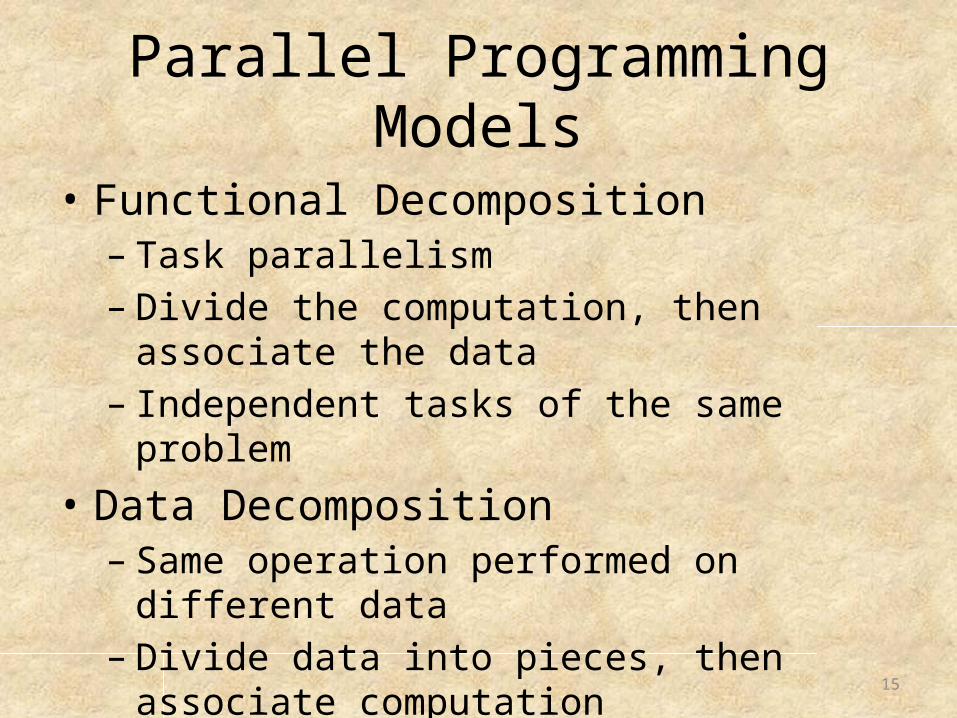
Parallel Programming Models
• Functional Decomposition– Task parallelism– Divide the computation, then associate the data– Independent tasks of the same problem
• Data Decomposition– Same operation performed on different data– Divide data into pieces, then associate
computation
16
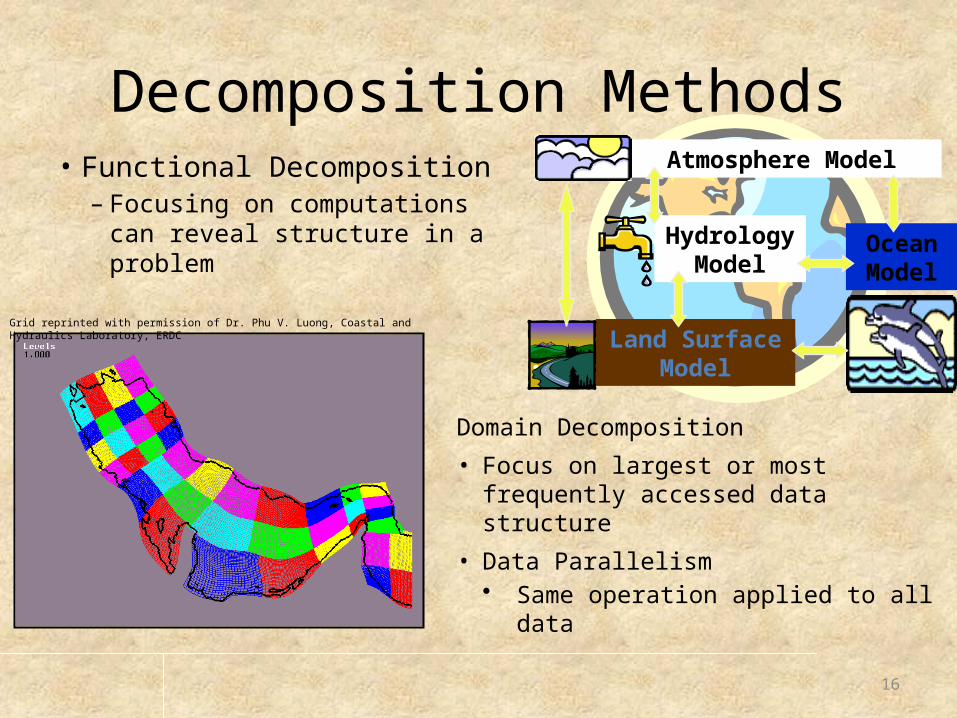
Decomposition Methods• Functional Decomposition
– Focusing on computations can reveal structure in a problem
Grid reprinted with permission of Dr. Phu V. Luong, Coastal and Hydraulics Laboratory, ERDC
Domain Decomposition
• Focus on largest or most frequently accessed data structure
• Data Parallelism• Same operation applied to all data
Atmosphere Model
Ocean Model
Land Surface Model
Hydrology Model
17
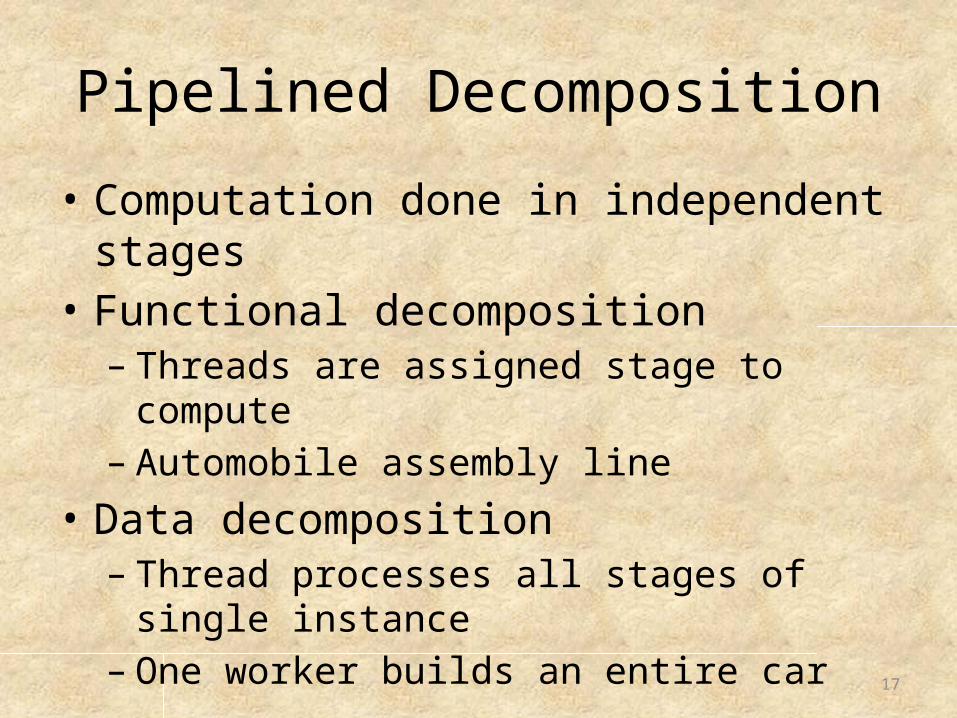
Pipelined Decomposition
• Computation done in independent stages• Functional decomposition
– Threads are assigned stage to compute– Automobile assembly line
• Data decomposition– Thread processes all stages of single instance– One worker builds an entire car
18
LAME Encoder Example
• LAME MP3 encoder – Open source project– Educational tool used for learning
• The goal of project is – To improve the psychoacoustics quality – To improve the speed of MP3 encoding
19
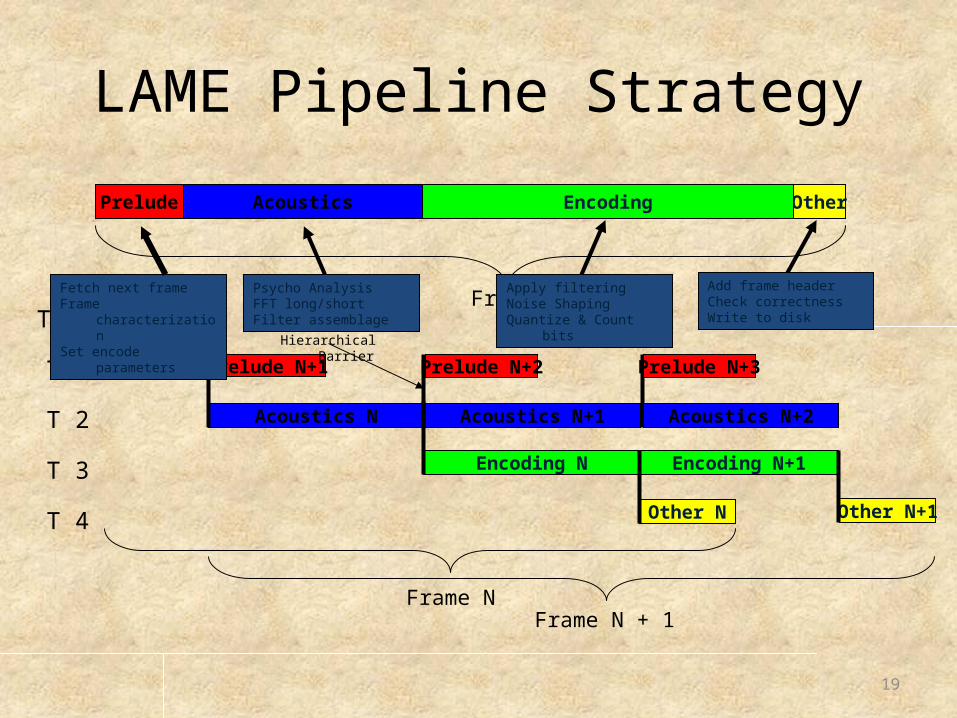
LAME Pipeline Strategy
Frame NFrame N + 1
Time
Other N
Prelude N
Acoustics N
Encoding N
T 2
T 1
Acoustics N+1
Prelude N+1
Other N+1
Encoding N+1
Acoustics N+2
Prelude N+2
T 3
T 4
Prelude N+3
Hierarchical Barrier
OtherPrelude Acoustics Encoding
FrameFetch next frameFrame characterizationSet encode parameters
Psycho AnalysisFFT long/shortFilter assemblage
Apply filteringNoise ShapingQuantize & Count bits
Add frame headerCheck correctnessWrite to disk
Threaded Programming Methodology 20
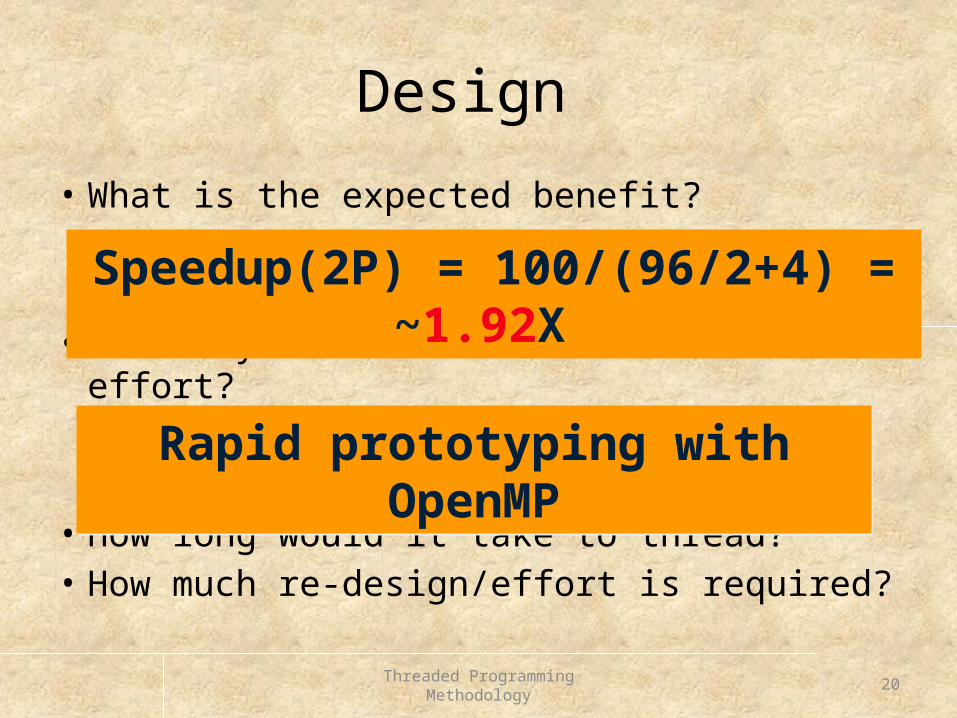
Design
• What is the expected benefit?
• How do you achieve this with the least effort?
• How long would it take to thread?• How much re-design/effort is required?
Rapid prototyping with OpenMPRapid prototyping with OpenMP
Speedup(2P) = 100/(96/2+4) = ~1.92X
21
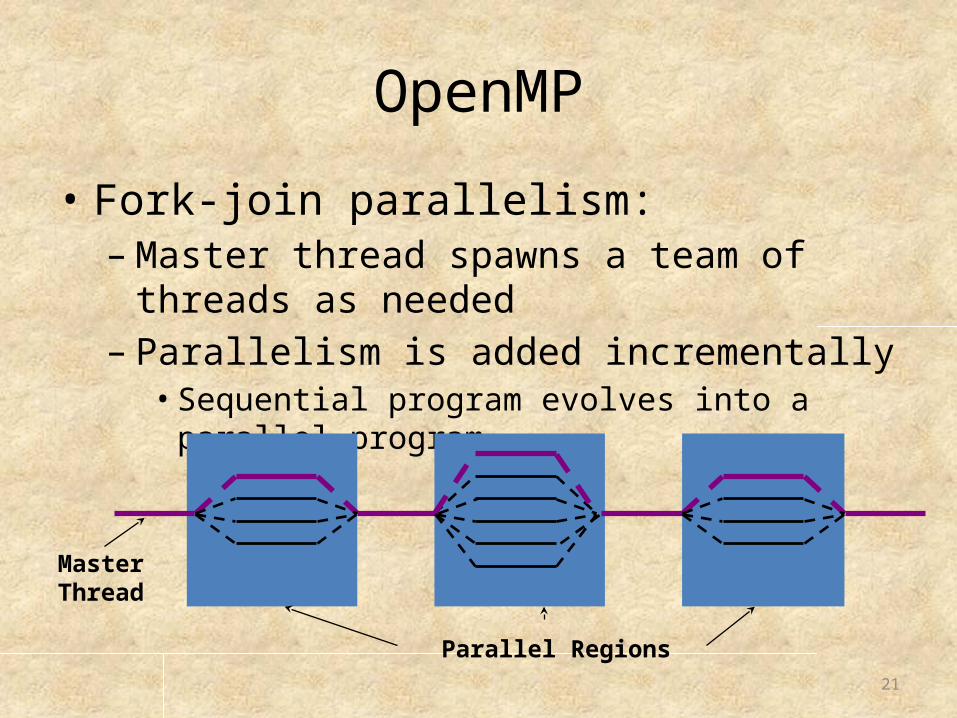
OpenMP
• Fork-join parallelism: – Master thread spawns a team of threads as
needed– Parallelism is added incrementally
• Sequential program evolves into a parallel program
Parallel Regions
Master Thread
Threaded Programming Methodology 22
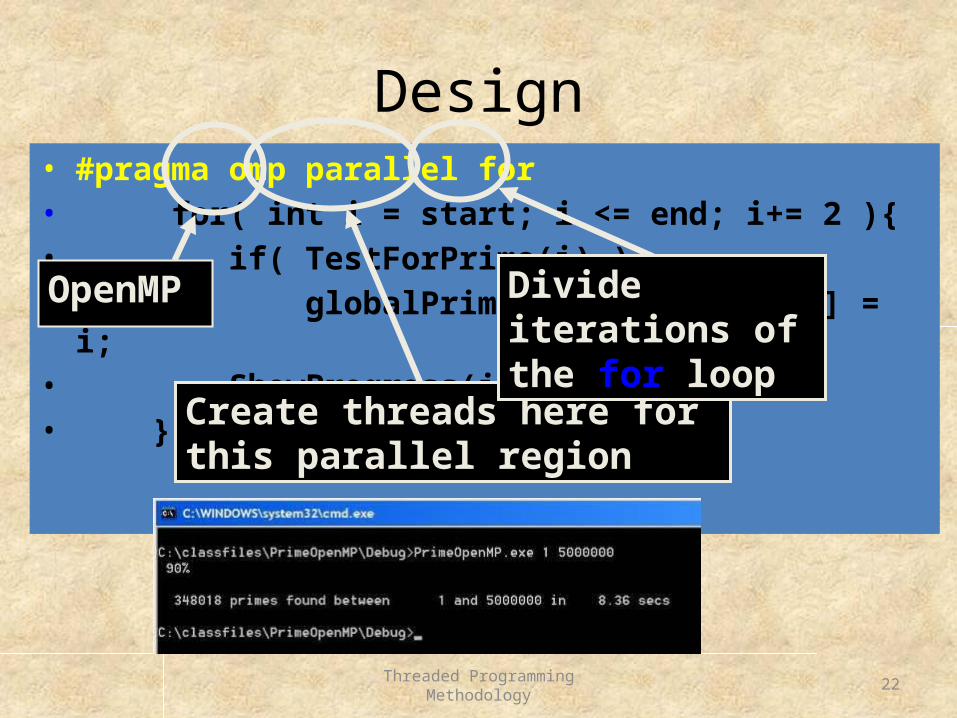
Design• #pragma omp parallel for• for( int i = start; i <= end; i+= 2 ){• if( TestForPrime(i) )• globalPrimes[gPrimesFound++] = i;
• ShowProgress(i, range);• }
OpenMP
Create threads here for this parallel region
Divide iterations of the for loop
23
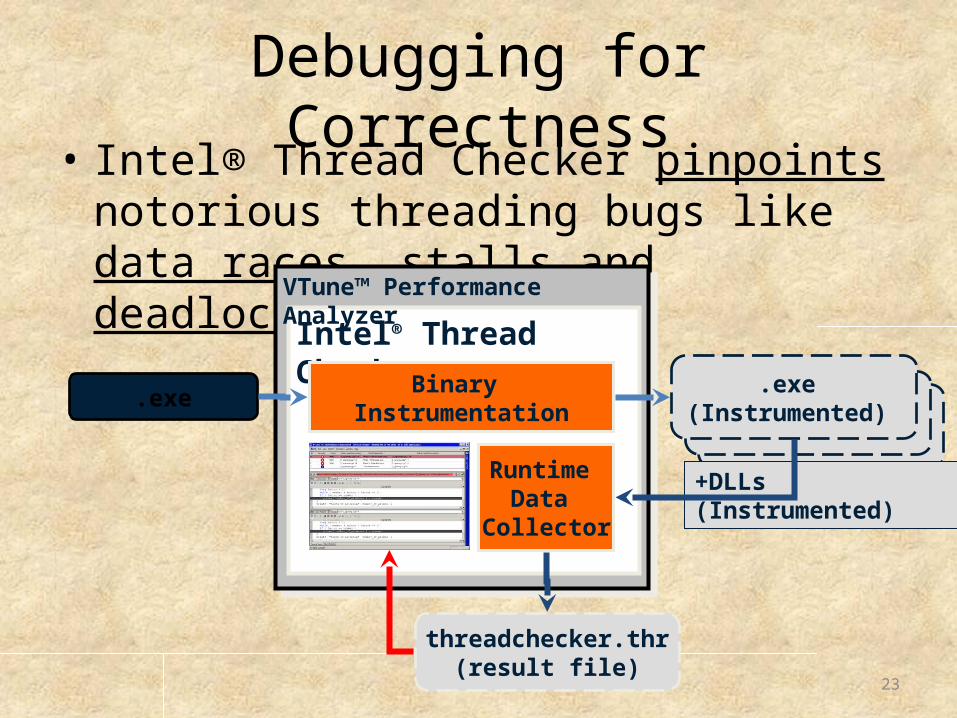
Debugging for Correctness• Intel® Thread Checker pinpoints notorious
threading bugs like data races, stalls and deadlocks
Intel® Thread Checker
VTune™ Performance Analyzer
+DLLs (Instrumented)
Binary Instrumentation
.exe.exe
(Instrumented)
Runtime Data
Collector
threadchecker.thr(result file)
Threaded Programming Methodology 24
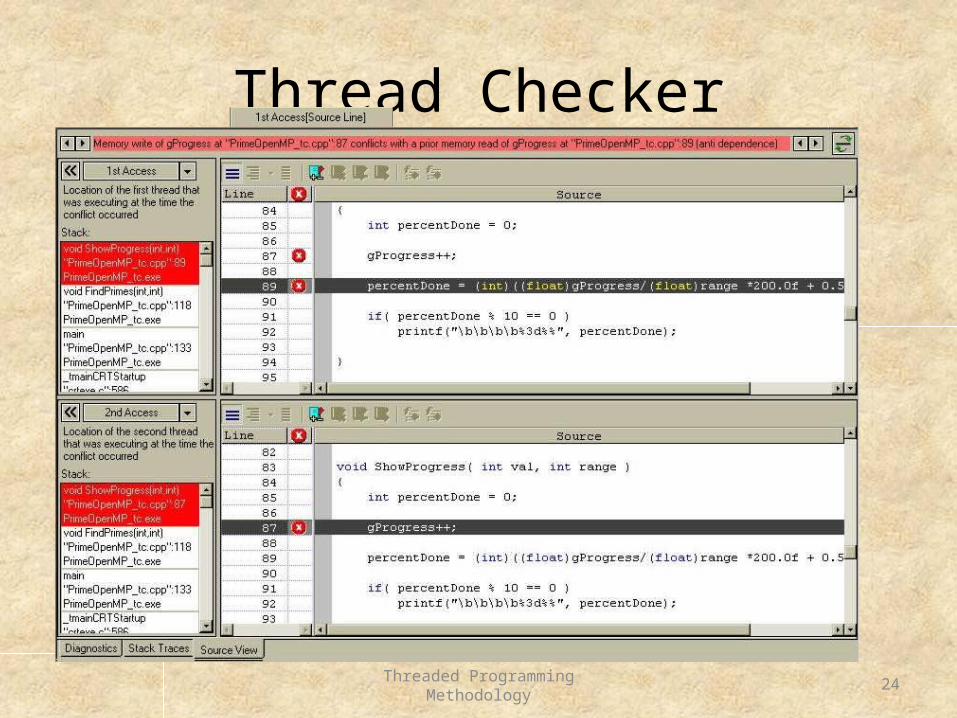
Thread Checker
Threaded Programming Methodology 25
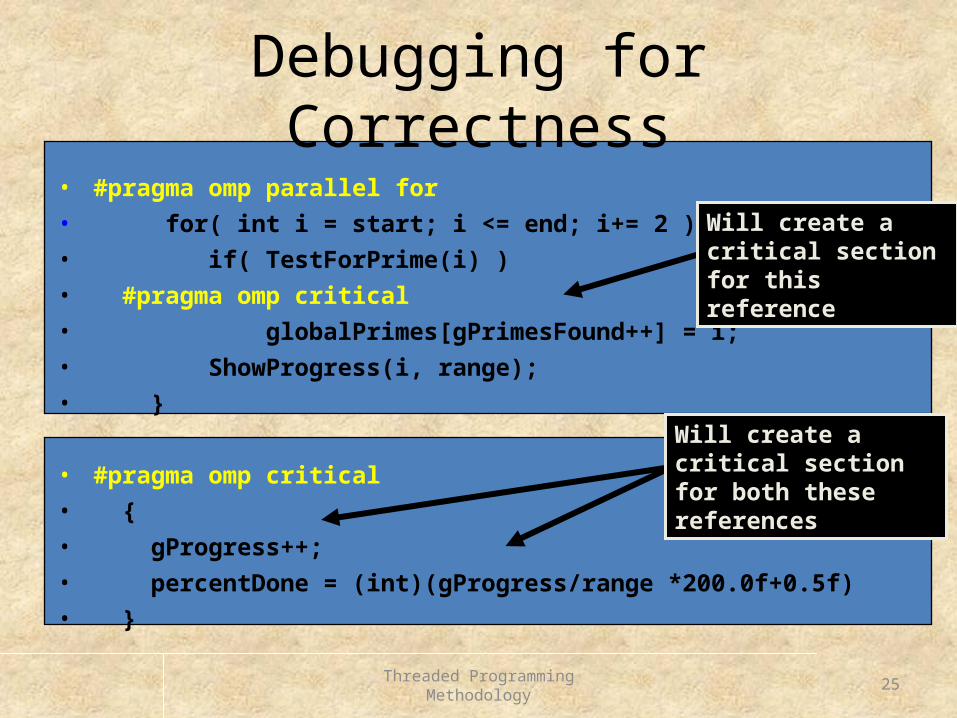
Debugging for Correctness• #pragma omp parallel for
• for( int i = start; i <= end; i+= 2 ){
• if( TestForPrime(i) )
• #pragma omp critical
• globalPrimes[gPrimesFound++] = i;
• ShowProgress(i, range);
• }
• #pragma omp critical
• {
• gProgress++;
• percentDone = (int)(gProgress/range *200.0f+0.5f)
• }
Will create a critical section for this reference
Will create a critical section for both these references
26
Common Performance Issues
• Parallel Overhead– Due to thread creation, scheduling …
• Synchronization– Excessive use of global data, contention for the
same synchronization object• Load Imbalance
– Improper distribution of parallel work• Granularity
– No sufficient parallel work
Threaded Programming Methodology 27
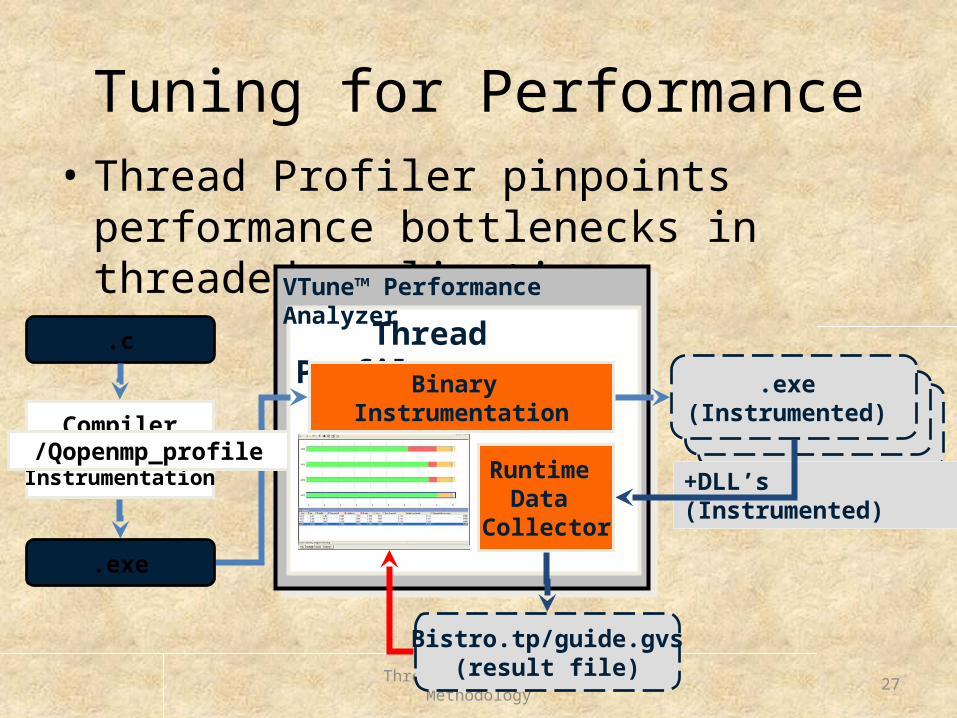
Tuning for Performance• Thread Profiler pinpoints performance
bottlenecks in threaded applications
Thread Profiler
VTune™ Performance Analyzer
+DLL’s (Instrumented)
Binary Instrumentation
.c
.exe (Instrumented)
Runtime Data
Collector
Bistro.tp/guide.gvs(result file)
CompilerSource
Instrumentation
.exe
/Qopenmp_profile
28
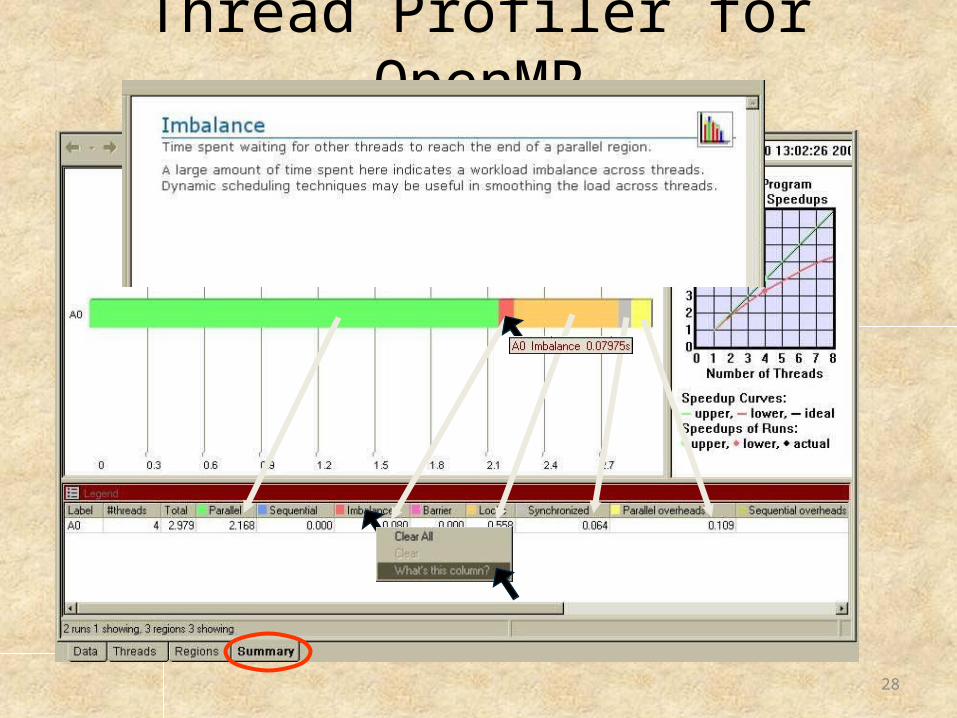
Thread Profiler for OpenMP
29
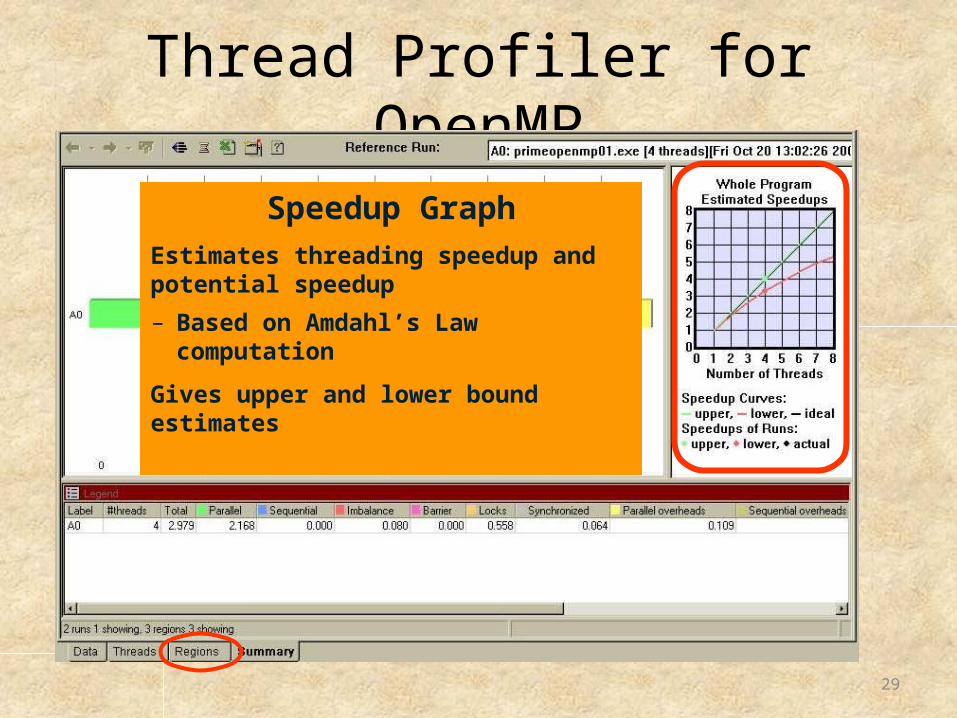
Thread Profiler for OpenMP
Speedup GraphEstimates threading speedup and potential speedup
– Based on Amdahl’s Law computation
Gives upper and lower bound estimates
30Threaded Programming Methodoloy
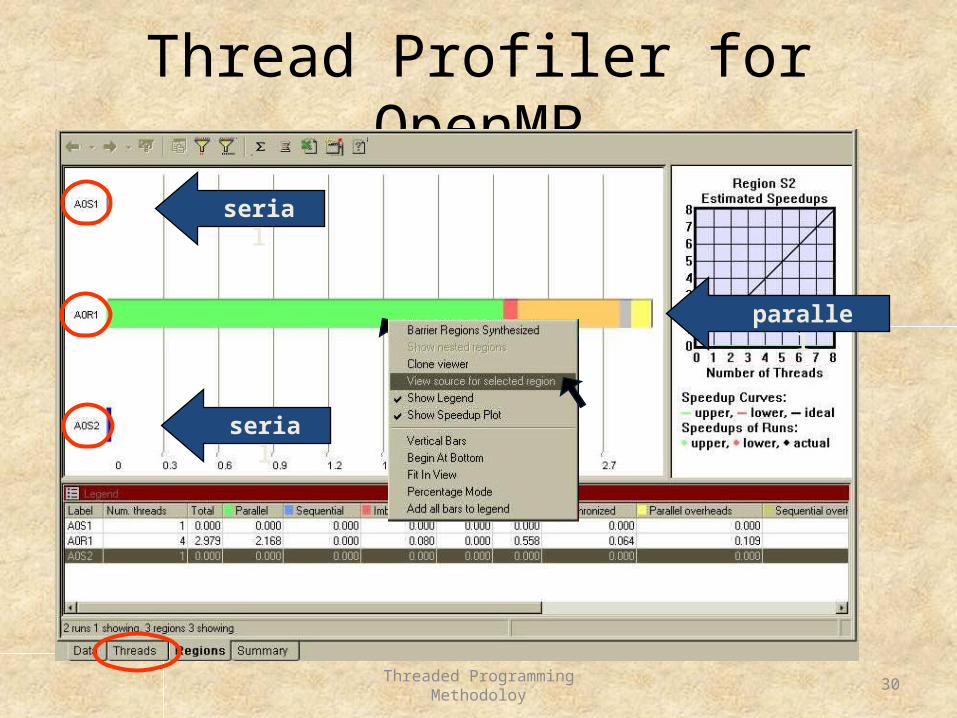
Thread Profiler for OpenMP
serial
serial
parallel
31
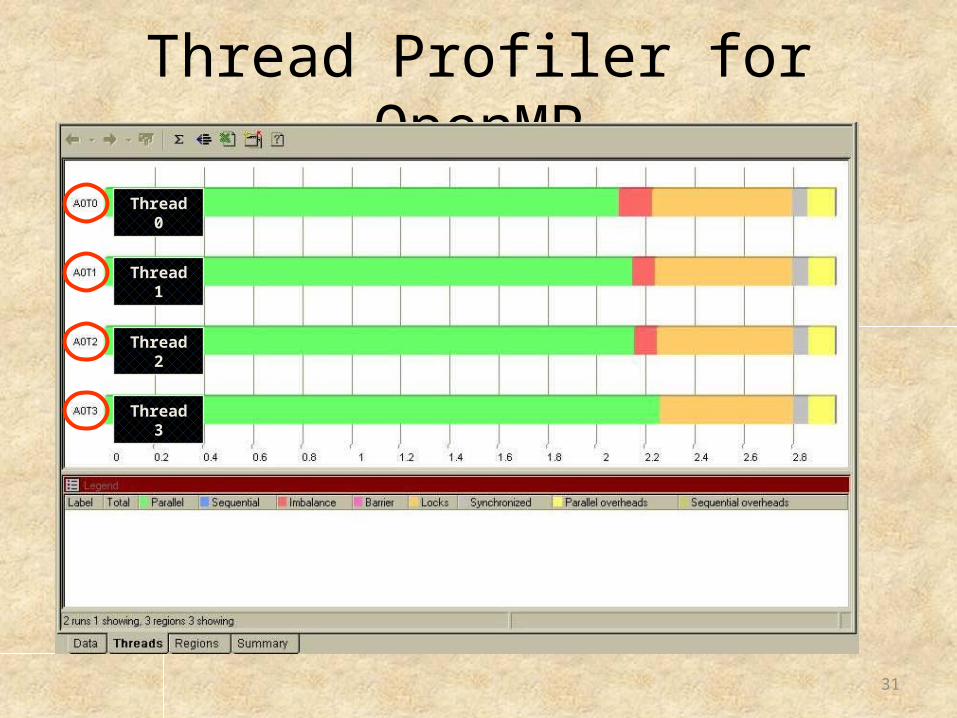
Thread Profiler for OpenMP
Thread 0
Thread 1
Thread 2
Thread 3
32
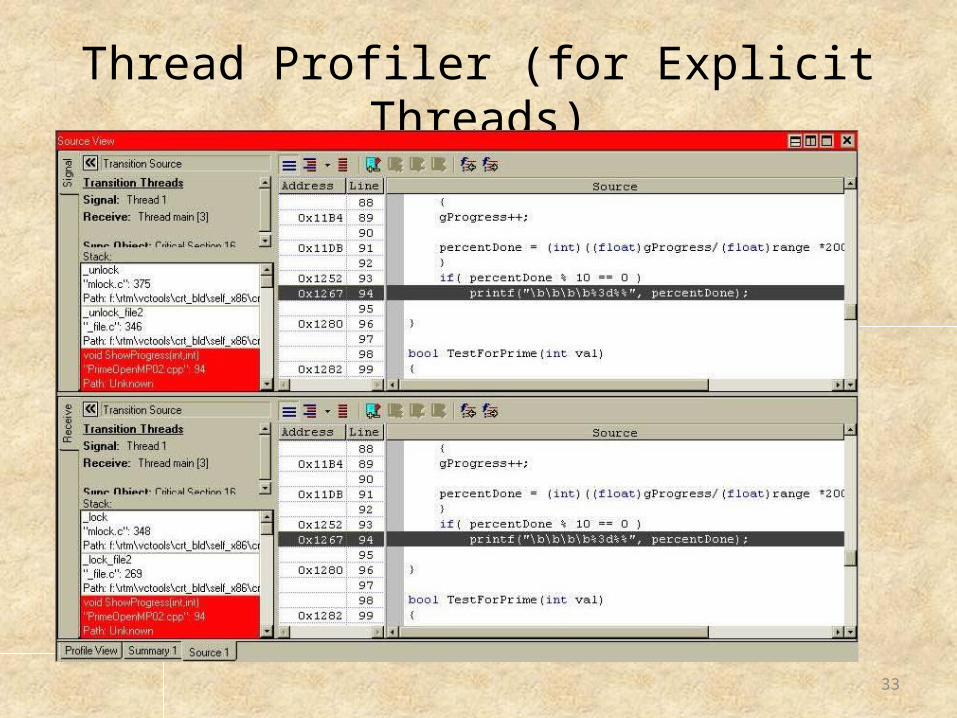
Thread Profiler (for Explicit Threads)
33
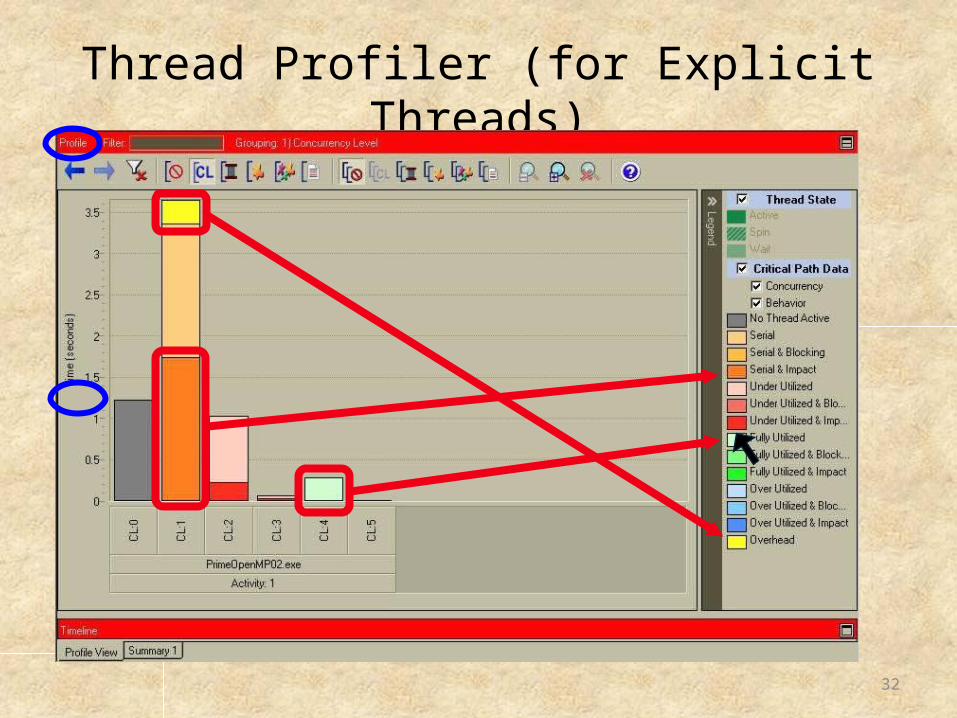
Thread Profiler (for Explicit Threads)
Why so many transitions?
34
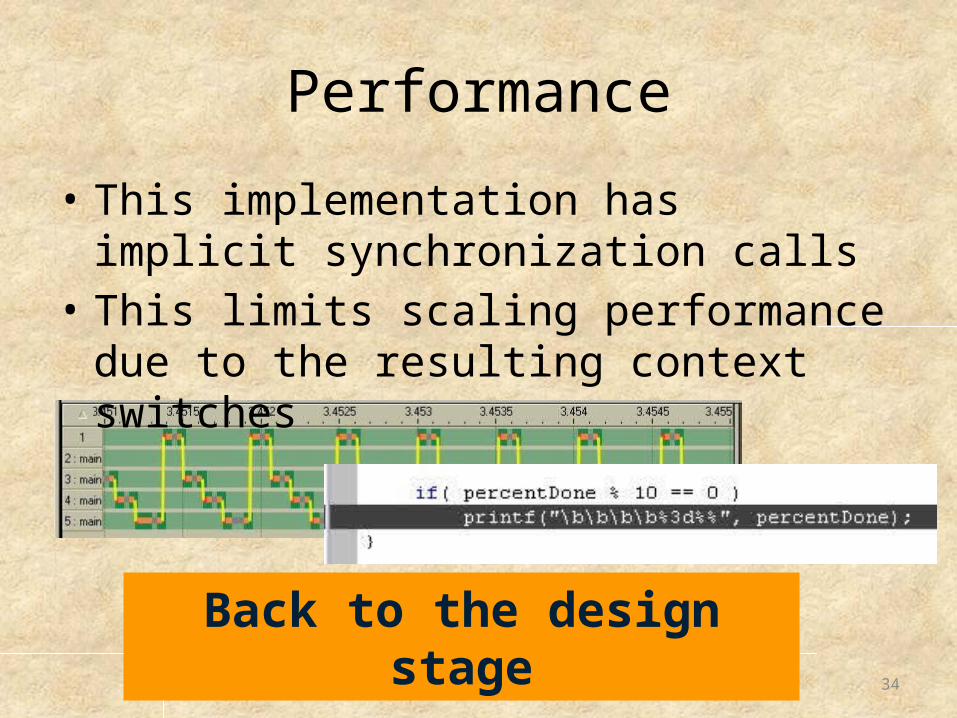
Performance
• This implementation has implicit synchronization calls
• This limits scaling performance due to the resulting context switches
Back to the design stage
35
Concepts to Consider
• Parallel Overhead• Synchronization Issues• Load Balance• Processing Granularity
36
Parallel Overhead
• Thread Creation overhead– Overhead increases rapidly as the number of
active threads increases• Solution
– Use of re-usable threads and thread pools• Amortizes the cost of thread creation • Keeps number of active threads relatively constant
37
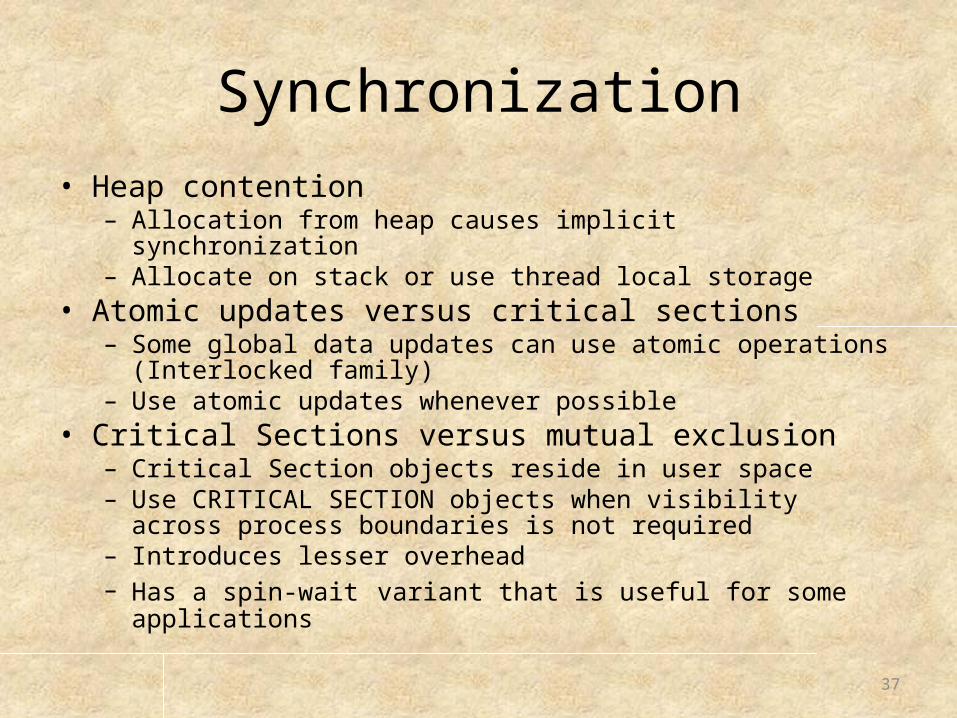
Synchronization• Heap contention
– Allocation from heap causes implicit synchronization– Allocate on stack or use thread local storage
• Atomic updates versus critical sections– Some global data updates can use atomic operations (Interlocked
family)– Use atomic updates whenever possible
• Critical Sections versus mutual exclusion– Critical Section objects reside in user space– Use CRITICAL SECTION objects when visibility across process
boundaries is not required– Introduces lesser overhead– Has a spin-wait variant that is useful for some applications
38
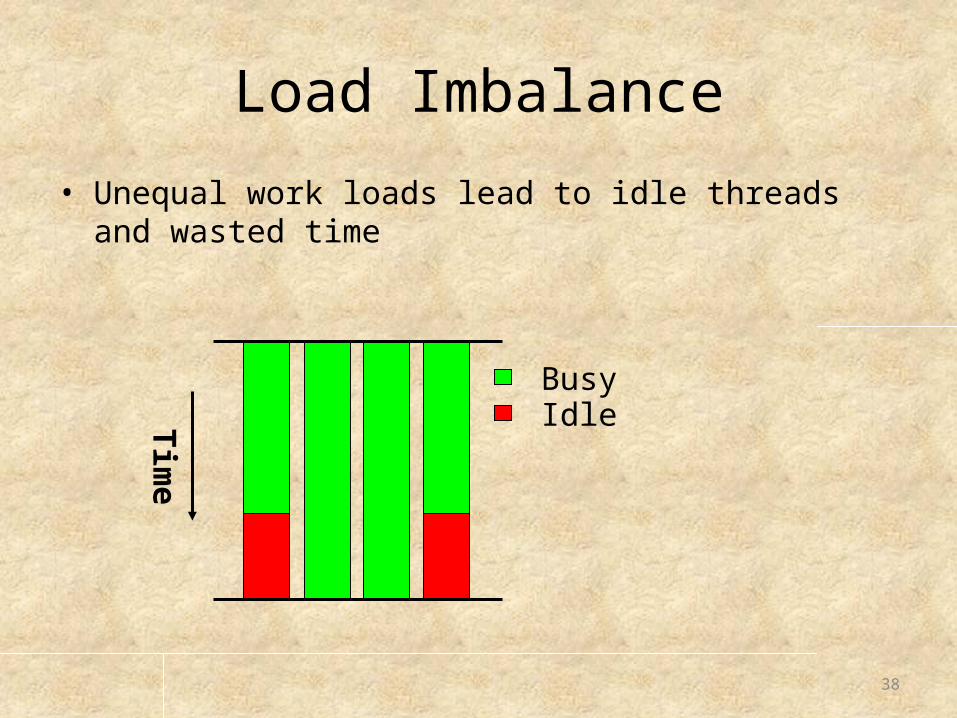
Load Imbalance
• Unequal work loads lead to idle threads and wasted time
Tim
e
Busy Idle
39
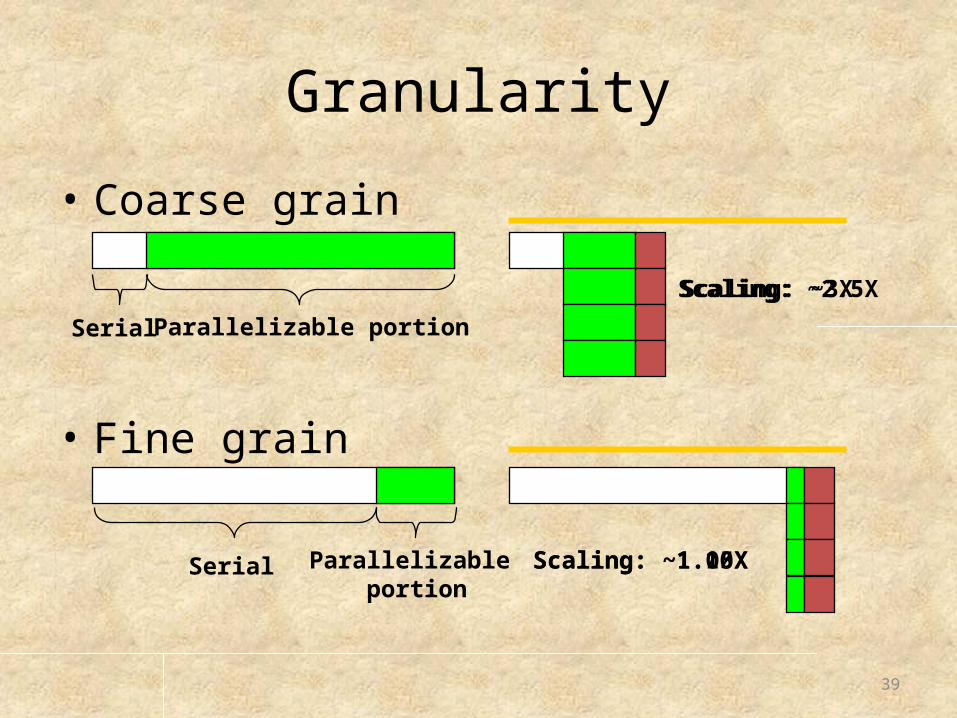
Granularity
• Coarse grain
• Fine grain
Parallelizable portionSerial
Parallelizable portion
Serial
Scaling: ~3X
Scaling: ~1.10X
Scaling: ~2.5X
Scaling: ~1.05X
40
Recap
• Four step development cycle for writing threaded code from serial and the Intel® tools that support each step– Analysis– Design (Introduce Threads)– Debug for correctness– Tune for performance
• Threading applications require multiple iterations of designing, debugging and performance tuning steps
• Use tools to improve productivity• This is an iterative process