Embed Size (px)
Citation preview
RSC Advances
PAPER
Ope
n A
cces
s A
rtic
le. P
ublis
hed
on 2
7 M
arch
201
9. D
ownl
oade
d on
11/
22/2
021
11:1
7:07
PM
. T
his
artic
le is
lice
nsed
und
er a
Cre
ativ
e C
omm
ons
Attr
ibut
ion-
Non
Com
mer
cial
3.0
Unp
orte
d L
icen
ce.
View Article OnlineView Journal | View Issue
Multi-color carb
aState Key Laboratory of Heavy Oil Processin
102249, China. E-mail: [email protected] of Energy, Beijing University of ChecChemical Engineering Department, Universi
70504, USAdDepartment of Orthopedics, General Hospi
Beijing 100853, China. E-mail: drxm301@1
† Electronic supplementary informa10.1039/c8ra09868a
Cite this: RSC Adv., 2019, 9, 9700
Received 1st December 2018Accepted 15th March 2019
DOI: 10.1039/c8ra09868a
rsc.li/rsc-advances
9700 | RSC Adv., 2019, 9, 9700–9708
on dots for white light-emittingdiodes†
Rigu Su,a Qingwen Guan,a Wei Cai,a Wenjing Yang,a Quan Xu, *a Yongjian Guo,b
Lipeng Zhang,b Ling Feic and Meng Xu*d
Heteroatom doped carbon dots (CDs) with color adjustable properties have attracted extensive attention.
The doping of elements can effectively tune the surface chemical properties of CDs, thus resulting in its
multi-functional applications such as in bio-imaging, photocatalysis, and photothermal conversion. The
facile preparation of single metal-doped CDs with color-tunable properties has been rarely reported yet.
Herein, we report a one-step solvothermal method to synthesize CDs with different fluorescent
emission varying from red to purple to blue. The luminescence characteristic of CDs can be tuned by
simply controlling the ratio of precursors, with the emission wavelength correspondingly adjusted from
610 nm to 390 nm. XPS investigation further demonstrated that the color variation is mainly due to the
doping of zinc, which will increase the degree of surface oxidation in the as-prepared CDs. For blue
emission CDs, the content of graphitic carbon gradually decreases with the rising of zinc chloride
addition, while oxygen content remains around 20%, compared with red emission CDs of which the
oxygen content is only 4.42%. We also demonstrated with theoretical simulations that the Zn dopant and
the functional groups including –C]O, –C–OH, –NH2, and pyrrolic N, play an important role in color
change. Furthermore, the synthesized CDs have been successfully used into the fabrication of white
LEDs. More than that, we produced a sensitive sensor from the prepared CDs for the effective detection
of a variety of colorless transparent organic solvents utilizing the robust fluorescence properties of CDs,
showing their great potential as fluorescent probes for chemical sensing.
Introduction
Carbon dots (CDs), as carbon materials, are uorescent nano-materials composed of carbon skeletons and surface functionalgroups with particle size less than 10 nm. They possess lowtoxicity,1 excellent optical and electrical properties,2,3 superiorphoto stability,4 high quantum yield (QY),5 exceptionalproductivity, and low cost,6 CDs have become a research hotspotfor a long lifetime. Their unique optical properties and robustwater solubility greatly expand their application elds, forinstance, ions and DNA detection, catalysis, solar cells, andphotothermal therapy.7–10 Since the rst discovery of CDs in2004, rapid development in synthetic methods has been seen inthe past fourteen years, which can be attributed to two majorcategories, “Top-down” and “Bottom-up” synthesis. The former
g, China University of Petroleum (Beijing),
mical Technology, Beijing, 102200, China
ty of Louisiana at Lafayette, Lafayette, LA
tal of Chinese People's Liberation Army,
63.com
tion (ESI) available. See DOI:
mainly includes methods like arc discharge,11 laser ablation12
and electrochemical etching,13 while the latter usually utilizesmicrowave,14 thermal combustion,15 template,16 and ultrasonic8
in the synthetic methods. Up to now, the quantum yield (QY) ofCDs can reach up to 94% for bright blue emission17 and 53% forred emission.5
However, efficient multicolor emissive CDs are still highlydesired. There are only a few reports on the synthesis ofmulticolor emissive CDs available. For example, Ding et al.prepared multicolor emissive CDs with PL QY up to 35% viahydrothermal reaction processes with water as solvent and p-phenylenediamine (PPD) as a precursor.18 Guo et al. produceda series of CDs by varying the functional precursors, andconcluded that variations in surface states and N contents werepredominantly responsible for the PL red shi.19 Zhu et al. havereported three types of CDs with blue, green, and red emissionby simply changing the reaction solvent and then successfullyfabricated light emitting diodes (WLEDs).20 Recently, Miao'sgroup synthesized multicolor CDs by modifying the thermalpyrolysis temperature and ratio of reactants, and ascribed thePL red shi to both the extent of graphitization and the amountof surface functional groups, –COOH.21 Despite these effort, thereported materials are still too expensive for practical applica-tions and lack of clear understanding of their luminescence
This journal is © The Royal Society of Chemistry 2019
Paper RSC Advances
Ope
n A
cces
s A
rtic
le. P
ublis
hed
on 2
7 M
arch
201
9. D
ownl
oade
d on
11/
22/2
021
11:1
7:07
PM
. T
his
artic
le is
lice
nsed
und
er a
Cre
ativ
e C
omm
ons
Attr
ibut
ion-
Non
Com
mer
cial
3.0
Unp
orte
d L
icen
ce.
View Article Online
mechanism. Therefore, simple and facile synthesis routes arestill highly desirable.
Herein, on the basis of predecessors'work,22 we reporta synthesis strategy to prepare multiple color emissive CDs bytuning the effective conjugation length and the surface func-tional groups. The CDs were synthesized through controllingthe molar ratios of PPD and ZnCl2 in ethanol solvent. Byadjusting the precursor molar ratios, the maximum emission ofthe resulted CDs gradually shis from red to blue light in thefollowing order: red, purplish red, purplish blue, and blue,respectively. In another word, controlling the extent of graphi-tization and the amount of surface function groups can tune theemission wavelength of CDs from 390 to 610 nm. The relativephotoluminescence quantum yields of the four CDs can reachup to 5.97%, 6.24%, 6.92%, and 19.81%, respectively. In short,we have prepared highly efficient multiple color emissive CDsfrom same precursors in a single step.23 We have also theoret-ically studied the reason why the synthesized four CDs samplesshow different PL emission by using the rst principle theorysimulation and Gaussian 09 package. We further fabricatedpure white LEDs with coherent infrared energy (CIE) colorcoordinate of (0.3301, 0.3367), correlated color temperature(CCT) of 5598 K and color rendering index (CRI) of 89 by usingthe prepared CDs. Moreover, we demonstrated that the CDs canbe dissolved in various polar organic solvents such as ethanol,dimethylformamide (DMF), dimethylsulfone (DMSO), dioxane,amine and so on and those can be used as robust bioprobes inenvironmental and biomedicine applications.
Results and discussion
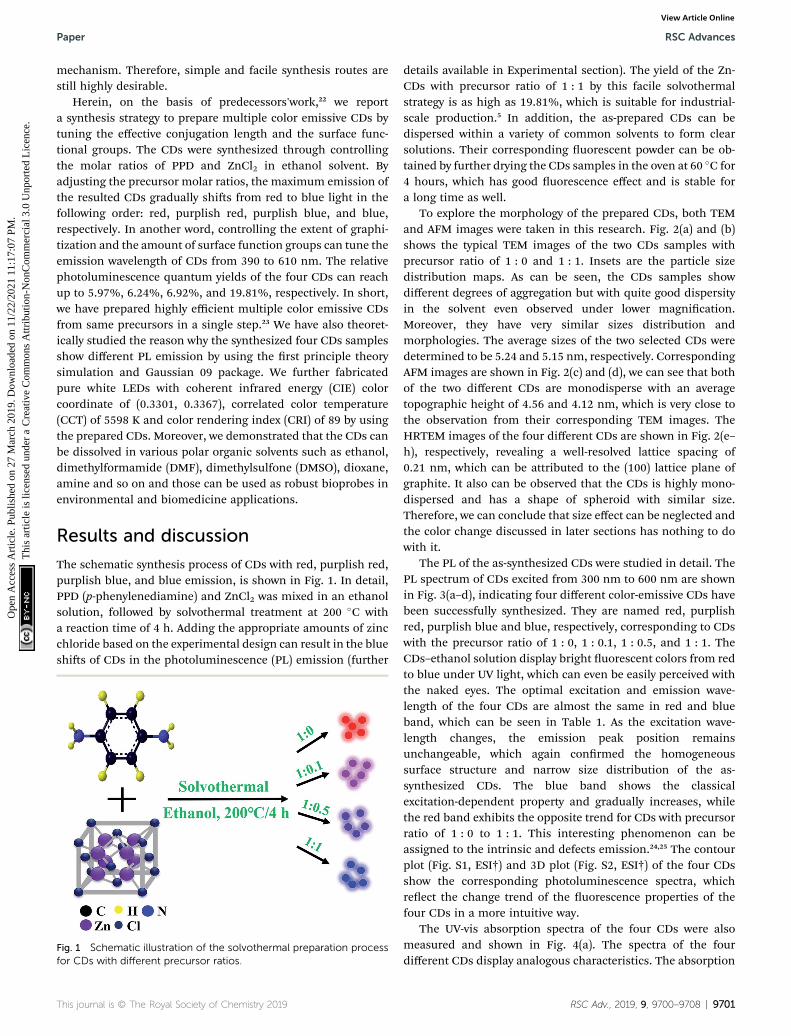
The schematic synthesis process of CDs with red, purplish red,purplish blue, and blue emission, is shown in Fig. 1. In detail,PPD (p-phenylenediamine) and ZnCl2 was mixed in an ethanolsolution, followed by solvothermal treatment at 200 �C witha reaction time of 4 h. Adding the appropriate amounts of zincchloride based on the experimental design can result in the blueshis of CDs in the photoluminescence (PL) emission (further
Fig. 1 Schematic illustration of the solvothermal preparation processfor CDs with different precursor ratios.
This journal is © The Royal Society of Chemistry 2019
details available in Experimental section). The yield of the Zn-CDs with precursor ratio of 1 : 1 by this facile solvothermalstrategy is as high as 19.81%, which is suitable for industrial-scale production.5 In addition, the as-prepared CDs can bedispersed within a variety of common solvents to form clearsolutions. Their corresponding uorescent powder can be ob-tained by further drying the CDs samples in the oven at 60 �C for4 hours, which has good uorescence effect and is stable fora long time as well.
To explore the morphology of the prepared CDs, both TEMand AFM images were taken in this research. Fig. 2(a) and (b)shows the typical TEM images of the two CDs samples withprecursor ratio of 1 : 0 and 1 : 1. Insets are the particle sizedistribution maps. As can be seen, the CDs samples showdifferent degrees of aggregation but with quite good dispersityin the solvent even observed under lower magnication.Moreover, they have very similar sizes distribution andmorphologies. The average sizes of the two selected CDs weredetermined to be 5.24 and 5.15 nm, respectively. CorrespondingAFM images are shown in Fig. 2(c) and (d), we can see that bothof the two different CDs are monodisperse with an averagetopographic height of 4.56 and 4.12 nm, which is very close tothe observation from their corresponding TEM images. TheHRTEM images of the four different CDs are shown in Fig. 2(e–h), respectively, revealing a well-resolved lattice spacing of0.21 nm, which can be attributed to the (100) lattice plane ofgraphite. It also can be observed that the CDs is highly mono-dispersed and has a shape of spheroid with similar size.Therefore, we can conclude that size effect can be neglected andthe color change discussed in later sections has nothing to dowith it.
The PL of the as-synthesized CDs were studied in detail. ThePL spectrum of CDs excited from 300 nm to 600 nm are shownin Fig. 3(a–d), indicating four different color-emissive CDs havebeen successfully synthesized. They are named red, purplishred, purplish blue and blue, respectively, corresponding to CDswith the precursor ratio of 1 : 0, 1 : 0.1, 1 : 0.5, and 1 : 1. TheCDs–ethanol solution display bright uorescent colors from redto blue under UV light, which can even be easily perceived withthe naked eyes. The optimal excitation and emission wave-length of the four CDs are almost the same in red and blueband, which can be seen in Table 1. As the excitation wave-length changes, the emission peak position remainsunchangeable, which again conrmed the homogeneoussurface structure and narrow size distribution of the as-synthesized CDs. The blue band shows the classicalexcitation-dependent property and gradually increases, whilethe red band exhibits the opposite trend for CDs with precursorratio of 1 : 0 to 1 : 1. This interesting phenomenon can beassigned to the intrinsic and defects emission.24,25 The contourplot (Fig. S1, ESI†) and 3D plot (Fig. S2, ESI†) of the four CDsshow the corresponding photoluminescence spectra, whichreect the change trend of the uorescence properties of thefour CDs in a more intuitive way.
The UV-vis absorption spectra of the four CDs were alsomeasured and shown in Fig. 4(a). The spectra of the fourdifferent CDs display analogous characteristics. The absorption
RSC Adv., 2019, 9, 9700–9708 | 9701
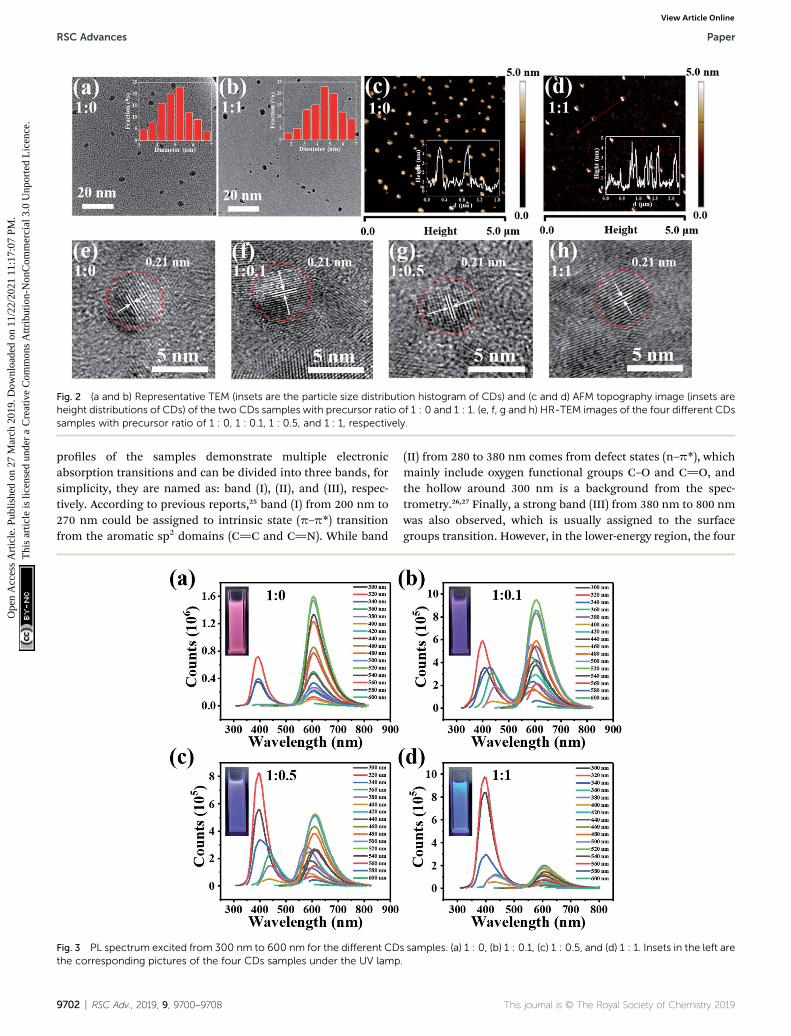
Fig. 2 (a and b) Representative TEM (insets are the particle size distribution histogram of CDs) and (c and d) AFM topography image (insets areheight distributions of CDs) of the two CDs samples with precursor ratio of 1 : 0 and 1 : 1. (e, f, g and h) HR-TEM images of the four different CDssamples with precursor ratio of 1 : 0, 1 : 0.1, 1 : 0.5, and 1 : 1, respectively.
RSC Advances Paper
Ope
n A
cces
s A
rtic
le. P
ublis
hed
on 2
7 M
arch
201
9. D
ownl
oade
d on
11/
22/2
021
11:1
7:07
PM
. T
his
artic
le is
lice
nsed
und
er a
Cre
ativ
e C
omm
ons
Attr
ibut
ion-
Non
Com
mer
cial
3.0
Unp
orte
d L
icen
ce.
View Article Online
proles of the samples demonstrate multiple electronicabsorption transitions and can be divided into three bands, forsimplicity, they are named as: band (I), (II), and (III), respec-tively. According to previous reports,25 band (I) from 200 nm to270 nm could be assigned to intrinsic state (p–p*) transitionfrom the aromatic sp2 domains (C]C and C]N). While band
Fig. 3 PL spectrum excited from 300 nm to 600 nm for the different CDthe corresponding pictures of the four CDs samples under the UV lamp
9702 | RSC Adv., 2019, 9, 9700–9708
(II) from 280 to 380 nm comes from defect states (n–p*), whichmainly include oxygen functional groups C–O and C]O, andthe hollow around 300 nm is a background from the spec-trometry.26,27 Finally, a strong band (III) from 380 nm to 800 nmwas also observed, which is usually assigned to the surfacegroups transition. However, in the lower-energy region, the four
s samples. (a) 1 : 0, (b) 1 : 0.1, (c) 1 : 0.5, and (d) 1 : 1. Insets in the left are.
This journal is © The Royal Society of Chemistry 2019

Table 1 The obtained PL parameters of four different CDs sampleswith precursor ratio of 1 : 0, 1 : 0.1, 1 : 0.5, and 1 : 1
Sample
Ex (nm) Em (nm)
QY (%)Lifetime(ns)B band R band B band R band
1 : 0 320 520 390 610 5.97 9.1841 : 0.1 320 520 390 610 6.24 9.0011 : 0.5 320 520 390 610 6.92 8.9981 : 1 360 520 450 610 19.81 8.154
Paper RSC Advances
Ope
n A
cces
s A
rtic
le. P
ublis
hed
on 2
7 M
arch
201
9. D
ownl
oade
d on
11/
22/2
021
11:1
7:07
PM
. T
his
artic
le is
lice
nsed
und
er a
Cre
ativ
e C
omm
ons
Attr
ibut
ion-
Non
Com
mer
cial
3.0
Unp
orte
d L
icen
ce.
View Article Online
spectra exhibit similar absorption bands at 250, 300, 420, and530 nm, indicating that these samples possessed similarsurface states. Furthermore, as shown in Fig. 4(b), the two mainphotoluminescent excitation (PLE) bands around 240 nm and320 nm match well with the absorption band (I) and band (II),indicating that the blue band is from a combination of intrinsic(sp2 graphite structures) and defects transitions (sp3 matrix).28
The red band demonstrates excitation-independent emissionproperties. From the corresponding PLE spectra (Fig. 4(c)), itcan be seen that the three bands correspond to the absorptionbands (I), (II), and (III), respectively.
The uorescent lifetime decay for the four CDs solutions andtheir corresponding solid samples aer drying were alsomeasured and shown in Fig. 4(d) and (e). The lifetime differenceof the four CDs is not large, especially for their uorescentpowder. This again veries that the four different CDs havesimilar size. Specically, the lifetime of our CDs diluted 100
Fig. 4 (a) Absorption spectra for the four different CDs samples withluminescent excitation (PLE) spectra for (b) blue and (c) red bands for CDsCDs phosphor from the four different CDs samples of precursor ratio of 1ratios of phenylenediamine and zinc chloride.
This journal is © The Royal Society of Chemistry 2019
times in 99.7% ethanol at room temperature is 9.184, 9.001,8.998, and 8.154 ns, respectively. Meanwhile, the lifetime of CDsphosphors is 3.195, 3.079, 2.876, and 2.510 ns, respectively.According to previous reports, this may be due to solvent effectbetween CDs and ethanol.29,30
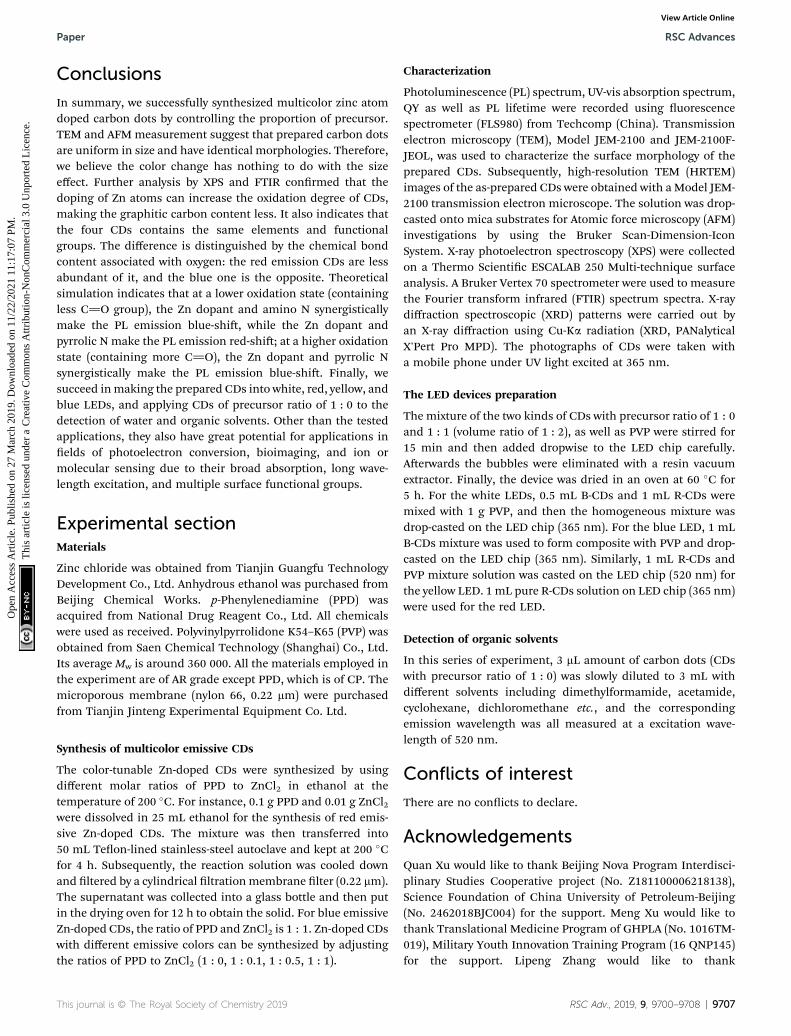
To know more details about the surface chemistry, the CDsare further analyzed with XPS. The elemental content analysis inTable S1 (ESI†) demonstrates that all four CDs have the sameelemental composition (i.e. C, N and O). Their deconvolutedspectra also indicate that they contain the same chemicalbonds. Though Zn2p spectra (Fig. 4(f)) generated only a weaksignal in XPS, the Zn LMM spectrum (Fig. 5(a)) provided veryuseful information on the chemical environment of Zn. As theprecursor ratio increased, the Zn LMM peak was shied toa higher binding energy, indicating the higher oxidation state ofZn.31 Through careful examination of XPS survey spectra(Fig. 5(b)) and the characterization data (Table S1, ESI†), onlythe oxygen (4.42%, 21.66%, 19.59% and 16.29% for the fourCDs, respectively) and nitrogen content (19.23%, 1.58%, 5.62%and 10.01% for the four CDs, respectively) of the four differentCDs were found to be distinctly different. These variations arebelieved, at least partly, to be responsible for the different PLcharacteristics of the four CDs, but more in-depth studies arestill required to address this issue. TEM images of variouscarbon dots samples were measured, but there is no obviousrelationship between the carbon dots particle size and theiruorescence. Although there are reports of uorescencechanges caused by nanoparticles' size, obviously, it is not the
precursor ratio of 1 : 0, 1 : 0.1, 1 : 0.5, and 1 : 1, respectively. Photo-of different precursor ratio. PL decay spectra of (d) CDs solution and (e): 0, 1 : 0.1, 1 : 0.5, and 1 : 1. (f) Zn2p analysis of the CDs at differentmass
RSC Adv., 2019, 9, 9700–9708 | 9703
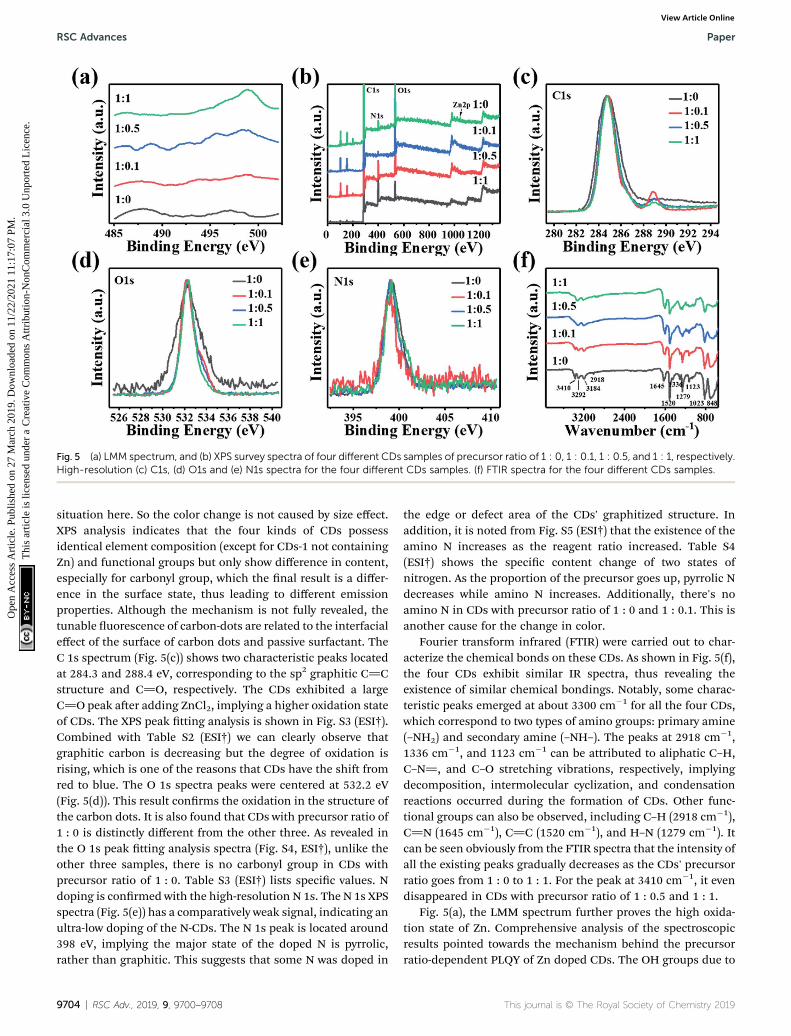
Fig. 5 (a) LMM spectrum, and (b) XPS survey spectra of four different CDs samples of precursor ratio of 1 : 0, 1 : 0.1, 1 : 0.5, and 1 : 1, respectively.High-resolution (c) C1s, (d) O1s and (e) N1s spectra for the four different CDs samples. (f) FTIR spectra for the four different CDs samples.
RSC Advances Paper
Ope
n A
cces
s A
rtic
le. P
ublis
hed
on 2
7 M
arch
201
9. D
ownl
oade
d on
11/
22/2
021
11:1
7:07
PM
. T
his
artic
le is
lice
nsed
und
er a
Cre
ativ
e C
omm
ons
Attr
ibut
ion-
Non
Com
mer
cial
3.0
Unp
orte
d L
icen
ce.
View Article Online
situation here. So the color change is not caused by size effect.XPS analysis indicates that the four kinds of CDs possessidentical element composition (except for CDs-1 not containingZn) and functional groups but only show difference in content,especially for carbonyl group, which the nal result is a differ-ence in the surface state, thus leading to different emissionproperties. Although the mechanism is not fully revealed, thetunable uorescence of carbon-dots are related to the interfacialeffect of the surface of carbon dots and passive surfactant. TheC 1s spectrum (Fig. 5(c)) shows two characteristic peaks locatedat 284.3 and 288.4 eV, corresponding to the sp2 graphitic C]Cstructure and C]O, respectively. The CDs exhibited a largeC]O peak aer adding ZnCl2, implying a higher oxidation stateof CDs. The XPS peak tting analysis is shown in Fig. S3 (ESI†).Combined with Table S2 (ESI†) we can clearly observe thatgraphitic carbon is decreasing but the degree of oxidation isrising, which is one of the reasons that CDs have the shi fromred to blue. The O 1s spectra peaks were centered at 532.2 eV(Fig. 5(d)). This result conrms the oxidation in the structure ofthe carbon dots. It is also found that CDs with precursor ratio of1 : 0 is distinctly different from the other three. As revealed inthe O 1s peak tting analysis spectra (Fig. S4, ESI†), unlike theother three samples, there is no carbonyl group in CDs withprecursor ratio of 1 : 0. Table S3 (ESI†) lists specic values. Ndoping is conrmed with the high-resolution N 1s. The N 1s XPSspectra (Fig. 5(e)) has a comparatively weak signal, indicating anultra-low doping of the N-CDs. The N 1s peak is located around398 eV, implying the major state of the doped N is pyrrolic,rather than graphitic. This suggests that some N was doped in
9704 | RSC Adv., 2019, 9, 9700–9708
the edge or defect area of the CDs' graphitized structure. Inaddition, it is noted from Fig. S5 (ESI†) that the existence of theamino N increases as the reagent ratio increased. Table S4(ESI†) shows the specic content change of two states ofnitrogen. As the proportion of the precursor goes up, pyrrolic Ndecreases while amino N increases. Additionally, there's noamino N in CDs with precursor ratio of 1 : 0 and 1 : 0.1. This isanother cause for the change in color.
Fourier transform infrared (FTIR) were carried out to char-acterize the chemical bonds on these CDs. As shown in Fig. 5(f),the four CDs exhibit similar IR spectra, thus revealing theexistence of similar chemical bondings. Notably, some charac-teristic peaks emerged at about 3300 cm�1 for all the four CDs,which correspond to two types of amino groups: primary amine(–NH2) and secondary amine (–NH–). The peaks at 2918 cm�1,1336 cm�1, and 1123 cm�1 can be attributed to aliphatic C–H,C–N], and C–O stretching vibrations, respectively, implyingdecomposition, intermolecular cyclization, and condensationreactions occurred during the formation of CDs. Other func-tional groups can also be observed, including C–H (2918 cm�1),C]N (1645 cm�1), C]C (1520 cm�1), and H–N (1279 cm�1). Itcan be seen obviously from the FTIR spectra that the intensity ofall the existing peaks gradually decreases as the CDs' precursorratio goes from 1 : 0 to 1 : 1. For the peak at 3410 cm�1, it evendisappeared in CDs with precursor ratio of 1 : 0.5 and 1 : 1.
Fig. 5(a), the LMM spectrum further proves the high oxida-tion state of Zn. Comprehensive analysis of the spectroscopicresults pointed towards the mechanism behind the precursorratio-dependent PLQY of Zn doped CDs. The OH groups due to
This journal is © The Royal Society of Chemistry 2019

Paper RSC Advances
Ope
n A
cces
s A
rtic
le. P
ublis
hed
on 2
7 M
arch
201
9. D
ownl
oade
d on
11/
22/2
021
11:1
7:07
PM
. T
his
artic
le is
lice
nsed
und
er a
Cre
ativ
e C
omm
ons
Attr
ibut
ion-
Non
Com
mer
cial
3.0
Unp
orte
d L
icen
ce.
View Article Online
their electron accepting nature can behave as a centre foruorescence quenching.32 During primary stage, as more Znwas added to the reaction mixture, the inbound Zn will reactwith the OH groups reducing them (indicated by the decrease inthe intensity of OH bending vibration in the IR spectrum) witha concomitant oxidation of Zn (as evidenced by the increase inthe oxidation state of Zn in the LMM spectra). Hence, it can beconcluded that during primary stage, Zn acts as a reducingagent for the OH group. However, in the latter stages, when theconcentration of Zn becomes higher, in addition to reducingOH groups, the excess Zn can also react with C]O on the CD'ssurface. This reaction results in the reduction of C]O content.It is well established that C]O is an important passivationresource for CDs and the presence of C]O is critical for thePLQY. This understandably leads to the reduction of PLQY. It isalso reported that external addition of Zn2+ can quench theuorescence of carbon dots via a similar mechanism as theobserved lower PLQY in CDs with a high Zn2+ content.33
In order to study the mechanism and the reason why thesynthesized four CDs samples show different PL emission, weexplored how the Zn dopant and the functional groupsincluding –C]O, –C–OH, –NH2, and pyrrolic N on CDs affectthe PL emission spectrum by the rst principle theory simula-tion. All calculations were carried out using the Gaussian 09package.34 The ground state (S0) geometries of different CDs,which are listed in Tables S5 and S6 (ESI†), were optimized bythe density functional theory (DFT) B3LYP (Becke's three-parameter hybrid function with the non-local correlation ofLee–Yang–Parr) method.35 We choose the basis set as the
Fig. 6 (a–f) Density of state and HOMO–LUMO energy gap for differen
This journal is © The Royal Society of Chemistry 2019
B3LYP/6-31G(d). The HOMO–LUMO energy gap of these CDswas calculated to explain how the Zn dopant and the radicalsaffect the PL emission spectrum.
In our CDs models, Zn heteroatom, pyrrolic N, –NH2, C]O,C–OH have all been taken into consideration. Based on theHOMO–LUMO energy gap of CDs in Table S5 (ESI†), it can beobserved that sole pyrrolic N has the blue-shi effect on the PLemission of the CDs, sole –NH2 has the red-shi effect, soleC]O shows blue-shi effect, and sole –OH shows the red-shieffect.36 However, as simultaneously considering the effect ofseveral functional groups, it is too complicated and too hard tosay how a certain functional group affect the PL emission. Forexample, by comparing the HOMO–LUMO energy gap of CDsmodels a and d in Table S6 (ESI†), we can obtain that as thenumber of Zn dopants increase, the HOMO–LUMO energy gapincreases (shown as Fig. 6(a) and (d)), corresponding to theobservation that the PL emission spectrum gets blue-shi.However, by comparing the CDs models b and c in Table S6(ESI†), we easily can nd that the HOMO–LUMO energy gap ofthe former one is larger, in which the doping of Zn atoms wasconsidered. The above results show that the Zn doping displaysa red-shi effect on the PL emission. Here, we should also payattention to the fact that the state of N on the two CDs models isalso different in addition to the difference of Zn doping effectobserved between the a and c models (or b and d models). Thepyrrolic N on b CDs model was switched to the amino N ond CDs model. Based on the analysis above, we can obtain thatthe effect of Zn doping leading to either red-shi or blue-shiPL is depended on the functional groups on the CDs, which
t CDs models.
RSC Adv., 2019, 9, 9700–9708 | 9705

RSC Advances Paper
Ope
n A
cces
s A
rtic
le. P
ublis
hed
on 2
7 M
arch
201
9. D
ownl
oade
d on
11/
22/2
021
11:1
7:07
PM
. T
his
artic
le is
lice
nsed
und
er a
Cre
ativ
e C
omm
ons
Attr
ibut
ion-
Non
Com
mer
cial
3.0
Unp
orte
d L
icen
ce.
View Article Online
was demonstrated by comparing the HOMO–LUMO energy gapof different CDs models. In summary, among the CDs modelswe built, if the CDs show a lower oxidation state (containing lessC]O group), the Zn dopant and amino N synergistically makethe PL emission blue-shi (shown as model d in Table S6 (ESI†)and Fig. 6(d)), while the Zn dopant and pyrrolic N make the PLemission red-shi (shown as model c in Table S6 (ESI†) andFig. 6(c)); if the CDs show a higher oxidation state (containingmore C]O), the doped Zn and pyrrolic N synergistically makethe PL emission blue-shi (shown as model f in Table S6 (ESI†)and Fig. 6(f)).
To fabricate the white LEDs, the two kinds of CDs withprecursor ratio of 1 : 0 and 1 : 1 were mixed together into PVPwith the volume ratio of 1 : 2. Then 5 mL of ethanol were addedinto the mixture. In the following step, the solution were drop-casted on the LED chip for the encapsulation of chip. By varyingthe volume ratios of two CDs, the emission spectra of whiteLEDs can be tuned to pure white light with optimize volumeratio of CDs in PVP composite which is 1 : 2. The coherentinfrared energy (CIE) color coordinate of white LEDs is (0.3301,0.3367) in white light region (Fig. 7(a)), which is closer to naturalwhite light than previously reported WLEDs produced by theCDs.37,38 The correlated color temperature (CCT) and colorrendering index (CRI) of the white LEDs are 5606 K and 89,respectively. The emitting light spectrum shown in Fig. 7(b)covers most of the visible-light from 400 to 670 nm, suggestingthat the prepared CDs have great potential for white lightingapplication. There is no photo bleach for CDs based white LEDdevices. In addition, we also succeeded in producing red,yellow, blue, and white LEDs (Fig. 7(c)), which conrms the
Fig. 7 Characterization of white LEDs fabricated using the prepared CDwhite LEDs. (c) The photographs of white and the monochrome red, ye
9706 | RSC Adv., 2019, 9, 9700–9708
possibility of the CDs as potential phosphors for LEDs. Theabove data proves that the zinc doping method be a promisingimprovement for optoelectronic components. Particularly, theblue-shi effect of synthesized CDs will serve as a novel uo-rescent nanomaterial that would lay a foundation for futureenrichment in the optoelectronics eld. Compared with otherLEDs, it has the advantages of simple operation, low toxicity,simple preparation, long life and good uorescence effect.Therefore, the as-prepared warm white-light emissive lmshows promising potential for the lighting application.
Furthermore, we also use the prepared CDs for the detectionof organic solvents. In this study, the synthesized-CDs weredissolved in a variety of colorless transparent organic solvents.Due to different solvent interaction strength, CDs uorescenceintensity is weakened to different degrees, which providesa strong theoretical basis for detecting different solvents. Here,uorescence spectra of CDs with precursor ratio of 1 : 0 weremeasured by adding water and twelve other organic solvents(including ethyl acetate, ethanol, petroleum ether, acetone etc.),as shown in Fig. S6 (ESI†). From the image, we can see uo-rescence intensity is extremely low in water and formamide,suggesting they can quench the uorescence of the preparedCDs. It also gradually decreases in polyethylene glycol, cyclo-hexane, ethanol, and methanol. Moreover, there is obviousredshi in acetone, ethyl acetate, toluene and petroleum ether.With the above-mentioned phenomena, these solvents can beidentied easily. Therefore, a uorescence-based sensingmethod can be employed for the detection of a variety ofsolvents with good sensitivity, fast response, high selectivity,and ease of operation.
s. (a) The CIE color coordinate, and (b) the emitting light spectrum ofllow and blue LED devices by coating CDs/PVP on the different chips.
This journal is © The Royal Society of Chemistry 2019
Paper RSC Advances
Ope
n A
cces
s A
rtic
le. P
ublis
hed
on 2
7 M
arch
201
9. D
ownl
oade
d on
11/
22/2
021
11:1
7:07
PM
. T
his
artic
le is
lice
nsed
und
er a
Cre
ativ
e C
omm
ons
Attr
ibut
ion-
Non
Com
mer
cial
3.0
Unp
orte
d L
icen
ce.
View Article Online
Conclusions
In summary, we successfully synthesized multicolor zinc atomdoped carbon dots by controlling the proportion of precursor.TEM and AFMmeasurement suggest that prepared carbon dotsare uniform in size and have identical morphologies. Therefore,we believe the color change has nothing to do with the sizeeffect. Further analysis by XPS and FTIR conrmed that thedoping of Zn atoms can increase the oxidation degree of CDs,making the graphitic carbon content less. It also indicates thatthe four CDs contains the same elements and functionalgroups. The difference is distinguished by the chemical bondcontent associated with oxygen: the red emission CDs are lessabundant of it, and the blue one is the opposite. Theoreticalsimulation indicates that at a lower oxidation state (containingless C]O group), the Zn dopant and amino N synergisticallymake the PL emission blue-shi, while the Zn dopant andpyrrolic N make the PL emission red-shi; at a higher oxidationstate (containing more C]O), the Zn dopant and pyrrolic Nsynergistically make the PL emission blue-shi. Finally, wesucceed inmaking the prepared CDs into white, red, yellow, andblue LEDs, and applying CDs of precursor ratio of 1 : 0 to thedetection of water and organic solvents. Other than the testedapplications, they also have great potential for applications inelds of photoelectron conversion, bioimaging, and ion ormolecular sensing due to their broad absorption, long wave-length excitation, and multiple surface functional groups.
Experimental sectionMaterials
Zinc chloride was obtained from Tianjin Guangfu TechnologyDevelopment Co., Ltd. Anhydrous ethanol was purchased fromBeijing Chemical Works. p-Phenylenediamine (PPD) wasacquired from National Drug Reagent Co., Ltd. All chemicalswere used as received. Polyvinylpyrrolidone K54–K65 (PVP) wasobtained from Saen Chemical Technology (Shanghai) Co., Ltd.Its average Mw is around 360 000. All the materials employed inthe experiment are of AR grade except PPD, which is of CP. Themicroporous membrane (nylon 66, 0.22 mm) were purchasedfrom Tianjin Jinteng Experimental Equipment Co. Ltd.
Synthesis of multicolor emissive CDs
The color-tunable Zn-doped CDs were synthesized by usingdifferent molar ratios of PPD to ZnCl2 in ethanol at thetemperature of 200 �C. For instance, 0.1 g PPD and 0.01 g ZnCl2were dissolved in 25 mL ethanol for the synthesis of red emis-sive Zn-doped CDs. The mixture was then transferred into50 mL Teon-lined stainless-steel autoclave and kept at 200 �Cfor 4 h. Subsequently, the reaction solution was cooled downand ltered by a cylindrical ltrationmembrane lter (0.22 mm).The supernatant was collected into a glass bottle and then putin the drying oven for 12 h to obtain the solid. For blue emissiveZn-doped CDs, the ratio of PPD and ZnCl2 is 1 : 1. Zn-doped CDswith different emissive colors can be synthesized by adjustingthe ratios of PPD to ZnCl2 (1 : 0, 1 : 0.1, 1 : 0.5, 1 : 1).
This journal is © The Royal Society of Chemistry 2019
Characterization
Photoluminescence (PL) spectrum, UV-vis absorption spectrum,QY as well as PL lifetime were recorded using uorescencespectrometer (FLS980) from Techcomp (China). Transmissionelectron microscopy (TEM), Model JEM-2100 and JEM-2100F-JEOL, was used to characterize the surface morphology of theprepared CDs. Subsequently, high-resolution TEM (HRTEM)images of the as-prepared CDs were obtained with a Model JEM-2100 transmission electron microscope. The solution was drop-casted onto mica substrates for Atomic force microscopy (AFM)investigations by using the Bruker Scan-Dimension-IconSystem. X-ray photoelectron spectroscopy (XPS) were collectedon a Thermo Scientic ESCALAB 250 Multi-technique surfaceanalysis. A Bruker Vertex 70 spectrometer were used to measurethe Fourier transform infrared (FTIR) spectrum spectra. X-raydiffraction spectroscopic (XRD) patterns were carried out byan X-ray diffraction using Cu-Ka radiation (XRD, PANalyticalX'Pert Pro MPD). The photographs of CDs were taken witha mobile phone under UV light excited at 365 nm.
The LED devices preparation
The mixture of the two kinds of CDs with precursor ratio of 1 : 0and 1 : 1 (volume ratio of 1 : 2), as well as PVP were stirred for15 min and then added dropwise to the LED chip carefully.Aerwards the bubbles were eliminated with a resin vacuumextractor. Finally, the device was dried in an oven at 60 �C for5 h. For the white LEDs, 0.5 mL B-CDs and 1 mL R-CDs weremixed with 1 g PVP, and then the homogeneous mixture wasdrop-casted on the LED chip (365 nm). For the blue LED, 1 mLB-CDs mixture was used to form composite with PVP and drop-casted on the LED chip (365 nm). Similarly, 1 mL R-CDs andPVP mixture solution was casted on the LED chip (520 nm) forthe yellow LED. 1 mL pure R-CDs solution on LED chip (365 nm)were used for the red LED.
Detection of organic solvents
In this series of experiment, 3 mL amount of carbon dots (CDswith precursor ratio of 1 : 0) was slowly diluted to 3 mL withdifferent solvents including dimethylformamide, acetamide,cyclohexane, dichloromethane etc., and the correspondingemission wavelength was all measured at a excitation wave-length of 520 nm.
Conflicts of interest
There are no conicts to declare.
Acknowledgements
Quan Xu would like to thank Beijing Nova Program Interdisci-plinary Studies Cooperative project (No. Z181100006218138),Science Foundation of China University of Petroleum-Beijing(No. 2462018BJC004) for the support. Meng Xu would like tothank Translational Medicine Program of GHPLA (No. 1016TM-019), Military Youth Innovation Training Program (16 QNP145)for the support. Lipeng Zhang would like to thank
RSC Adv., 2019, 9, 9700–9708 | 9707
RSC Advances Paper
Ope
n A
cces
s A
rtic
le. P
ublis
hed
on 2
7 M
arch
201
9. D
ownl
oade
d on
11/
22/2
021
11:1
7:07
PM
. T
his
artic
le is
lice
nsed
und
er a
Cre
ativ
e C
omm
ons
Attr
ibut
ion-
Non
Com
mer
cial
3.0
Unp
orte
d L
icen
ce.
View Article Online
Distinguished Scientist Program at BUCT (buctylkxj02) for thesupport.
Notes and references
1 J. Zhang, Y. Yuan, G. Liang and S. H. Yu, Adv. Sci., 2015, 2,1500002.
2 X. Zhang, Y. Zhang and Y. Wang, ACS Nano, 2013, 7, 11234.3 H. Hou, C. E. Banks, M. Jing, Y. Zhang and X. Ji, Adv. Mater.,2015, 27, 7861.
4 X. Yan, X. Cui and L.-s. Li, J. Am. Chem. Soc., 2010, 132, 5944.5 Z. Wang, F. Yuan, X. Li, Y. Li, H. Zhong, L. Fan and S. Yang,Adv. Mater., 2017, 29, 1702910.
6 S. Gao, H. Fan, Y. Chen, L. Li, Y. Bando and D. Golberg, NanoEnergy, 2013, 2, 1261.
7 A. H. Loo, Z. Sofer, D. Bousa, P. Ulbrich, A. Bonanni andM. Pumera, ACS Appl. Mater. Interfaces, 2016, 8, 1951.
8 S. Zhuo, M. Shao and S. T. Lee, ACS Nano, 2012, 6, 1059.9 J. Briscoe, A. Marinovic, M. Sevilla, S. Dunn and M. Titirici,Angew. Chem., Int. Ed. Engl., 2015, 54, 4463.
10 W. Tao, X. Ji, X. Xu, M. Ariful Islam, Z. Li, S. Chen, P. E. Saw,H. Zhang, Z. Bharwani, Z. Guo, J. Shi and O. Farokhzad,Angew. Chem., Int. Ed., 2017, 129, 12058.
11 X. Xu, R. Ray, Y. Gu, H. J. Ploehn, L. Gearheart, K. Raker andW. A. Scrivens, J. Am. Chem. Soc., 2004, 126, 12736.
12 Y.-P. Sun, B. Zhou, Y. Lin, W. Wang, K. S. Fernando,P. Pathak, M. J. Meziani, B. A. Harruff, X. Wang andH. Wang, J. Am. Chem. Soc., 2006, 128, 7756.
13 H. Li, X. He, Z. Kang, H. Huang, Y. Liu, J. Liu, S. Lian,C. H. Tsang, X. Yang and S. T. Lee, Angew. Chem., Int. Ed.Engl., 2010, 49, 4430.
14 X. Qin, W. Lu, A. M. Asiri, A. O. Al-Youbi and X. Sun, Sens.Actuators, B, 2013, 184, 156.
15 Q. Xu, T. Kuang, Y. Liu, L. Cai, X. Peng, T. SreenivasanSreeprasad, P. Zhao, Z. Yu and N. Li, J. Mater. Chem. B,2016, 4, 7204.
16 J. Zhou, Y. Yang and C. Y. Zhang, Chem. Commun., 2013, 49,8605.
17 M. C. Kim, K. S. Yu, S. Y. Han, J.-J. Kim, J. W. Lee, N. S. Lee,Y. G. Jeong and D. K. Kim, Eur. Polym. J., 2018, 98, 191.
18 H. Ding, S.-B. Yu, J.-S. Wei and H.-M. Xiong, ACS Nano, 2016,10, 484.
19 L. Guo, J. Ge, W. Liu, G. Niu, Q. Jia, H. Wang and P. Wang,Nanoscale, 2016, 8, 729.
9708 | RSC Adv., 2019, 9, 9700–9708
20 J. Zhu, X. Bai, J. Bai, G. Pan, Y. Zhu, Y. Zhai, H. Shao,X. Chen, B. Dong, H. Zhang and H. Song, Nanotechnology,2018, 29, 085705.
21 X. Miao, D. Qu, D. Yang, B. Nie, Y. Zhao, H. Fan and Z. Sun,Adv. Mater., 2018, 30, 1704740.
22 S. Hu, A. Trinchi, P. Atkin and I. Cole, Angew. Chem., Int. Ed.,2015, 54, 2970.
23 H. Ding, J. S. Wei, P. Zhang, Z. Y. Zhou, Q. Y. Gao andH. M. Xiong, Small, 2018, 14, 1800612.
24 S. Vempati, A. Celebioglu and T. Uyar, Nanoscale, 2015, 7,16110.
25 T. Zhang, J. Zhu, Y. Zhai, H. Wang, X. Bai, B. Dong, H. Wangand H. Song, Nanoscale, 2017, 9, 13042.
26 D. Sun, R. Ban, P.-H. Zhang, G.-H. Wu, J.-R. Zhang andJ.-J. Zhu, Carbon, 2013, 64, 424.
27 K. Hola, Y. Zhang, Y. Wang, E. P. Giannelis, R. Zboril andA. L. Rogach, Nano Today, 2014, 9, 590.
28 Y. Dong, H. Pang, H. B. Yang, C. Guo, J. Shao, Y. Chi, C. M. Liand T. Yu, Angew. Chem., Int. Ed. Engl., 2013, 52, 7954.
29 K. S. Babu, T. R. Kumar, P. Haridoss and C. Vijayan, Talanta,2005, 66, 160.
30 P. Chawla, G. Sharma, S. P. Lochab and N. Singh, Bull. Mater.Sci., 2009, 33, 535.
31 Q. Xu, Y. Liu, R. Su, L. Cai, B. Li, Y. Zhang, L. Zhang,Y. Wang, Y. Wang, N. Li, X. Gong, Z. Gu, Y. Chen, Y. Tan,C. Dong and T. S. Sreeprasad, Nanoscale, 2016, 8, 17919.
32 E. N. Tsiok, D. E. Dudalov, Y. D. Fomin and V. N. Ryzhov,Phys. Rev. E: Stat., Nonlinear, So Matter Phys., 2015, 92,032110.
33 X. Zhang, J. Rong, L. Wang, L. Yu, W. Jie, B. Geng andG. Wang, CrystEngComm, 2013, 15, 1173.
34 K. Hola, M. Sudolska, S. Kalytchuk, D. Nachtigallova,A. L. Rogach, M. Otyepka and R. Zboril, ACS Nano, 2017,11, 12402.
35 A. D. Becke, J. Chem. Phys., 1993, 98, 5648.36 X. K. Chen, Y. Tsuchiya, Y. Ishikawa, C. Zhong, C. Adachi
and J. L. Bredas, Adv. Mater., 2017, 29, 1702767.37 Y. Zhang, R. Yuan, M. He, G. Hu, J. Jiang, T. Xu, L. Zhou,
W. Chen, W. Xiang and X. Liang, Nanoscale, 2017, 9, 17849.38 C. Sun, Y. Zhang, K. Sun, C. Reckmeier, T. Zhang, X. Zhang,
J. Zhao, C. Wu, W. W. Yu and A. L. Rogach, Nanoscale, 2015,7, 12045.
This journal is © The Royal Society of Chemistry 2019