Embed Size (px)
Citation preview
MULTI-CHANNEL ULTRA-WIDEBAND RADAR SOUNDER AND IMAGER
R. Hale1, H. Miller2, S. Gogineni1, J. B. Yan1, F. Rodriguez-Morales1, C. Leuschen1, J. Paden1, J. Li1, T. Binder2, D. Steinhage2, M. Gehrmann2, and D. Braaten1
1Center for Remote Sensing of Ice Sheets, University of Kansas
2Alfred Wegener Institute, Germany
ABSTRACT In this paper, we present the development of a multi-channel VHF/UHF ultra-wideband airborne radar sounder and imager for measurements of polar ice sheets. The radar was developed at the Center for Remote Sensing of Ice Sheets (CReSIS) for operation onboard the German Alfred Wegener Institute (AWI) Basler BT-67 aircraft. The system operates from 150 to 600 MHz corresponding to a vertical resolution of 33 cm in free space. The radar is equipped with three 4-m long 8-element antenna subarrays installed under the fuselage and both wings to support 8 transmit and 24 receive channels. The radar waveform from each transmit channel can be configured individually to enable real-time transmit beamforming for wide-swath ice bed imaging of up to 10 km wide. The radar system was deployed to Greenland in the spring of 2016 as a part of the joint AWI/CReSIS test campaign to conduct measurements over glaciers. Sample radar data from this field campaign are presented to illustrate the capability of the radar.
Index Terms— Airborne radar, remote sensing, ultra-wideband, cryosphere, ice.
1. INTRODUCTION Satellite observations have revealed that parts of the Greenland and Antarctic ice sheets are undergoing rapid changes. These changes include the speed-up of major outlet glaciers in Greenland and the break-up of ice shelves in Antarctica followed by rapid increases in the velocity of glaciers buttressed by these ice shelves. Information on bed topography and basal conditions of key glaciers near their grounding lines and ice-sheet margins is needed to understand the processes causing these rapid changes and subsequently develop models to explain observed changes and predict future behavior in a dynamic climate. To address the need for this information, we developed a multi-channel ultra-wideband (UWB) ice radar for measurements over the ice sheets in Greenland and Antarctica. The radar operates over a 150–600 MHz frequency range with a large, cross-track array of 24 elements. We developed the radar for operation on Basler BT-67 aircraft. The UWB system
presented in this paper is a much-improved version of the 8-channel radar operating over a frequency range of 190-450 MHz that was deployed in West Antarctica during the 2013-2014 field season [1]. The UWB system installed on the AWI Polar 6 Basler BT-67 aircraft was deployed to Greenland from April to May 2016 to conduct airborne mapping and imaging of glaciers and ice sheets. In the following sections, we will present an overview of the system architecture and performance, as well as sample radar data collected from the field.
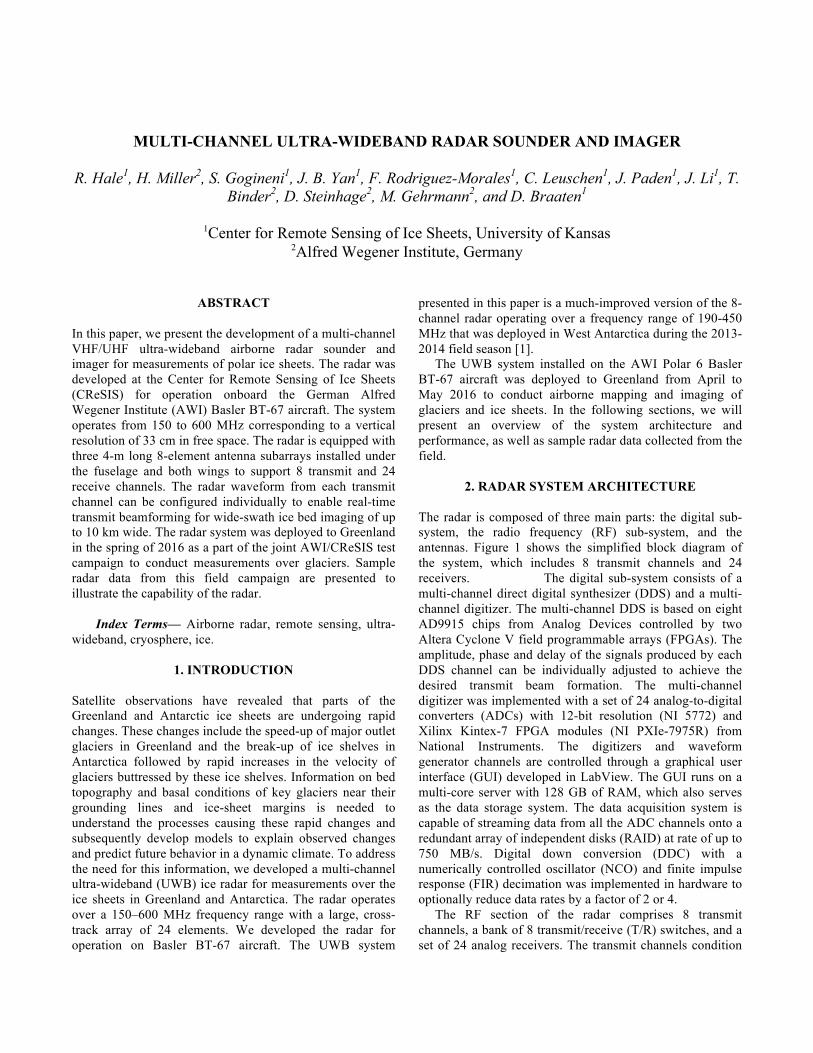
2. RADAR SYSTEM ARCHITECTURE The radar is composed of three main parts: the digital sub-system, the radio frequency (RF) sub-system, and the antennas. Figure 1 shows the simplified block diagram of the system, which includes 8 transmit channels and 24 receivers. The digital sub-system consists of a multi-channel direct digital synthesizer (DDS) and a multi-channel digitizer. The multi-channel DDS is based on eight AD9915 chips from Analog Devices controlled by two Altera Cyclone V field programmable arrays (FPGAs). The amplitude, phase and delay of the signals produced by each DDS channel can be individually adjusted to achieve the desired transmit beam formation. The multi-channel digitizer was implemented with a set of 24 analog-to-digital converters (ADCs) with 12-bit resolution (NI 5772) and Xilinx Kintex-7 FPGA modules (NI PXIe-7975R) from National Instruments. The digitizers and waveform generator channels are controlled through a graphical user interface (GUI) developed in LabView. The GUI runs on a multi-core server with 128 GB of RAM, which also serves as the data storage system. The data acquisition system is capable of streaming data from all the ADC channels onto a redundant array of independent disks (RAID) at rate of up to 750 MB/s. Digital down conversion (DDC) with a numerically controlled oscillator (NCO) and finite impulse response (FIR) decimation was implemented in hardware to optionally reduce data rates by a factor of 2 or 4. The RF section of the radar comprises 8 transmit channels, a bank of 8 transmit/receive (T/R) switches, and a set of 24 analog receivers. The transmit channels condition
(filter and amplify) the signals from the waveform generator. Eight power amplifiers from Tomco Technologies are used to increase the transmit signal power up to 500- or 1,000 Watts of peak power. Eight antenna elements are used for both transmit and receive operations. This required developing custom T/R modules capable of handling high transmit power and fast switching speed [2]. The 24 analog receivers condition the radar return signals from individual antenna elements before they are digitized. Each analog receiver channel comprises a variable gain stage (with a low-noise front-end) and an anti-aliasing band-pass filter.
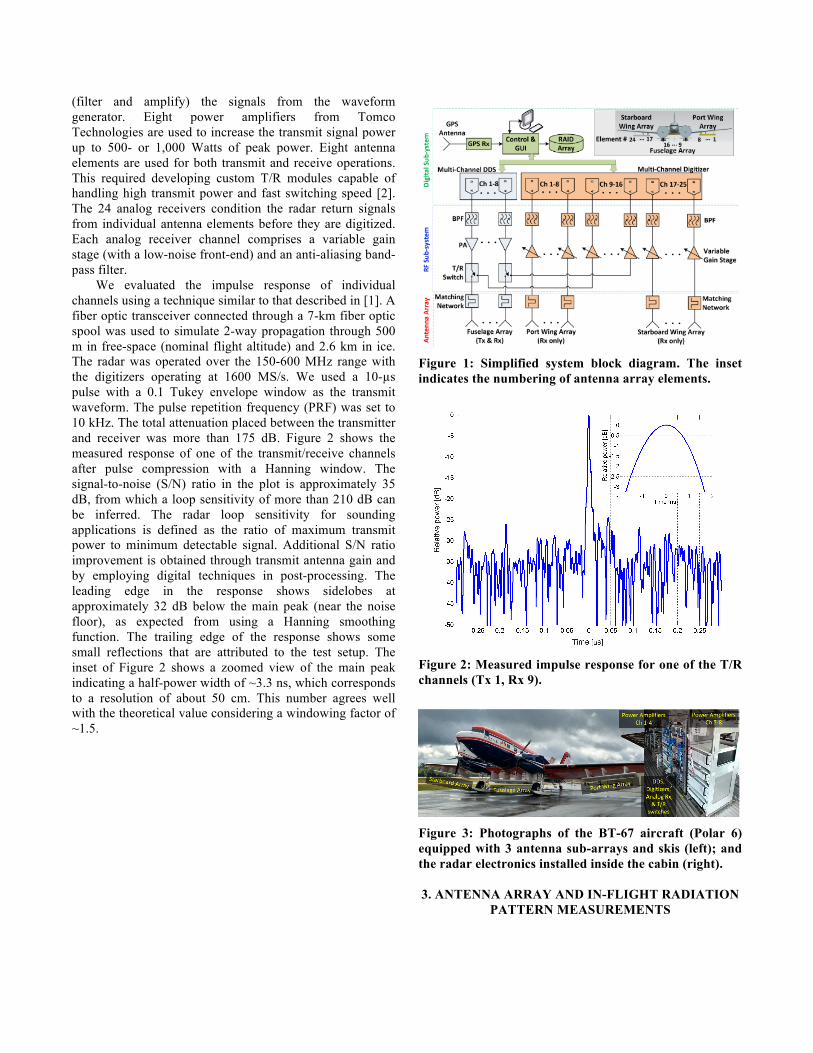
We evaluated the impulse response of individual channels using a technique similar to that described in [1]. A fiber optic transceiver connected through a 7-km fiber optic spool was used to simulate 2-way propagation through 500 m in free-space (nominal flight altitude) and 2.6 km in ice. The radar was operated over the 150-600 MHz range with the digitizers operating at 1600 MS/s. We used a 10-µs pulse with a 0.1 Tukey envelope window as the transmit waveform. The pulse repetition frequency (PRF) was set to 10 kHz. The total attenuation placed between the transmitter and receiver was more than 175 dB. Figure 2 shows the measured response of one of the transmit/receive channels after pulse compression with a Hanning window. The signal-to-noise (S/N) ratio in the plot is approximately 35 dB, from which a loop sensitivity of more than 210 dB can be inferred. The radar loop sensitivity for sounding applications is defined as the ratio of maximum transmit power to minimum detectable signal. Additional S/N ratio improvement is obtained through transmit antenna gain and by employing digital techniques in post-processing. The leading edge in the response shows sidelobes at approximately 32 dB below the main peak (near the noise floor), as expected from using a Hanning smoothing function. The trailing edge of the response shows some small reflections that are attributed to the test setup. The inset of Figure 2 shows a zoomed view of the main peak indicating a half-power width of ~3.3 ns, which corresponds to a resolution of about 50 cm. This number agrees well with the theoretical value considering a windowing factor of ~1.5.
Figure 1: Simplified system block diagram. The inset indicates the numbering of antenna array elements.
Figure 2: Measured impulse response for one of the T/R channels (Tx 1, Rx 9).
Figure 3: Photographs of the BT-67 aircraft (Polar 6) equipped with 3 antenna sub-arrays and skis (left); and the radar electronics installed inside the cabin (right).
3. ANTENNA ARRAY AND IN-FLIGHT RADIATION
PATTERN MEASUREMENTS
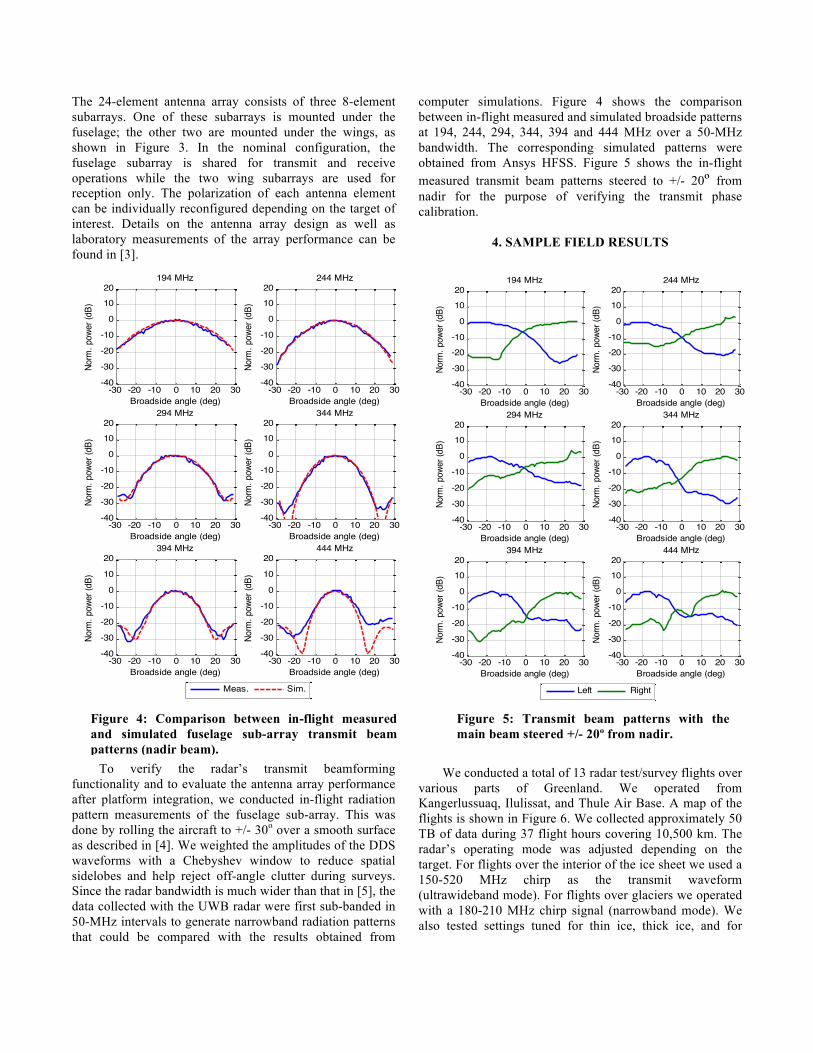
The 24-element antenna array consists of three 8-element subarrays. One of these subarrays is mounted under the fuselage; the other two are mounted under the wings, as shown in Figure 3. In the nominal configuration, the fuselage subarray is shared for transmit and receive operations while the two wing subarrays are used for reception only. The polarization of each antenna element can be individually reconfigured depending on the target of interest. Details on the antenna array design as well as laboratory measurements of the array performance can be found in [3].
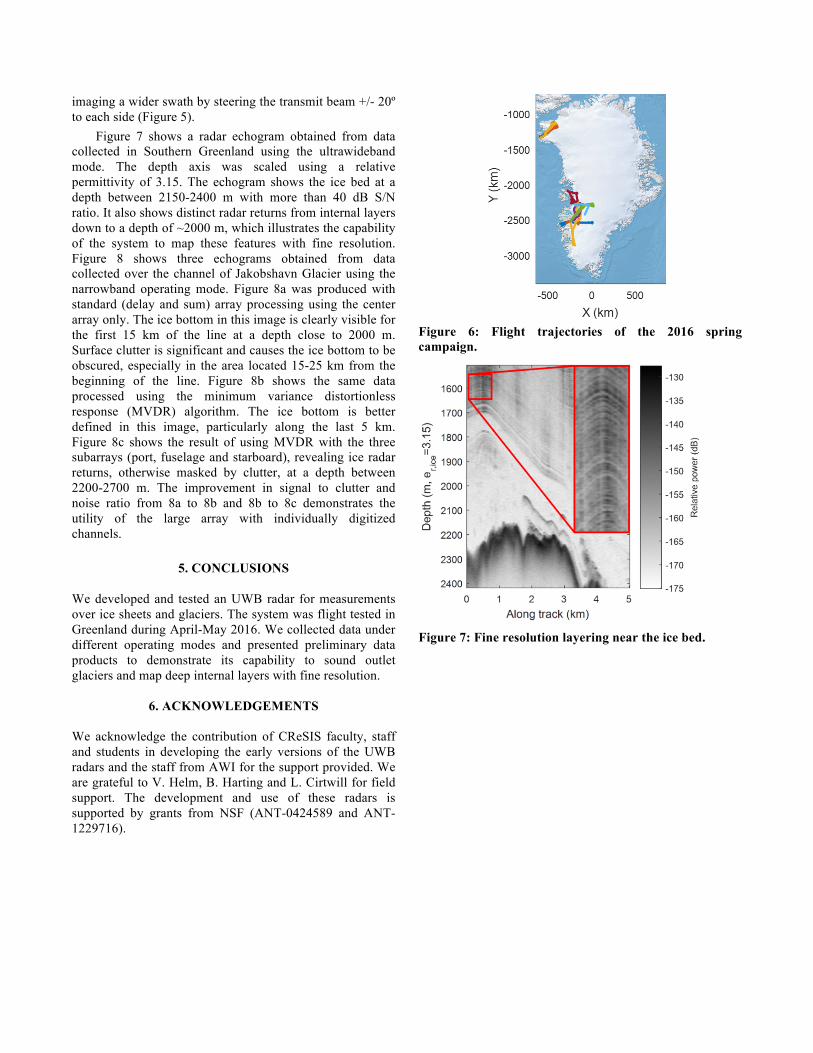
To verify the radar’s transmit beamforming functionality and to evaluate the antenna array performance after platform integration, we conducted in-flight radiation pattern measurements of the fuselage sub-array. This was done by rolling the aircraft to +/- 30o over a smooth surface as described in [4]. We weighted the amplitudes of the DDS waveforms with a Chebyshev window to reduce spatial sidelobes and help reject off-angle clutter during surveys. Since the radar bandwidth is much wider than that in [5], the data collected with the UWB radar were first sub-banded in 50-MHz intervals to generate narrowband radiation patterns that could be compared with the results obtained from
computer simulations. Figure 4 shows the comparison between in-flight measured and simulated broadside patterns at 194, 244, 294, 344, 394 and 444 MHz over a 50-MHz bandwidth. The corresponding simulated patterns were obtained from Ansys HFSS. Figure 5 shows the in-flight measured transmit beam patterns steered to +/- 20º from nadir for the purpose of verifying the transmit phase calibration.
4. SAMPLE FIELD RESULTS
We conducted a total of 13 radar test/survey flights over various parts of Greenland. We operated from Kangerlussuaq, Ilulissat, and Thule Air Base. A map of the flights is shown in Figure 6. We collected approximately 50 TB of data during 37 flight hours covering 10,500 km. The radar’s operating mode was adjusted depending on the target. For flights over the interior of the ice sheet we used a 150-520 MHz chirp as the transmit waveform (ultrawideband mode). For flights over glaciers we operated with a 180-210 MHz chirp signal (narrowband mode). We also tested settings tuned for thin ice, thick ice, and for
-30 -20 -10 0 10 20 30-40
-30
-20
-10
0
1020
194 MHz
Broadside angle (deg)
Norm
. pow
er (d
B)
Meas. Sim.
-30 -20 -10 0 10 20 30-40
-30
-20
-10
0
1020
244 MHz
Broadside angle (deg)
Norm
. pow
er (d
B)
-30 -20 -10 0 10 20 30-40
-30
-20
-10
0
1020
294 MHz
Broadside angle (deg)
Norm
. pow
er (d
B)
-30 -20 -10 0 10 20 30-40
-30
-20
-10
0
1020
344 MHz
Broadside angle (deg)
Norm
. pow
er (d
B)
-30 -20 -10 0 10 20 30-40
-30
-20
-10
0
10
20394 MHz
Broadside angle (deg)
Norm
. pow
er (d
B)
-30 -20 -10 0 10 20 30-40
-30
-20
-10
0
10
20444 MHz
Broadside angle (deg)
Norm
. pow
er (d
B)
Figure 4: Comparison between in-flight measured and simulated fuselage sub-array transmit beam patterns (nadir beam).
-30 -20 -10 0 10 20 30-40
-30
-20-10
0
1020
194 MHz
Broadside angle (deg)
Norm
. pow
er (d
B)
-30 -20 -10 0 10 20 30-40
-30
-20-10
0
1020
244 MHz
Broadside angle (deg)
Norm
. pow
er (d
B)
-30 -20 -10 0 10 20 30-40
-30
-20
-10
0
1020
294 MHz
Broadside angle (deg)
Norm
. pow
er (d
B)
-30 -20 -10 0 10 20 30-40
-30
-20
-10
0
1020
344 MHz
Broadside angle (deg)
Norm
. pow
er (d
B)
-30 -20 -10 0 10 20 30-40
-30
-20
-10
0
1020
394 MHz
Broadside angle (deg)
Norm
. pow
er (d
B)
-30 -20 -10 0 10 20 30-40
-30
-20
-10
0
1020
444 MHz
Broadside angle (deg)
Norm
. pow
er (d
B)
Left Right
Figure 5: Transmit beam patterns with the main beam steered +/- 20º from nadir.
imaging a wider swath by steering the transmit beam +/- 20º to each side (Figure 5).
Figure 7 shows a radar echogram obtained from data collected in Southern Greenland using the ultrawideband mode. The depth axis was scaled using a relative permittivity of 3.15. The echogram shows the ice bed at a depth between 2150-2400 m with more than 40 dB S/N ratio. It also shows distinct radar returns from internal layers down to a depth of ~2000 m, which illustrates the capability of the system to map these features with fine resolution. Figure 8 shows three echograms obtained from data collected over the channel of Jakobshavn Glacier using the narrowband operating mode. Figure 8a was produced with standard (delay and sum) array processing using the center array only. The ice bottom in this image is clearly visible for the first 15 km of the line at a depth close to 2000 m. Surface clutter is significant and causes the ice bottom to be obscured, especially in the area located 15-25 km from the beginning of the line. Figure 8b shows the same data processed using the minimum variance distortionless response (MVDR) algorithm. The ice bottom is better defined in this image, particularly along the last 5 km. Figure 8c shows the result of using MVDR with the three subarrays (port, fuselage and starboard), revealing ice radar returns, otherwise masked by clutter, at a depth between 2200-2700 m. The improvement in signal to clutter and noise ratio from 8a to 8b and 8b to 8c demonstrates the utility of the large array with individually digitized channels.
5. CONCLUSIONS
We developed and tested an UWB radar for measurements over ice sheets and glaciers. The system was flight tested in Greenland during April-May 2016. We collected data under different operating modes and presented preliminary data products to demonstrate its capability to sound outlet glaciers and map deep internal layers with fine resolution.
6. ACKNOWLEDGEMENTS We acknowledge the contribution of CReSIS faculty, staff and students in developing the early versions of the UWB radars and the staff from AWI for the support provided. We are grateful to V. Helm, B. Harting and L. Cirtwill for field support. The development and use of these radars is supported by grants from NSF (ANT-0424589 and ANT- 1229716).
Figure 6: Flight trajectories of the 2016 spring campaign.
Figure 7: Fine resolution layering near the ice bed.
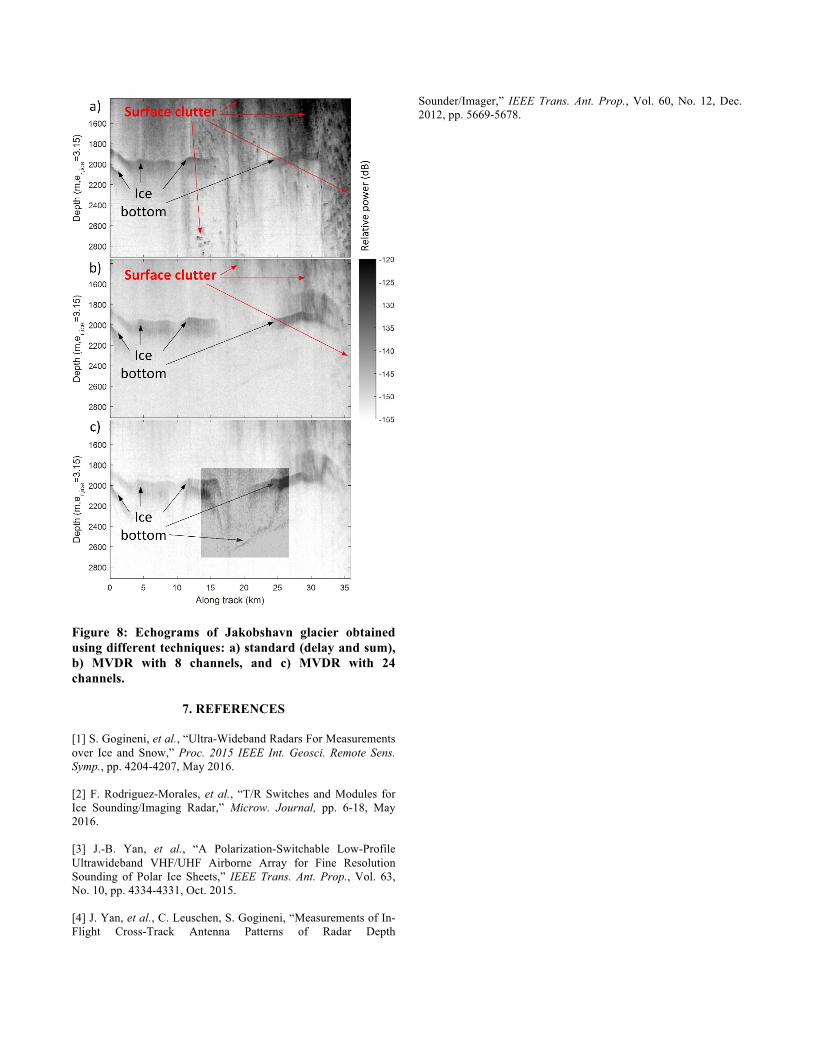
Figure 8: Echograms of Jakobshavn glacier obtained using different techniques: a) standard (delay and sum), b) MVDR with 8 channels, and c) MVDR with 24 channels.
7. REFERENCES
[1] S. Gogineni, et al., “Ultra-Wideband Radars For Measurements over Ice and Snow,” Proc. 2015 IEEE Int. Geosci. Remote Sens. Symp., pp. 4204-4207, May 2016. [2] F. Rodriguez-Morales, et al., “T/R Switches and Modules for Ice Sounding/Imaging Radar,” Microw. Journal, pp. 6-18, May 2016. [3] J.-B. Yan, et al., “A Polarization-Switchable Low-Profile Ultrawideband VHF/UHF Airborne Array for Fine Resolution Sounding of Polar Ice Sheets,” IEEE Trans. Ant. Prop., Vol. 63, No. 10, pp. 4334-4331, Oct. 2015. [4] J. Yan, et al., C. Leuschen, S. Gogineni, “Measurements of In-Flight Cross-Track Antenna Patterns of Radar Depth
Sounder/Imager,” IEEE Trans. Ant. Prop., Vol. 60, No. 12, Dec. 2012, pp. 5669-5678.