Embed Size (px)
Citation preview

v
www.plindia.com
“Multi Asset Dynamic Portfolio”

Multi Asset Dynamic Portfolio (MADP) is a 100% quant-
based tactical asset allocation strategy created by Quantifi
that invests only in passive instruments (index funds and
ETFs). Quantifi is Prabhudas Lilladher’s specialized
quantitative research and investment management arm.
The strategy is only available as a discretionary PMS to
avoid greed and fear of investors.
Our Strategy is based on 3Pillars
Downside
Protection
Upside
Participation
Consistent
Performance
PL PMS - Multi Asset Dynamic Portfolio 2
Strategy Overview
Long Only EquityMulti Asset – comprises of 7 asset classes
Strategic Asset Allocationwith moderate Shifts
Tactical asset allocationwith radical shifts
DiscretionaryQuant & Rules Based that is unbiased
Relies only on Fundamental data andFund Managers’ judgment
Quantamental Strategy that relies on varieddatasets - Fundamental, Alternative &
Technical data
Stock or Sector SelectionInvests in ETFs
Rebalances at fixed time intervalsirrespective of market conditions
Trigger Based Rebalances
Limited rotation and allocationbetween asset classes due to size, classification and tax constraints
such as in mutual funds
SEBI regulated PMS, offering higher flexibilityas it can make aggressive allocations and
rotations between asset classes, to be ableto utilize Tactical opportunities.
What MADP Is? What MADP Isn’t? VS
1
2
3
4
5
6
7

PL PMS - Multi Asset Dynamic Portfolio 3
Source: *Brinson, Hood, Beebower. “Determinants of Portfolio Performance”. Financial Analysts Journal. July-August 1986; Brinson, Singer, Beetbower. “Determinants of Portfolio Performance II: An Update”. Financial Analysts Journal. May-June 1991.
● Despite the attention that stock selection typically gets, it is not the major driver of investor outcomes.
● Asset allocation explains about 92% of the variability of results for diversified investment pools such as pension funds*.
● Only 8% is explained by other factors such as security selection, market timings etc.
● Significant percentage of volatility of investment performance is driven by asset allocation decisions
4.6% Security Selection
2.1% Other Factors
1.8% Market Timing
91.5% Assets Allocation
Asset Allocation Matters The Most

PL PMS - Multi Asset Dynamic Portfolio 4
Asset Allocation Matters The Most
Note: Equity returns include price performance and does not include dividend yields. Calendar month convention is used for YoY returns calculation. For Large, mid and small caps correspond to BSE S&P Sensex, BSE S&P mid cap and BSE S&P small cap respectively. Gold prices in INR are from World Gold Council. S&P corporate bond index is taken to calculate corporate bond returns. 10-year sovereign g-sec price index data is taken from BSE website. Liquid/ Cash is the DSP Liquid Growth Fund (Regular) Source: BSE, World Gold Council, Bloomberg, Yahoo Finance, PL.
Did You Know ? “All” asset classes have certain periods of underperformance.
OK So? We generate returns by allocating money to the Right Asset at Right Time !
How !? Our Proprietary Quant models ensure that you remain invested in the Right Asset ETFs at the Right Time.
Do you see the same asset winning consistently every year? No, Right?
YEAR WISE ANNUAL RETURNS OF INVESTMENT AVENUES
Year Gold Large Cap Mid Cap Small Cap Corp Bonds G-sec Nasdaq 100 Liquid Winner
2007 17.5% 47.1% 68.6% 93.7% 6.8% 7.1% 18.7% 7.0% Small Cap
2008 28.9% -52.4% -67.0% -72.4% 13.7% 9.1% -41.9% 8.7% Gold
2009 19.4% 73.0% 107.7% 126.9% 8.0% 3.5% 53.5% 4.4% Small Cap
2010 24.2% 22.9% 16.1% 15.7% 9.5% 4.0% 19.2% 5.5% Gold
2011 29.4% -24.6% -34.2% -42.6% 5.2% 2.5% 2.7% 8.9% Gold
2012 11.7% 25.7% 38.5% 33.0% 11.7% 10.7% 16.8% 9.7% Mid Cap
2013 -18.0% 9.0% -5.7% -11.2% 6.8% -0.3% 35.0% 9.2% Nasdaq 100
2014 2.2% 29.9% 54.7% 69.2% 13.4% 14.1% 17.9% 9.0% Small Cap
2015 -7.9% -5.0% 7.4% 6.8% 9.1% 7.4% 8.4% 8.3% Corp Bonds
2016 10.9% 1.9% 8.0% 1.8% 11.1% 14.2% 5.9% 7.6% G-sec
2017 6.0% 27.9% 48.1% 59.6% 6.8% -0.6% 31.5% 6.6% Small Cap
2018 8.4% 5.9% -13.4% -23.5% 7.5% 6.7% -1.0% 7.4% Gold
2019 21.1% 14.4% -3.0% -6.8% 10.0% 10.0% 38.0% 6.5% Nasdaq 100
2020 28.3% 15.8% 19.9% 32.1% 12.2% 9.6% 47.6% 4.2% Nasdaq 100

The strategy has given positive returns on gross basis over last 15 years and has performed average or better compared to other asset classes.
Note: Back-tested results of Quant Model & not actual returns. Above returns are only for understating purpose and there is no assurance or guarantee that the objectives of the investment will be achieved as investment in Securities is subject to market risk. Returns net of management fees, performance fees ,transaction costs. and other expenses. Impact cost not included. Data as on 15th November 2021. Benchmark = 80% 50:50 Crisil Hybrid Moderate Index + 20% Gold
PL PMS - Multi Asset Dynamic Portfolio 5
Performance
YEAR QUANTIFI
ETF BASED MADP FUND
NIPPON INDIA NIFTY BEES
ICICI PRU NEXT 50
ETF
NIPPON INDIA NIFTY
MIDCAP 150
MOTILAL OSWAL
SMALLCAP 250 INDEX FUND
MOTILAL OSWAL
S&P 500 INDEX FUND
MOTILAL OSWAL
NASDAQ 100 ETF
NIPPON INDIA GOLD BEES
NIPPON INDIA LONG TERM
GILT ETF
BHARAT BOND ETF - APRIL 2025
NIPPON INDIA
LIQUID BEES
BENCHMARK
2007 35.4% 52.9% 75.7% 76.9% 94.9% -7.5% 6.5% 17.4% 6.6% 6.8% 6.4% 30.1%
2008 22.9% -51.9% -63.5% -59.4% -69.1% -24.2% -27.9% 25.6% 22.8% 13.7% 6.6% -19.9%
2009 86.6% 74.6% 127.9% 99.0% 113.9% 17.9% 47.6% 22.7% -4.9% 8.0% 2.8% 36.6%
2010 15.6% 18.8% 17.8% 19.2% 16.3% 8.9% 15.7% 21.7% 6.0% 9.5% 4.1% 14.3%
2011 4.6% -23.9% -31.9% -31.0% -36.0% 18.3% 23.4% 30.3% 5.8% 5.2% 6.1% -1.0%
2012 20.6% 27.0% 48.1% 39.2% 38.2% 17.4% 17.4% 10.9% 11.4% 11.7% 6.0% 18.1%
2013 7.3% 6.6% 4.8% -5.1% -9.5% 46.6% 54.9% -14.1% 2.9% 6.8% 6.0% -1.6%
2014 20.8% 31.2% 44.4% 55.9% 69.6% 12.3% 22.6% 0.8% 16.3% 13.4% 6.0% 19.8%
2015 0.7% -4.1% 7.0% 6.5% 9.6% 5.0% 13.5% -7.8% 8.2% 9.1% 5.0% 1.8%
2016 15.9% 3.9% 7.1% 7.1% -0.4% 9.4% 8.1% 10.7% 15.5% 11.1% 4.5% 9.7%
2017 27.7% 30.0% 44.8% 47.3% 57.1% 11.4% 22.2% 2.9% 1.1% 6.8% 4.0% 16.5%
2018 13.1% 4.6% -8.8% -15.4% -27.6% 0.7% 5.6% 6.9% 7.3% 7.5% 4.2% 4.5%
2019 21.6% 13.5% 1.4% 0.0% -7.8% 33.0% 41.6% 22.9% 11.1% 10.0% 3.7% 12.6%
2020 49.4% 15.8% 14.8% 25.3% 25.9% 0.5% 51.5% 26.2% 11.1% 10.4% 2.5% 19.3%
2021 YTD 21.4% 31.0% 37.4% 52.9% 60.0% 27.7% 29.3% -2.6% 1.1% 4.6% 2.1% 14.1%

PL PMS - Multi Asset Dynamic Portfolio 6
Quantamental Investing Approach
Quantamental Investing Approach is a blend of fundamental analysis and quantitative techniques. This approach uses Fundamental + Alternative + Quantitative + Technical (FAQT) methods to make investment decisions. Quantamental research is qualitative and quantitative data driven approach. Quantamental research explores the deeper and wider insights of the data enabling agile decision-making process.
Merits of Quantamental Investing Approach • Data Driven trigger based Agile decision making
• Zero intervention of Fund Manager’s bias
• Quantifies market sentiments and Euphoria
• Provides greater insights of factors affecting prices
• Over-rides rule based decision making in times of events not
captured by historical data such as Covid-19 market crash.
Outcomes of Quantamental Investing Approach • More consistent returns resulting to faster compounding
• Eliminates emotional biases like panic decision making,
Loss-Aversion etc.
• Eliminates behavioral biases and Heuristics
• Constant monitoring and seamless decision making
• Optimized and Reliable back tested investment strategies

In the US, the AUM of Quant based mutual funds has grown a drastic 19.2% CAGR from 2010-2017 and has done so in an exponential manner. This shows the rising popularity of quant funds in the United States as the 8-year CAGR is expected to rise beyond 20%.
Source: Morgan Stanley Research
Source: AceMF, Data as on 30th July 2021
PL PMS - Multi Asset Dynamic Portfolio 7
Quantitative Funds in the US and India
In India, Quant funds still represent a miniscule percentage of total funds managed by MFs. This space is still nascent with a lot of upcoming small investment firms following quant-based strategies. India Quant Fund Landscape: Total AUM Size – Rs. 5920 Cr approx. Top players by AUM
● DSP Quant Fund – Rs. 988 Cr
● Tata Quant Fund – Rs. 64 Cr
● Nippon Quant Fund – Rs. 30 Cr
● Quant Money Managers – Rs. 3207 Cr
● ICICI Pru Quant Fund – Rs. 69 Cr.
● Axis Quant Fund – Rs. 1552 Cr

PL PMS - Multi Asset Dynamic Portfolio 8
The Rise of Quant
Proportion of Hedge Fund Launches that Use Quantitative Framework
Source: Preqin

35.8
23.7
17.2
12.1 10.1
0.5 0.4 0.2 0
5
10
15
20
25
30
35
40
ActiveLarge
Growth
ActiveLargeBlend
ActiveLargeValue
ActiveOther
PassiveLargeBlend
PassiveOther
PassiveLarge
Growth
PassiveLargeValue
Source: Morningstar
Percentage of Assets in US equity funds by Investment Type
As on December 1998
33.0
17.0
12.3 11.3 9.4 9.1
4.0 3.8
0
5
10
15
20
25
30
35
PassiveLargeBlend
ActiveLarge
Growth
ActiveOther
ActiveLargeBlend
ActiveLargeValue
PassiveOther
PassiveLargeValue
PassiveLarge
Growth
As on April 2019
89%
11%
As on December 1998
Active Passive
50% 50%
As on April 2019
Active Passive
PL PMS - Multi Asset Dynamic Portfolio 9
Passive Goes Massive

Source: Investment Company Institute
Cumulative Flows from US Active to Passive Funds
PL PMS - Multi Asset Dynamic Portfolio 10
Passive Goes Massive

Data as on April 2019 Source: Morningstar
PL PMS - Multi Asset Dynamic Portfolio 11
USA is Automating…
33.0
17.0
12.3 11.3
9.4 9.1
4.0 3.8
0
5
10
15
20
25
30
35
PassiveLargeBlend
ActiveLarge
Growth
ActiveOther
ActiveLargeBlend
ActiveLargeValue
PassiveOther
PassiveLargeValue
PassiveLarge
Growth
Percentage of Assets in US equity funds by Investment Type
24.3%
40.6% 7.7%
14.7%
7.4%
2.9% 2.4%
35.1%
Active Managed Funds Others
Mutual index funds Institutional Index
ETF Index Smart ETFs
Quant Funds
Automated Managed Funds
Others: Held by companies Government, Insurance, Foreigners Source: The Economist
Percentage of Total Public Equities (worth USD 31trn)
PL PMS - Multi Asset Dynamic Portfolio 12
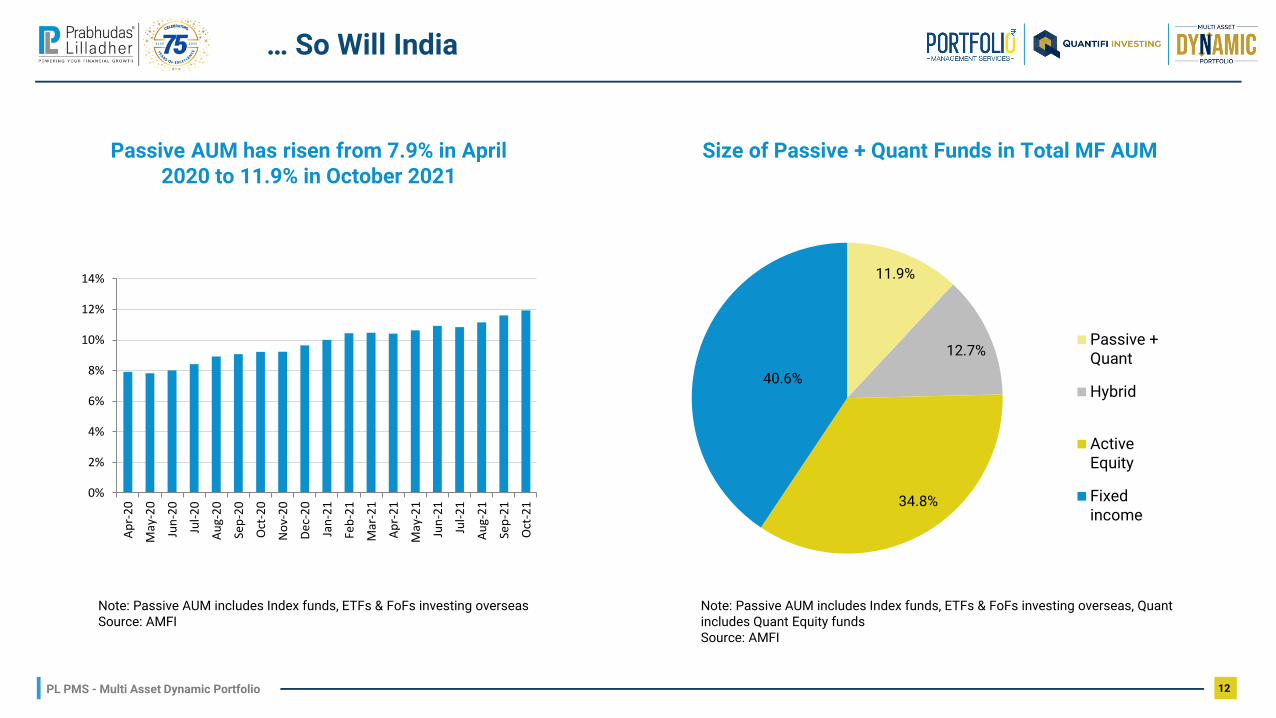
… So Will India
0%
2%
4%
6%
8%
10%
12%
14%
Ap
r-2
0
May
-20
Jun
-20
Jul-
20
Au
g-2
0
Sep
-20
Oct
-20
No
v-2
0
De
c-2
0
Jan
-21
Feb
-21
Mar
-21
Ap
r-2
1
May
-21
Jun
-21
Jul-
21
Au
g-2
1
Sep
-21
Oct
-21
Passive AUM has risen from 7.9% in April 2020 to 11.9% in October 2021
Note: Passive AUM includes Index funds, ETFs & FoFs investing overseas Source: AMFI
Size of Passive + Quant Funds in Total MF AUM
11.9%
12.7%
34.8%
40.6%
Passive +Quant
Hybrid
ActiveEquity
Fixedincome
Note: Passive AUM includes Index funds, ETFs & FoFs investing overseas, Quant includes Quant Equity funds Source: AMFI

PL PMS - Multi Asset Dynamic Portfolio 13
Passive Trends in India
Source: AMFI Source: Bloomberg; Deutsche Bank; Thomson Reuters, trackinsight.com

Source: SPIVA April 2021, S&P Dow Jones, MorningStar
PL PMS - Multi Asset Dynamic Portfolio 14
The Active vs. Passive Debate- Who Wins?
FUND CATEGORY COMPARISON INDEX 1-YEAR (%) 3-YEAR (%) 5-YEAR (%)
Indian Equity Large-Cap S&P BSE 100 86.21 86.67 82.72
Indian ELSS S&P BSE 200 56.66 76.19 76.19
Indian Equity Mid-/Small-Cap
S&P BSE 400 Mid SmallCap Index
57.14 48.65 69.57
Indian Government Bond
S&P BSE India Government Bond Index
70.83 51.85 71.43
Indian Composite Bond S&P BSE India Bond
Index 50.00 97.90 97.87
Percentage of Funds Outperformed by the Index (Based on Absolute Return)

PL PMS - Multi Asset Dynamic Portfolio 15
ETF vs Direct Equity
Criteria Index ETF Investing Direct Equity Investing
Stock Selection Risk Tracks an index which is inherently rule-based. Hence, does not involve any stock selection risk.
There is a need to do extensive research, selecting stocks and entering at the right time.
Monitoring & Rebalancing The monitoring/rebalancing is done by the Index creator.
One needs to monitor stocks and keep researching new investments.
Company-specific - Unsystematic Risk Eliminates individual company-specific risk. It is very well diversified.
An undiversified portfolio can be vulnerable to company-specific risks.
Costs Since there is no active selection, the total expense ratio is usually very low.
There can be high trading costs due to frequent trading.
Tax Efficiency Yields relatively better after-tax returns due to low number of rebalances.
Frequent trading can lead to lower after-tax returns and high short term capital gains tax.
Emotional Biases It is a disciplined approach to investing. Subject to human and emotional biases.
Drawdowns & Survivorship Bias Lower drawdowns and survivorship bias working in favor of index investors
Higher drawdowns and survivorship bias working in against of direct equity investors in under performing stocks

PL PMS - Multi Asset Dynamic Portfolio 16
Our Investment Style – Tactical Asset Allocation, Passive Instruments & Quant Methods
Investment Selection Style
Manager Based - Tactical Asset Allocation ● Human bias
● Security selection risk
● Performance dependent on fund manager
Manager Based- Strategic Asset Allocation ● Human bias
● Security Selection Risk
● Static Allocation, prone to drawdowns in line with market falls
Index Based- Tactical Asset Allocation + Quant Methods ● No security selection risk
● No Human Bias – Rule based investing
● Not Fund manager dependent
Index Based- Strategic Asset Allocation ● Static Allocation, prone to drawdowns
in line with market falls
● Does not capture market moves - limited upsides
● Emphasis on minimizing market risk
Ac
tiv
e (
Sto
ck
s)
Pa
ss
ive
(In
de
x)
Tactical (Dynamic) Strategic (Static)
Asset Allocation Style
The new holy trinity of the investing world

PL PMS - Multi Asset Dynamic Portfolio 17
Tactical vs. Strategic Asset Allocation
Risk based
Static
Unchanging
Outcome Oriented
Active Rebalancing
Opportunistic
Risk Management Emphasis
Diversification &
Tactical Asset Allocation

Domestic Equities ● Fastest growing large emerging economy ● Broad coverage of entire listed market (includes Large and mid caps) ● Diversified across sectors and industries ● Helps in managing portfolio beta by going overweight for growth &
underweight for protection
Fixed income ● Brings in portfolio stability ● Capital Preservation and Steady Income ● Practically ‘Nil’ credit risk (invests in AA & above)
US Equities – Nasdaq 100/ S&P 500 ● Access to world’s largest GDP ● Exposure to biggest and fastest growing tech stocks ● Provides USD exposure by creating a dollar asset to capture dollar
appreciation vs INR ● Geographical risk diversification
Gold ● Safe Haven asset class held by global Central Banks ● Negative correlation with most asset classes ● Hedge against inflation
PL PMS - Multi Asset Dynamic Portfolio 18
Rationale For Each Asset Class

1. The strategy takes exposure to asset classes via investing in the following instruments based on Liquidity, AUM, Tracking Error, Vintage, Impact Cost, Expense ratio,
market share and asset class representation.
ASSET CLASS ETFs
Large Cap
Mid cap
Gold
Corporate bonds
G-sec securities
Liquid Funds
International Equities
Nippon India Nifty Bees/ Nippon India Junior Bees
Nippon India Gold BEes
Bharat Bond April 2025 ETF/ April 2023 ETF
Nippon India Long Term Gilt ETF/ ICICI Pru Constant Maturity Gilt Fund
Nippon India Liquid Bees
Motilal Oswal Nasdaq 100 ETF/ S&P 500 Index Fund
Nippon India Midcap 150 ETF
PL PMS - Multi Asset Dynamic Portfolio 19
Instrument Details
2. Benchmark: 80% Crisil Hybrid 50:50 – Moderate Index + 20% Domestic Gold Price in INR
*Note: ETFs and index funds are subject to change in accordance with fund manager’s discretion
10%-50%
0%-34%
5%-35%
10%-32%
0%-32%
0%-11%
5%-31%
Min-Max Allocations

Output Frequency Tenure Number ofIndicators
Type
Output in terms ofStrong Growth,Steady Growth,Deceleration,Recovery &Slowdown
Output in terms ofInvest in Equities,
Invest in Gilt, Investin Corp bonds,Invest in Debt +
Equity
Output in terms ofDeeply undervalued,Undervalued, FairlyValued, Overvalued,Highly Overvalued
Output in terms ofDeeply undervalued,Undervalued, FairlyValued, Overvalued,Highly Overvalued
Gives the asset classesthat shows the highest
momentum
Gives output as Investin Gold or invest inother asset classes
Signals Buy or Sell inNifty 50
Signals Buy or Sell inequity market
Output in terms ofRisk On or Risk OffC
on
cu
rren
t
LeadingConcurrent
Co
ncu
rrent
ConcurrentConcurrent
Concurrent
La
gg
ed
Lagg
ed
Sh
ort
Te
rm
Short
Term
MediumTerm
Med
ium
Term
MediumTerm
Medium
Term
Mediu
m
Term
Lo
ng
Te
rmLo
ngT
erm
Da
ily
Daily
Daily
Weekly
WeeklyWeekly
Daily
Mo
nth
ly
Mon
thly
25
2
3
59
5
10
Methodology25 2
6
The strategy uses 9 proprietary meters as a toolbox to determine the allocation between the asset classes:
Macrometer: Economic Cycle
It focuses on identifying the level of the economic cycle and its direction, using 25
monthly economic indicators. By combining the level and the momentum of the economic activity, we differentiate periods into 5 macro
regimes namely, Strong Growth, Steady Growth, Deceleration, Recovery and Slowdown
Monetary Meter: Monetary cycle
It quantifies the steepness of the yield curve and the liquidity in the markets that affect bond yields and hence
bond prices. This meter tracks interest rate regime and money supply
Cyclometers: Equity market cycle
Cyclometer tracks the equity market cycle by quantifying valuation zones and trend of Nifty 50 index using high frequency valuation indicators
Multi Asset Momentum: Trend
This indicator captures the trend across asset classes. We follow a variation of Dual Momentum strategy
where we consider the absolute and relative trend of asset classes & is used as a confirmation tool
Gold Meter: Gold momentum It captures momentum in gold by comparing price performance of Gold against other asset classes such as EM and DM equities, commodities and net long positions held by the investors
Technometer: Technical Risk- Reward It evaluates Equity Market Cycle – for Nifty 50 as well as Nasdaq 100, from a Technical Risk Reward Perspective to look for reversals and breakouts using a combination of technical indicators
Sentimeter: Sentiment It captures the sentiment in domestic equity market. Using high frequency market sentiment indicators, we create an index which gives us bullish and bearish signals
Global RORO: Risk Appetite This risk on- risk off indicator tracks global risk appetite by evaluating relative risk-reward across equity and debt instruments of developed & emerging markets
Using combination of these proprietary meters, we arrive at our final asset allocation by following a trigger based and not a time based rebalance mechanism. The rebalance across assets is triggered for tactically balancing risk and return.
Relative Value meter Relative value meter tracks relative attractiveness of small & midcaps vs. large caps
PL PMS - Multi Asset Dynamic Portfolio 20
Methodology

PL PMS - Multi Asset Dynamic Portfolio 21
Macrometer – Quantifying health of the economy
Macrometer’ is based on identifying the level of the economic cycle and its momentum, using 25 monthly economic
indicators. By combining the level and the momentum of the economic activity, we differentiate periods into 5 macro
regimes – Strong growth, steady growth, deceleration, slowdown and recovery. Given the time lag with which the official
number for GDP comes out, Macrometer acts as a leading indicator of the economic growth which tells about where the
economy is heading much before the government releases official numbers. The indicator is updated monthly.
Data as on 6th November 2021

PL PMS - Multi Asset Dynamic Portfolio 22
Monetary meter for Debt Valuations
Monetary meter indicates quantifies the steepness of the yield curve and the liquidity in the markets. Since the economic
data comes with a lag, we replace the lagged data with data available at higher frequency. For example, we take change in
crude price as proxy for current account balance, and change in money supply as a proxy for inflation. The indicator is
updated monthly.
Data as on 6th November 2021

PL PMS - Multi Asset Dynamic Portfolio 23
Cyclometers: Capturing the equity value at the right time
Cyclometer tells us if Nifty 50 index, at any point, is in
Highly overvalued, Overvalued, Fairly Valued,
Undervalued or Deeply undervalued zone. The
indicator is updated daily.
Data as on 15th November 2021

PL PMS - Multi Asset Dynamic Portfolio 24
Relative Value Meter
Relative Value Meter captures the relative attractiveness in terms of risk –reward of investing in mid and smallcaps
compared to large caps. It tells us if Nifty Smallcap 250 index at any point, is in Highly overvalued, Overvalued, Fairly
Valued, Undervalued or Deeply undervalued zone vis a vis Nifty 50 index. The indicator is updated daily.
Data as on 15th November 2021

PL PMS - Multi Asset Dynamic Portfolio 25
Multi Asset Momentum: Capturing Trend
Using an algorithm, we mark a time periods as follows: Invest in domestic equities if the model says assign 59% or more of the weight to Equities. Invest in Fixed income if cumulative weight of G-sec, corporate bonds and liquid funds is more than 45% in the
portfolio Invest in Gold if model says invest 29% or more in Gold Distribute equally, otherwise The left chart shows the zone of investing in different asset classes while the right chart shows the performance of MAM vs. Nifty 50
Data as on 15th November 2021

PL PMS - Multi Asset Dynamic Portfolio 26
Technometer: Technical Risk- Reward
It evaluates Equity Market Cycle – for Domestic and International equity market, from a Technical Risk Reward
Perspective to look for reversals and breakouts using a price data analysis independently.
Technometer
Parameter Domestic Market International
Market
Back-testing 14 Years 14 Years
Buy and Hold Returns 478.5% 781.2%
Technometer Returns 2259.6% 1411.9%
Max Drawdown 26.7% 17.6%
Winning Trades 24 29
Loosing Trades 5 3
Avg Win / Avg Loss 2.422 4.741
Profitability Percentage 82.8% 90.6%
Data as on 15th November 2021

PL PMS - Multi Asset Dynamic Portfolio 27
Sentimeter: Quantifying market sentiment
It captures the sentiment in domestic equity market. Using high frequency market sentiment indicators, we create an index
which gives us bullish and bearish signals. Sentimeter processes canalized data from market valuations, sectoral analysis,
adaptive indicators, international markets, market volatility and euphoria and dequantifies into seamless qualitative outputs
for agile decision making engine.
Data as on 15th November 2021

PL PMS - Multi Asset Dynamic Portfolio 28
Global & Domestic RORO: Risk Appetite
Data as on 15th November 2021
• In crisis events, emerging markets track developed markets closely. Hence, it is important to measure how markets across the globe are behaving.
• For Global RORO, we not only track equity markets, but also debt and commodity markets across the globe. • The indicator comprises of 26 assets, covering emerging & developed market equities, government securities • Negative rolling correlation indicates risk off and positive correlation indicates risk on environment in capital markets
globally.

The strategy generates a CAGR of around 23% based on back-test conducted going back to July 2006 with standard deviation lesser than that of equity asset class.
PERIOD
MULTI ASSET
DYNAMIC PORTFOLIO
NIPPON INDIA NIFTY BEES
NIPPON INDIA
JUNIOR BEES
NIPPON INDIA NIFTY
MIDCAP 150
MOTILAL OSWAL
S&P 500 INDEX FUND
MOTILAL OSWAL
NASDAQ 100 ETF
NIPPON INDIA GOLD BEES
NIPPON INDIA LONG TERM
GILT ETF
BHARAT BOND ETF
- APRIL 2025
NIPPON INDIA
LIQUID BEES
BENCH-MARK
3M 5.87% 9.9% 12.6% 14.4% 5.2% 7.2% 5.3% 1.1% 0.8% 0.6% 6.2%
6M 14.1% 24.4% 23.8% 30.7% 15.6% 26.1% 1.9% 0.9% 3.1% 1.2% 10.9%
1 YR 37.9% 44.0% 52.4% 73.4% 32.0% 37.8% -4.0% 1.9% 5.4% 2.4% 18.6%
CAGR (3Y) 32.0% 20.8% 18.3% 24.9% 15.5% 35.5% 15.5% 8.8% 8.9% 2.9% 16.3%
CAGR (5Y) 26.9% 18.7% 16.5% 19.1% 14.5% 30.5% 9.1% 6.3% 8.0% 3.4% 13.1%
CAGR (7Y) 21.6% 12.7% 13.8% 15.9% 12.4% 24.3% 8.8% 8.2% 8.8% 3.8% 11.3%
CAGR (10Y) 19.2% 14.2% 16.9% 17.4% 16.1% 26.0% 4.3% 8.9% 9.4% 4.5% 10.5%
CAGR (12Y) 18.3% 12.0% 13.5% 14.0% 15.4% 25.1% 8.2% 8.2% 9.0% 4.5% 10.6%
CAGR (15Y) 23.0% 11.2% 13.2% 13.6% 10.5% 19.9% 10.8% 8.0% 9.0% 4.7% 10.9%
Sharpe Ratio (3Y) 2.30 0.66 0.57 0.91 0.42 1.12 0.67 0.65 1.37 1.13
Standard Deviation (3Y)
11.3% 22.3% 21.4% 20.7% 22.6% 26.3% 14.2% 4.4% 2.1% 0.1% 9.1%
Note: Back-tested results of Quant Model & not actual returns. Above returns are only for understating purpose and there is no assurance or guarantee that the objectives of the investment will be achieved as investment in Securities is subject to market risk. Returns net of management fees, performance fees ,transaction costs. and other expenses. Impact cost not included. Data as on 15th November 2021. Benchmark = 80% 50:50 Crisil Hybrid Moderate Index + 20% Gold
PL PMS - Multi Asset Dynamic Portfolio 29
Performance

Note: Back-tested results of Quant Model & not actual returns. Above returns are only for understating purpose and there is no assurance or guarantee that the objectives of the investment will be achieved as investment in Securities is subject to market risk. Returns net of management fees, performance fees ,transaction costs. and other expenses. Impact cost not included.
PL PMS - Multi Asset Dynamic Portfolio 30
Inflation-Beating Alpha
YEAR YoY
INFLATION% 1 Yr FD RATE BENCHMARK MADP
1 Yr FD RATE (Inflation Adjusted)
MADP (Inflation Adjusted)
Alpha due to tactical rotation
(MADP – Benchmark)
2007 6.2% 8.4% 30.1% 35.4% 2.2% 27.0% 5.4%
2008 8.0% 8.4% -19.9% 22.9% 0.4% 14.5% 42.7%
2009 10.3% 6.5% 36.6% 86.6% -3.8% 80.1% 50.0%
2010 11.4% 8.6% 14.3% 15.6% -2.8% 7.0% 1.3%
2011 8.5% 9.1% -1.0% 4.6% 0.6% -4.5% 5.6%
2012 8.9% 8.9% 18.1% 20.6% 0.0% 11.7% 2.5%
2013 10.5% 9.0% -1.6% 7.3% -1.5% -1.7% 8.9%
2014 6.5% 8.6% 19.8% 20.8% 2.1% 12.2% 1.0%
2015 4.8% 7.4% 1.8% 0.7% 2.6% -6.7% -1.1%
2016 4.8% 6.9% 9.7% 15.9% 2.1% 9.0% 6.2%
2017 3.3% 6.6% 16.5% 27.7% 3.3% 21.1% 11.2%
2018 3.9% 6.8% 4.5% 13.1% 2.9% 6.3% 8.6%
2019 3.6% 5.6% 12.6% 21.6% 2.0% 16.0% 9.0%
2020 6.4% 5.2% 19.3% 49.4% -1.2% 44.2% 30.1%

Asset classes are represented by underlying ETFs. Return is the average annualized pre-tax returns for the last 3 years and till 15th November 2021. Risk is the annualized std deviation of daily returns for the last 3 years and till 15th November 2021 Note: Back-tested results of Quant Model & not actual returns. Above returns are only for understating purpose and there is no assurance or guarantee that the objectives of the investment will be achieved as investment in Securities is subject to market risk. Returns net of management fees, performance fees ,transaction costs. and other expenses. Impact cost not included. Data as on 15th November 2021. Benchmark = 80% 50:50 Crisil Hybrid Moderate Index + 20% Gold
PL PMS - Multi Asset Dynamic Portfolio 31
Higher Returns with Lower Risks than Equities

PL PMS - Multi Asset Dynamic Portfolio 32
Monthly Returns
Note: Back-tested results of Quant Model & not actual returns. Above returns are only for understating purpose and there is no assurance or guarantee that the objectives of the investment will be achieved as investment in Securities is subject to market risk. Returns net of management fees, performance fees ,transaction costs. and other expenses. Impact cost not included. Data as on 15th November 2021. Benchmark = 80% 50:50 Crisil Hybrid Moderate Index + 20% Gold
Year Jan Feb Mar Apr May Jun Jul Aug Sep Oct Nov Dec Yearly
Returns
2007 1.0% -0.7% 0.6% 6.1% 4.5% 3.8% 1.4% 2.5% 4.7% 3.9% 0.3% 2.9% 35.4%
2008 1.7% 2.4% -2.6% 7.6% 1.7% -1.3% 0.3% 4.1% 3.5% -5.9% 2.8% 7.2% 22.9%
2009 0.9% -9.1% 10.5
% 13.2% 25.9% 2.0% 6.9% 1.6% 7.9% -1.9% 8.6% 1.6% 86.6%
2010 -4.1% 3.8% 2.4% 2.4% -0.1% 0.8% 0.5% 1.1% 7.5% 0.9% -0.8% 0.4% 15.6%
2011 -2.6% 0.3% 1.9% 2.3% -0.3% -0.9% 1.5% 3.7% -1.2% 2.6% -1.6% -1.0% 4.6%
2012 7.9% 4.9% 1.0% -1.3% -0.4% 1.2% 0.8% 1.2% 1.6% -1.8% 3.4% 0.8% 20.6%
2013 0.6% -3.1% 1.4% -1.6% 1.2% 0.0% 0.0% 5.7% -3.2% 2.8% 0.8% 2.9% 7.3%
2014 -4.7% 2.9% -1.5% -0.7% 9.2% 6.7% -1.0% 2.4% 2.3% 0.9% 2.0% 1.2% 20.8%
2015 2.0% -0.4% -1.3% 0.3% 2.2% -3.2% -1.9% 1.9% -0.1% 1.4% 0.9% -0.7% 0.7%
2016 0.0% 5.8% 1.2% 1.1% 1.7% 3.4% 4.9% 2.1% -0.3% 1.2% -4.6% -1.5% 15.9%
2017 5.6% 3.7% 2.7% 3.1% -0.2% 0.1% 4.3% -0.6% -0.7% 5.7% -0.2% 1.5% 27.7%
2018 3.2% 1.3% 0.9% 2.4% -1.5% -1.2% 3.4% 2.5% -0.1% 0.9% 0.8% 0.0% 13.1%
2019 -1.3% 0.9% 4.8% -0.7% -0.4% 2.6% 2.1% 4.1% 1.5% 4.8% 1.2% 0.5% 21.6%
2020 2.1% 1.7% -0.6% 6.4% -0.8% 7.9% 4.2% 4.4% 0.3% -0.2% 11.5% 4.5% 49.4%
2021 -0.6% 10.1% -2.7% 2.2% 4.6% 0.4% 1.4% 2.1% 0.8% 1.4% NA NA 21.4%

PL PMS - Multi Asset Dynamic Portfolio 33
Monthly Relative Performance vs. Benchmark
Note: Back-tested results of Quant Model & not actual returns. Above returns are only for understating purpose and there is no assurance or guarantee that the objectives of the investment will be achieved as investment in Securities is subject to market risk. Returns net of management fees, performance fees ,transaction costs. and other expenses. Impact cost not included. Data as on 15th November 2021. Benchmark = 80% 50:50 Crisil Hybrid Moderate Index + 20% Gold
Year Jan Feb Mar Apr May Jun Jul Aug Sep Oct Nov Dec Yearly
Returns
2007 -0.5% 3.2% -0.1% 3.4% 2.5% 2.6% -1.9% 3.1% -3.0% -3.3% -0.3% -1.9% 5.4%
2008 6.4% 1.2% 3.3% 4.0% 2.6% 7.4% -3.2% 4.3% 5.5% 7.6% 3.8% -1.4% 42.7%
2009 1.0% -7.1% 6.2% 6.7% 14.1% 1.7% 4.0% 0.6% 3.6% 0.1% 1.7% 2.8% 50.0%
2010 -1.9% 1.3% 1.9% 0.5% -0.5% -1.5% 0.9% -1.2% 2.8% 0.9% -1.5% -0.3% 1.3%
2011 2.2% -1.2% -0.3% 0.9% 0.1% -0.4% -0.1% 2.0% 1.0% -1.5% -1.5% 4.3% 5.6%
2012 1.1% 3.8% 1.1% -2.1% 1.3% -2.1% 0.5% 0.2% -2.7% -0.9% 1.0% 1.0% 2.5%
2013 0.4% -0.6% 1.6% -1.4% 0.0% 2.6% 0.7% 3.5% -1.9% -1.2% 2.2% 2.9% 8.9%
2014 -4.7% 0.2% -2.9% -1.4% 5.9% 2.1% -0.9% 1.0% 2.5% -0.7% -0.7% 1.0% 1.0%
2015 -1.7% -0.8% 0.6% 1.3% 0.3% -2.9% -2.0% 2.6% -0.1% 0.2% 2.1% -0.7% -1.1%
2016 0.6% 4.5% -1.1% -0.9% 1.0% -0.4% 2.4% 1.3% -0.4% 1.2% -2.2% -0.2% 6.2%
2017 1.9% 2.7% 1.0% 0.6% -1.7% -0.1% 1.3% -0.9% -0.2% 3.5% 0.4% -0.1% 9.5%
2018 1.4% 3.6% 0.8% 0.1% -1.1% -0.5% 0.9% 0.6% 2.7% 1.7% -0.7% -1.8% 8.6%
2019 -1.8% 0.9% 2.0% -0.6% -2.3% 1.2% 3.3% 1.9% 1.0% 1.9% 0.8% -0.4% 9.0%
2020 1.2% 2.9% 7.2% -1.0% -1.2% 3.4% -0.9% 3.9% 0.6% -1.3% 7.1% 1.0% 30.1%
2021 0.5% 7.5% -1.7% 0.7% 0.5% -0.4% 0.3% -0.7% -0.3% 0.4% NA NA 7.3%

PL PMS - Multi Asset Dynamic Portfolio 34
Monthly Relative Performance vs. Nifty
Note: Back-tested results of Quant Model & not actual returns. Above returns are only for understating purpose and there is no assurance or guarantee that the objectives of the investment will be achieved as investment in Securities is subject to market risk. Returns net of management fees, performance fees ,transaction costs. and other expenses. Impact cost not included. Data as on 15th November 2021. Benchmark = 80% 50:50 Crisil Hybrid Moderate Index + 20% Gold
Year Jan Feb Mar Apr May Jun Jul Aug Sep Oct Nov Dec Yearly
Returns
2007 0.1% 7.7% -2.1% -1.0% -0.5% 3.1% -3.5% 3.8% -8.8% -12.4% 2.6% -3.7% -17.4%
2008 18.1% 0.6% 6.8% -1.4% 7.3% 18.6% -11.1% 3.3% 13.8% 20.9% 9.9% -3.2% 74.8%
2009 3.5% -0.4% -4.6% -1.7% -2.1% 4.3% 1.0% 1.0% -1.2% 5.4% 0.0% 0.0% 12.0%
2010 2.1% -0.4% -0.8% 1.8% 3.4% -2.8% -1.8% 0.4% -6.2% 2.9% 0.2% -2.5% -3.2%
2011 7.6% -0.3% -3.5% 3.7% 2.8% -2.5% 3.9% 12.3% 0.0% -5.2% 5.7% 5.3% 28.5%
2012 -4.7% 1.8% 3.9% -0.4% 5.4% -6.5% 1.6% 0.5% -7.2% -0.1% -1.2% 0.4% -6.4%
2013 -1.6% 2.1% 3.3% -6.0% -0.2% 1.2% 2.4% 10.3% -9.0% -6.2% 2.8% 0.8% 0.7%
2014 -1.3% 0.7% -8.1% -0.6% 1.1% 0.8% -2.5% -0.7% 2.4% -3.9% -0.7% 4.4% -10.5%
2015 -4.3% -1.7% 4.2% 3.9% -1.0% -3.8% -3.1% 8.4% 0.1% -0.1% 2.2% -0.6% 4.8%
2016 4.9% 8.4% -4.1% -0.3% -2.4% 1.0% 1.1% 0.3% 1.7% 0.8% 0.6% -1.4% 12.0%
2017 1.1% -0.3% -0.5% 0.3% -3.7% 0.8% -1.8% 0.9% 0.6% 0.0% 1.8% -2.5% -4.0%
2018 -1.6% 6.3% 4.0% -3.7% -1.7% -1.3% -2.8% -0.5% 5.6% 6.4% -4.0% 0.1% 8.5%
2019 -1.1% 0.4% -2.3% -1.8% -2.0% 2.8% 8.1% 4.7% -1.6% 0.1% -0.3% -0.4% 8.1%
2020 3.8% 8.6% 22.1% -8.3% 1.9% -1.0% -2.1% 1.4% 0.1% -2.6% -0.9% -2.2% 33.6%
2021 1.9% -1.9% 0.8% 2.5% -2.1% -0.7% 1.0% -6.7% -1.7% 0.4% NA NA -9.6%

Note: Back-tested results of Quant Model & not actual returns. Above returns are only for understating purpose and there is no assurance or guarantee that the objectives of the investment will be achieved as investment in Securities is subject to market risk. Returns net of management fees, performance fees ,transaction costs. and other expenses. Impact cost not included. Data as on 15th November 2021. Benchmark = 80% 50:50 Crisil Hybrid Moderate Index + 20% Gold
35
Rolling Best and Worst Performance
Performance MADP Benchmar
k
NIPPON INDIA NIFTY BEES
ICICI PRU NEXT 50
ETF
NIPPON INDIA NIFTY
MIDCAP 150
MOTILAL OSWAL
SMALLCAP 250 INDEX FUND
MOTILAL OSWAL
S&P 500 INDEX FUND
MOTILAL OSWAL
NASDAQ 100 ETF
NIPPON INDIA GOLD BEES
NIPPON INDIA LONG TERM
GILT ETF
BHARAT BOND ETF
- APRIL 2025
NIPPON INDIA
LIQUID BEES
Asset Class Wise
3 Years CAGR
Best 47.7% 22.4% 27.8% 41.7% 36.9% 35.5% 31.7% 37.2% 34.8% 14.5% 11.9% 6.0%
Worst 7.3% 3.9% -4.7% -6.0% -11.2% -17.9% -10.0% -1.1% -8.3% 2.1% 7.2% 2.9%
Median 16.5% 9.9% 9.6% 12.6% 12.1% 8.2% 11.8% 21.4% 10.6% 8.2% 9.2% 4.6%
Average 21.4% 10.3% 10.0% 12.8% 11.8% 8.8% 11.9% 20.5% 10.8% 8.3% 9.3% 4.8%
5 Years CAGR
Best 35.1% 15.5% 19.8% 27.9% 24.6% 25.3% 26.9% 33.8% 27.6% 11.4% 11.2% 5.8%
Worst 9.7% 5.4% -1.2% -1.0% -2.4% -7.7% -3.2% 5.9% -3.9% 3.9% 8.0% 3.4%
Median 15.8% 9.5% 10.3% 12.6% 11.2% 9.8% 13.3% 22.0% 7.4% 8.6% 9.3% 5.1%
Average 19.1% 9.9% 9.8% 12.9% 11.8% 9.3% 13.1% 21.1% 9.3% 8.4% 9.3% 4.9%
Time period Wise
3 Years CAGR
Best 47.7% 14.7% 13.7% 18.9% 19.3% 13.6% -5.0% 5.4% 19.5% 8.6% 9.5% 4.7%
Worst 7.3% 4.7% -1.0% -4.4% -9.1% -14.1% 26.5% 29.8% 13.0% 6.8% 8.0% 6.0%
5 Years CAGR
Best 35.1% 13.8% 13.7% 18.2% 17.8% 14.1% 0.1% 10.0% 19.6% 7.6% 8.5% 5.2%
Worst 9.7% 7.1% 5.3% 7.9% 6.3% 4.9% 19.9% 25.8% 4.7% 9.0% 9.3% 5.8%

The chart below shows the time periods of model being overweight and underweight in equities. The grey areas show the times when the model had more than 60% into equities (including International Equities). The blue areas show when the model has less 30% exposure into equities.
MADP Portfolio protects you from the Equity Down-Cycles and participates in the Equity Up-Cycles
Note: Back-tested results of Quant Model & not actual returns. Above returns are only for understating purpose and there is no assurance or guarantee that the objectives of the investment will be achieved as investment in Securities is subject to market risk. Returns net of management fees, performance fees ,transaction costs. and other expenses. Impact cost not included. Data as on 15th November 2021. Benchmark = 80% 50:50 Crisil Hybrid Moderate Index + 20% Gold
PL PMS - Multi Asset Dynamic Portfolio 36
Entry & Exit out of Equities

Note: Back-tested results of Quant Model & not actual returns. Above returns are only for understating purpose and there is no assurance or guarantee that the objectives of the investment will be achieved as investment in Securities is subject to market risk. Returns net of management fees, performance fees ,transaction costs. and other expenses. Impact cost not included. Data as on 15th November 2021. Benchmark = 80% 50:50 Crisil Hybrid Moderate Index + 20% Gold
PL PMS - Multi Asset Dynamic Portfolio 37
Examples of Timely Protection & Participation
Time Period
Large Cap
Mid cap US
Equities Gold
Gilt funds
Corporate
bonds MADP
7-Sep-07 Allocation 10.0% 0.0% 5.0% 35.0% 15.0% 32.0%
Performance 5.1% 2.0% -7.8% 27.1% 3.9% 5.7% 10.9%
9-Apr-08 Allocation 40.0% 30.0% 15.0% 5.0% 0.0% 10.0%
Performance 8.1% 11.0% 10.5% -0.8% 0.9% 0.8% 8.5%
7-May-08 Allocation 10.0% 0.0% 5.0% 35% 15.0% 32.0%
Performance -13.3% -20.5% -4.9% 7.8% -4.9% -2.3% 0.3%
24-Jul-08
Allocation 40.0% 30.0% 15.0% 5.0% 0.0% 10.0%
Performance 2.1% 5.2% 3.2% -5.0% 0.3% 0.5% 3.2%
7-Aug-08 Allocation 10.0% 0.0% 5.0% 35% 15.0% 32.0%
Performance -35.7% -42.2% -20.9% 17.9% 21.2% 10.7% 7.8%
9-Feb-09 Allocation 40.0% 30.0% 15.0% 5.0% 0.0% 10.0%
Performance 79.1% 130.8% 38.1% 18.1% -0.4% 11.2% 67.5%
5-May-10 Allocation 17.0% 0.0% 8.0% 30.0% 30.0% 15.0%
Time Period
Large Cap
Mid cap US
equities Gold
Gilt funds
Corporate
bonds MADP
9-Nov-18 Allocation 40% 30.0% 15.0% 5.0% 0.0% 10.0%
Performance 11.1% 0.9% 7.8% -1.6% 6.3% 5.0% 5.5%
7-May-19
Allocation 10.0% 0.0% 5.0% 35.0% 15.0% 32.0%
Performance -5.8% -9.2% 2.4% 23.0% 7.9% 4.7% 10.0%
22-Aug-19
Allocation 40% 30.0% 15.0% 5.0% 0.0% 10.0%
Performance 13.2% 21.0% 20.6% 3.7% 2.7% 4.1% 13.5%
6-Feb-20 Allocation 10.0% 0.0% 5.0% 35.0% 10.0% 40.0%
Performance -24.9% -28.8% -5.9% 13.0% 0.5% 1.9% 1.0%
9-Apr-20 Allocation 40% 30.0% 15.0% 5.0% 0.0% 10.0%
Performance 65.2% 90.8% 50.1% -3.1% 6.0% 5.8% 52.6%
22-Jun-21
Allocation 26.0% 10.0% 14.0% 20.0% 4.0% 20.0%
Global Financial Crisis Covid-19 Crash

₹ Capital Growth in 15 years
MADP ₹ 26.4x
Nasdaq 100 ₹ 16.9x
Mid Cap ₹ 8.7x
Large Cap ₹6.1x
Gold ₹ 4.6x
Corporate Bonds ₹ 3.7x
Gilt Funds ₹ 3.2x
Note: Back-tested results of Quant Model & not actual returns. Above returns are only for understating purpose and there is no assurance or guarantee that the objectives of the investment will be achieved as investment in Securities is subject to market risk. Returns net of management fees, performance fees ,transaction costs. and other expenses. Impact cost not included. Data as on 15th November 2021. Benchmark = 80% 50:50 Crisil Hybrid Moderate Index + 20% Gold
PL PMS - Multi Asset Dynamic Portfolio 38
Performance Trajectory of MADP

Note: Back-tested results of Quant Model & not actual Standard deviations.
PL PMS - Multi Asset Dynamic Portfolio 39
Risk Analysis
1 Year rolling daily standard deviation is higher for all other assets and MADP stands at lowest volatility delivering stable higher risk adjusted returns.
Associated Risks
• Risks of underperformance: There is a risk of
underperformance of quantitative strategies
underperforming the broader markets in shorter or
medium horizon, especially during the period of
exuberance or FOMO buying in capital markets
• Higher transaction charges: Since the rebalance is
only carried out when the meters trigger rebalance,
there could be frequent rebalances in certain time
periods. The higher turnover leads to higher
transactions charges such as brokerage and
impact cost.
• Tax Inefficiency: Being a tactical strategy, the
average holding period of each asset class is
mostly lesser than 1 year, that attracts short term
capital gain tax.

PL PMS - Multi Asset Dynamic Portfolio 40
Effective Rebalances
Note: Back-tested results of Quant Model & not actual returns. Above returns are only for understating purpose and there is no assurance or guarantee that the objectives of the investment will be achieved as investment in Securities is subject to market risk. Returns net of management fees, performance fees ,transaction costs. and other expenses. Impact cost not included. Data as on 22nd October. Benchmark = 80% 50:50 Crisil Hybrid Moderate Index + 20% Gold
The portfolio is rebalanced only when the model triggers change in allocation by more than 9% in atleast 3 asset classes. This rule is incorporated to avoid unnecessary rebalances in the portfolio unless the model is indicating a drastic change in allocations. The back test indicates 50 such rebalances in the past 15 years. Due to this rule, the portfolio often takes tectonic rotation between the asset classes to fully utilize the opportunities.

A Universal Strategy
That Deserves a Place in
Every Portfolio
Invests in only liquid ETFs
Takes care of diversification in
one portfolio
Fit for all categories of risk profiles
Market Cycle Agnostic
Zero Entry & Exit load
PL PMS - Multi Asset Dynamic Portfolio 41
A Universal Strategy That Deserves a Place in Every Portfolio
An all season product

PL PMS - Multi Asset Dynamic Portfolio 42
Taxation for MADP
Fund type ETFs/ Index Funds Holding Period Short-term
capital gains Long-term
capital gains Set Off Rules
Equity funds/ shares
Nippon India Nifty Bees ETF Nippon India Junior Bees ETF Nippon India Midcap 150 ETF
Less than 12 months – ST
More than 12 months – LT
15% Up to Rs 1 lakh
– Nil Above Rs 1 lakh – 10%
1. Long term capital loss can be set off against long term capital gains only. 2. Short term capital loss can be set off against short term capital gains or long term capital gains. 3. Unadjusted Capital Loss can be carried forward for 8 years. 4. The tax is deducted at the end of the financial year when the investor files for taxes and not when the gain or loss is realized.
Debt funds/ securities
Bharat Bond 2025 ETF Bharat Bond 2023 ETF Nippon India Gilt ETF
ICICI Constant Maturity Fund Nippon India Liquid Bees ETF
Less than 36 months – ST
More than 36 months – LT
Taxed at the investor’s
income tax slab rate
20% with Indexation
Gold Nippon India Gold Bees ETF
Less than 36 months – ST
More than 36 months – LT
Taxed at the investor’s
income tax slab rate
20% with Indexation
International funds
Motilal Oswal Nasdaq 100 ETF Motilal Oswal S&P 500 Index Fund
Less than 36 months – ST
More than 36 months – LT
Taxed at the investor’s
income tax slab rate
20% with Indexation

In the tax efficient Portfolio, we invest in Arbitrage Funds instead of Fixed income funds. For simplification purpose, the returns from Arbitrage funds are taken same as
liquids fund returns.
Note: Back-tested results of Quant Model & not actual returns. Above returns are only for understating purpose and there is no assurance or guarantee that the objectives of the investment will be achieved as investment in Securities is subject to market risk. Returns net of management fees, performance fees ,transaction costs. and other expenses. Impact cost not included. Data as on 15th November 2021. Benchmark = 80% 50:50 Crisil Hybrid Moderate Index + 20% Gold
PL PMS - Multi Asset Dynamic Portfolio 43
Performance of Tax Efficient Portfolio
YEAR QUANTIFI ETF BASED MADP
FUND
NIPPON INDIA NIFTY BEES
ICICI PRU NEXT 50
ETF
NIPPON INDIA NIFTY
MIDCAP 150
MOTILAL OSWAL
SMALLCAP 250 INDEX FUND
MOTILAL OSWAL
S&P 500 INDEX FUND
MOTILAL OSWAL
NASDAQ 100 ETF
NIPPON INDIA GOLD BEES
NIPPON INDIA LONG TERM
GILT ETF
BHARAT BOND ETF - APRIL 2025
NIPPON INDIA
LIQUID BEES
BENCHMARK
2007 33.9% 52.9% 75.7% 76.9% 94.9% -7.5% 6.5% 17.4% 6.6% 6.8% 6.4% 30.1%
2008 15.3% -51.9% -63.5% -59.4% -69.1% -24.2% -27.9% 25.6% 22.8% 13.7% 6.6% -19.9%
2009 85.5% 74.6% 127.9% 99.0% 113.9% 17.9% 47.6% 22.7% -4.9% 8.0% 2.8% 36.6%
2010 15.0% 18.8% 17.8% 19.2% 16.3% 8.9% 15.7% 21.7% 6.0% 9.5% 4.1% 14.3%
2011 6.2% -23.9% -31.9% -31.0% -36.0% 18.3% 23.4% 30.3% 5.8% 5.2% 6.1% -1.0%
2012 17.9% 27.0% 48.1% 39.2% 38.2% 17.4% 17.4% 10.9% 11.4% 11.7% 6.0% 18.1%
2013 8.0% 6.6% 4.8% -5.1% -9.5% 46.6% 54.9% -14.1% 2.9% 6.8% 6.0% -1.6%
2014 17.6% 31.2% 44.4% 55.9% 69.6% 12.3% 22.6% 0.8% 16.3% 13.4% 6.0% 19.8%
2015 -0.8% -4.1% 7.0% 6.5% 9.6% 5.0% 13.5% -7.8% 8.2% 9.1% 5.0% 1.8%
2016 13.6% 3.9% 7.1% 7.1% -0.4% 9.4% 8.1% 10.7% 15.5% 11.1% 4.5% 9.7%
2017 25.2% 30.0% 44.8% 47.3% 57.1% 11.4% 22.2% 2.9% 1.1% 6.8% 4.0% 16.5%
2018 10.9% 4.6% -8.8% -15.4% -27.6% 0.7% 5.6% 6.9% 7.3% 7.5% 4.2% 4.5%
2019 18.6% 13.5% 1.4% 0.0% -7.8% 33.0% 41.6% 22.9% 11.1% 10.0% 3.7% 12.6%
2020 46.6% 15.8% 14.8% 25.3% 25.9% 0.5% 51.5% 26.2% 11.1% 10.4% 2.5% 19.3%
2021 YTD 21.6% 31.0% 37.4% 52.9% 60.0% 27.7% 29.3% -2.6% 1.1% 4.6% 2.1% 14.1%
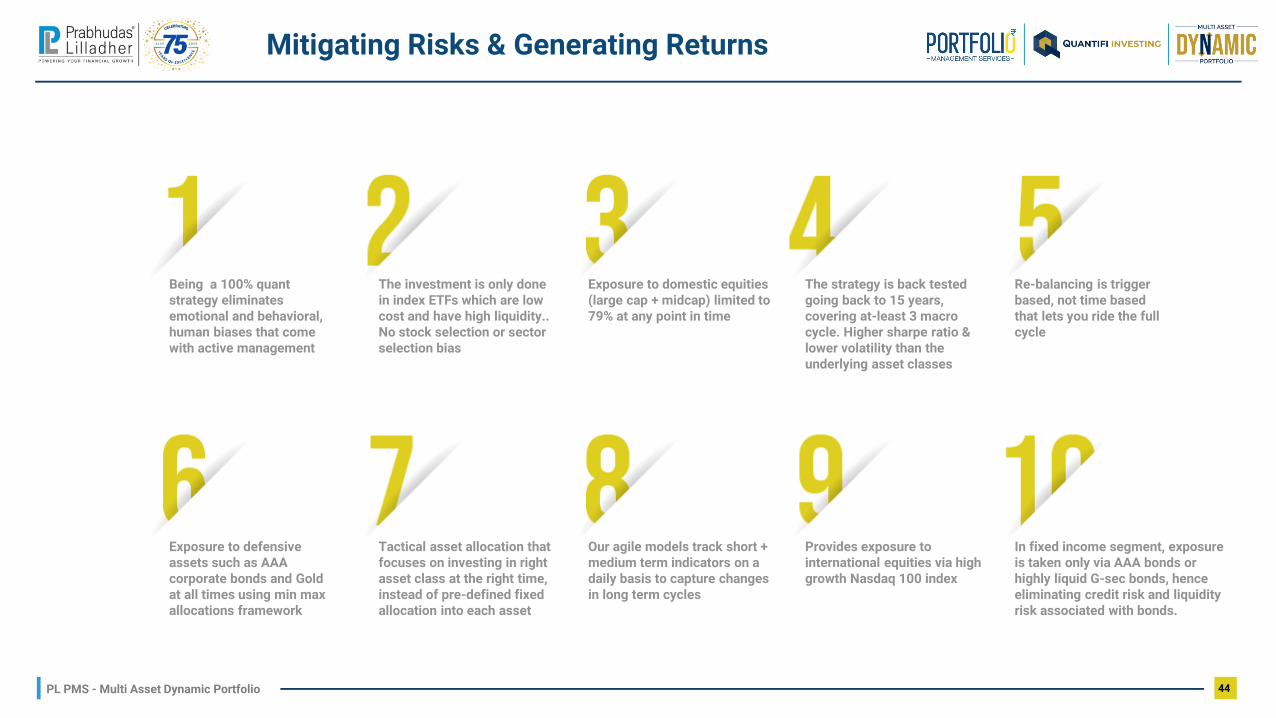
Being a 100% quant strategy eliminates emotional and behavioral, human biases that come with active management
The investment is only done in index ETFs which are low cost and have high liquidity.. No stock selection or sector selection bias
Exposure to domestic equities (large cap + midcap) limited to 79% at any point in time
The strategy is back tested going back to 15 years, covering at-least 3 macro cycle. Higher sharpe ratio & lower volatility than the underlying asset classes
Re-balancing is trigger based, not time based that lets you ride the full cycle
Exposure to defensive assets such as AAA corporate bonds and Gold at all times using min max allocations framework
Tactical asset allocation that focuses on investing in right asset class at the right time, instead of pre-defined fixed allocation into each asset
Our agile models track short + medium term indicators on a daily basis to capture changes in long term cycles
Provides exposure to international equities via high growth Nasdaq 100 index
In fixed income segment, exposure is taken only via AAA bonds or highly liquid G-sec bonds, hence eliminating credit risk and liquidity risk associated with bonds.
PL PMS - Multi Asset Dynamic Portfolio 44
Mitigating Risks & Generating Returns

Why Invest in our
Tactical Multi
Asset Products?
Protection
Growth
Stability
Consistency
Reliability
Sustainability
PL PMS - Multi Asset Dynamic Portfolio 45
Why Invest in our Tactical Multi Asset Products?

PL PMS - Multi Asset Dynamic Portfolio 46
Fee Plans
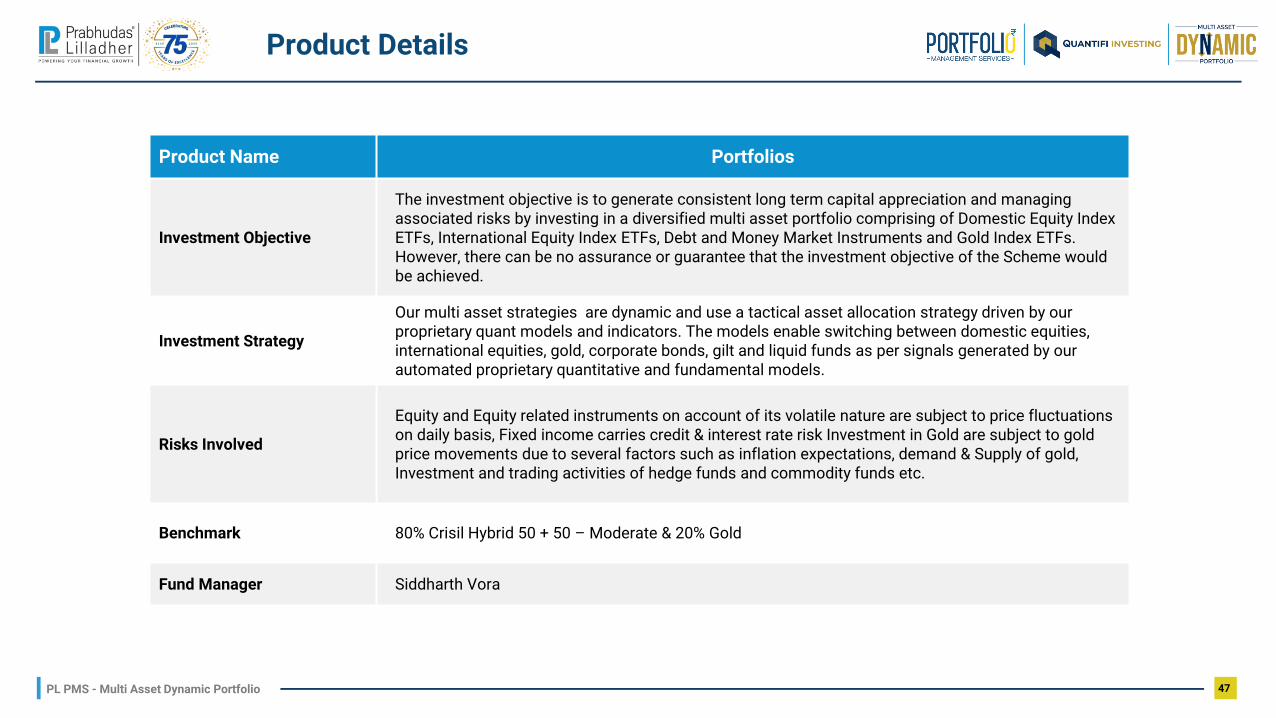
Product Name Portfolios
Investment Objective
The investment objective is to generate consistent long term capital appreciation and managing associated risks by investing in a diversified multi asset portfolio comprising of Domestic Equity Index ETFs, International Equity Index ETFs, Debt and Money Market Instruments and Gold Index ETFs. However, there can be no assurance or guarantee that the investment objective of the Scheme would be achieved.
Investment Strategy
Our multi asset strategies are dynamic and use a tactical asset allocation strategy driven by our proprietary quant models and indicators. The models enable switching between domestic equities, international equities, gold, corporate bonds, gilt and liquid funds as per signals generated by our automated proprietary quantitative and fundamental models.
Risks Involved
Equity and Equity related instruments on account of its volatile nature are subject to price fluctuations on daily basis, Fixed income carries credit & interest rate risk Investment in Gold are subject to gold price movements due to several factors such as inflation expectations, demand & Supply of gold, Investment and trading activities of hedge funds and commodity funds etc.
Benchmark 80% Crisil Hybrid 50 + 50 – Moderate & 20% Gold
Fund Manager Siddharth Vora
PL PMS - Multi Asset Dynamic Portfolio 47
Product Details

Amisha Vora is a Joint Managing Director and a key shareholder of the Prabhudas Lilladher Group (www.plindia.com). She is one of the leading women entrepreneurs in India today. A highly-sought opinion maker in the equity markets, she regularly features on leading business channels such as CNBC and ET Now for her views and insights.
AMISHA VORA
Joint Managing Director Prabhudas Lilladher Group
Over 20 + plus years of senior management experience in Financial markets with leading industry players. In depth understating of equities, an exceptional communicator with client first approach who believes that the transparent relationships are of utmost importance.
NUPUR PATEL
Principal Officer & Head PMS Sales & Marketing
Siddharth Vora is a Fund Manager with PL PMS and heads Investment Research & Product Strategy at Prabhudas Lilladher. He leads the Multi Asset & Equity Quant Investment Strategies.
A CA, CFA and an MSc (Management in Business Excellence) from the University of Warwick, UK, he is a SEBI-registered Research Analyst and Investment Advisor.
SIDDHARTH VORA
Ritika Chhabra is a Quant Portfolio Strategist at Prabhudas Lilladher. Ritika has obtained her Masters in Economics from IGIDR, Mumbai and B.Tech in Industrial Engineering from NIT Jalandhar. She has an experience of 7 years in Capital Markets covering equities as well as debt markets. Previously, she has worked with HSBC Global Research as Equity Strategy Analyst covering emerging markets.
RITIKA CHHABRA
Fund Manager & Head Quant Investment Strategies– PL PMS
Quant Portfolio Strategist Multi Asset Products
PL PMS - Multi Asset Dynamic Portfolio 48
Meet our Team
PL PMS - Multi Asset Dynamic Portfolio 49
Data Partners

Strategy may invest substantially in equity, debt, gold and international securities.. Equity securities and equity related securities are volatile and proven to price
fluctuations. The liquidity of investments made in the portfolio may be restricted by trading volumes and settlement periods. Settlement period may be extended
significantly by unforeseen circumstances. The inability of the portfolio to make intended securities purchase due to settlement problems could cause the portfolio
miss certain investment opportunities. Similarly, the inability to sell securities, held in the strategies portfolio may result, at times, in potential losses to the strategy,
should there be a subsequent decline in the value of securities held in the strategies portfolio. Investment in Securities is subject to market risk and there is no
assurance or guarantee that the objectives of the investment will be achieved, as with investment in securities, the value of portfolio may go up or down depending
upon the factors and forces affecting in capital market and the portfolio manages is not responsible or liable for the losses resulting from the operations of the
portfolio. Investments in equity and equity related securities involve a degree of risk and investors should not invest in the strategy unless they can afford to take the
risk of losing their investment. performance related information is not verified by SEBI.
PL PMS - Multi Asset Dynamic Portfolio 50
Disclaimer / Disclosures

CORPORATE OFFICE :
Prabhudas Lilladher Pvt. Ltd. 3rd Floor, Sadhana House, 570, P. B. Marg, Behind Mahindra Tower, Worli, Mumbai – 400 018. India.
+91 22 6632 2350
+91 98210 97856
[email protected] [email protected] www.plindia.com/QuantifiMADP
Co
nta
ct
Us