Embed Size (px)
Citation preview
Muge TianYanlei XuBen Hier
Mohamed Ibrahim
November 29, 2007
2
Agenda
Company Overview Macroeconomic Outlook Industry Competitors Recent Developments Portfolio Position DCF Valuation Comparable Multiple Valuation Recommendation
3
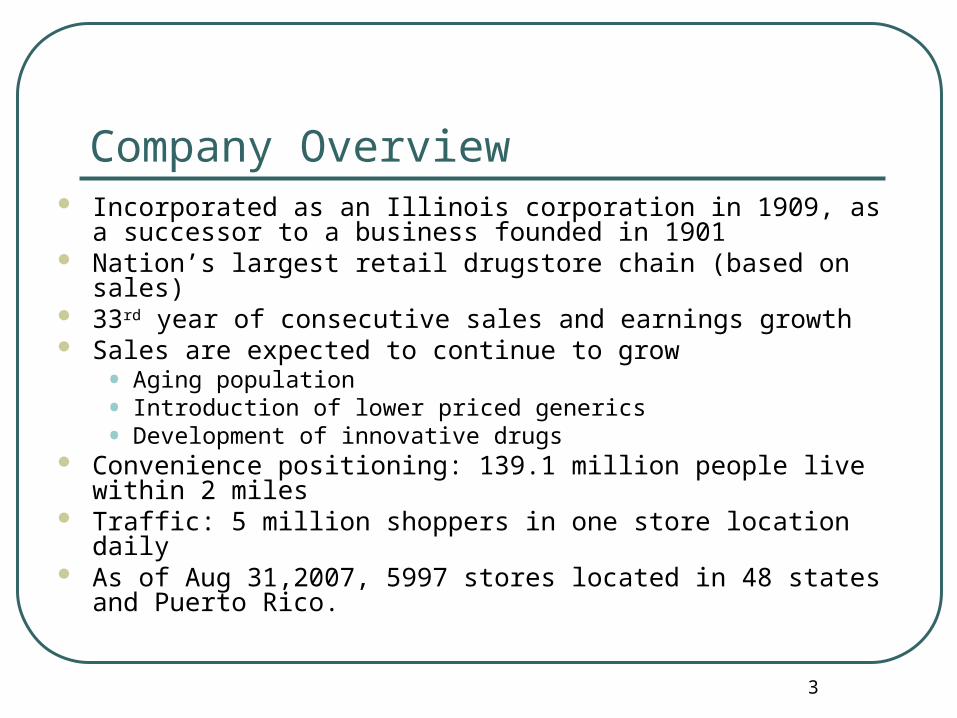
Company Overview Incorporated as an Illinois corporation in 1909, as a successor to a
business founded in 1901 Nation’s largest retail drugstore chain (based on sales) 33rd year of consecutive sales and earnings growth Sales are expected to continue to grow
• Aging population• Introduction of lower priced generics• Development of innovative drugs
Convenience positioning: 139.1 million people live within 2 miles Traffic: 5 million shoppers in one store location daily As of Aug 31,2007, 5997 stores located in 48 states and Puerto
Rico.

4
Prescription Drugs
Non-Prescription Drugs
Beauty Care
Personal Care
Household Items
Photofinishing
Greeting Cards
Candy
Seasonal Items
Convenience Foods
Walgreens’ Business
Walgreens

5
Product Class
Percentage
2007 2006 2005
Prescription Drugs 65 64 64
Non-Prescription Drugs 10 11 11
General Merchandise 25 25 25
Total Sales 100 100 100
6
2010~2011
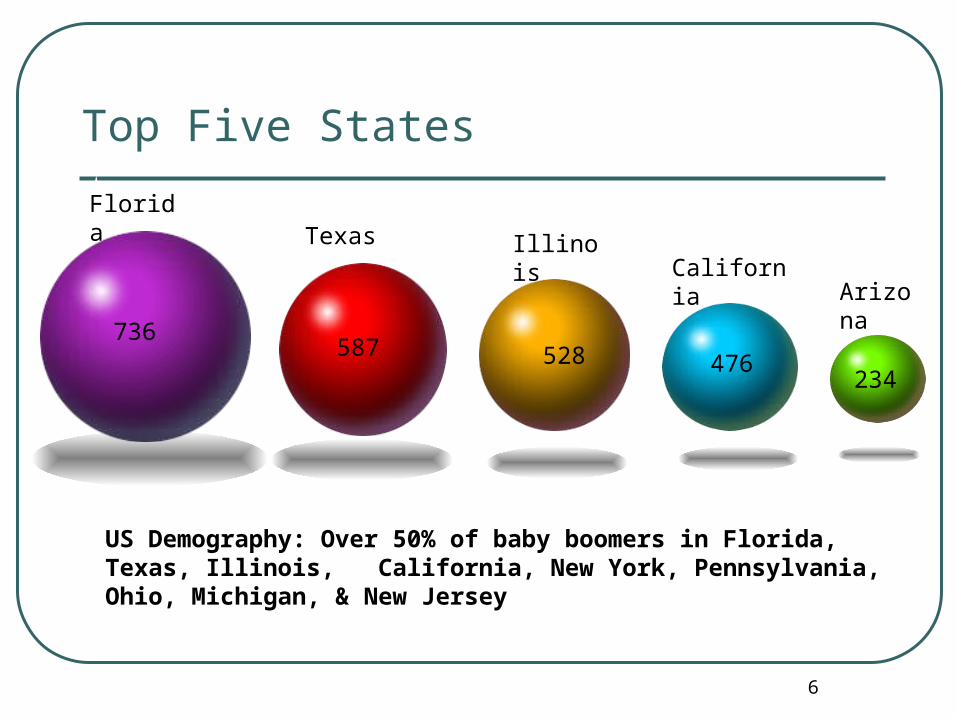
587
California
Florida
528
US Demography: Over 50% of baby boomers in Florida, Texas, Illinois, California, New York, Pennsylvania, Ohio, Michigan, & New Jersey
736
Texas Illinois
476
Arizona
234
Top Five States
7
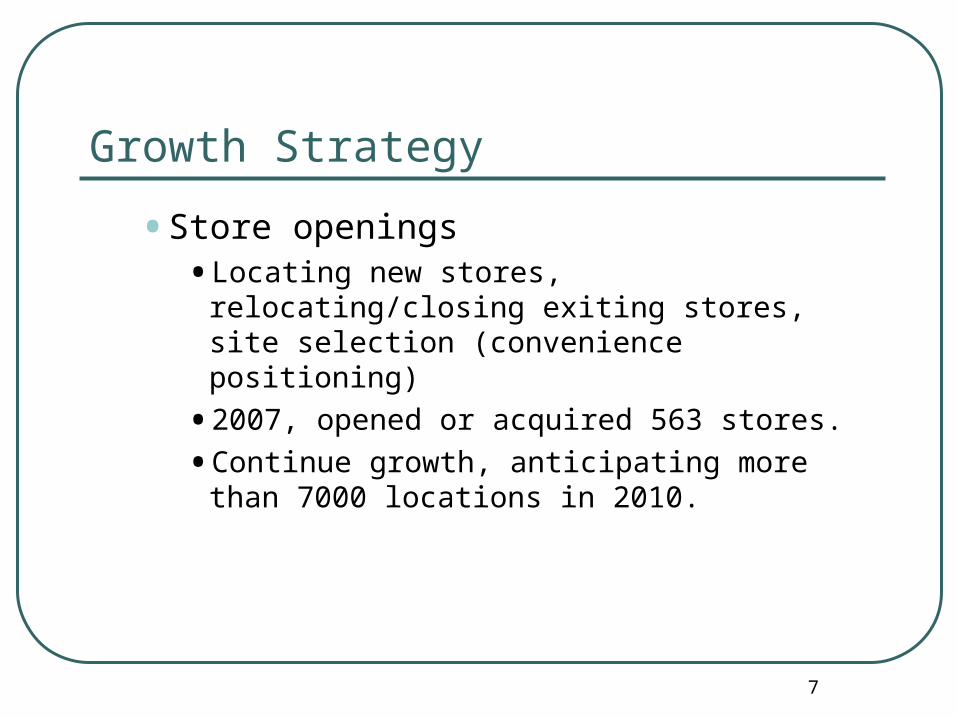
Growth Strategy
• Store openings• Locating new stores, relocating/closing exiting
stores, site selection (convenience positioning)
• 2007, opened or acquired 563 stores.
• Continue growth, anticipating more than 7000 locations in 2010.
8
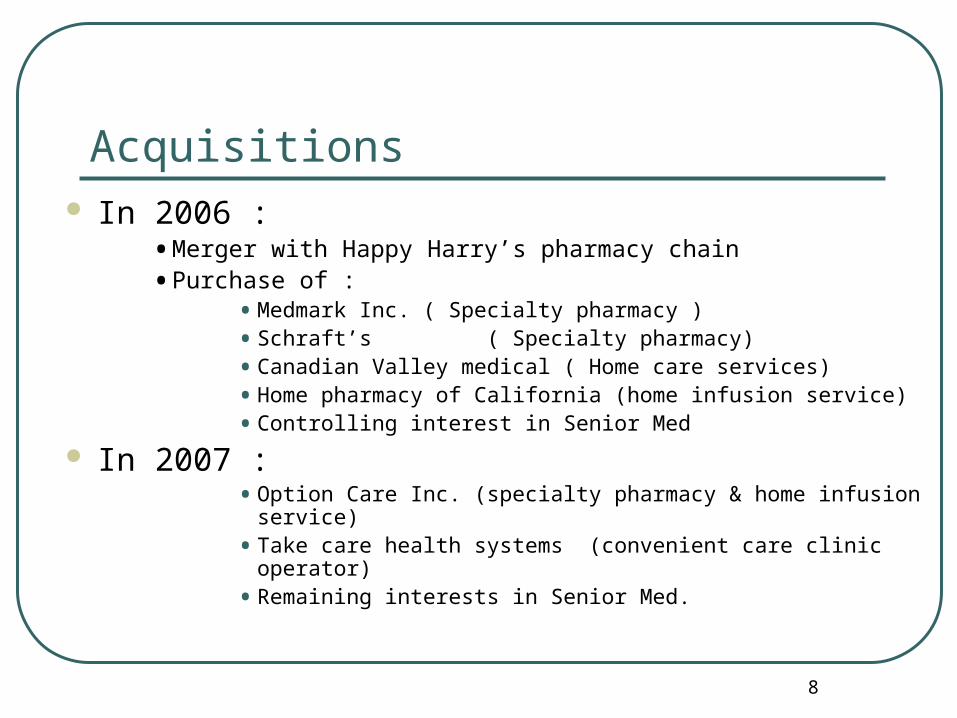
Acquisitions In 2006 :
• Merger with Happy Harry’s pharmacy chain
• Purchase of :• Medmark Inc. ( Specialty pharmacy )
• Schraft’s ( Specialty pharmacy)
• Canadian Valley medical ( Home care services)
• Home pharmacy of California (home infusion service)
• Controlling interest in Senior Med
In 2007 :• Option Care Inc. (specialty pharmacy & home infusion service)
• Take care health systems (convenient care clinic operator)
• Remaining interests in Senior Med.
9
Risk FactorsRisk Factors
CompetitionRegulations
Reduction Reimbursement
WalgreensWalgreens
Pharmacy Personnel
Product Liability
StoreLocation
EconomicCondition
10
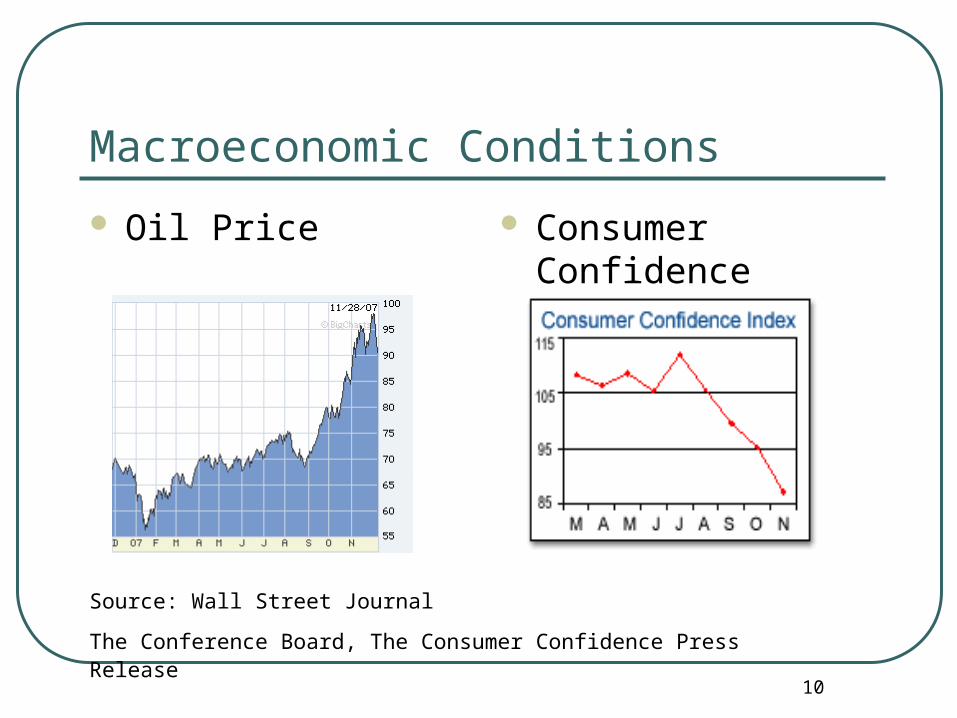
Macroeconomic Conditions
Oil Price Consumer Confidence
Source: Wall Street Journal
The Conference Board, The Consumer Confidence Press Release

11
Industry Overview
• Industry: Drug retail
• CVS/Caremark Corp. (CVS) and Rite Aid Corp. (RAD)
• Business segments: prescription and non-prescription drugs, and general merchandise

12
Industry
Sources and availability of raw materials
• numerous domestic and foreign suppliers Seasonal variation
• timing and severity of cold/flu season, holidays Dependence upon limited number of customers
• no customers counts for 10% or more of consolidated sales Competition
• chain and independent drug stores, mail order prescription providers, grocery stores, convenient stores, mass merchants, and dollar stores
• service, convenience, variety and price
13
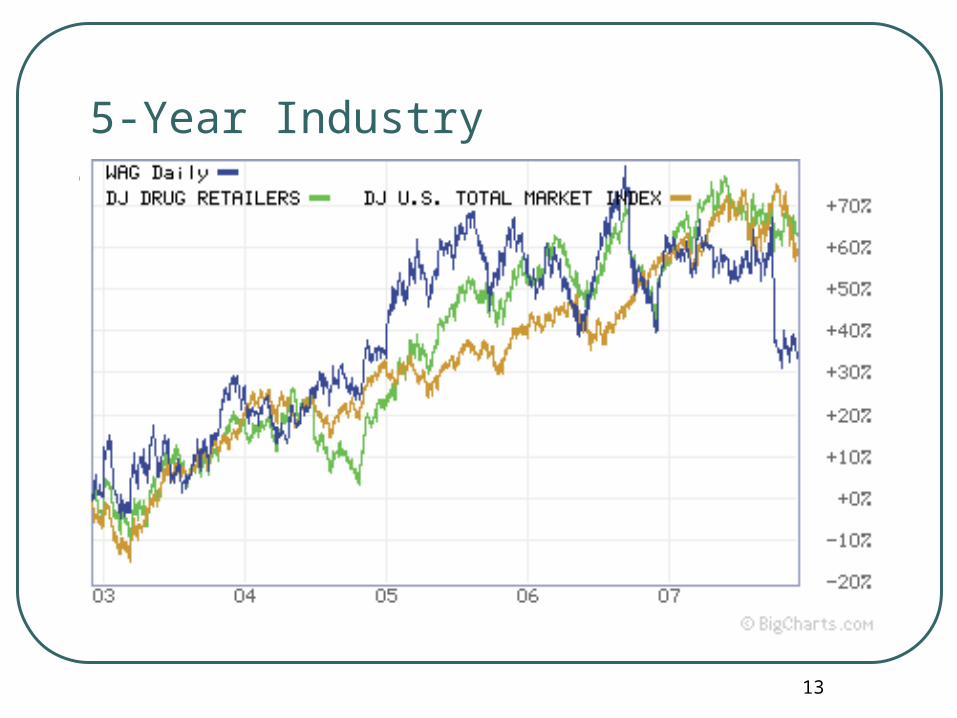
5-Year Industry

14
1-Year Stock Performance
15
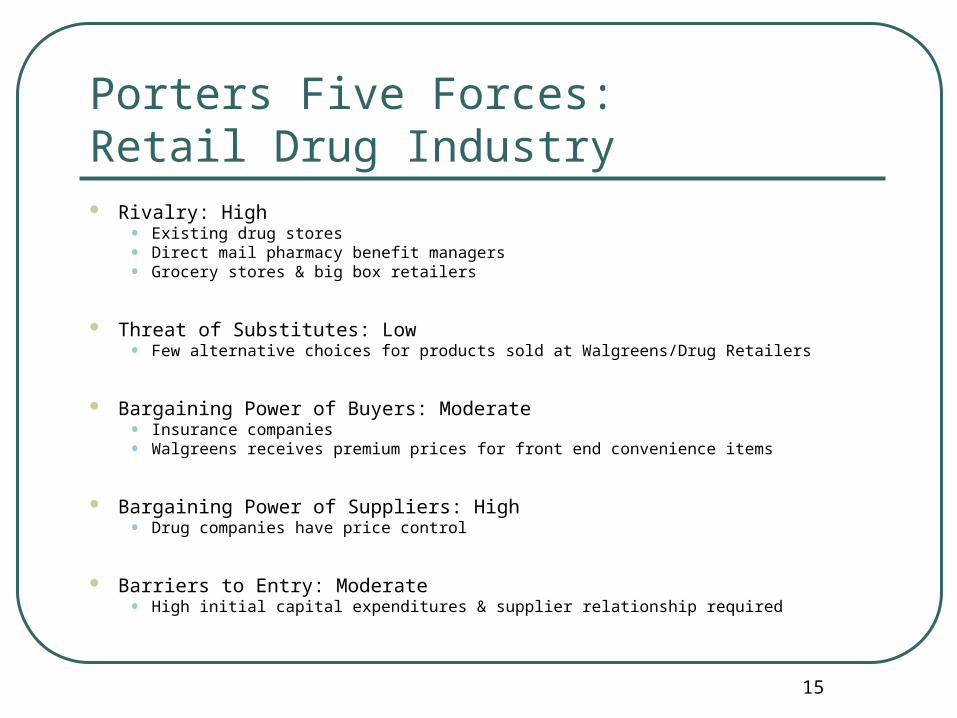
Porters Five Forces: Retail Drug Industry Rivalry: High
• Existing drug stores• Direct mail pharmacy benefit managers• Grocery stores & big box retailers
Threat of Substitutes: Low• Few alternative choices for products sold at Walgreens/Drug Retailers
Bargaining Power of Buyers: Moderate• Insurance companies• Walgreens receives premium prices for front end convenience items
Bargaining Power of Suppliers: High• Drug companies have price control
Barriers to Entry: Moderate• High initial capital expenditures & supplier relationship required
16
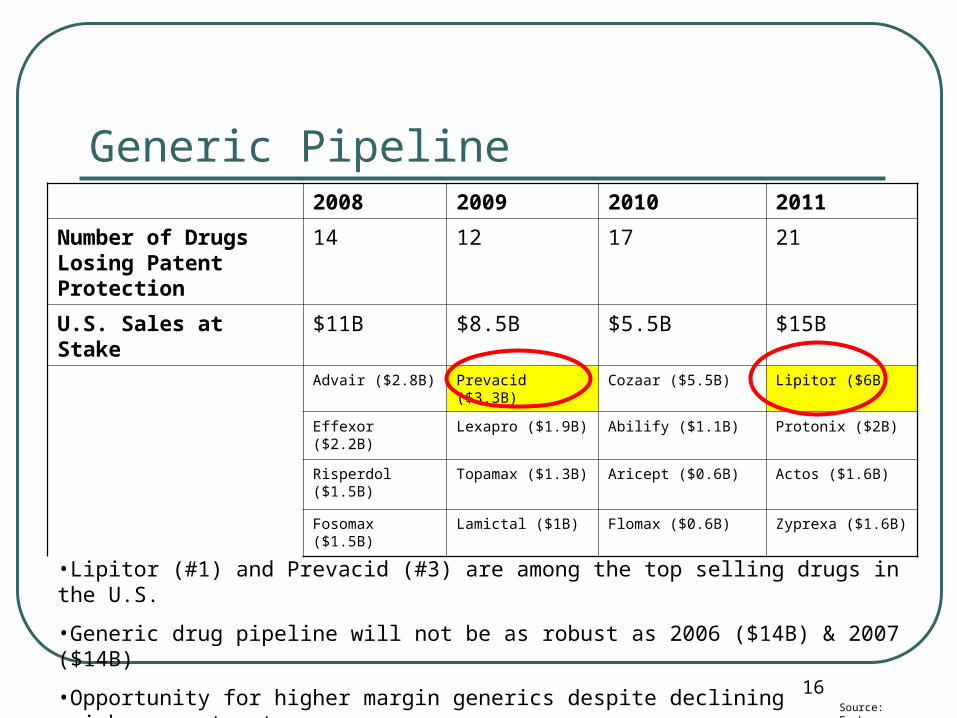
Generic Pipeline2008 2009 2010 2011
Number of Drugs Losing Patent Protection
14 12 17 21
U.S. Sales at Stake $11B $8.5B $5.5B $15B
Advair ($2.8B) Prevacid ($3.3B) Cozaar ($5.5B) Lipitor ($6B)
Effexor ($2.2B) Lexapro ($1.9B) Abilify ($1.1B) Protonix ($2B)
Risperdol ($1.5B) Topamax ($1.3B) Aricept ($0.6B) Actos ($1.6B)
Fosomax ($1.5B) Lamictal ($1B) Flomax ($0.6B) Zyprexa ($1.6B)
•Lipitor (#1) and Prevacid (#3) are among the top selling drugs in the U.S.
•Generic drug pipeline will not be as robust as 2006 ($14B) & 2007 ($14B)
•Opportunity for higher margin generics despite declining reimbursement rates
Source: Forbes.com

17
Path From Branded to Generic
Stage I
1/1/1995 - 1/1/2007 (Est. 12 Yrs)
•Full Price “Branded” Drug Available
•Low Margin Product
Stage II
1/2/2007 - 6/2/2007
•First Generic Version Available
•6 Month Exclusivity
•Sold at 94% of “Branded” Price
•Insurance Companies Offer High Reimbursement Rates
Stage III
6/2/2007 - Future
•Generic Exclusivity Ends
•Sold at 52% of Branded Price
•Insurance Companies Reduce Reimbursement
18
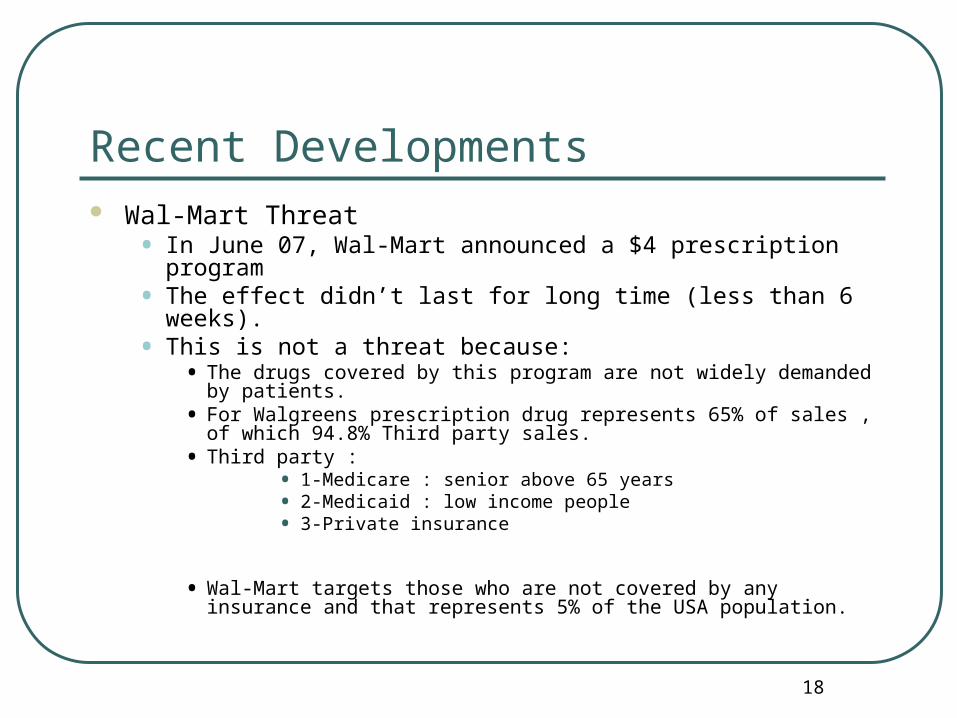
Recent Developments Wal-Mart Threat
• In June 07, Wal-Mart announced a $4 prescription program• The effect didn’t last for long time (less than 6 weeks).• This is not a threat because:
• The drugs covered by this program are not widely demanded by patients.• For Walgreens prescription drug represents 65% of sales , of which 94.8%
Third party sales.• Third party :
• 1-Medicare : senior above 65 years• 2-Medicaid : low income people• 3-Private insurance
• Wal-Mart targets those who are not covered by any insurance and that represents 5% of the USA population.

19
Recent Developments Cont.
On Oct 1st 2007 , Walgreen announced a decline in Q4 earnings by 3.8%. Although the annual data showed an increase in earnings by 16.6%, sales
increased by 13.3%. Walgreen lost 15% ($7.04) on that day. Walgreen is held by many institutional investors, so when Walgreen missed their
expectations, shares sold off abruptly
20
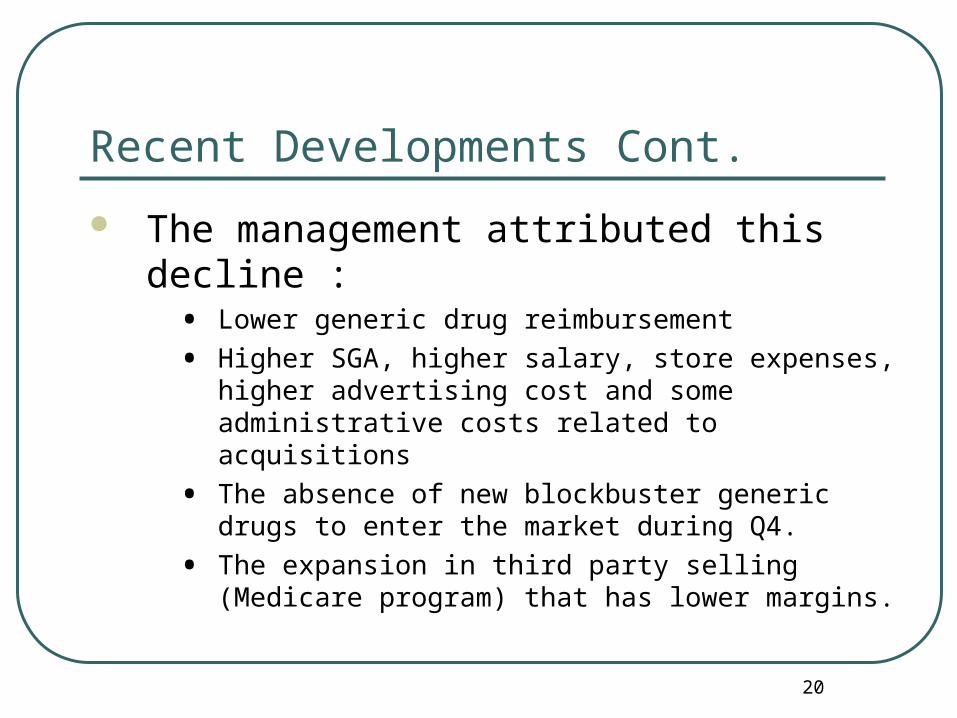
Recent Developments Cont.
The management attributed this decline :• Lower generic drug reimbursement
• Higher SGA, higher salary, store expenses, higher advertising cost and some administrative costs related to acquisitions
• The absence of new blockbuster generic drugs to enter the market during Q4.
• The expansion in third party selling (Medicare program) that has lower margins.
21
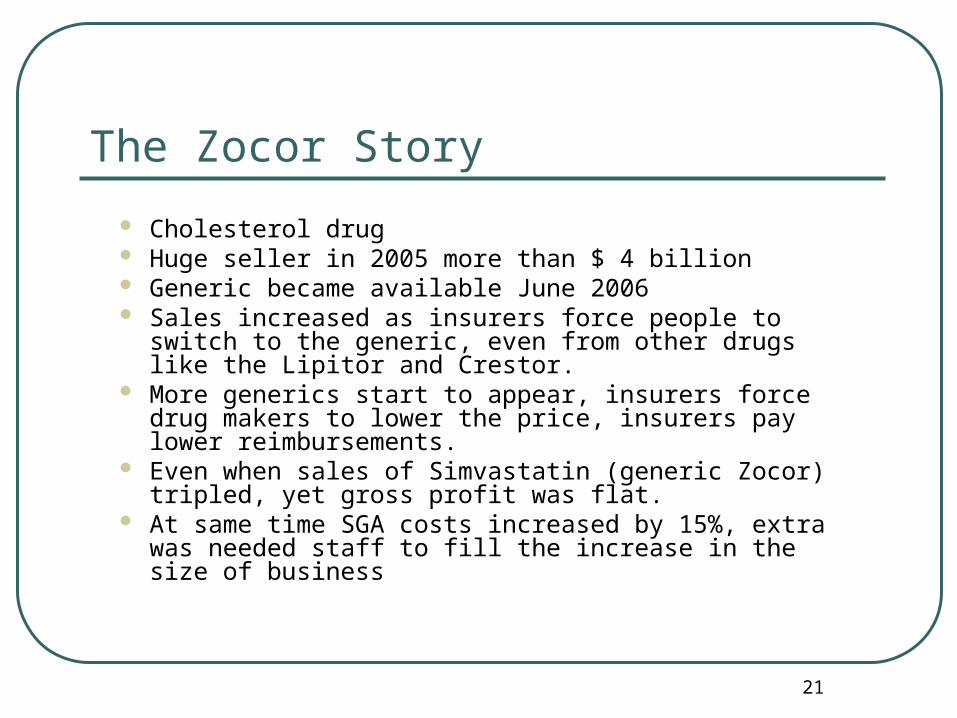
The Zocor Story
Cholesterol drug Huge seller in 2005 more than $ 4 billion Generic became available June 2006 Sales increased as insurers force people to switch to the
generic, even from other drugs like the Lipitor and Crestor.
More generics start to appear, insurers force drug makers to lower the price, insurers pay lower reimbursements.
Even when sales of Simvastatin (generic Zocor) tripled, yet gross profit was flat.
At same time SGA costs increased by 15%, extra was needed staff to fill the increase in the size of business

22
Patent Expiration Schedule
Date Drug Pharmaceutical Company8-Jun-07 Zerit Bristol Mayers Squibb
11-Dec-07 Meredia Abbott Laboratories
25-Dec-07 Zyrtec Pfizer
Jan-08 camptosar Pfizer
6-Feb-08 Fosamax Merck
12-Feb-08 Advair Glaxosmithkline
12-Feb-08 Serevant Glaxosmithkline
1-Oct-08 Casodex AstraZeneca
Jan-10 Lipitor Pfizer
Sep-11 Avapro Bristol Mayers Squibb
Nov-11 Plavix Bristol Mayers Squibb
Jan-13 Orzel Bristol Mayers Squibb
Jan-13 Sustiva Bristol Mayers Squibb
Jan-17 Reyataz Bristol Mayers Squibb
23
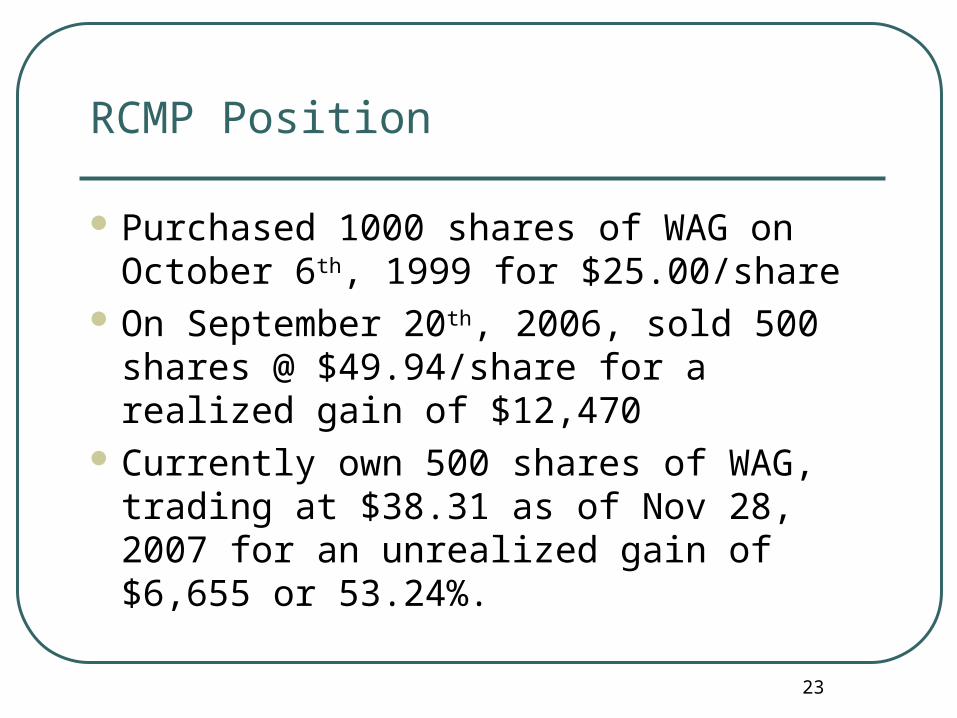
RCMP Position
Purchased 1000 shares of WAG on October 6th, 1999 for $25.00/share
On September 20th, 2006, sold 500 shares @ $49.94/share for a realized gain of $12,470
Currently own 500 shares of WAG, trading at $38.31 as of Nov 28, 2007 for an unrealized gain of $6,655 or 53.24%.

24
Role in Portfolio
25
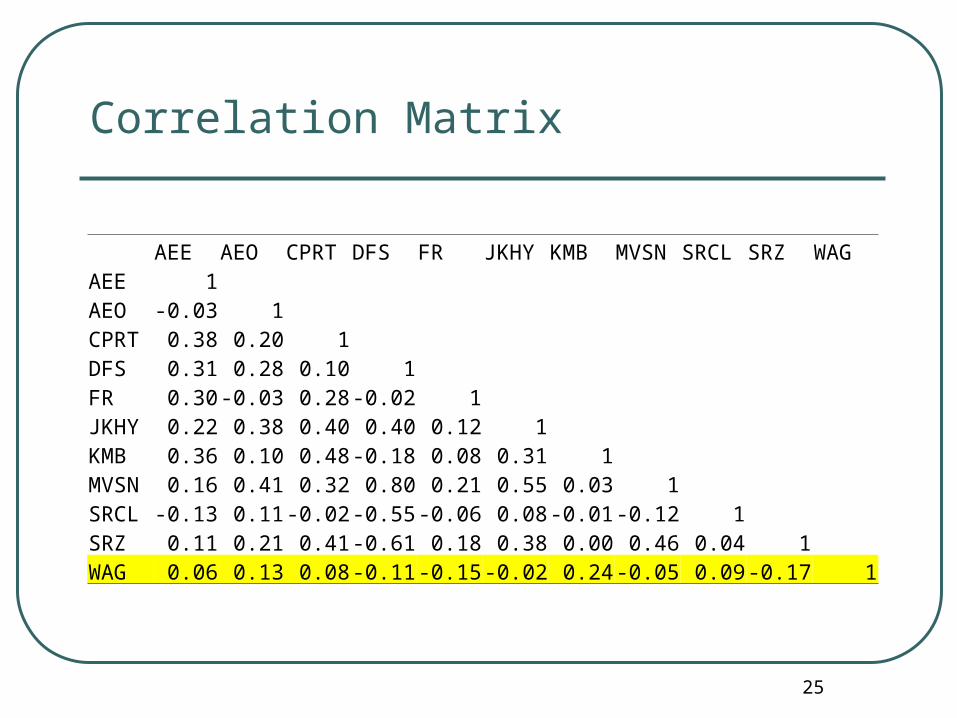
Correlation Matrix
AEE AEO CPRT DFS FR JKHY KMB MVSN SRCL SRZ WAGAEE 1AEO -0.03 1CPRT 0.38 0.20 1DFS 0.31 0.28 0.10 1FR 0.30 -0.03 0.28 -0.02 1JKHY 0.22 0.38 0.40 0.40 0.12 1KMB 0.36 0.10 0.48 -0.18 0.08 0.31 1MVSN 0.16 0.41 0.32 0.80 0.21 0.55 0.03 1SRCL -0.13 0.11 -0.02 -0.55 -0.06 0.08 -0.01 -0.12 1SRZ 0.11 0.21 0.41 -0.61 0.18 0.38 0.00 0.46 0.04 1WAG 0.06 0.13 0.08 -0.11 -0.15 -0.02 0.24 -0.05 0.09 -0.17 1
26
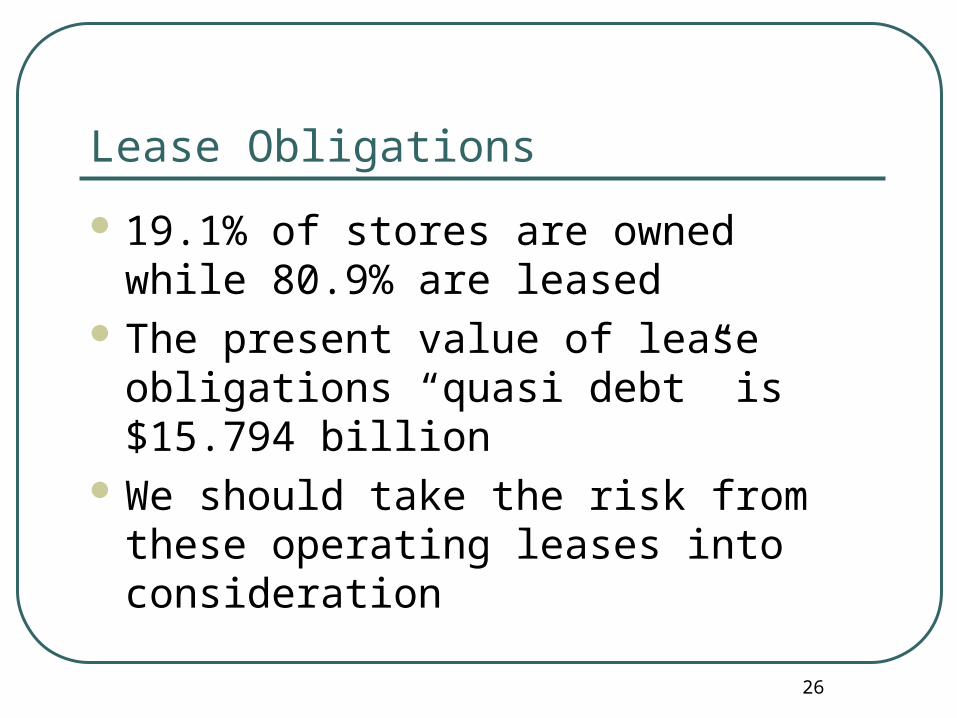
Lease Obligations
19.1% of stores are owned while 80.9% are leased
The present value of lease obligations “quasi debt” is $15.794 billion
We should take the risk from these operating leases into consideration
27
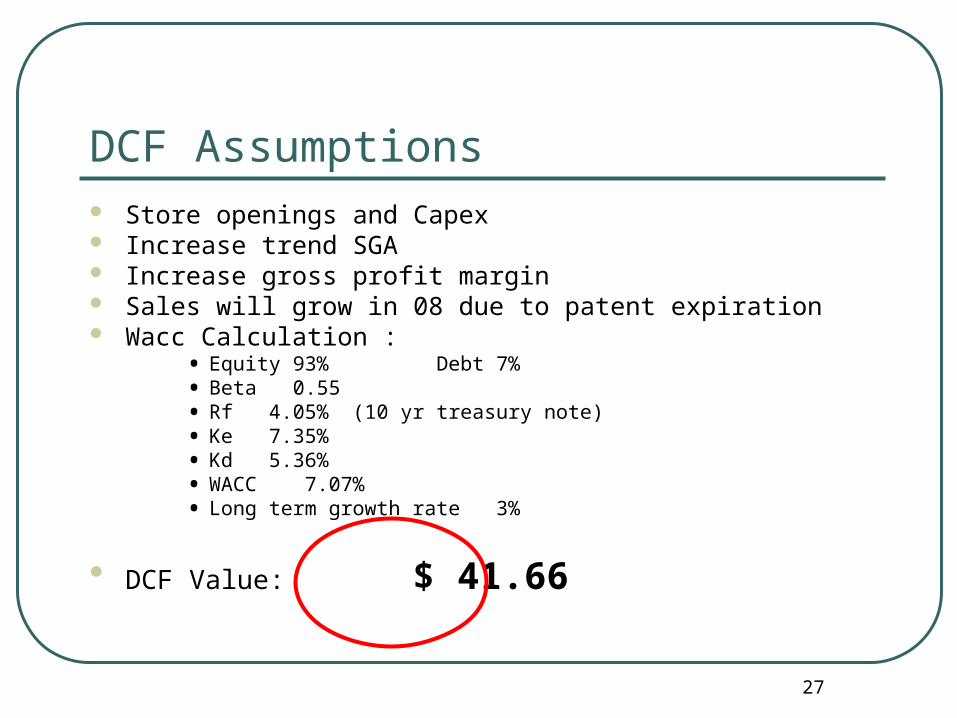
DCF Assumptions Store openings and Capex Increase trend SGA Increase gross profit margin Sales will grow in 08 due to patent expiration Wacc Calculation :
• Equity 93% Debt 7%• Beta 0.55• Rf 4.05% (10 yr treasury note)• Ke 7.35%• Kd 5.36%• WACC 7.07%• Long term growth rate 3%
DCF Value: $ 41.66
28
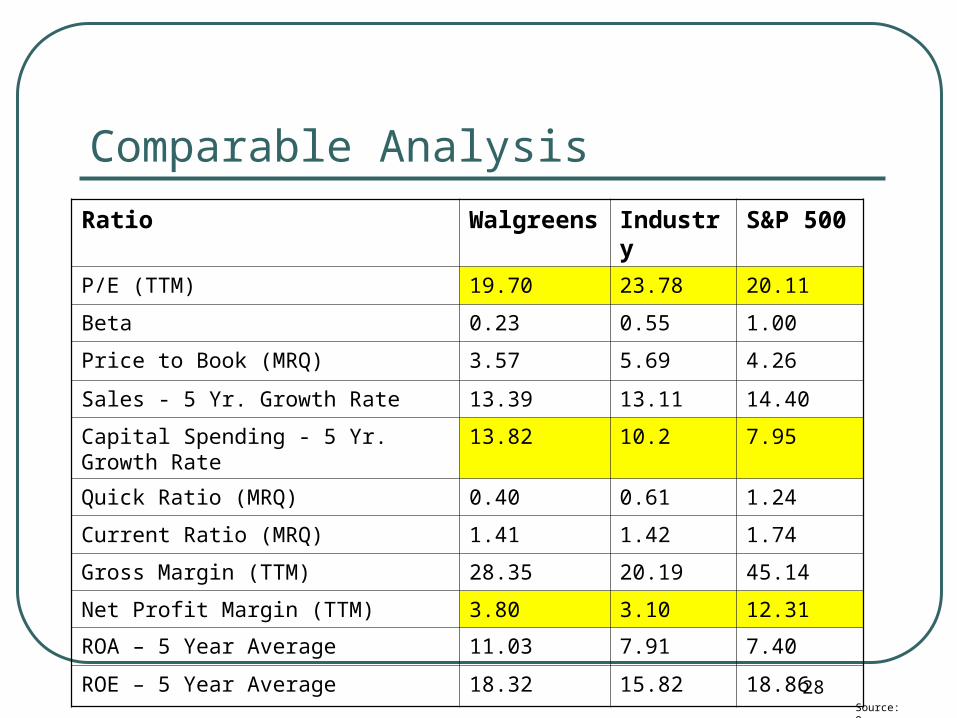
Comparable Analysis
Ratio Walgreens Industry S&P 500
P/E (TTM) 19.70 23.78 20.11
Beta 0.23 0.55 1.00
Price to Book (MRQ) 3.57 5.69 4.26
Sales - 5 Yr. Growth Rate 13.39 13.11 14.40
Capital Spending - 5 Yr. Growth Rate 13.82 10.2 7.95
Quick Ratio (MRQ) 0.40 0.61 1.24
Current Ratio (MRQ) 1.41 1.42 1.74
Gross Margin (TTM) 28.35 20.19 45.14
Net Profit Margin (TTM) 3.80 3.10 12.31
ROA – 5 Year Average 11.03 7.91 7.40
ROE – 5 Year Average 18.32 15.82 18.86
Source: Onesource
29
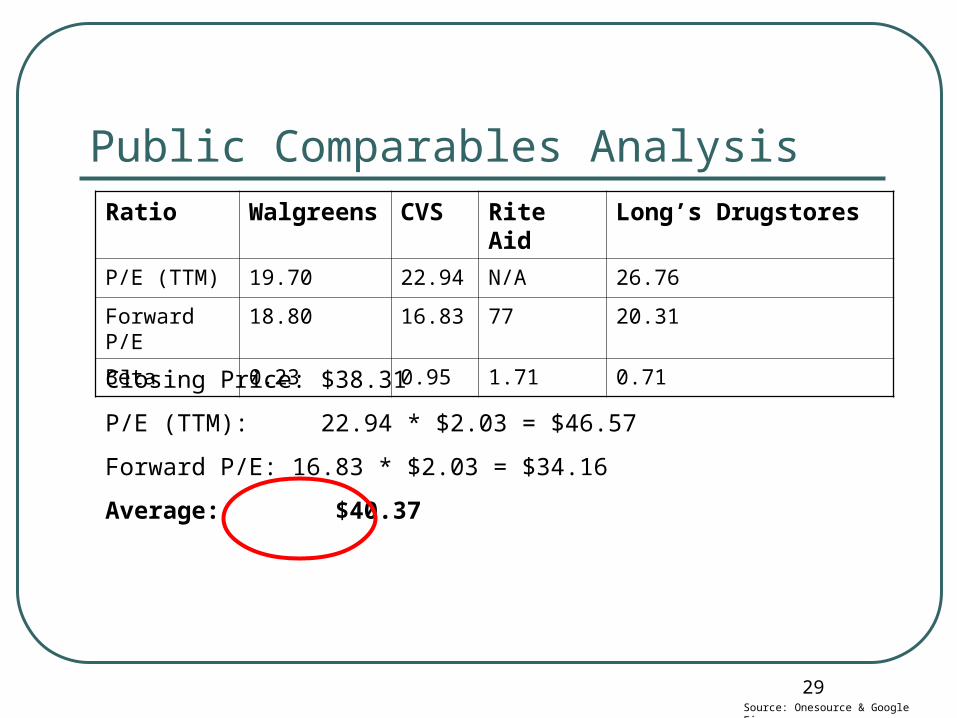
Public Comparables AnalysisRatio Walgreens CVS Rite Aid Long’s Drugstores
P/E (TTM) 19.70 22.94 N/A 26.76
Forward P/E 18.80 16.83 77 20.31
Beta 0.23 0.95 1.71 0.71
Source: Onesource & Google Finance
Closing Price: $38.31
P/E (TTM): 22.94 * $2.03 = $46.57
Forward P/E: 16.83 * $2.03 = $34.16
Average: $40.37
30
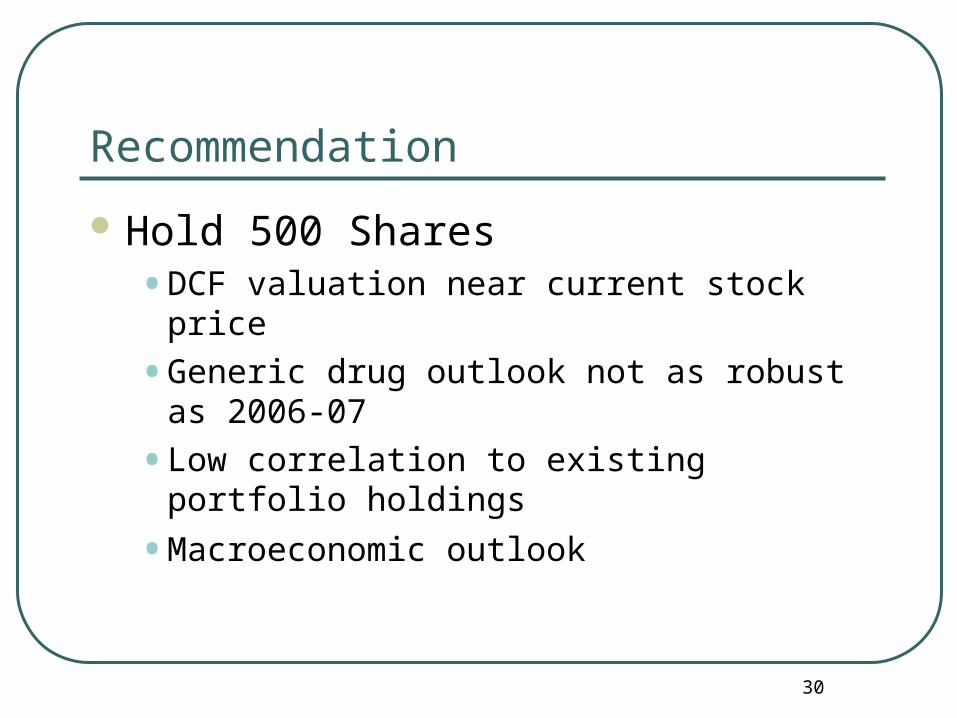
Recommendation
Hold 500 Shares• DCF valuation near current stock price
• Generic drug outlook not as robust as 2006-07
• Low correlation to existing portfolio holdings
• Macroeconomic outlook


![[Typ hier] [Typ hier] [Typ hier] - Kees van der Westen · INSTALLATION MANUAL - resume Slim Jim Installation manual page 3 Installation resume Check location 1. Check water quality](https://img.pdfslide.us/doc/110x75/5f1306afc9765c030046c97c/typ-hier-typ-hier-typ-hier-kees-van-der-installation-manual-resume-slim.jpg)
![[Typ hier] [Typ hier] [Typ hier] - Kees van der Westen · Odour and colour clean*, fresh*, odour free*, clear* Taste influencing organic compounds*# Chlorine#, Hypochlorite#, Chloramines#](https://img.pdfslide.us/doc/110x75/5f8c9d514eb2774b9d1c3c27/typ-hier-typ-hier-typ-hier-kees-van-der-westen-odour-and-colour-clean.jpg)


![[Hier klicken und Adresse eingeben]](https://img.pdfslide.us/doc/110x75/62d387108826e22bc0079c00/hier-klicken-und-adresse-eingeben.jpg)
