Embed Size (px)
Citation preview

HAL Id: tel-00657247https://tel.archives-ouvertes.fr/tel-00657247
Submitted on 6 Jan 2012
HAL is a multi-disciplinary open accessarchive for the deposit and dissemination of sci-entific research documents, whether they are pub-lished or not. The documents may come fromteaching and research institutions in France orabroad, or from public or private research centers.
L’archive ouverte pluridisciplinaire HAL, estdestinée au dépôt et à la diffusion de documentsscientifiques de niveau recherche, publiés ou non,émanant des établissements d’enseignement et derecherche français ou étrangers, des laboratoirespublics ou privés.
Role of Escherichia coli curli in relation with intestinalcomponents - mucin, Klebsiella pneumoniae and
Enterococcus faecalisNan Yang
To cite this version:Nan Yang. Role of Escherichia coli curli in relation with intestinal components - mucin, Klebsiellapneumoniae and Enterococcus faecalis. Agricultural sciences. INSA de Lyon, 2011. English. <NNT :2011ISAL0006>. <tel-00657247>

N° d’ordre 2011-ISAL-0006 Année 2011
Thèse
Role of Escherichia coli curli in relation with
intestinal components - mucin, Klebsiella
pneumoniae and Enterococcus faecalis
Présentée devant
INSA de Lyon
Pour obtenir
le grade de docteur
École doctorale :
Evolution, Ecosystèmes, Microbiologie et Modélisation (E2M2)
Spécialité : Ecologie microbienne
Par
Nan YANG
Soutenue le 20 janvier 2011
Jury :
Rapporteurs Pr Marie-Noelle BELLON-FONTAINE, ENSAIA AgroParisTech, Massy
Pr Christiane FORESTIER, Université d’Auvergne
Dr Paolo LANDINI, University of Milan, Italy
Examinateurs Dr Romain BRIANDET, AgroParisTech, Massy
Pr Rémy GOURDON, INSA de Lyon
Pr Phillipe LEJEUNE, INSA de Lyon
Directrices de thèse Dr Chun Chau SZE, Nanyang Technical University, Singapore
Dr Corinne DOREL, INSA de Lyon

Acknowledgement
Thanks to the Merlion PhD Scholarship offered by the French Embassy in Singapore, my
PhD life has been a different one. Although difficult at times, it has been an enriching and
memorable journey, and I would like to express my sincere gratitude to those who have
accompanied me along the way.
First and foremost, I thank my two supervisors, Dr. Corinne Dorel and Dr. Sze Chun
Chau, for accepting me as their student, and never giving me up even during the hardest
time. They did not only guide me on the adventure of science, but also taught me how to
live with their motherly love. I always feel so privileged to have them as my supervisors,
without whom I could never have come this far.
Having my PhD accomplished in 2 foreign countries, I thank my colleagues and friends
in both countries for their warm friendship, their help in so many ways and for having
been such a pleasure to work with. In France, my fellow students Claire Perrin, Yann
Ferrandez and Camille Bleriot were always ready to lend a hand, besides integrating me
in their work-hard-and-play-hard group. Everyone around me has been very generous in
helping me with my French, and I feel especially lucky to have had Guillaume Méric as
my “prof. d’argot”, who brought so much fun in the every-day French learning. I would
also like to thank Huang Zhengwei and Wang Xiaohui, who brought the flavour of home
(even literally).
In Singapore, it has been a delight to have the girls (and occasionally a guy) as my
colleagues, each one being so unique: the calm and patient Miao Huang, who is an
excellent role model for constant learning; my salsa- and Spanish-learning mate Shalini
Ratnasingam, whose sincere and sweet smile is simply infectious; the passionate
“bookworm” Chan Sock Hoai, who is such an understanding listener and with whom
deep conversations are especially enjoyable. I thank her for being my “i-bookstore” and
“movie mate”; the sunshine-like Chew Ley Byan, who is also a caring landlord outside

the office, amazed with her strong heart under her soft and delicate appearance. I
appreciate the friendships of Zhang Rui and Ng Chow Goon although with whom I did
not have much time to interact. I also want to thank the only guy in our office, Ang Kian
Wee, the laughter he brought was as welcome as his cakes.
I also extend my thanks to the technical supporting team of the laboratories in both INSA
de Lyon and NTU, without whom, my work would have taken much longer to realise.
Outside work, I am very grateful to the Flamant family for inviting me to their lives, and
left me with cheerful memories of my first Christmas, first “huître” (tout cru!), first
birthday with a candle-lit-home-made cake…; to Rémy Verdy, who offered me a place
that I could call home for 2 years, for introducing me to the French way of life and for the
care and precious memories he gave me; to my friends Fan Yanxin, Feng Shu, Han Sujun,
Jia Jingyu, Lin Min, Xia Yujie, Yang Ye and Zhao Lei for being there during the most
difficult times for me; and to my family, for their constant support and unconditional love
despite being such a distance away for 10 years.
Last but not least, I would also like to thank my reviewers and examiners, for having
accepted to be in my thesis advisory committee and for taking their time to appreciate the
work included in this thesis.

i
Abstract
Bacteria in nature mostly exist in biofilms, which are structured adherent communities encased
in polymeric matrices. In the human body, most biofilms are composed of commensal
microorganisms with the gastrointestinal tract being the most heavily colonized site. Bacterial
attachment to the overlying mucus gel layer of the intestinal epithelium is fundamental to the
establishment of a stable commensal microflora. However the interaction of bacteria with the
complex mucus gel is poorly described. Moreover, the complexity and diversity of the gut
microbiota is itself an obstacle to studying its biology. Microbiota functions are the product of
communities of bacteria and interactions between multiple species. New approaches are needed
to study this aspect of even the most well-studied member of the human gut microbiota,
Escherichia coli. This thesis was devoted to the exploration of the transcriptional response of E.
coli facing different elements of human gut following 3 main objectives. First, the initial part of
my work was related to the conception and optimization of appropriate genetic tools to both
track E. coli within the multispecies context that constitute human gut commensals, and survey
the expression of genes of interest. Use of the Green Fluorescent Protein (GFP) genes allowing
enhanced fluorescence and shortened half-life has permitted significant progress both in whole
cell tagging as well as transcriptional reporting, while the red fluorescent counterparts were
disappointing. Second, using the subset of tools that has been validated to be reliable, influence
of mucin on the biofilm formation ability of E. coli has subsequently been studied. I have shown
that mucin promotes E. coli biofilm formation through transcriptional modulation of surface
adhesion structures such as curli and type 1 pili. Third, concurrently, E. coli’s population
relationship to commensal bacteria (K. pneumoniae and E. faecalis) was investigated and
demonstrated, with the possible influence of surface adhesion structures such as curli as the
biological focus. The results suggest that curli production in biofilm increases the fitness of E.
coli when co-cultured with K. pneumoniae while promoting synergistic interaction between E.
coli and E. faecalis. The implication based on the data is discussed.
This work improves the understanding of E. coli response to the gut environment, and provides
foundations to build more powerful tools for further investigations.
Key words: E. coli, multispecies biofilm, mucin, curli, GFP...

ii
Résumé
Les bactéries dans la nature existent principalement en biofilm, qui est une
communauté structurée et adhérente de microbes enveloppés dans des matrices polymériques.
Dans le corps humain, la plupart de biofilms sont composés de microorganismes commensaux
et le tractus gastro-intestinal est le site le plus fortement colonisé. L’attachement bactérien à la
couche de gel de mucus couvrant l’épithélium intestinal est fondamental à l’établissement
d’une microflore commensale stable. Cependant, les interactions entre les bactéries et le gel de
mucus restent mal décrites. En plus, la complexité et la diversité du microbiote intestinal lui-
même est un obstacle pour les analyses de son fonctionnement biologique. Les fonctions du
microbiote sont le produit de communautés bactériennes complexes, et des interactions entres
les différentes espèces qui les composent. De nouvelles approches sont nécessaires pour
étudier la génétique de l’espèce la plus étudiée du microbiote de l’intestin humain, Escherichia
coli. Cette thèse est consacrée à l’exploration de la réponse transcriptionnelle d’E. coli à
différents facteurs présents dans l’intestin humain à travers la réalisation de 3 objectifs
principaux. La première partie de mon travail concerne la conception et l’optimisation d’outils
génétiques permettant de détecter E. coli au sein de biofilms multi-espèces tout en mesurant
simultanément l’activité d’un gène d’intérêt. L’utilisation du gène codant la protéine
fluorescente verte (GFP) et de ses dérivés a permis d’importantes avancées sur le marquage des
cellules entières ainsi que le suivi d’activité transcriptionnelle. Par contre, l’utilisation de
marqueurs fluorescents rouges s’est révélée décevante. Dans un deuxième temps, grâce aux
outils mis au point dans la première partie de mon travail, l’influence de la mucine sur la
capacité d’E. coli à former des biofilm a pu être étudiée. J’ai montré que la mucine augmente
la formation du biofilm d’E. coli par modulation transcriptionnelle de structures d’adhérences
telles que les curli et les pili de type 1. Enfin, l’influence de la culture en biofilms multi-
espèces constitués d’E. coli et de bactéries commensales (K. pneumoniae and E. faecalis) sur la
croissance de chacun des partenaires a été analysée, en focalisant notre attention sur l’influence
possible de structures d’adhérence telles que les curli. Les résultats indiquent que la production
de curli en biofilm augmente le développement d’E. coli en co-culture avec K. pneumoniae
alors qu’elle favorise l’interaction synergique entre E. coli et E. faecalis. Les implications
basées sur ces données ont été examinées.
Ce travail contribue à l’amélioration des connaissances sur la réponse d’E. coli à
l’environnement intestinal et apporte les fondations pour construire des outils plus puissants
pour la poursuite des investigations sur les biofilms multi-espèces.
Mots-clés : E. coli, biofilm multi-espèce, mucine, curli, GFP.

iii
List of Publications
Journal papers
Nan YANG, Shalini RATNASINGAM, Ley Byan CHEW, Corinne DOREL and Chun
Chau SZE. Interactions of Escherichia coli with Klebsiella pneumonia and Enterococcus
faecalis: population relationships in the context of curli expression level. (manuscript
ready for submission)
Nan YANG, Ley Byan CHEW, Chun Chau SZE and Corinne DOREL. Escherichia coli
biofilm formation induced by mucin relies on curli. (manuscript in preparation)
Ratnasingam S., Chew L.B., Yang N. and Sze C.C. Differential transcriptional response
of Escherichia coli as influenced by Klebsiella pneumoniae and Enterococcus faecalis.
(manuscript in preparation)
Meeting proceedings
N. Yang, S. Ratnasingam, L. B. Chew, H. Miao, C. Dorel, C. C. Sze. Interactions of E.
coli with K. pneumonia and E. faecalis: population relationships and transcriptional
response in the context of curli expression level. (Poster presentation)
5th
ASM conference on Biofilms, Cancun, Mexique, November 2009
Nan YANG, Corinne DOREL and Chun Chau SZE. Dual fluorescence system for flow
cytometric analysis of E. coli transcriptional response in multi-species context. (Oral
presentation, prize of Best Oral Presentation)
3rd
Korea-Singapore International Conference on Bioscience & Biotechnology. Singapore,
December 2008
Nan YANG, Corinne DOREL and Chun Chau SZE. Biosensors for pathogen detection:
Mapping E. coli gene expression in biofilm. (Poster presentation)
13th
International Biotechnology Symposium and Exhibition, Dalian, China, October
2008
(Journal of Biotechnology, Volume 136, Supplement 1, October 2008, Pages S103-S104)

iv
Abbreviations
A adenine
Apr ampicillin resistance
ATCC American Type Culture Collection
BHI Brain-Heart Infusion
bp base pair
C cytosine
CFU colony forming unit
cm centimeter
Cmr chloramphenicol resistance
CV Crystal violet
dd H2O deionized distilled water
EB ethidium bromide
E. coli Escherichia coli
EDTA ethylenediaminetetraacetic acid
E. faecalis Enterococcus faecalis
FACS fluorescence-activated cell sorter
FP fluorescent protein
G guanine
Gfp Green fluorescent protein
gfp gene of green fluorescent protein
h hour
K. pneumoniae Klebsiella pneumoniae
kb kilobase(s)
LB Luria-Bertani
mRNA messenger RNA
μg microgram
μl microliter
min minute

v
ml milliliter
MOPS 3-(N-Morpholino)propanesulfonic acid
MRS deMan, Rogosa and Sharpe
ng nanogram
nt nucleotide(s)
OD600 optical density at 600 nm
PCR polymerase chain reaction
QS quorum sensing
RBS ribosomal binding site
rcf relative centrifugal force
rpm revolutions per minute
rRNA ribosomal RNA
RT room temperature
s second
SD standard deviation
Spr spectinomycin resistance
T thymine
Tcr tetracycline resistance
UTI agar HiCrome UTI agar plate
v/v volume per volume
w/v weight per volume

vi
Table of Contents
Abstract…………………………………………………………………………………………….i
Résumé…...……………………………………………………………………………………….ii
List of Publications ........................................................................................................................ iii
Abbreviations ................................................................................................................................. iv
List of Figures ................................................................................................................................ xi
List of Tables ............................................................................................................................... xiv
Chapter 1 Overview ....................................................................................................................... 1
1.1 Biofilm in the environment ................................................................................................... 1
1.1.1 Biofilm development involves many extracellular structures ........................................ 2
1.1.1.1 Cellulose and colanic acid ....................................................................................... 2
1.1.1.2 Flagella ..................................................................................................................... 4
1.1.1.3 Antigen 43 ................................................................................................................ 5
1.1.1.4 Type 1 pili ................................................................................................................ 6
1.1.1.5 Curli ......................................................................................................................... 7
1.1.1.6 The complex regulation of curli synthesis ............................................................... 9
1.1.1.6.1 Environmental conditions ................................................................................. 9
1.1.1.6.2 Genetic regulation ........................................................................................... 10
1.1.2 Biofilm development is a dynamic and adaptive process ............................................. 11
1.1.2.1 Dynamics of extracellular structure production. .................................................... 11
1.1.2.2 Adaptive nature of biofilm development. .............................................................. 12
1.2 Biofilm in the human body.................................................................................................. 12
1.2.1 Symbiotic microbiota as a human organ ...................................................................... 13
1.2.2 The importance of mucin .............................................................................................. 14
1.2.3 From the bacterial point of view ................................................................................... 15
1.3 Objective ............................................................................................................................. 16
Chapter 2 Experimental models and analytical tools .................................................................. 19
2.1 Growth media and temperature ........................................................................................... 19
2.2 Types of culture ................................................................................................................... 21
2.2.1 Planktonic ..................................................................................................................... 21
2.2.2 Biofilm – saturated vs. interface models ...................................................................... 21
2.2.3 Co-culture of E. coli with K. pneumoniae and E. faecalis ........................................... 24
2.3 Modes of Analysis ............................................................................................................... 26

vii
2.3.1 Enumeration (Viable Count) of bacterial strains using UTI agar ................................. 26
2.3.2 FACS ............................................................................................................................ 27
2.3.3 CLSM and COMSTAT ................................................................................................ 28
2.4 Visualisation of E. coli ........................................................................................................ 29
2.4.1 Using fluorescent stain (SYTO) ................................................................................... 29
2.4.2 Whole-cell tagging of E. coli ........................................................................................ 30
2.4.2.1 Green Fluorescent Protein...................................................................................... 30
2.4.2.2 Construction of G1 ................................................................................................. 30
2.4.2.3 GFP-tagging does not interfere with cells’ basic physiology ................................ 31
2.4.2.4 GFP-tagging of MG1655ompR234 ........................................................................ 31
2.4.2.5 Curli-related phenotype is conserved in the GFP version ..................................... 32
2.5 Analysis of Promoter Activity ............................................................................................ 34
2.5.1 Green vs. Red FP as Transcriptional Reporter ............................................................. 34
2.5.2 In planktonic culture ..................................................................................................... 36
2.5.3 In biofilm ...................................................................................................................... 37
2.6 Dual fluorescence systems - attempts and disappointments ............................................... 39
2.7 Concluding remarks on fluorescent tools design ................................................................ 41
Chapter 3 Mucin influences E. coli biofilm formation through modulations of surface adhesion
structures ..................................................................................................................... 44
3.1 Low concentrations of mucin promote E. coli biofilm formation....................................... 45
3.2 Mucin promotes biofilm formation in E. coli strains without affecting bacteria growth .... 47
3.2.1 Bacteria cannot be analysed by optical methods in the presence of mucin. ................. 47
3.2.2 Mucin neither inhibits nor promotes the growth of E. coli. ......................................... 48
3.3 Curli are involved in mucin-induced biofilm formation ..................................................... 49
3.3.1 Mutations impairing curli production hamper mucin’s induction effect on biofilm .... 49
3.3.2 Low concentrations of mucin up-regulate csgBA gene expression in MG1655 genetic
background ............................................................................................................................ 50
3.3.2.1 On agar surface ...................................................................................................... 50
3.3.2.2 In planktonic culture .............................................................................................. 51
3.3.2.3 In biofilm ............................................................................................................... 53
3.3.2.3.1 Difficulties in promoter activity measurement using traditional method ....... 53
3.3.2.3.2 The use of “specific activity” .......................................................................... 56
3.3.2.3.3 “Super-up” regulation in E. coli W3110 ......................................................... 59
3.4 Role of other extracellular structures in mucin induced biofilm formation ........................ 60
3.4.1 Antigen 43: ................................................................................................................... 60

viii
3.4.2 Type I pili: .................................................................................................................... 61
Chapter 4 Partnership of E. coli with K. pneumoniae and E. faecalis......................................... 63
4.1 Population relationship - Synergism, commensalism, parasitism or antagonism? ............. 64
4.2 Population Relationship in our model is not based on antibiotics-mediated inhibition ...... 65
4.3 Influence of curli on population relationship ...................................................................... 66
4.3.1 The surface property of the mutants ............................................................................. 67
4.3.1.1 Electronegativity decreases with increasing curli expression ................................ 68
4.3.1.2 Distinct size and surface profiles of curli-related mutants by FACS analysis ....... 69
4.3.2 The population relationship of E. coli with K. pneumoniae and E. faecalis ................ 71
4.3.2.1 In planktonic culture .............................................................................................. 71
4.3.2.1.1 Curli’s influence on bacteria growth in co-culture .......................................... 73
4.3.2.1.2 Curli’s influence on population dominance status within planktonic co-
cultures ........................................................................................................................... 75
4.3.2.2 In biofilm ............................................................................................................... 77
4.3.2.2.1 Growth on the surface ..................................................................................... 78
4.3.2.2.2 Population dominance status within biofilm co-cultures ................................ 80
4.4 Summary ............................................................................................................................. 81
Chapter 5 Conclusions and perspectives ..................................................................................... 84
5.1 Fluorescent Proteins ............................................................................................................ 85
5.2 Mucin-induced curli induction – mechanism, and inter-relation with other regulatory
factors? ...................................................................................................................................... 87
5.2.1 Mucin up-regulates csgBA expression in E. coli K-12 MG1655 ................................. 87
5.2.2 Mucin’s effect on other adherence structures ............................................................... 89
5.3 Partnership of E. coli with K. pneumoniae and E. faecalis ................................................. 90
Chapter 6 Materials and Methods ................................................................................................ 93
6.1 Strains and plasmids ............................................................................................................ 93
Plasmids ................................................................................................................................. 95
6.2 General reagents, kits and media......................................................................................... 97
6.3 Culture conditions ............................................................................................................. 100
6.3.1 Single-species cultures ............................................................................................... 100
6.3.1.1 Planktonic cultures ............................................................................................... 100

ix
6.3.1.2 OD600-cell density relationship ............................................................................ 100
6.3.1.3 Biofilm single cultures ......................................................................................... 100
6.3.1.3.1 24-well polystyrene microtiter plate ............................................................. 100
6.3.1.3.2 The saturated system ..................................................................................... 101
6.3.1.3.3 The interface system...................................................................................... 101
6.3.2 Co-cultures.................................................................................................................. 101
6.4 Growth monitoring and analysis ....................................................................................... 102
6.4.1 Planktonic cultures ..................................................................................................... 102
6.4.2 Colony Forming Unit (CFU) enumeration ................................................................. 103
6.4.3 Biofilms ...................................................................................................................... 103
6.4.3.1 The 24-well plate ................................................................................................. 103
6.4.3.2 The saturated system ............................................................................................ 103
6.4.3.3 The interface system ............................................................................................ 104
6.4.4 Crystal violet staining of biofilm formed on 24-well polystyrene plate ..................... 104
6.4.5 Biofilm observation using CLSM............................................................................... 104
6.4.5.1 Biofilm formed in the saturated system ............................................................... 104
6.4.5.2 Biofilm formed in the interface system ............................................................... 105
6.4.6 Growth inhibition test ................................................................................................. 105
6.5 Bacterial genetic manipulation .......................................................................................... 106
6.5.1 Generation of mutants by P1 Transduction ................................................................ 106
6.5.1.1 Phage stock preparation in liquid culture ............................................................. 106
6.5.1.2 Transduction ........................................................................................................ 106
6.5.2 Suicide-plasmid based chromosomal insertion for construction of E. coli strain R1 and
R2......................................................................................................................................... 109
6.5.2.1 First recombination event .................................................................................... 109
6.5.2.2 Second recombination event ................................................................................ 109
6.6 Molecular cloning ............................................................................................................. 110
6.6.1 Polymerase chain reaction (PCR) ............................................................................... 110
6.6.2 Agarose gel electrophoresis ........................................................................................ 111
6.6.3 DNA quantification and purification.............................................................................. 111
6.6.4 Restriction endonuclease digestion ............................................................................ 112
6.6.5 DNA ligation .............................................................................................................. 112
6.6.5.1 Conventional ligation ........................................................................................... 112
6.6.5.2 In-FusionTM
2.0 PCR Cloning Kit ....................................................................... 112

x
6.6.6 E. coli competent cell preparation and transformation ............................................... 113
6.6.6.1 Chemically competent cells ................................................................................. 113
6.6.6.2 Electrocompetent cells ......................................................................................... 114
6.6.7 DNA extraction........................................................................................................... 114
6.7 Plasmid Construction ........................................................................................................ 115
6.7.1 Construction of promoter-gfp fusions ........................................................................ 115
6.7.2 Construction of promoter-AsRed2 fusions ................................................................. 115
6.7.3 Plasmid construction for the generation of E. coli strain R1 and R2 ......................... 117
6.7.3.1 Using mAsRed2 for construction of E. coli R1 ................................................... 117
6.7.3.2 Using DsRed-Max for construction of E. coli R2................................................ 117
6.8 Equipment settings ............................................................................................................ 118
6.8.1 Fluorometric microplate reader / Fluorometer ........................................................... 118
6.8.2 Zeta potential measurement ........................................................................................ 119
6.8.3 Confocal laser scanning microscope .......................................................................... 119
6.8.4 Fluorescence activated cell sorter ............................................................................... 120
Reference……………………………………………………………………………………….121

xi
List of Figures
Figure 1.1 Schematic representation of biofilm development stages and the
extracellular structures involved in each stage…………………………....2
Figure 1.2 Model of the Rcs phosphorelay in Enterobacteriaceae…………………...3
Figure 1.3 Model describing the coordination of the phase-variable Fim and Ag43
phenotypes via OxyR-relayed thiol–disulfide signal transduction……… 5
Figure 1.4 A schematic representation of type 1 pili………………………………... 6
Figure 1.5 A schematic representation of the two curli gene operons……………….7
Figure 1.6 The secretion and assembly machinery for curli formation in E. coli….…7
Figure 1.7 Regulatory network of curli genes via DGC and PDE proteins………... 11
Figure 1.8 Various environment encountered by bacteria such as E. coli………….15
Figure 2.1 Growth curves of the various bacteria………………………………..… 21
Figure 2.2 The Kadouri system…………………………………………………….. 22
Figure 2.3 Side view of the MBEC™ High-throughput (HTP) Assay……………. 23
Figure 2.4 The biofilm systems used in this study…………………………………. 23
Figure 2.5 Confocal microscopic images of biofilms formed by E. coli self-
expressing green fluorescent protein (GFP)……………………………. 24
Figure 2.6 UTI agar allows distinction between different species…………………. 26
Figure 2.7 CLSM photos of 24 hour biofilm………………………………………. 29
Figure 2.8 Schematic representation of chromosomal recombination of PA1/04/03-
gfpmut3* in E. coli MG1655…………………………………………… 30
Figure 2.9 Green fluorescence of E. coli G1……………………………………….. 31
Figure 2.10 A schematic representation of A. E. coli strain G1 and B. E. coli strain
G1ompR234…………………………………………………………….. 32
Figure 2.11 E. coli biofilms and their corresponding variables…………………….. 32
Figure 2.12 Flocculation test of curli-related mutant strains………………………… 33
Figure 2.13 Kinetics of gene promoter-gfp fusions in MG1655 ompR234………….. 36
Figure 2.14 Expression of promoter-AsRed2 fusions in MG1655ompR234………… 37
Figure 2.15 Expression of promoters in 24h biofilm by MG1655ompR234 in
mM63 …………………………………………………………………... 38

xii
Figure 2.16 Differential expression of genes in biofilm corresponding to different
growth conditions………………………………………………………. 39
Figure 2.17 Schematic representation of the dual fluorescence system…………….. 40
Figure 2.18 Schematic representation of the molecular cloning for RFP-tagged E. coli
(R1) construction………………………………………………………. 41
Figure 2.19 Schematic representation of the RFP instability……………………….. 42
Figure 3.1 Biofilm formation on polystyrene 24-well plate visualised by crystal violet
staining…………………………………………………………………. 45
Figure 3.2 Biofilm formation on glass cover slip observed under CLSM…………..46
Figure 3.3 Masking effect of mucin on bacteria OD600 measurement………………47
Figure 3.4 Analysis of biofilm formation on polystyrene 24-well plate by CFU and
CV staining………………………………………………………………48
Figure 3.5 Curli producing status influences E. coli adherence without affecting
growth………………………………………………………………….. 49
Figure 3.6 Adherence of E. coli MG1655ompR on 24-well plate…………………. 49
Figure 3.7 Mucin’s effect on PcsgBA-gfp activity in E. coli MG1655ompR234 colonies
on agar plates…………………………………………………………… 50
Figure 3.8 The expression of csgBA is up-regulated by low concentrations of
mucin …………………………………………………………………… 52
Figure 3.9 Heterogeneity of gene expression in a population……………………… 53
Figure 3.10 PcsgBA-gfp activity in biofilm by confocal microscopy………………….. 54
Figure 3.11 Heterogeneity in biofilm morphology and csgBA expression pattern….. 55
Figure 3.12 Specific activity in an activity-heterogeneous population……………… 56
Figure 3.13 The specific activity of PcsgBA-gfp in the MG1655 and MG1655ompR234
background……………………………………………………………… 57
Figure 3.14 PcsgBA-gfp activity in biofilm of W3110 and W3110ompR234 in the
presence of various concentrations of mucin…………………………….59
Figure 3.15 The effect of Ag43 on biofilm formation………………………………. 60
Figure 3.16 The interplay between type 1 pili and curli on biofilm formation……… 61
Figure 4.1 Zeta potentials of E. coli and K. pneumoniae and E. faecalis………….. 68

xiii
Figure 4.2 The FSC and SSC profile of E. coli strains varying in curli expression
level…………………………………………………………………….. 69
Figure 4.3 The FSC and SSC profile of E. coli G1ompR234 along the growth……70
Figure 4.4 The influence of partner species on E. coli, K. pneumoniae and E. faecalis
in planktonic co-cultures…………………………………………………72
Figure 4.5 The population percentage of E. coli, K. pneumoniae and E. faecalis when
co-cultured in planktonic condition……………………………………...75
Figure 4.6 The influence of partner species on E. coli, K. pneumoniae, and E. faecalis
in biofilm co-cultures…………………………………………………….78
Figure 4.7 The population percentage of E. coli, K. pneumoniae and E. faecalis when
co-cultured in biofilm…………………………………………………... 80
Figure 6.1 Construction of R1 using mAsRed2…………………………………... 109
Figure 6.2 Construction of R2 using DsRed-Max………………………………… 117
xiv
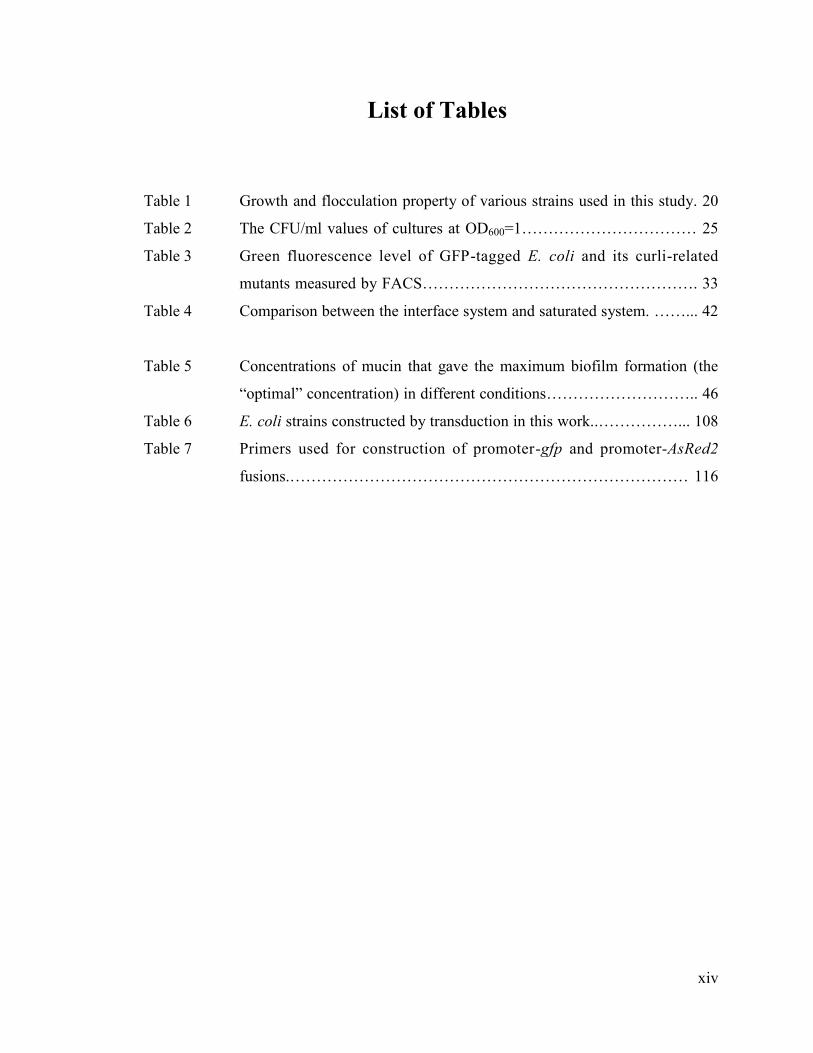
List of Tables
Table 1 Growth and flocculation property of various strains used in this study. 20
Table 2 The CFU/ml values of cultures at OD600=1…………………………… 25
Table 3 Green fluorescence level of GFP-tagged E. coli and its curli-related
mutants measured by FACS……………………………………………. 33
Table 4 Comparison between the interface system and saturated system. ……... 42
Table 5 Concentrations of mucin that gave the maximum biofilm formation (the
“optimal” concentration) in different conditions……………………….. 46
Table 6 E. coli strains constructed by transduction in this work..……………... 108
Table 7 Primers used for construction of promoter-gfp and promoter-AsRed2
fusions.………………………………………………………………… 116

1
Chapter 1 Overview
1.1 Biofilm in the environment
Bacteria, the most abundant life on earth, have undergone millions of years of evolution,
adapting to their changing environment. It is now well accepted that bacteria in nature
mostly exist not in the free-swimming planktonic form, but rather the biofilm form, which
describes matrix-enclosed bacterial population adherent to each other and/or surfaces or
interfaces (Stoodley et al., 2002). They are widespread in nature, and their existence can
be traced in soils, water, sediments, and various parts of the human body including the
skin, mouth and gut. Biofilm bacteria can also be found on surfaces of man-made
structures which are in contact with fluids, such as pipe-lines, ship hulls, air-conditioning
ducts and water-holding tanks. Since the observation of biofilms by Zobell and Anderson
in 1936 (Zobell & Anderson, 1936), this form of bacterial existence has been studied with
steadily increasing intensity, particularly in the last three decades, driven mainly by the
need to deal with problems resulting from their colonization. For example, biofilm
growth causes clogging of medical devices, exhibits more resistance to antibiotic
treatments than the planktonic forms, and is responsible for much of the structural
biofouling in maritime industries (Costerton et al., 1999; Stewart & Costerton, 2001; Bak
et al., 2010; Salta et al., 2010; Bushnak et al., 2010). Whatever damage they cause and
via whatever means, the characteristics of biofilm bacteria that differentiate them from
their planktonic counterparts will come into play. A biofilm population is vastly more
heterogeneous than a planktonic one – in terms of morphology, structure,
microenvironment as well as the physiological and metabolic states of individual
bacterial cells. More importantly, bacteria within a biofilm exhibit coordinated
multicellular behaviour, and this is expected to be even more complex if the biofilm
contains more than one species, as often is the case in natural or environmental settings.
The cellular coordination, both within and between species, seems to be promoted by
non-optimal growth conditions or even by cellular stresses, and confers better adaptation
to and protection from harsh environment (Stewart & Costerton, 2001; Stewart, 2001;
Engelberg-Kulka et al., 2005; Macfarlane & Dillon, 2007; Landini, 2009).

Figure 1.1 Schematic representation of biofilm development stages and the
extracellular structures involved in each stage. Biofilm development can be divided
into five steps: (i) initial reversible attachment of cells to surface; (ii) production of
exopolysaccharide (EPS) leading to irreversible attachment; (iii) early development of
biofilm structure; (iv) maturation of biofilm and (v) biofilm dispersal giving rise to
planktonic cells to colonise new sites. The main extracellular structures known to be
involved are labelled below each step (Stoodley et al., 2002; Kaplan, 2010). Figure
modified from Biofilm hypertextbook, Montana State University Center for Biofilm
Engineering.
2
1.1.1 Biofilm development involves many extracellular structures
Indeed, bacteria in biofilms have to face stresses that arise from higher cell density,
greater oxygen limitation, and higher-osmolarity conditions than in the planktonic
condition (Prigent-Combaret et al., 1999). The consequential differences in the
physiological state of cells are reflected by substantial changes in their gene expression
pattern, observed in both functional genomic and gene fusion studies of several bacterial
species (Prigent-Combaret & Lejeune, 1999; Whiteley et al., 2001; Sauer & Camper,
2001; Sauer et al., 2002). In the instance of Escherichia coli, for example, up to 38% of
its genome expression is affected by biofilm formation, and a significant part of E. coli
strain K-12 biofilm-related genes are in fact stationary phase induced (Prigent-Combaret
et al., 1999; Schembri et al., 2003b; Beloin et al., 2004). This change of lifestyle from
planktonic to sessile state is a well-coordinated process involving many genes with
various functions, but a major part is mediated through the expression of extracellular
structures, which contribute to the intrinsic property of biofilm, i.e. adherence. Their
expression is tightly regulated along the course of biofilm development and – based
mainly on research work on Pseudomonas spp – can be categorized into five stages
(Figure 1.1) (Van Houdt & Michiels, 2005). Different species and different experimental
conditions can lead to variations in these generalised developmental steps. As illustrated,
the whole life cycle of biofilm involves the concerted action of many extracellular factors
such as flagella, type 1 pili, conjugative pili, curli, Antigen 43 (Ag43), β-1,6-N-
acetylglucosamine (PGA), cellulose, colanic acid, lipopolysaccharides, capsules and
DNA. Here I present a brief description on the function and regulation of a few of these
structures especially with reference to E. coli, which are relevant to the scope of my work.
1.1.1.1 Cellulose and colanic acid
In the development and maturation of biofilm structures, exopolysaccharides such as
cellulose, colanic acid and PGA are very important, as they form the bulk of the biofilm
structural matrix. Here we will focus on cellulose and colanic acid because of their
relevance to the regulation and synthesis of curli.

Figure 1.2 Model of the Rcs phosphorelay in Enterobacteriaceae. The
phosphorylation of RcsB involves a complex phosphorelay mediated by the RcsC and
RcsD proteins. Phospho-RcsB binds to DNA and regulates the expression of many genes.
The Rcs phosphorelay is activated by a variety of signals and the perception of many of
these signals is mediated by the RcsF lipoprotein. The cytoplasmic membrane protein
IgaA/YrfF appears to inhibit the activation of RcsC (Meberg et al., 2001; Tierrez &
Garcia-del Portillo, 2004). The RcsB-dependent regulation of some genes requires an
auxiliary protein, RcsA, an unstable cytoplasmic protein that is degraded by the Lon (and
ClpYQ) protease. The Rcs phosphorelay activates colanic acid synthesis (cps), while
represses the expression of flagella (flhDC) and curli (csgD). Figure modified from
Huang et al., 2006.

3
Cellulose, better known for its role as the main component of plant cell wall, is
essentially a homopolysaccharide consisting of D-glucopyranose units linked by β-14
glycosidic bonds. In bacteria, it is produced by many Enterobacteriaceae, including
commensal and pathogenic E. coli (Zogaj et al., 2001; Zogaj et al., 2003; Da Re & Ghigo,
2006). In these bacteria, cellulose production can lead to the formation of a rigid biofilm
at the air-liquid interface, the characteristics of which varies depending on the strains and
environmental conditions (Beloin et al., 2008). Cellulose synthesis genes are located in
two divergently organised operons, bcsABZC and bcsEFG, which are constitutively
transcribed (Zogaj et al., 2001; Solano et al., 2002). However, cellulose synthesis per se
is activated by YaiC (AdrA in Salmonella) at a posttranscriptional level, by controlling
the synthesis of the ubiquitous bacterial second messenger bis-(3’-5’)-cyclic-diguanosine
monophosphate (c-di-GMP). Cellulose does not contribute to early biofilm formation,
and its co-expression with curli, under the control of CsgD, may even impair biofilm
formation in certain conditions (Gualdi et al., 2008), although the co-existence of
cellulose and curli can result in the formation of hydrophobic extracellular matrix (Zogaj
et al., 2001).
Colanic acid or M antigen is a negatively charged extracellular polysaccharide that is
produced by E. coli and other species of the Enterobacteriaceae. It forms a protective
layer around the bacterial cell in response to certain environmental stress, and is not
produced in rich medium at 37°C (Beloin et al., 2008). Colanic acid is not required
during initial attachment to abiotic surface but is important for the complex 3D structure
and depth of biofilm, and its synthesis is consistently up-regulated in biofilms (Prigent-
Combaret et al., 1999; Danese et al., 2000b; Hanna et al., 2003). Colanic acid synthesis
by the wca operon (formerly named cps) is induced by the Rcs phosphorelay involving
RcsC/RcsD/RcsB and the auxiliary co-activator RcsA (Figure 1.2) (Huang et al., 2006).
The signals activating the Rcs system are not well characterized. Environmental
conditions such as desiccation, osmotic shock and growth at low temperature (20°C) with
glucose as a carbon source have been reported to activate the Rcs phosphorelay (Ophir &
Gutnick, 1994; Sledjeski & Gottesman, 1996; Hagiwara et al., 2003). The Rcs system not
only activates colanic acid that is important for biofilm maturation, but also represses the
4
expression of cell surface structures involved in motility and attachment such as flagella,
Ag43 and curli (Figure 1.2), thereby controlling the transition from attached cells to
mature biofilm (Francez-Charlot et al., 2003; Ferrieres & Clarke, 2003).
1.1.1.2 Flagella
During the first step of biofilm formation, the planktonic bacterium approaches solid
surfaces and initial reversible attachment occurs. This has to take place in the presence of
not only the passive movement of Brownian or gravitational forces, but also repulsive
electrostatic and hydrodynamic forces around the surfaces. One means by which the
planktonic bacteria can overcome these obstacles to arrive at the surface (Donlan, 2002)
is via the use of their motility appendage, flagella. In Gram-negative bacteria such as E.
coli and Salmonella, flagella enable them to swim in liquid or semi-liquid medium. Pratt
and Kolter showed that motility, but not chemotaxis, was required for initial cell-surface
contact, possibly by overcoming the repulsive forces (Pratt & Kolter, 1998). Wood and
co-workers confirmed using different motility mutants that biofilm formation ability of E.
coli K-12 directly correlated with their ability to swim (Wood et al., 2006). Flagella
synthesis in E. coli and Salmonella involves fliC, encoding the building block of the
flagella filament, flagellin (Fernandez & Berenguer, 2000) and flhDC, which encodes the
master regulator required for the expression of all other genes of the flagellar regulon
(Soutourina & Bertin, 2003). However, in E. coli strains that overproduce curli (see
Section 1.1.1.5), flagella are dispensable for biofilm formation and development (Prigent-
Combaret et al., 2000). It has been demonstrated that inverse regulatory coordination of
flagella and surface adherence structures such as curli exist to facilitate bacteria’s change
of lifestyle (Pesavento et al., 2008).
Whereas some adherence factors are restricted to specific E. coli pathotypes, being
located on plasmids or pathogenicity islands, the E. coli species core genome contains
general colonization factors such as Ag43, type 1 pili or curli (Beloin et al., 2005). The
following section focuses on these common adherence factors.

Figure 1.3 Model describing the coordination of the phase-variable Fim and Ag43
phenotypes via OxyR-relayed thiol–disulfide signal transduction. In the fimbrial
phase on state, disulfide bond formation of fimbrial subunit proteins takes place in the
periplasm catalysed by DsbA, -B and -C. The thiol–disulfide status of glutathione is
monitored by OxyR, which under these conditions is driven to the reduced state and acts
as an active repressor of the agn43/flu gene. Other auxiliary enzymes are indicated. In the
fimbrial phase off state, OxyR can exist as both a reduced and oxidized form, with the
result that repression of Ag43 synthesis is relieved. Figure from Schembri & Klemm,
2001.
5
1.1.1.3 Antigen 43
Biofilm development undergoes a stage of microcolony formation (Figure 1.1, stage 3)
which results in the formation of early biofilm architecture. This is probably the stage
that involves the most surface factors (Van Houdt & Michiels, 2005), one of which is the
outer membrane protein Antigen 43 (Ag43) in E. coli, described as “the most abundant
phase-varying outer membrane protein” (Henderson & Owen, 1999). It is encoded by a
single gene originally designated “flu” for “fluffing”, because a change in this gene
prevented bacteria flocculation in planktonic culture and altered the morphology of
colonies on agar plate (Diderichsen, 1980). In recent years, this gene has frequently been
referred to as agn43, which will also be the name used in this work. Ag43 is a self
recognising surface autotransporter protein, which possesses both receptor target and
receptor recognition domains (Klemm et al., 2004). It promotes cell-cell adhesion by an
intercellular handshake mechanism (Hasman et al., 1999), thus giving the “clump”
formation phenotype in liquid cultures. Although Ag43 is apparently not involved in non-
specific initial adhesion to abiotic surfaces (Kjaergaard et al., 2000a), it appears capable
of promoting multispecies biofilm formation, for example, between E. coli and P.
aeruginosa (Danese et al., 2000a; Kjaergaard et al., 2000b). Clinical studies
demonstrated that Ag43 proteins promoted long-term persistence of uropathogenic E. coli
isolates in the urinary tract (Ulett et al., 2007; Luthje & Brauner, 2010).
The expression of Ag43 is phase variable, governed by the concerted action of both the
DNA-methylating enzyme deoxyadenosine methylase (Dam) for activation and the
transcriptional regulator OxyR for repression (Haagmans & van der Woude, 2000;
Schembri et al., 2003a). The coordinated regulation of agn43 and the other phase variable
regulated fim cluster gene has earlier been reported and hypothesised as due to steric
hindrance of Ag43-Ag43 interaction by type 1 pili (Hasman et al., 1999). However, it
was later found that type 1 pili expression is in fact dominant to Ag43 and that the
expression of type 1 pili per se constitutes a signal transduction mechanism that affects
the thiol-disulfide status of OxyR, the thiol form of which represses agn43 expression
(Figure 1.3) (Schembri & Klemm, 2001).

Figure 1.4 A schematic representation of type 1 pili. The FimH adhesin is shown in
green while the chaperone FimC attached to the last subunit to be incorporated into the
pilus in yellow. Numbers indicate the number of copies of each subunit in the pilus. The
usher dimers are indicated in purple and blue. E, extracellular space; P, periplasm. Figure
modified from Waksman et al. 2009.

6
1.1.1.4 Type 1 pili
During the irreversible attachment of bacteria to surface (Figure 1.1, stage 2), surface
factors such as type 1 pili and curli come into play. Type 1 pili are the most common
adhesins expressed by both commensal and pathogenic E. coli isolates (Sauer et al.,
2000). They are filamentous adhesins with a tubular structure about 7 nm in diameter and
approximately 1 µm long, composed mainly of the structural subunit protein FimA and
the mannose-specific adhesin located at the tip of the pilus, FimH (Figure 1.4). The
adaptor subunits FimG and FimF connect FimA and FimH, while the transmembrane
usher FimD and chaperone FimC mediate pilus type I pili fibre formation (Hahn et al.,
2002; Remaut et al., 2008; Waksman & Hultgren, 2009).
FimH adhesin binds to eukaryotic mannose oligosaccharides (Duncan et al., 2005), and
plays a role in the formation of secreted IgA mediated biofilm within the gut (Bollinger et
al., 2003; Orndorff et al., 2004; Bollinger et al., 2006). Type 1 pili also mediates bacterial
invasion by facilitating adherence of uropathogenic E. coli to superficial bladder
epithelial cells. Interactions between FimH and bladder epithelial cells induce host
signalling cascades that may trigger cell apoptosis (Schilling et al., 2001). In addition to
eukaryotic cell components, FimH adhesin also binds to abiotic surfaces through non-
specific binding (Pratt & Kolter, 1998; Beloin et al., 2004).
Type 1 pili expression is induced during adhesion and biofilm formation at early and late
stages (Schembri et al., 2003b; Ren et al., 2004). It was thought that the highest
probability of type 1 expression occurs at 37°C, in rich amino-acid-replete medium
(Gally et al., 1993). However, it was later shown that fim cluster expression increased in
biofilms grown in minimal medium in continuous flow chamber cultures (Schembri et al.,
2003b). The expression of fimA and fimH are regulated by the fim regulatory cluster in a
phase variable fashion (van der Woude, 2006). The promoter for fimA is located in a
short segment of invertible DNA called fim switch (fimS), the orientation of which
determines whether fimA is transcribed (ON phase) or not (OFF phase) (Abraham et al.,
1985). The inversion of switch is catalysed by two tyrosine-class recombinases FimE and
FimB. While FimE promotes primarily the ON-to-OFF inversion, FimB inverts the

Figure 1.5 A schematic representation of the two curli gene operons. The csg operon
is organised in two clusters, csgBA and csgDEFG. CsgD is a transcriptional activator of
the csgBAC operon.
Figure 1.6 The secretion and assembly machinery for curli formation in E. coli.
Products of both csgBA and csgDEFG operons are required for curli biosynthesis. CsgD
activates of the csgBA transcription. CsgB, CsgA, CsgE, CsgF and CsgG are transported
across the inner membrane (IM) with the aid of their SEC signal. CsgG, CsgE and CsgF
interacts at the outer membrane (OM), and CsgA and CsgB are secreted across the outer
membrane in a CsgG-dependent manner. CsgB interacts with the outer membrane and
presents an amyloid-like template to soluble CsgA (red triangles). CsgA adopts the
amyloid conformation (red ovals) and becomes anchored to the cell surface and fold onto
unpolymerized CsgA monomers. Figure from Epstein & Chapman, 2008.

7
switch in both directions. When they are co-expressed, FimE is dominant over FimB and
turns the switch to OFF phase (Klemm, 1986; Gally et al., 1996; Blomfield et al., 1997).
The fim switch is also regulated by global regulators including integration host factor
(IHF), leucine-responsive regulatory protein (Lrp) and histone-like nucleoid structuring
protein (H-NS) (van der Woude & Baumler, 2004). Recently fimE- and fimB-independent
fimS phase variation by tyrosine site-specific recombinase HbiF has been reported in E.
coli K1, which causes meningitis (Xie et al., 2006), and by two recombinases encoded by
ipuA and ibpA in UPEC CFT073 (Bryan et al., 2006).
Expression of fimbriae and adhesins in E. coli appears coordinated. Coordination
between type 1 pili and Ag43 production is the best characterized (see above), but
coordination with other fimbriae found in uropathogenic E. coli, such as P and F1C
fimbriae was also shown (Holden et al., 2006; Lindberg et al., 2008).
1.1.1.5 Curli
Another extracellular structure important for stable bacteria attachment to surfaces is curli.
Curli are thin proteinaceous fimbriae initially identified in E. coli (Olsen et al., 1989),
and subsequently also found to be produced by other Enterobacteriaceae such as
Salmonella (Collinson et al., 1993), Shigella, Citrobacter and Enterobacter (Smyth et al.,
1996). Six proteins encoded by two divergent operons direct curli formation (Figure 1.5).
Curli fibers are composed of a major subunit CsgA and a minor subunit CsgB. CsgA
remains unpolymerized until it encounters the surface nucleator CsgB, which initiates
CsgA polymerization. CsgD is a transcriptional activator for the csgBA operon. CsgG,
CsgE, and CsgF are structural accessory proteins involved in secretion and stabilization
of the fibre subunits and modulation of fiber assembly. CsgG is proposed to be the curli
secretion apparatus that directs the secretion of CsgA, CsgB, and CsgF across the outer
membrane (Barnhart & Chapman, 2006; Epstein & Chapman, 2008) (Figure 1.6).
These structures are known for three main functions. First, curli fibres mediate cell-
surface and cell-cell interactions, thus promoting biofilm formation on abiotic surfaces

8
such as sand, glass or biomaterials (Vidal et al., 1998; Cookson et al., 2002; Uhlich et al.,
2006).
Second, curli production is often associated with virulence. In food contamination,
adhesion of the O157:H7 strain (Shiga toxin producing strain of E. coli) to tomato skin,
spinach leaves and roots of alfalfa sprouts has been shown to be mediated by curli (Jeter
& Matthysse, 2005). These adhesion properties enhance both bacterial survival in harsh
environmental conditions as well as bacterial dissemination. Moreover, several clues also
indicate that curli actively participate in mammalian host colonization. Curli bind to
human host proteins including fibronectin and plasminogen (Olsen et al., 1989; Ben Nasr
et al., 1996) and mediate internalisation of E. coli by eukaryotic cells (Gophna et al.,
2001; Gophna et al., 2002; Wang et al., 2006). Antibodies to CsgA were present in the
sera from sepsis patients. E. coli isolates from blood of these patients expressed curli at
37°C in vitro, and curli-expressing E. coli K-12 strains induced higher levels of
proinflammatory cytokines in human macrophages (Bian et al., 2000), increased the
release in human plasma of bradykinin – a potent inducer of fever, pain and hypotension
(Herwald et al., 1998) – and resulted in a decreased blood pressure in systemically
infected mice compared to isogenic curli deficient mutants (Bian et al., 2001).
Third, curli fibres provide protection to the bacteria in harsh environment such as from
antibacterial agents like chlorine or quaternary ammonium sanitizer (Ryu & Beuchat,
2005; Uhlich et al., 2006). Formation of biofilm by a strain expressing curli may confer
resistance to heavy metals by retarding metal diffusion (Hu et al., 2005; Hu et al., 2007;
Perrin et al., 2009; Hidalgo et al., 2010). Curli’s protection function is associated with its
distinct biochemical and biophysical properties, the most characteristic of which is its
remarkable resistance to chemical and thermal denaturation (Gebbink et al., 2005), as
swell as metal sorbing (Hidalgo et al., 2010). The benefits enjoyed by curli producing
bacteria have been conferred by the amyloid properties of these astonishing structures.
Amyloids (Chapman et al., 2002) in human are traditionally associated with
neurodegenerative diseases including Alzheimers and Parkinson’s diseases (Cohen &
Kelly, 2003), and are the product of protein misfolding (Chiti & Dobson, 2006). In

9
contrast, bacterial amyloid fibres such as curli are actively synthesized and assembled
under tight regulation (Wang et al., 2010). To appreciate the sophistication in the
regulation of curli expression, one needs to look at the genetic components involved
(Figure 1.5). First and foremost, genes for curli production are organised in two
divergently transcribed operons csgBA and csgDEFG. Expression of curli is cryptic in
most E. coli laboratory strains due to csgD promoter silencing (Hammar et al., 1995).
Control of curli production by environmental or clinical isolates occurs mainly at this
regulatory step rather than by loss or acquisition of the curli genes.
1.1.1.6 The complex regulation of curli synthesis
1.1.1.6.1 Environmental conditions
Temperature, osmolarity and slow growth are key factors for curli-dependent host
colonization. It is generally considered that curli expression occurs at temperature below
30°C (Olsen et al., 1989), and the most common conditions recognised in laboratory E.
coli strains for maximal curli expression are growth below 30°C, in low osmolarity, and
nutrient-limiting media (Vidal et al., 1998; Jubelin et al., 2005). Moreover, curli
expression takes place during entry into stationary phase (Olsen et al., 1993). However,
Kikuchi and colleagues have shown, surprisingly, that E. coli K-12 strain in biofilm can
produce curli at 37°C (Kikuchi et al., 2005). Apparently, over expression or mutations in
the csgD promoter region can also lead to curli expression at 37°C (Uhlich et al., 2001;
Gualdi et al., 2008). Furthermore, clinical and environmental isolates of E. coli have been
shown to synthesize curli at 37°C (Bian et al., 2000; Beloin et al., 2008; Saldana et al.,
2009). From the published data, the temperature regulation of curli appears to be strain
specific and may be quickly modified by regulatory mutations. Oxygen tension is also
involved in CsgD-mediated curli regulation, with the highest csgD expression found in
micro-aerobic conditions in rich medium (Gerstel et al., 2006), and favourable csgD
expression under aerobic atmosphere in minimum medium (Smith et al., 2006).

10
1.1.1.6.2 Genetic regulation
Genetic regulation of curli production is subject to some variations depending on species
and strains, but is globally well conserved. More than ten transcriptional factors regulate
the transcriptional activator CsgD of the structural curli operon in a complex interplay.
These regulators can be categorized into 4 groups.
The first group constitutes global regulators. In this group, Nucleoid-Associated Proteins
(NAPSs) including H-NS (Dorman, 2004), IHF (Gerstel & Romling, 2001; Gerstel et al.,
2006) and FIS (Saldana et al., 2009) play an important role in the curli genes
transcription. Moreover, RpoS (σS), a general stress sigma factor controls many
stationary phase-inducible genes including the curli genes (Arnqvist et al., 1994) with the
cooperation of Crl (Bougdour et al., 2004).
The second group consists of regulators which are members of signal transduction
pathways, such as OmpR (Vidal 1998), CpxR (Dorel 1999), RcsB (Vianney et al., 2005),
and RstA (Ogasawara et al., 2007b; Ogasawara et al., 2010a). A model integrating
interplay between several of these signal transduction pathway was proposed in Jubelin et
al., 2005 (Jubelin et al., 2005) and in Ogasawara et al., 2010 (Ogasawara et al., 2010a).
When osmolarity is low to moderate, OmpR is activated, which activates csgD promoter,
and CsgD in turn activates the transcription of csgBA (Prigent-Combaret et al., 2001). On
the other hand, the Cpx system, that responds to envelope stresses such as high
osmolarity, overproduction and misfolding of membrane proteins and elevated pH
(Raivio & Silhavy, 2001), as well as the Rcs system that also responds to envelope stress
regulates csgBA expression negatively and will turn off the curli production in fixed cells
(Dorel et al., 1999). Vidal and co-worker have discovered that a point mutation at the 234
position of the ompR gene, leading to a leucine to arginine residue change at position 43,
resulted in a constitutively active OmpR that mediates high expression of csgBA and
elevated curli production (Vidal et al., 1998). This mutation is termed “ompR234”. E. coli
strains that normally do not make biofilms would form biofilm with the incorporation of
the ompR234 mutation that causes curli overproduction.
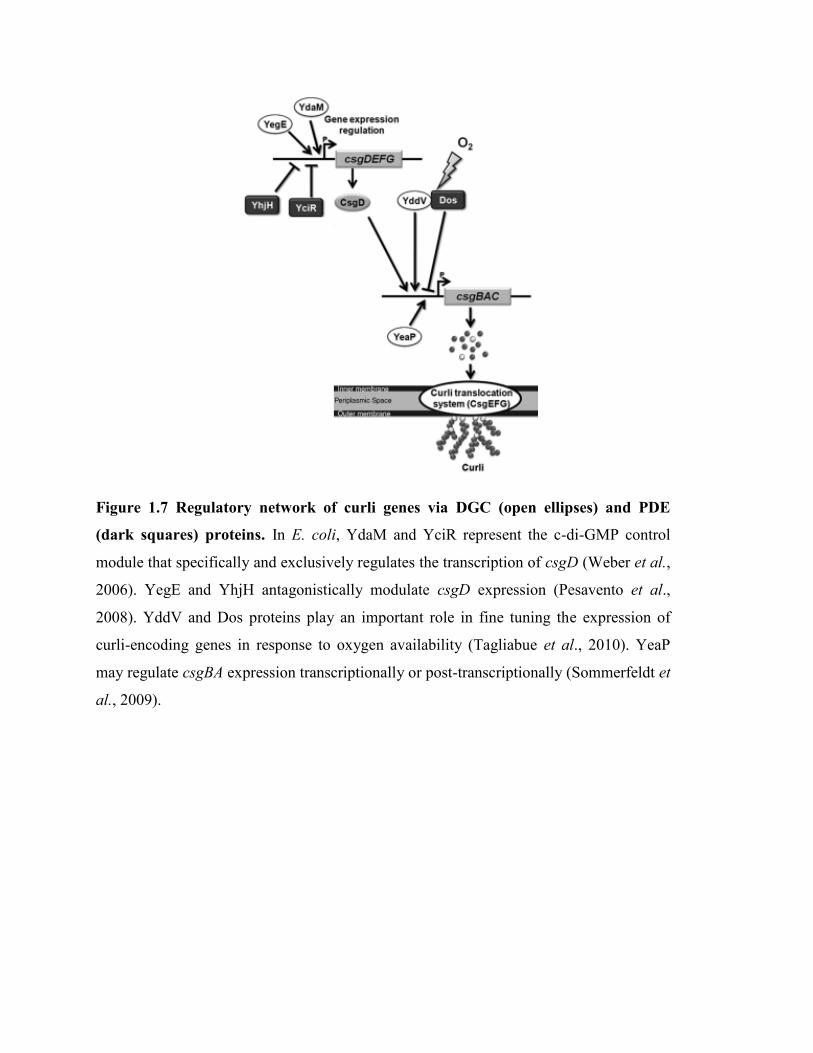
Figure 1.7 Regulatory network of curli genes via DGC (open ellipses) and PDE
(dark squares) proteins. In E. coli, YdaM and YciR represent the c-di-GMP control
module that specifically and exclusively regulates the transcription of csgD (Weber et al.,
2006). YegE and YhjH antagonistically modulate csgD expression (Pesavento et al.,
2008). YddV and Dos proteins play an important role in fine tuning the expression of
curli-encoding genes in response to oxygen availability (Tagliabue et al., 2010). YeaP
may regulate csgBA expression transcriptionally or post-transcriptionally (Sommerfeldt et
al., 2009).

11
Regulators affecting only a small number of genes, such as MlrA (Brown et al., 2001;
Ogasawara et al., 2010b), constitute a third group.
Lastly, beside these conventional transcriptional regulators, proteins involved in c-di-
GMP metabolism indirectly but undoubtedly affect the production of curli. The c-di-
GMP is a secondary messenger widely used by bacteria and invoved in the transition
between planktonic and sessile life style (Simm et al., 2004). The production of curli
fibers appears strongly stimulated by c-di-GMP (Weber et al., 2006). Six different genes
encoding c-di-GMP-related proteins are involved in curli gene regulation (Sommerfeldt
et al., 2009). A model summarizing gene expression regulation of curli genes by
diguanylate cyclases (DGC) and phosphodiesterase (PDE) proteins was proposed
(Tagliabue et al., 2010) and shown in (Figure 1.7).
In addition to control by transcriptional regulators, post-transcriptional control is
involved in curli expression, and occurs via two antisense RNAs that target the
transcriptional regulator CsgD to inhibit curli synthesis (Holmqvist et al., 2010).
Talking about curli regulation, one has to recall that evidence exists for regulatory
relationships between flagella and fimbriae, between flagella and capsule, and between
different types of fimbriae (reviewed in (Pruss et al., 2006). Therefore, such a complexity
of the curli transcriptional regulatory network is not surprising.
1.1.2 Biofilm development is a dynamic and adaptive process
1.1.2.1 Dynamics of extracellular structure production.
The dispersal step of biofilm development (Figure 1.1, stage 5) has recently gained
increasing attention because of its important role in bacteria transmissions including
those from environment to human hosts, in horizontal and vertical transmission, as well
as the exacerbation and spread of infection within the host (Hall-Stoodley & Stoodley,
2005; Kaplan, 2010). In this “final” stage of biofilm development, single cells are

12
released from the biofilm, and temporarily exist as planktonic cells, where flagella are
again employed. The bacteria are then ready to migrate to new colonization sites to start
the biofilm life cycle all over again. This phenomenon, as the sequential production of
fimbriae and exopolysaccharides (stages 2 and 3), illustrates the regulatory dynamics
occurring through biofilm development and points at the necessity to develop appropriate
tools allowing dynamic gene expression survey.
1.1.2.2 Adaptive nature of biofilm development.
Having learnt the advantages of bacteria survival in biofilm and its life cycle involving
extracellular structures, we tend to correlate chronic or recurrent infections in the human
body with bacterial biofilm persistence due to their ability to express surface adhesion
structures and form biofilms. However, it should not be neglected that the biofilm
formation ability of E. coli isolates is not solely associated with their pathogenecity or
surface adhesins, but rather dependent on their growth condition, to which different
isolates respond differently (Reisner et al., 2006). Dong and Schellhorn have shown that
the nature of the RpoS-controlled regulon in minimal media was substantially different
from that expressed in rich media (Dong & Schellhorn, 2009). For example, in minimal
media, genes coding for flagella synthesis and motility are down regulated compared to
that in rich media, while agn43 is up regulated. Therefore, caution should be exercised
when it comes to analysis of biofilm data. Differential regulatory responses between
different strains and/or different conditions are not surprising due to the complexity of
genetic and environmental factors in biofilm formation of E. coli.
1.2 Biofilm in the human body
Besides the harsh environment in nature, bacteria also inhabit the warm and nutrient-rich
human body. Due to bacteria’s requirement of moisture for survival, they mainly live on
cutaneous and mucosal surfaces, of which the gastrointestinal tracts are the most heavily
colonised. Sterile at birth, the human colon is colonised with bacteria during parturition
(Macfarlane & McBain, 1999), and the first colonisers are generally facultative anaerobes,

13
such as enterococci and enterobacteria, followed by obligate anaerobes. Upon weaning, a
complex adult type microbiota is established (Probert & Gibson, 2002).
1.2.1 Symbiotic microbiota as a human organ
After millions of years of co-evolution, trillions of microbes live harmoniously in the
mammalian gut (Nilsen & Graveley, 2010), contributing to the mutualistic relationship
between the microbe and the host. The microbe-host interactions are found to be essential
to the host’s physiology, influencing the metabolism, energy utilisation and storage, as
well as immune homeostasis (Backhed et al., 2004; Guarner et al., 2006; Martin et al.,
2007). For instance, plant polysaccharides that are not digestible by human are the main
substrates for microbial growth in the colon, while the fermentation products provide the
host with important energy source (Flint et al., 2007). Therefore, the ability of the
commensal to degrade polysaccharides determines the calories the host can extract from
its diet, thus influencing the survival of both host and microbiota (Sonnenburg, 2010).
The microbiota of each individual is as unique as fingerprints and has its share of impact
on host physiology, ranging from obesity, immune development and even ageing
(Turnbaugh & Gordon, 2009; Barrett, 2009; Backhed & Crawford, 2010; Tiihonen et al.,
2010). Moreover, the microbial commensals may have evolved to improve their own
fitness by improving the fitness of their host (Guarner & Malagelada, 2003; Sachs et al.,
2004; Dethlefsen et al., 2007). For example, they can both compete with pathogens for
resources as effective consumers and secrete molecules that inhibit pathogen growth
(Tilman, 2004; Reid & Bruce, 2006); they could also detoxify compounds harmful to the
host, thereby increasing the lifespan of the host (Pool-Zobel et al., 2005), in turn giving
themselves more opportunities to spread. The importance of this mutualism has led to the
birth of the Human Microbiome Project, which aims to collect the genomic information
of all the microorganisms in the human body. The close and specific contact of the
complex microbial ecosystem in our intestines with human cells, exchanging nutrients
and metabolic wastes, makes symbiotic bacteria essentially a human organ and their
collective genomes our second genome (Zhao, 2010; Possemiers et al., 2010).

14
Adhesion of the bacteria to the host surface in gastrointestinal
tract is essential to maintain
members of this normal microflora. Even though anaerobic bacteria largely outnumber E.
coli in the gastrointestinal tract (Berg, 1996), E. coli is the predominant aerobic
microorganism in the intestine and is among the first species to colonize the infant gut
(Mackie et al., 1999). Moreover, E. coli is also critical in all diarrheal infections caused
by pathogenic E. coli strains (Torres et al., 2005). In this respect, the step of E. coli
attachment to the overlying mucus gel layer of the intestinal epithelium is fundamental
both to the establishment of a stable commensal microbiota and to the intestinal disease
development.
1.2.2 The importance of mucin
However, as the French proverb says “La liberté des uns s'arrête là où commence celle
des autres”, which translates into “the freedom of one exists up to the point where it starts
to infringe on that of others”, the symbiotic nature of the intestinal host-microbial
relationship is relevant only if bacteria penetration of host tissues is effectively limited
(Duerkop et al., 2009). This limitation is facilitated by the mucus layer, which consists of
complex mucin glycoproteins secreted by specialised goblet cells (Corfield et al., 2000).
There are 21 different mucin genes identified and MUC2 is the major mucin produced by
the intestinal mucosa (Sharma et al., 2010). It has been shown that two layers of mucus
exist on the epithelial lining: the densely packed inner layer devoid of bacteria that serve
as a physical barrier preventing bacteria penetration, and the loose bacteria-containing
outer layer. A vivid example illustrating the proverb can be found within this context:
while the commensal E. coli limit themselves within the mucus layer and does not
infringe on the host, the diarrheagenic E. coli strains are defined and characterized by
their ability to penetrate the mucus layer and efficiently colonize the mucosa to the
detriment of the host (Torres et al., 2005).
It has long been thought that mucins only serve to protect and lubricate the epithelial
surfaces, until recently researchers found that they participate in many other important

Figure 1.8 Various environment encountered by bacteria such as E. coli. The
potentially pathogenic E. coli are ingested by cows and other ruminants (1). They
colonise the intestinal tract but not always cause disease. The bacteria are excreted as
feces and contaminate the environment including drinking water and streams (2). There
can also be contamination of various foods such as fruits, vegetables and raw milk (3).
The carcass of the animal can also be contaminated during slaughtering. People in direct
contact with the animal, including those working in farms or slaughterhouses, may be
contaminated by bacteria too (4). Finally, bacterial transmission can occur between
human hosts (5). Figure is adopted from the website of Montreal University
(http://www.ecl-lab.com/fr/ecoli/pathogenesis.asp).
Fecal excretion + contamination
of the environment
Contamination of food
and water
Transmission
between human
host
Transmission from animal
to human host
(farms, slaughterhouse…)
Ingestion of pathogenic
E. coli

15
functions such as growth, epithelial renewal, differentiation, barrier integrity, metastasis,
carcinogenesis and even foetal development (Moniaux et al., 2001; Corfield et al., 2001;
Vieten et al., 2005). In the case of intestinal mucin, it is involved directly and indirectly
in the enteric host defence against harmful microorganisms (Lievin-Le Moal & Servin,
2006). As early as 1974, mucin has been reported to bind to cholera toxin and inhibit its
action (Strombeck & Harrold, 1974). More recent findings demonstrated that probiotics,
which are live microorganisms that when administered in adequate amounts confer a
health benefit on the host, and mainly represented by Lactic Acid Bacteria, can act by
inducing mucin gene expression (Mack et al., 1999; Lutgendorff et al., 2008). It is now
suggested, in addition, that the mucus layer acts as a source of nutrients to intestinal
commensal bacteria, which may be an advantage for them to efficiently colonise the
mucus layer or the epithelial cell surface underneath (Hoskins et al., 1985; Yang et al.,
2007; Ruas-Madiedo et al., 2008; Fakhry et al., 2009). Although mucin degradation has
been linked to pathogenesis (Pultz et al., 2006; Vieira et al., 2010) because of the mucus
layer’s role as a physical barrier to pathogen adhesion to epithelial cells (Moncada et al.,
2003), the ability to degrade mucin was also observed in commensal and probiotic
bacteria, which are closely associated with the human gut epithelial cells without
showing cytotoxicity (Fakhry et al., 2009). Thus mucin degradation can be beneficial in
that it regulates mucin turnover and may stimulate the shedding of mucus layer that helps
to eliminate the colonizing pathogens, while affecting commensals less due to their
growth advantage in colonising the new mucus layer.
1.2.3 From the bacterial point of view
Bacteria such as E. coli face changing environments, from water, soil, food to
mammalian urinary or digestive tract (Figure 1.8). Published data show that
enterobacteria such as E. coli owns in its core genome a whole set of adherence
structures (Beloin et al., 2008), and amongst others, gene transfer of the F plasmid
enabling the expression of F conjugative pilus adds on to the variety (Ghigo, 2001). The
production of theses extracellular structures are under complex regulation in response to

16
external environmental conditions, resulting in biofilm establishment in different
locations (environment or gut).
E. coli can sense environmental changes via mainly two-component signalling pathways
such as EnvZ-OmpR or CpxA-CpxR (Jubelin et al., 2005) but also via nucleoid-
associated protein such as H-NS (Dorman, 2007). Noticeably, all these proteins can
detect changes in osmolarity, a fluctuant parameter in the environment as in the host, and
were shown to regulate adherence structure such as curli and concomitant biofilm
formation (Gerstel et al., 2006; Dorel et al., 2006; Dorman et al., 2009).
In this work, we want to explore the transcriptional response of E. coli when facing new
environment constituted by human gut. As the gut epithelial cells are covered by a layer
of mucus, a first perception is likely to be bacterial mucin sensing and their interaction
with other commensal bacteria. Establishment and optimisation of appropriate
experimental models and tools are needed to trace E. coli in mixed communities.
1.3 Objective
Given all these facts, we could see the importance of the collaborative effort of mucin
and commensal bacteria in maintaining the health of the host at the front line of the host-
environment interaction, due to the interdependence between mucin and the commensal
microbiota. While the effect of mucin and commensal bacteria on pathogen colonisation
has been much investigated, the influence of mucin on commensals and the consequent
interaction between commensal species has not been addressed. Commensal bacteria are
known to antagonise pathogen colonisation by production of antimicrobial substances,
pH modification of the luminal content, and competition for nutrients, but would mucin’s
presence enhance the competitiveness of and/or the interaction between the commensals
against pathogens?
In this work, I attempt to examine the effect of mucin on the biofilm formation of the
well characterised commensal strain E. coli, which is one of the representative

17
commensal strains in the microbiota of neonate’s intestine (Fanaro et al., 2003). E. coli
strain MG1655 was utilized here and by other groups (Barbas et al., 2009; Bollinger et
al., 2006) because of its extensive characterization and facility to be genetically modified.
Since curli production is frequent in faecal isolates and that regulatory mutations often
tun off curli genes when bacteria are grown outside the host, both MG1655 and its curli-
producing ompR234 derivative were used.
Two other representative strains Klebsiella pneumoniae and Enterococcus faecalis are
also chosen in this study to investigate the interactive relationship between these
commensal strains in a dual- or multi-species context. Three main objectives were
defined:
1) Design experimental models and analytical tools (Chapter 2). The process of how I
developed experimental models, strains and analytical tools to serve the purpose of
the project is described in this chapter. In bacterial co-culture, it is important that one
species be discerned from the other. Chromogenic agar was thus employed for certain
type of analyses, and E. coli whole cell-labelled with green fluorescence protein (GFP)
– to be distinguished from K. pneumoniae and E. faecalis – was used for other types
of analyses. In order to monitor the influence of partner species on E. coli gene
expression, both GFP and red fluorescence protein (RFP) as transcriptional reporters
were tested for application in my system. The dual fluorescence system (GFP for E.
coli whole cell labelling, RFP for promoter-reporting) developed by the Singapore
laboratory (Miao et al., 2009) allows profiling of E. coli transcriptional response in
co-culture with K. pneumoniae and E. faecalis. For my project, a reversed dual
fluorescence labelling (red-green reversed) was attempted. The success encountered
and challenges faced in these attempts are presented.
2) E. coli response to mucin (Chapter 3). Various concentrations of mucin were tested
with a few commonly used laboratory E. coli strains and low concentrations of mucin
were found to promote biofilm formation in all strains tested. Investigation using the
fluorescence tagged promoter validated in Chapter 2 suggested curli’s involvement in

18
the mucin-induced biofilm formation. Involvement of a few other extracellular
adhesion structures was checked. After examining the regulatory pathway of curli
synthesis, we speculated on the possible mechanism for the curli-dependent biofilm
induction by mucin.
3) Influence of curli on E. coli interaction with two other commensal bacteria (K.
pneumoniae and E. faecalis). In Chapter 4, the population relationship between E.
coli, K. pneumoniae and E. faecalis in both planktonic and biofilm states, is presented
in the context of curli expression. The presence of curli alters the surface property of
E. coli, and may influence the interspecies interactions between E. coli and its
commensal partner species. Therefore, curli-expressing E. coli mutants are used for
comparison with the wild type in terms of the population relationship being
manifested, and the implications are discussed.
With regard to the results and conclusions drawn from the previous chapters, I propose in
Chapter 5 the future direction of this work so as to deepen our understanding on the
complex interactions between commensal bacteria and the environment as well as
between different commensal species.
Chapter 6 describes the materials and methods employed in this project. It is placed at the
end of this thesis in order not to interrupt the flow of reading.
Since this work was carried out in two laboratories (one in France and the other in
Singapore) with 6 to 8 months alternation, the different equipments with same functions
(for example, fluorometer and confocal microscope) used in the two laboratories render it
difficult to compare the results at times. However, this does not affect the comparison
within each experiment and the trend does not change with different equipments. Thus
experiments conducted using the same machine were all presented in the same scale
whereas comparison between results obtained from different machines were adjusted to
scales that best illustrate the trend of the data.

19
Chapter 2 Experimental models and analytical tools
Very little research has been carried out on the interspecies interactions between
commensal bacteria using multi-species cultures as experimental models, and reviews on
this aspect has only started to appear in the last 2 years (Little et al., 2008; Haruta et al.,
2009; Hibbing et al., 2010). Fundamentally, the influence of a partner species can be
expected to be reflected in the gene expression profile. Studies on gene expression have
been conducted at the transcriptional (such as microarray, differential fluorescence
induction, and in vivo expression technology) and post-transcriptional (for example,
signature-tagged mutagenesis and proteomic method) level in pure culture models, but
the technical difficulties of applying them in multi-species analysis may have been the
main cause of the lack of data on this subject.
As such, I cannot rely much on currently available methods, and need to proceed
stepwise by assessing established experimental conditions and concurrently developing
necessary new tools specifically for this project. These further need to be optimised and
validated. In this chapter, the procedures used and constraints encountered are presented.
2.1 Growth media and temperature
The natural habitat of E.coli in human intestine is characterised by fluxes of high and low
osmolarity, and such changes in E. coli’s environment are the basis of the regulated
expression of curli, around which this work is centred. The osmolarity fluxes can also be
expected to impact the other biological question central to this study i.e. interaction of E.
coli with K. pneumoniae and E. faecalis, the two commensal partners. Hence, to mimic
this aspect of E. coli exposure to environmental signals, we chose two appropriate media,
drawing on the experience of both the French and Singapore laboratories: Brain Heart
Infusion (BHI) broth for the high osmolarity condition and M63 minimal medium for the
low osmolarity condition.
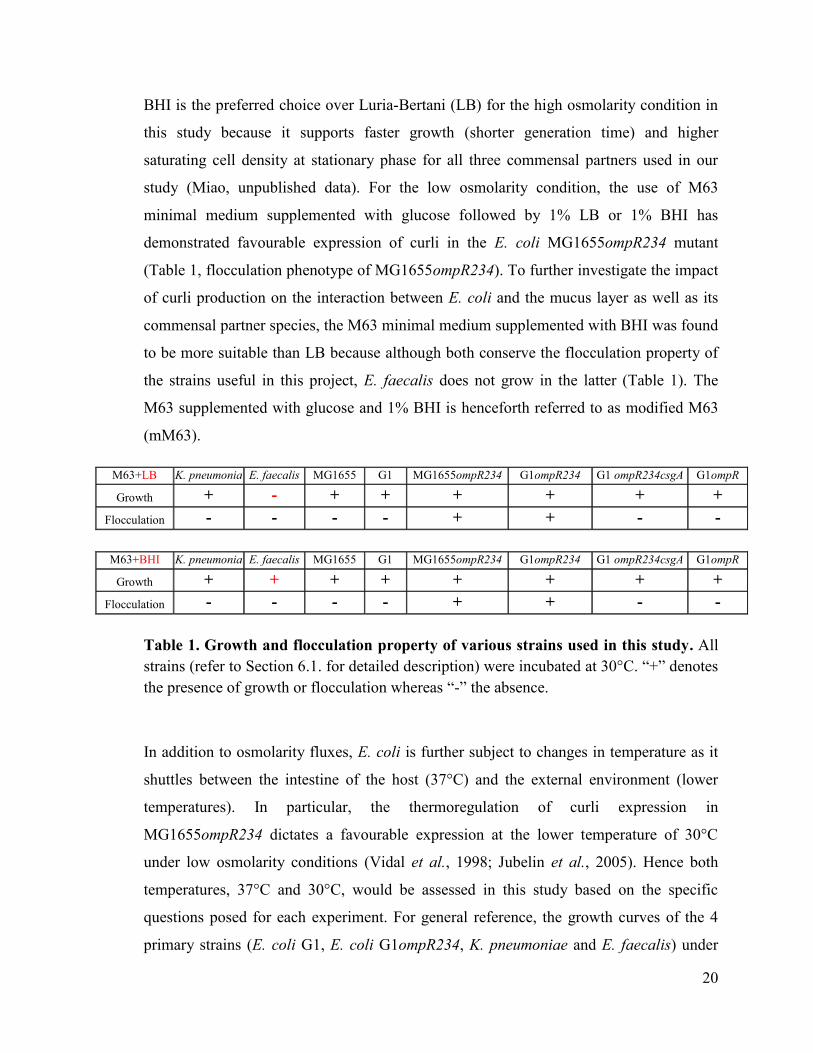
20
BHI is the preferred choice over Luria-Bertani (LB) for the high osmolarity condition in
this study because it supports faster growth (shorter generation time) and higher
saturating cell density at stationary phase for all three commensal partners used in our
study (Miao, unpublished data). For the low osmolarity condition, the use of M63
minimal medium supplemented with glucose followed by 1% LB or 1% BHI has
demonstrated favourable expression of curli in the E. coli MG1655ompR234 mutant
(Table 1, flocculation phenotype of MG1655ompR234). To further investigate the impact
of curli production on the interaction between E. coli and the mucus layer as well as its
commensal partner species, the M63 minimal medium supplemented with BHI was found
to be more suitable than LB because although both conserve the flocculation property of
the strains useful in this project, E. faecalis does not grow in the latter (Table 1). The
M63 supplemented with glucose and 1% BHI is henceforth referred to as modified M63
(mM63).
M63+LB K. pneumonia E. faecalis MG1655 G1 MG1655ompR234 G1ompR234 G1 ompR234csgA G1ompR
Growth + - + + + + + +
Flocculation - - - - + + - -
M63+BHI K. pneumonia E. faecalis MG1655 G1 MG1655ompR234 G1ompR234 G1 ompR234csgA G1ompR
Growth + + + + + + + +
Flocculation - - - - + + - -
Table 1. Growth and flocculation property of various strains used in this study. All
strains (refer to Section 6.1. for detailed description) were incubated at 30°C. “+” denotes
the presence of growth or flocculation whereas “-” the absence.
In addition to osmolarity fluxes, E. coli is further subject to changes in temperature as it
shuttles between the intestine of the host (37°C) and the external environment (lower
temperatures). In particular, the thermoregulation of curli expression in
MG1655ompR234 dictates a favourable expression at the lower temperature of 30°C
under low osmolarity conditions (Vidal et al., 1998; Jubelin et al., 2005). Hence both
temperatures, 37°C and 30°C, would be assessed in this study based on the specific
questions posed for each experiment. For general reference, the growth curves of the 4
primary strains (E. coli G1, E. coli G1ompR234, K. pneumoniae and E. faecalis) under
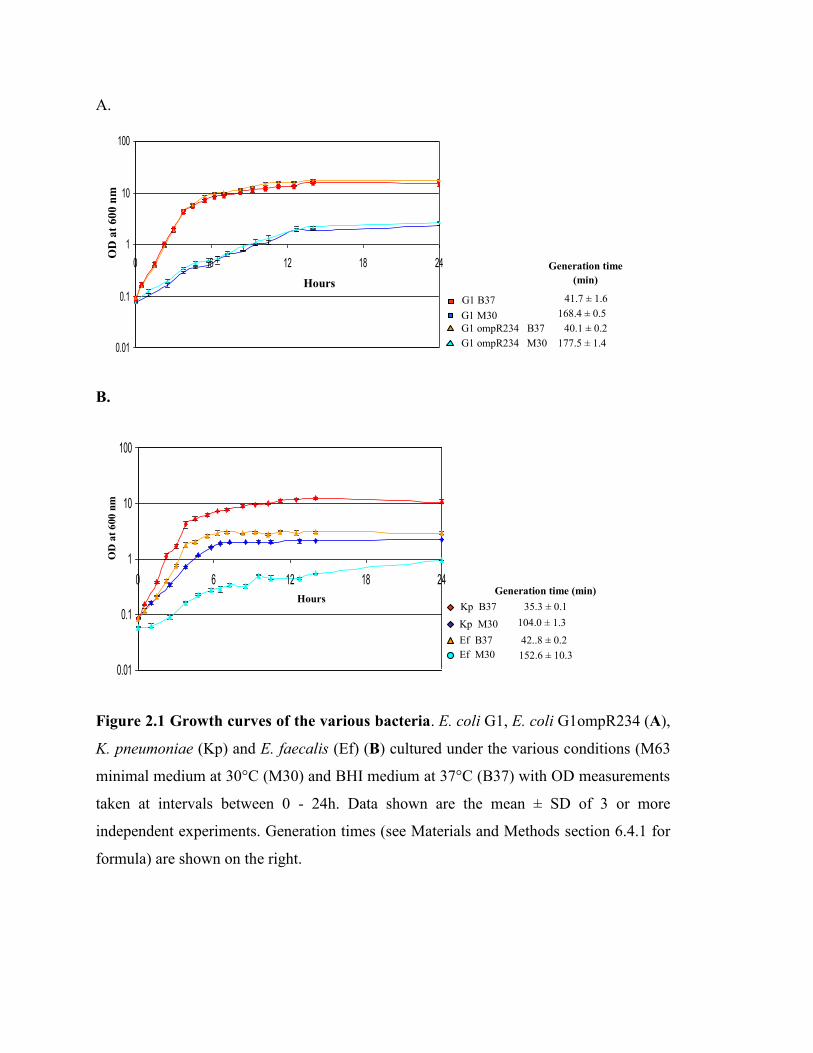
A.
B.
Figure 2.1 Growth curves of the various bacteria. E. coli G1, E. coli G1ompR234 (A),
K. pneumoniae (Kp) and E. faecalis (Ef) (B) cultured under the various conditions (M63
minimal medium at 30°C (M30) and BHI medium at 37°C (B37) with OD measurements
taken at intervals between 0 - 24h. Data shown are the mean ± SD of 3 or more
independent experiments. Generation times (see Materials and Methods section 6.4.1 for
formula) are shown on the right.
0.01
0.1
1
10
100
0 6 12 18 24
Kp B37
Ef B37
Kp M30
Ef M30
35.3 ± 0.1
42..8 ± 0.2
104.0 ± 1.3
152.6 ± 10.3
Generation time (min)
OD
at
600
nm
Hours
0.01
0.1
1
10
100
0 6 12 18 24
OD
at
60
0 n
m
Hours
Generation time
(min)
168.4 ± 0.5
41.7 ± 1.6
177.5 ± 1.4
40.1 ± 0.2
G1 B37
G1 ompR234 B37
G1 ompR234 M30
G1 M30
21
the most frequently used conditions: BHI at 37°C (abbreviated as B37) and mM63 at
30°C (abbreviated as M30) are shown in Figure 2.1.
2.2 Types of culture
2.2.1 Planktonic
Although the planktonic mode of microbial life only represents a small proportion of
bacterial existence in their ecosystems, it is an essential stage of the biofilm life cycle
(Stoodley et al., 2002). The dispersal of biofilm releases planktonic cells to colonise new
locations, which is of fundamental importance for the expansion and survival of the
species (Kaplan, 2010). In the human intestine, bacteria do shuttle between planktonic
and biofilm modes (Molin, S. personal communication). While those in biofilm state are
closely associated with the mucus layer adherent to the surface of epithelial cells,
planktonic cells exist primarily in the lumen.
A large collection of data has been generated over the majority of bacteriology’s history
based on planktonic experimental models. Therefore, before going into biofilm studies, it
is more convenient to check the phenotypes of the strains in our study in the planktonic
form against those that are documented among known literature. For example, the
promoter-reporter model is validated through the exhibition of reported activity of the
well-characterised promoters in the appropriate conditions in our system (discussed in
Section 2.5).
2.2.2 Biofilm – saturated vs. interface models
Over the decades, the popularization of biofilm research has brought about the blooming
of biofilm assay models, ranging from the commonly used static and flow cell biofilm
system to fermenters and even sampling from the nature. The continuous-flow methods
such as a flow cell system have a number of advantages, such as (i) continuous renewal
of biofilm medium, (ii) growth of biofilms under hydrodynamic conditions, (iii) ease of
addition of antibiotics or change of the growth medium at a defined time point, and (iv)

Figure 2.2 The Kadouri system. Fresh culture medium is pumped from the medium
reservoir onto a biofilm grown in the bottom of a well in a 6-well plate through silicone
tubing (1) and a 20G needle inserted on one side of the plate lid (2). Planktonic bacteria and
spent medium are removed through another needle placed on the opposite side of the well
(3) and pumped to waste receptacle (4).
22
possibility of nondestructive real-time microscopic analysis (Wolfaardt et al., 1994;
Stoodley et al., 1999; Sauer et al., 2002). However, it is a relatively complicated system
to engineer and requires more troubleshooting in technical issues like leakage, air bubbles,
and medium back-flow (Sternberg & Tolker-Nielsen, 2006).
On the other hand, the static biofilm models make use of simple equipment and can be
easily adapted to study a variety of biofilm formation conditions (Merritt et al., 2005).
Static biofilm systems basically fall into four categories: (i) surface model; (ii) air-liquid
interface model; (iii) colony biofilms and (iv) the “low-flow” Kadouri system (Figure
2.2). The surface model is useful for bacteria that form surface-attached biofilms
immersed in the medium. In laboratory experiment setups, abiotic surface materials such
as polystyrene (PS), polyvinylchloride (PVC), polycarbonate (PC), and glass are the most
frequently used. Often, microtiter plate (96-, 24-, or 6- well plate) is used in this model
because of its ease in manipulation and high adaptability of the general protocol to
different applications. Cells are allowed to grow in the wells for a desired length of time
before planktonic cells are washed off and the surface-attached biofilm cells can thus be
either visualized by microscope or quantified by crystal violet or safranin staining or even
harvested for viable count on agar plates. This model is also suitable for high throughput
genetic screening for mutants defective in surface attachment capabilities. Moreover,
both aerobic and anaerobic bacteria can be studied in this model (O'Toole et al., 1999;
Stepanovic et al., 2001; Danhorn et al., 2004). To test the biofilm formation of facultative
anaerobic bacteria in the absence of oxygen, overlaying the wells with mineral oil is
sufficient to simulate anaerobic condition (O'Toole et al., 1999).
Even so, many aerobic bacteria tend to form biofilms at the interface between the
medium and air. The air-liquid interface model is thus a better choice. The setup of this
model can be a simple modification of the surface model by tilting the microtiter plate 30°
to 50° relative to horizontal so that the culture surface is positioned at the centre of the
well bottom (Caiazza & O'Toole, 2004). Alternatively, a glass or plastic coverslip can be
placed vertically in the culture so that the culture surface falls around the centre of the
coverslip, which then can be sampled at the appropriate time points for microscopic

Figure 2.3 Side view of the MBEC™ High-throughput (HTP) Assay. Biofilms form
on the polystyrene pegs of the MBEC™ device when planktonic bacteria adsorb to the
surface. 96 identical plastic pegs are attached to the peg lid, which fits into a standard 96-
well microtiter. Figure from the website of Innovotech Inc. (http://www.innovotech.ca/).
Figure 2.4 The biofilm systems used in this study. A. The saturated system. Biofilm is
grown on cover slips in a Petri-dish containing media. The cover slips are observed
directly under confocal microscope. B. The interface system. Biofilm forms at the air-
medium interface on coverslips vertically placed in the biofilm tank. The coverslip is
withdrawn from the tank and the attached cells at the bottom of the coverslip are removed
by dipping the coverslip several times in water. It is then mounted carefully on a flow cell
chamber prepared with water in all channels so that the biofilm is suspended in water.
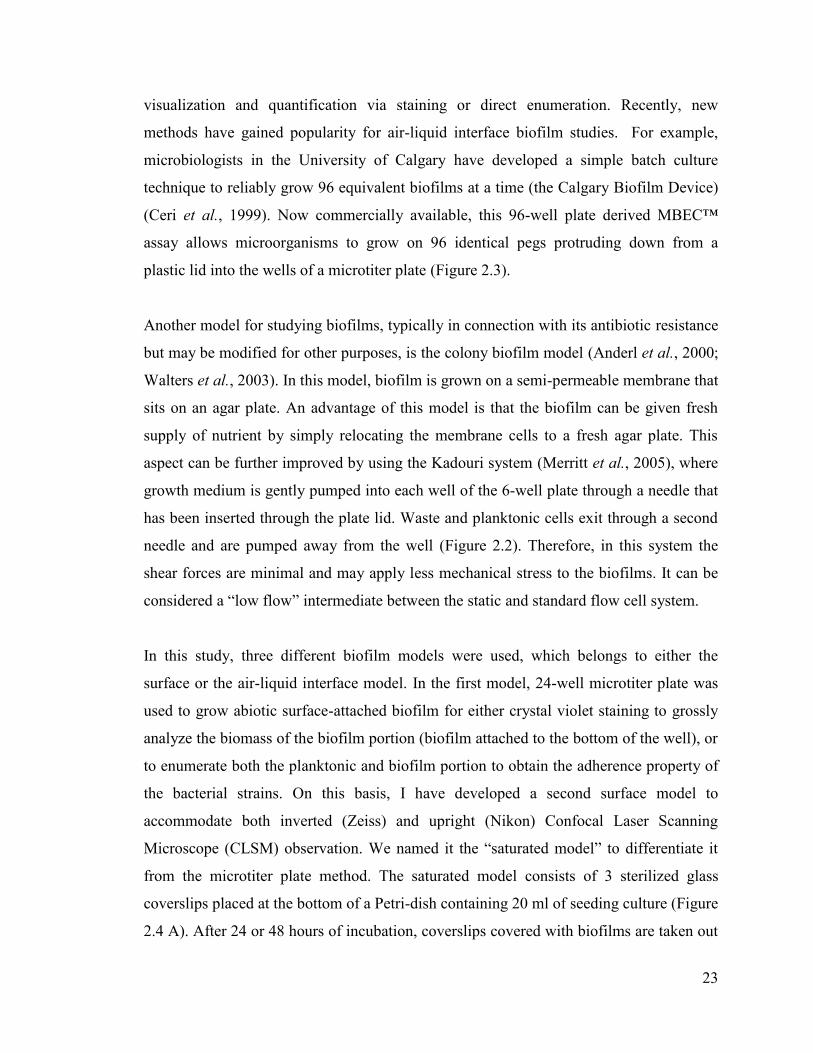
23
visualization and quantification via staining or direct enumeration. Recently, new
methods have gained popularity for air-liquid interface biofilm studies. For example,
microbiologists in the University of Calgary have developed a simple batch culture
technique to reliably grow 96 equivalent biofilms at a time (the Calgary Biofilm Device)
(Ceri et al., 1999). Now commercially available, this 96-well plate derived MBEC™
assay allows microorganisms to grow on 96 identical pegs protruding down from a
plastic lid into the wells of a microtiter plate (Figure 2.3).
Another model for studying biofilms, typically in connection with its antibiotic resistance
but may be modified for other purposes, is the colony biofilm model (Anderl et al., 2000;
Walters et al., 2003). In this model, biofilm is grown on a semi-permeable membrane that
sits on an agar plate. An advantage of this model is that the biofilm can be given fresh
supply of nutrient by simply relocating the membrane cells to a fresh agar plate. This
aspect can be further improved by using the Kadouri system (Merritt et al., 2005), where
growth medium is gently pumped into each well of the 6-well plate through a needle that
has been inserted through the plate lid. Waste and planktonic cells exit through a second
needle and are pumped away from the well (Figure 2.2). Therefore, in this system the
shear forces are minimal and may apply less mechanical stress to the biofilms. It can be
considered a “low flow” intermediate between the static and standard flow cell system.
In this study, three different biofilm models were used, which belongs to either the
surface or the air-liquid interface model. In the first model, 24-well microtiter plate was
used to grow abiotic surface-attached biofilm for either crystal violet staining to grossly
analyze the biomass of the biofilm portion (biofilm attached to the bottom of the well), or
to enumerate both the planktonic and biofilm portion to obtain the adherence property of
the bacterial strains. On this basis, I have developed a second surface model to
accommodate both inverted (Zeiss) and upright (Nikon) Confocal Laser Scanning
Microscope (CLSM) observation. We named it the “saturated model” to differentiate it
from the microtiter plate method. The saturated model consists of 3 sterilized glass
coverslips placed at the bottom of a Petri-dish containing 20 ml of seeding culture (Figure
2.4 A). After 24 or 48 hours of incubation, coverslips covered with biofilms are taken out

Figure 2.5 Confocal microscopic images of biofilms formed by E. coli self-expressing
green fluorescent protein (GFP). A. Biofilm in saturated model and B. Biofilm in
interface model. In saturated model, biofilm forms a "carpet" covering the entire surface
of the coverslip. The “patches” reflect the heterogeneity on Z axis, but not on the XY
plane. In interface model, the air-liquid transition creates a gradient for nutrient and
oxygen, leading to spatial heterogeneity.

24
of the Petri-dish with the aid of a needle and forceps for immediate CLSM observation or
viable count after scraping the biofilm off the coverslips.
All three bacterial species used in this study being facultative anaerobic, an air-liquid
interface model (referred to as “interface model” for simplicity) is also employed. In this
model, glass coverslips are vertically placed with a slight angle in a tank containing the
medium (Figure 2.4 B). For analysis of the biofilm formed at the air-medium interface,
the coverslip is withdrawn and washed gently to eliminate the attached planktonic cells.
Then, biofilm cells can either be observed by CLSM or scraped for viable count.
Due to the difference in conditions for biofilm development between the saturated and
interface system, information obtained from CLSM observation is different. The
saturated biofilm being completely immersed in the medium, with the whole coverslip
surface equally exposed to nutrient and oxygen, is more homogeneous on the XY plane.
Heterogeneity however, exists along the Z-axis revealing mushroom structures and
microcolonies (Figure 2.5 A). In the interface model, biofilm is subjected to influence
from nutrient and oxygen gradient caused by the air/liquid interface, leading to spatial
heterogeneity (Figure 2.5 B). For the homogeneity of biofilm (no air-liquid transition)
and ease of manipulation, I chose to use mainly the saturated model for my thesis. The
interface model is used only in specific experiments for multi-species population
relationship studies, to be consistent and to allow for comparison with previous
experiments done in the Singapore laboratory.
2.2.3 Co-culture of E. coli with K. pneumoniae and E. faecalis
Theoretically, one would expect that preparing bacterial co-culture, be it planktonic or
biofilm, is a simple matter of mixing cells of two species in equal proportions. In reality,
conventional laboratory protocols adequate for bacterial pure cultures were not able to
ensure the desired start ratio of 1:1, and a slight deviation from the 1:1 start ratio resulted
in huge differences in the end ratio. Therefore, the inoculation step is of vital importance
and at each step, precautions were taken to minimise errors.

25
Firstly, to precisely inoculate different species at a 1:1 cellular ratio, we first determined
stringently the linear range of OD600 measurement of our spectrophotometer for every
strain to ensure accurate reading of the optical density. Secondly, the bacterial cell
number as determined by counting the colony forming units (CFU) on agar plate has a
proportional conversion factor to the OD600 measurement, which needs to be employed to
calculate the equivalent of 1:1 cell ratio (see Section 6.3.1.2). A generalised OD600 to
CFU conversion (e.g. available in standard molecular biology protocols such as in
Molecular Cloning (Sambrook & Russell, 2001) was inadequate, as this factor varies
between species, even strains of the same species and between culture conditions.
Therefore I empirically determined the CFU/ml at OD600=1 conversion factor for every
bacterial strain in both BHI (37°C) and mM63 (30°C) (Table 2).
Bacterial strain CFU/ml at OD600=1
BHI (37°C) mM63 (30°C)
E. coli MG1655 4.92 × 10⁸ 7.17 × 10
8
E. coli G1 5.39 × 10⁸ 1.01 × 10
9
E. coli MG1655ompR234 4.53 × 10⁸ 7.85 × 10
8
E. coli G1ompR234 5.52 × 10⁸ 8.20 × 10
8
E. coli G1ompR234 csgA 7.61 × 10⁸ 6.94 × 10
8
E. coli G1ompR234 1.57 × 10⁸ 4.53 × 10
8
K. pneumoniae 1.28 × 10⁸ 1.06 × 10
9
E. faecalis 1.17 × 10⁸ 9.05 × 10
8
Table 2. The CFU/ml values of cultures at OD600=1. Different bacterial species, and
even mutants of the same species have different CFU/ml values at OD600=1, that is,
OD600 to CFU conversion. Growth at different conditions results in different OD600 to
CFU conversion too.
Thirdly, when bacterial cells divide, the old pole have slower growth rates, decreased cell
division and are more vulnerable to potential stresses, leading to increasing discrepancy
between the new and old pole cells at each generation (Stewart et al., 2005). Therefore,
Figure 2.6 UTI agar allows distinction between different species. The three species
used in this project have different colony morphology on UTI agar plate. E. coli colonies
are large and purple coloured while those of E. faecalis are small and dark blue with
white tips on top. K. pneumoniae have large, dark green colonies.

26
the length of seed culture growth (from which the 1:1 mixing would be drawn from) has
to be constant and precise, to ensure a consistent state of homogeneity for inoculation,
replicable between experiments. Balancing between the homogeneity of cell state in the
population and sufficient cell density for further dilutions, the most practical culturing
time was determined to be 14 hours for all strains in BHI (37°C), 16 hours for those in
mM63 (30°C) with the exception of E. faecalis which requires 24 hours in mM63 due to
its slow growth in minimal medium.
2.3 Modes of Analysis
2.3.1 Enumeration (Viable Count) of bacterial strains using UTI agar
In multi-species studies involving planktonic or biofilm co-cultures, the members have to
be distinguished from each other and enumerated. Two approaches which we have used
include: 1) plating on chromogenic UTI agar for direct enumeration of co-cultures by
viable count, because it allows differentiation of the three species based on distinct
colony morphology, and 2) Fluorescence Activated Cell Sorter (FACS), which allows a
variety of cell properties to be analyzed by virtue of its single cell detection and
resolution capability. The second approach will be discussed in Section 2.3.2.
For enumeration by plating, it was possible to discern the different species from one
another using the UTI agar which allows the three species to be visualized as colonies
with different morphology and colours (Figure 2.6). A preliminary check has been
performed which assured us that the CFU counts on UTI agar are comparable to those on
agars that are recommended by the American Type Culture Collection (ATCC). The UTI
agar was henceforth used for such enumeration purpose.
At the final CFU counting stage for a co-culture, it is possible that overcrowding of one
species may mask the colonies of the minority species. The small colony size of E.
faecalis was indeed found to present this problem. To resolve, the deMan, Rogosa and
Sharpe (MRS) agar that selects for Gram positive Lactobacillus was used to select for E.
faecalis, which is also lactic acid bacteria (Vermis et al., 2002; Domig et al., 2003). The

27
MRS agar not only inhibited growth of E. coli and K. pneumoniae, but more importantly,
showed CFU counts of E. faecalis that were consistent between MRS and UTI agar.
Therefore, for CFU counts involving E. faecalis, the co-cultures were plated on both UTI
and MRS agar to obtain the most accurate data.
2.3.2 FACS
Due to the heterogeneity in bacteria’s physiological and metabolic state (Davidson &
Surette, 2008), single cell analysis is better able to reveal the true composition of the cells’
state in the culture, compared to methods that quantify an average of the whole
population. The fluidic system of FACS can be manipulated so that single cells pass in a
stream across a laser detector, by which light scattering properties such as forward scatter
(reflects cell size) and side scatter (corresponds to surface complexity for bacterial cells)
of each cell may be recorded. It can also detect fluorescence intensity, thus when coupled
with fluorescence-tagging (see Section 2.4.2), FACS not only allows separate analysis of
the fluorescent and non-fluorescent populations, but also detects the fluorescence
intensity of every single cell, giving an indication of the extent of the specific biological
parameters being measured. In this project, for example, the original plan was to use the
GFP-tagged E. coli to distinguish it from the non-fluorescent partner species K.
pneumoniae and E. faecalis by FACS, so as to trace the transcription activity of E. coli in
co-cultures.
However, FACS is originally designed to deal with eukaryotic cells, which are
considerably larger in size than bacterial cells. Some optimization of the system had to be
performed to suit our needs of bacterial analysis. With this powerful tool, I have
succeeded in analyzing cells in planktonic cultures for the surface properties of E. coli
strains differing in curli expression level (Section 4.3.1.2), which will be presented in
Chapter 4. I have also attempted to study multi-species population relationships in the
biofilm state by FACS, but unfortunately did not succeed because of the
exopolysaccharide-associated clumping, which compromises the resolution of this
analysis.

28
2.3.3 CLSM and COMSTAT
Confocal microscopy is a powerful tool for visualizing fluorescent specimens. It was
invented by Marvin Minsky for the purpose of improving the traditional wide-
field fluorescence microscopes. The most important feature of confocal microscopy is its
acquisition of in-focus images from selected depths, thus allowing reconstruction of
three-dimensional structures from the obtained images. There are several types of
confocal microscope, the most common of which is the laser scanning confocal
microscope. It captures images by scanning the specimen with a focused beam of laser
and collecting the emitted fluorescence signals with a photodetector. The optical
resolution and contrast of images is increased by employing point illumination and a
spatial pinhole to eliminate out-of-focus light in specimens that are thicker than the focal
plane (Smith, 2006; Pawley, 2006). The focal plane is called the X-Y plane, and as the
focus moves up or down (the Z-axis) the sample, the information of every layer within
the predefined range on the Z-axis is collected and this “cube” is termed a “Z stack”. For
biofilm samples, the fluorescent biomass of a Z stack can be calculated using the
programme COMSTAT (Heydorn et al., 2000), which can also be used to determine
other parameters such as average and maximum thickness, roughness, surface to volume
ratio and others.
Confocal microscopes can typically be configured to capture images of two or more
fluorophores simultaneously or sequentially. In this work, for example, green and red
fluorescence proteins are used, sometimes simultaneously. To avoid overlapping of their
spectra, sequential scanning is preferred. Often, tissue or microbiological samples are
fixed before observation, but to obtain the most natural state of the sample, our biofilm is
untreated and sometimes immersed in water in order not to disturb its structure. Because
this project was carried out in two laboratories, two different models of CLSM were used:
the Zeiss inverted confocal microscope (in both France and Singapore), and the upright
Nikon microscope (only in Singapore). Due to the intrinsic differences, albeit trivial,
between confocal microscopes, only Z stacks from the same model of microscope are
compared in COMSTAT analysis.

Figure 2.7 CLSM photos of 24 hour biofilm. A. E. coli MG1655ompR234 stained with
fluorescent dye SYTO61. B. Whole cell GFP-tagged MG1655ompR234 (named
G1ompR234). The two "visualisation" methods give similar biofilm morphology.
Fluorescence images are superposed with transmitted light images.
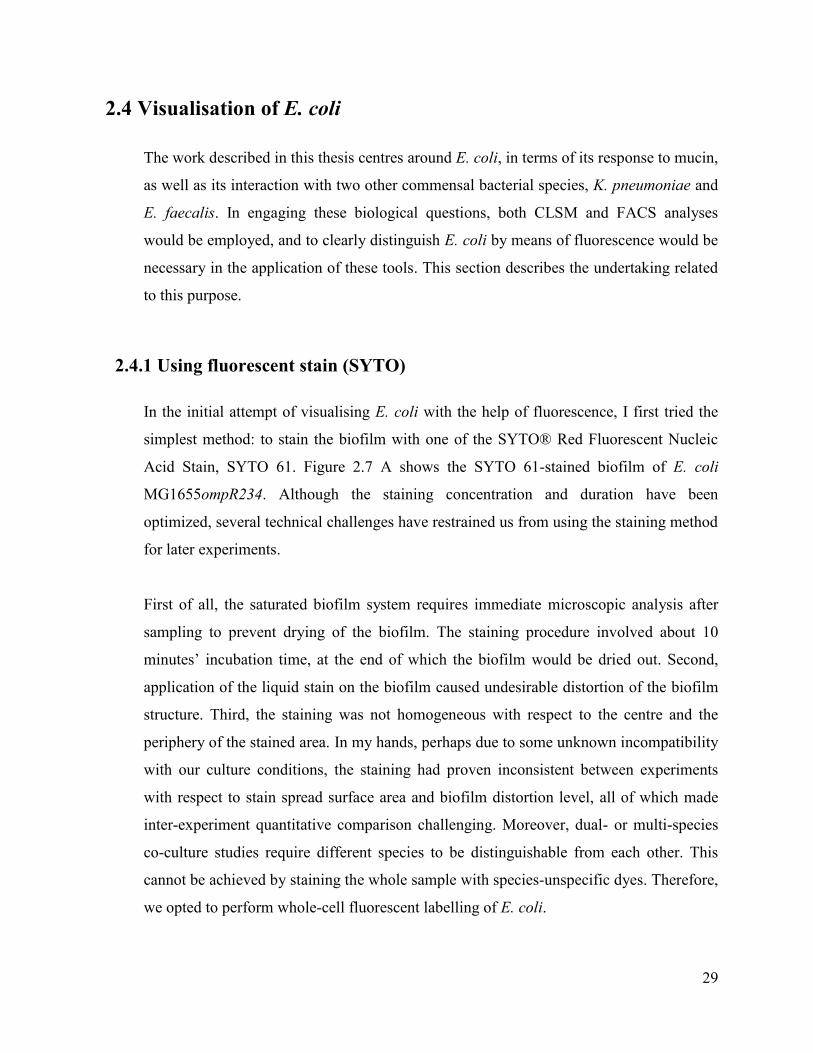
29
2.4 Visualisation of E. coli
The work described in this thesis centres around E. coli, in terms of its response to mucin,
as well as its interaction with two other commensal bacterial species, K. pneumoniae and
E. faecalis. In engaging these biological questions, both CLSM and FACS analyses
would be employed, and to clearly distinguish E. coli by means of fluorescence would be
necessary in the application of these tools. This section describes the undertaking related
to this purpose.
2.4.1 Using fluorescent stain (SYTO)
In the initial attempt of visualising E. coli with the help of fluorescence, I first tried the
simplest method: to stain the biofilm with one of the SYTO® Red Fluorescent Nucleic
Acid Stain, SYTO 61. Figure 2.7 A shows the SYTO 61-stained biofilm of E. coli
MG1655ompR234. Although the staining concentration and duration have been
optimized, several technical challenges have restrained us from using the staining method
for later experiments.
First of all, the saturated biofilm system requires immediate microscopic analysis after
sampling to prevent drying of the biofilm. The staining procedure involved about 10
minutes’ incubation time, at the end of which the biofilm would be dried out. Second,
application of the liquid stain on the biofilm caused undesirable distortion of the biofilm
structure. Third, the staining was not homogeneous with respect to the centre and the
periphery of the stained area. In my hands, perhaps due to some unknown incompatibility
with our culture conditions, the staining had proven inconsistent between experiments
with respect to stain spread surface area and biofilm distortion level, all of which made
inter-experiment quantitative comparison challenging. Moreover, dual- or multi-species
co-culture studies require different species to be distinguishable from each other. This
cannot be achieved by staining the whole sample with species-unspecific dyes. Therefore,
we opted to perform whole-cell fluorescent labelling of E. coli.
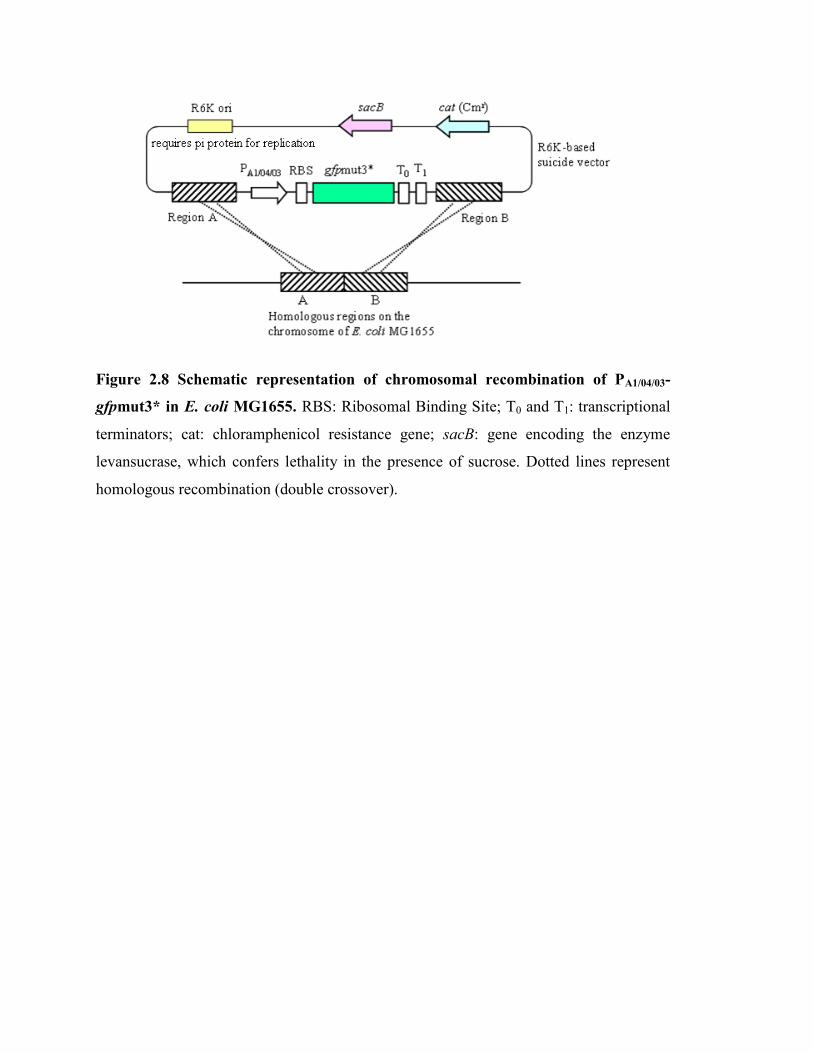
Figure 2.8 Schematic representation of chromosomal recombination of PA1/04/03-
gfpmut3* in E. coli MG1655. RBS: Ribosomal Binding Site; T0 and T1: transcriptional
terminators; cat: chloramphenicol resistance gene; sacB: gene encoding the enzyme
levansucrase, which confers lethality in the presence of sucrose. Dotted lines represent
homologous recombination (double crossover).

30
2.4.2 Whole-cell tagging of E. coli
2.4.2.1 Green Fluorescent Protein
The most widely used fluorescent protein (FP) is the green fluorescent protein (GFP),
which was originally discovered in the jellyfish Aequorea victoria (Shimomura et al.,
1962) and subsequently cloned and successfully expressed in other organisms (Chalfie et
al., 1994). Since then, GFP has been engineered to produce improved versions that are
brighter, display enhanced photostability, pH tolerance and faster maturation rates
(Shaner et al., 2007). Modified FPs emitting blue, cyan and yellow fluorescence has been
created, and subsequently enhanced as with the GFP (Olenych et al., 2007; Patterson,
2007). For its proven ease in use and stability, we first chose to label our E. coli with
GFP.
2.4.2.2 Construction of G1
The easiest way of whole-cell tagging (the term “tagging” is used interchangeably with
“labelling” in this thesis) would be to introduce a plasmid that carries a fluorescence
expression cassette. However, the maintenance of selection pressure requires the use of
antibiotics, which is not suitable for our co-culture studies involving antibiotic
susceptible partner species. In addition, the high expression of plasmid-borne
fluorescence proteins, especially in high copy number plasmids, has been shown to exert
metabolic cost on bacteria (Rang et al., 2003), and may thus affect the bacteria’s
physiology.
The Singapore laboratory has previously generated a GFP-expressing E. coli MG1655
strain via chromosomal insertion of the GFP gene. This is named E. coli strain SCC1 in
Miao et al, 2009, but will be referred to as strain G1 throughout this thesis. Briefly, a
R6K-based suicide plasmid pDM4 (Milton et al., 1996) carrying PA1/04/03-
gfpmut3*(Andersen et al., 1998) was introduced into E. coli MG1655 (Figure 2.8), for
constitutive GFP expression. The R6K-based suicide plasmid requires the pir gene
encoded protein π (Germino & Bastia, 1983) to replicate. In the non-permissive E. coli

Figure 2.9 Green fluorescence of E. coli G1. (A) Fluorescence profiles of E. coli G1
and E. coli MG1655 with 4 rounds of sub-culturing. (B) Fluorescence profiles of E. coli
G1 and E. coli MG1655 cultures continuously shaken for 4 days. All data from are
representative of three independent experiments.
4-day long
culturing B 4 rounds
sub-culturing A
Day 1 (G1) Day 2 (G1)
Day 3 (G1) Day 4 (G1)
Day 1 (MG1655) Day 2 (MG1655) Day 3 (MG1655)
Day 4 (MG1655)
Green Fluorescence (arbit. units)
104
% o
f M
ax
.
104
% o
f M
ax
.

31
MG1655, clones which have undergone recombination can be selected via
chloramphenicol resistance. Then, a second recombination event was counter-selected for
the loss of the sacB gene via survival on 5% sucrose agar. The PA1/04/03-gfpmut3* cassette
was thus inserted into the chromosome while the rest of the plasmid is excised. This
constructed E. coli strain G1 was then profiled using different techniques including
CLSM and FACS.
2.4.2.3 GFP-tagging does not interfere with cells’ basic physiology
The expression of chromosomally inserted GFPmut3* was checked and found to be high
enough for detection by FACS (Figure 2.9) and CLSM (Figure 2.7 B). It was also shown
to be stable by at least four rounds of 24 hour sub-culturing (Figure 2.9 A) as well as 4-
day old cultures (Figure 2.9 B), based on quantification both by fluorometer (data not
shown) and FACS (Figure 2.9). Moreover, FACS data showed that GFP is expressed by
almost all of the cells, with the “green” population (G+) being 98.70 – 99.60% of the
whole population (Miao et al., 2009).
In Miao et al (2009), it was further shown that the G1 strain demonstrates no significant
difference from the wild type strain MG1655 with respect to basic physiology, including
cell morphology, forward- (FSC) and side-scatter (SSC) profile, growth over time, as
well as conversion between cell density (CFU/ml) and light absorbance at 600 nm
(OD600). In co-culture with other species, G1 shows very similar population ratio with its
partner species to the wild type MG1655, suggesting that the population relationship of
these species in co-culture is not affected by GFP expression.
2.4.2.4 GFP-tagging of MG1655ompR234
In order to investigate the impact of surface property on commensal species interactions,
the curli-producing MG1655ompR234 (Prigent-Combaret et al., 2001) was exploited,
which requires this curli-producing strain to be “visible” too. With the successful GFP-
tagging of E.coli MG1655 strain giving rise to strain G1 and the rigorous demonstration

Figure 2.10 A schematic representation of A. E. coli strain G1 and B. E. coli strain
G1ompR234. The PA1/04/03-gfpmut3* cassette was inserted to the chromosome by double
recombination of a R6K-based suicide plasmid carrying the cassette. The ompR234
malT54::Tn10 mutation was introduced to the chromosome by phage P1 transduction.
Figure 2.11 E. coli biofilms and their corresponding variables. CLSM images of biofilms
of A. E. coli G1 (30°C), B. E. coli G1 ompR234 (30°C) and C. E. coli G1 ompR234 (37°C)
cultured on cover slips in a Petri dish containing M63 minimal media at the indicated
temperatures for 24 hours. Shown in each panel are the x-y plane (horizontal section), x-z
and y-z planes (vertical sections), corresponding to the faint red lines indicated in the
respective perpendicular sections. Fluorescence images are superimposed with transmitted
light images. In the columns below are their corresponding variables obtained via the
software COMSTAT (Heydorn et al., 2000).
G1
PA1/04/03 – gfpmut3*
A
ompR234 malT54::Tn10
G1ompR234
PA1/04/03 – gfpmut3*
B
Average
thickness (μm) 31.21 ± 9.96 72.72 ± 13.74 12.1 ± 8.2
Biomass
(µm3/µm
2)
20.51 ± 12.69 70.22 ± 14.37 8.19 ± 4.77
Surface area/
Volume (µm2/µm
3)
0.43 ± 0.36 0.14 ± 0.04 0.58 ± 0.36
A G1 (30°C) B G1ompR234 (30°C) C G1 ompR234 (37°C)
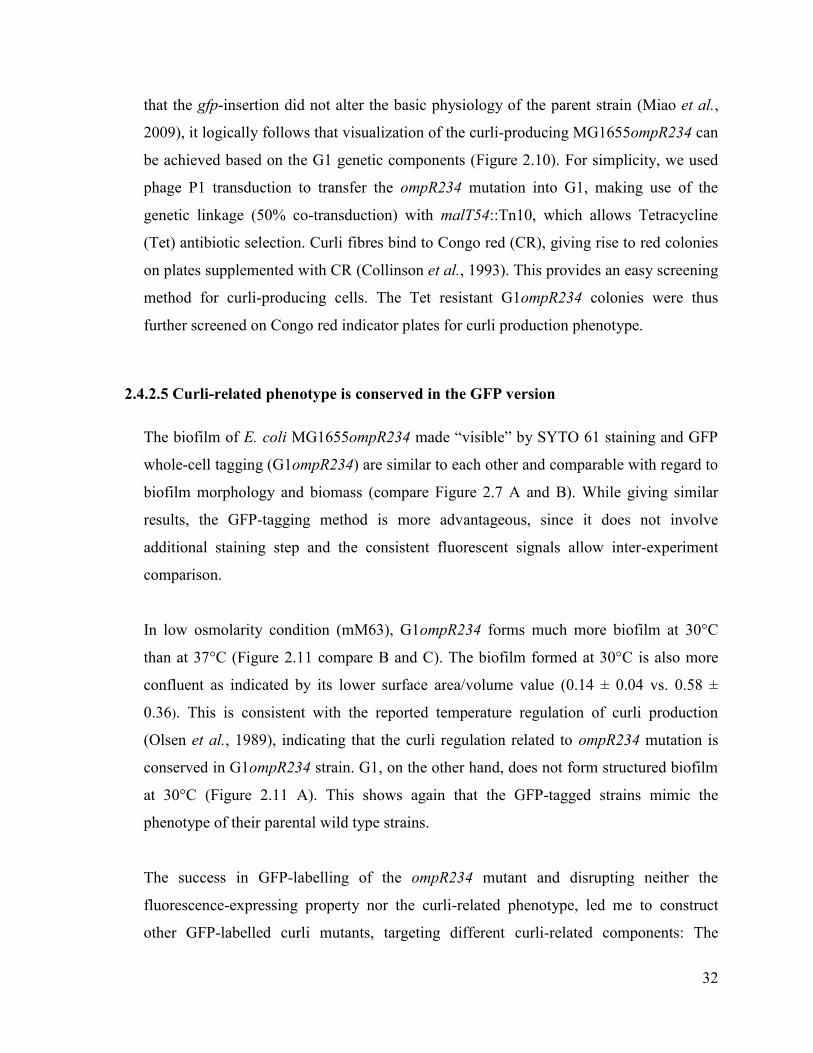
32
that the gfp-insertion did not alter the basic physiology of the parent strain (Miao et al.,
2009), it logically follows that visualization of the curli-producing MG1655ompR234 can
be achieved based on the G1 genetic components (Figure 2.10). For simplicity, we used
phage P1 transduction to transfer the ompR234 mutation into G1, making use of the
genetic linkage (50% co-transduction) with malT54::Tn10, which allows Tetracycline
(Tet) antibiotic selection. Curli fibres bind to Congo red (CR), giving rise to red colonies
on plates supplemented with CR (Collinson et al., 1993). This provides an easy screening
method for curli-producing cells. The Tet resistant G1ompR234 colonies were thus
further screened on Congo red indicator plates for curli production phenotype.
2.4.2.5 Curli-related phenotype is conserved in the GFP version
The biofilm of E. coli MG1655ompR234 made “visible” by SYTO 61 staining and GFP
whole-cell tagging (G1ompR234) are similar to each other and comparable with regard to
biofilm morphology and biomass (compare Figure 2.7 A and B). While giving similar
results, the GFP-tagging method is more advantageous, since it does not involve
additional staining step and the consistent fluorescent signals allow inter-experiment
comparison.
In low osmolarity condition (mM63), G1ompR234 forms much more biofilm at 30°C
than at 37°C (Figure 2.11 compare B and C). The biofilm formed at 30°C is also more
confluent as indicated by its lower surface area/volume value (0.14 ± 0.04 vs. 0.58 ±
0.36). This is consistent with the reported temperature regulation of curli production
(Olsen et al., 1989), indicating that the curli regulation related to ompR234 mutation is
conserved in G1ompR234 strain. G1, on the other hand, does not form structured biofilm
at 30°C (Figure 2.11 A). This shows again that the GFP-tagged strains mimic the
phenotype of their parental wild type strains.
The success in GFP-labelling of the ompR234 mutant and disrupting neither the
fluorescence-expressing property nor the curli-related phenotype, led me to construct
other GFP-labelled curli mutants, targeting different curli-related components: The

Figure 2.12 Flocculation test of curli-related mutant strains. A. G1 (curli +/-),
G1ompR234 (curli ++), G1ompR (curli -), G1ompR234csgA (curli --) are shaken at 60
rpm overnight in M63+LB at 30°C. Curli production leads to the clumping of cells,
giving the flocculation phenotype (clusters and clear medium). B. Cell aggregates
produced by curli-expression strain G1ompR234. When curli is produced, cells form
aggregates that can mediate biofilm formation. These aggregates can be dispersed by
vortexing.

33
chromosomal ompR null mutation (Prigent-Combaret et al., 2001) G1ompR331::Tn10
(henceforth referred to as G1ompR), which affects the curli synthesis at the regulatory
level; the chromosomal csgA null mutation G1ompR234csgA, resulting in a strain
defective in producing the curli structural protein CsgA. Thus, we expect G1ompR to
produce much less curli (curli-) and G1ompR234csgA not to have curli expression (curli--)
even under the condition favourable for curli production. Table 3 shows the expected
curli production profile of the curli-related mutants used in this study.
Genotype Curli profile %G+ exponentional %G+ stationary
G1 curli +/- 99.60 ± 0.50 98.70 ± 0.28
G1ompR234 curli ++ 98.10 ± 0.82 98.65 ± 1.17
G1ompR curli - 99.30 ± 0.14 97.78 ± 2.13
G1ompR234csgA curli -- 99.55 ± 0.19 99.00 ± 0.50
Table 3. Green fluorescence level of GFP-tagged E. coli and its curli-related mutants
measured by FACS. “%G+” indicates the percentage of cells falling within the Green
positive (G+) gate from the total of 10 000 events analysed. Cells in both exponential and
stationary phase were sampled. Data are expressed as mean ± SD of three or more
independent experiments.
When curli is produced, cells form aggregates that can facilitate biofilm formation. In
planktonic culture with slow shaking cell aggregation also occurs, and this is shown
macroscopically as flocculation. As expected in the flocculation test under curli
producing condition (M63 minimal medium at 30°C with slow shaking), the curli
producing strain G1ompR234 flocculated, while others did not (Figure 2.12 A). When
examined under microscope, G1ompR234 cells form large aggregates which can be
dispersed by vortexing (Figure 2.12 B). All these indicate that the curli-related
phenotypes are well conserved in the GFP version of the curli-related mutants.
It is important that the GFP expression of this mutant series not be compromised by the
insertion of the curli-related mutations, because the GFP label of these stains is necessary
in CLSM analysis. In FACS analysis the GFP label is also preferred, because small-sized
bacteria often cannot be distinguished from noise particles by FACS and the green

34
fluorescence is useful to discern the cells from noise. Similar to G1, all the mutants show
GFP-expression population to be more than 95% of the total population by FACS
analysis (Table 3), in both exponential and stationary growth phases. Therefore, we can
be confident that almost the whole population of each of these strains is represented by
GFP-tagging.
2.5 Analysis of Promoter Activity
In addition to analysing bacterial cells and biofilm structures (made possible by whole-
cell fluorescence tagging), I intended to have additional tools that could glean
information at another level – the transcriptional level. Transcriptional gene fusions with
fluorescent reporter allow in situ detection of promoter activity in living cells. Moreover,
transcriptional activity can be assayed in individual cell by using flow cytometry. I
therefore constructed a set of transcriptional fusion either with GFP or RFP reporter
genes. Three genes were chosen as representative of active growth (fis gene), fitness
indicator (mazEF gene) or biofilm development (csgB gene). To compare their
transcriptional activity in planktonic and biofilm cells, they were assayed in E. coli strain
with the MG1655ompR234 genetic background. With this fluorescent transcriptional
reporter system, we hope to be able to reach the ultimate objective, that is, to measure the
transcriptional gene activity in GFP or RFP tagged-E. coli strain facing the mucin-rich
gut environment and commensal bacteria.
2.5.1 Green vs. Red FP as Transcriptional Reporter
Red FPs, like green FPs, are widely used in both whole-cell tagging and in reporting
promoter activities (Sorensen et al., 2003; Martineau et al., 2009). Indeed, the Singapore
laboratory has used AsRed2 (BD Clontech) to fuse with several promoters of different
functional categories, and it has reflected their expression status in manners that were
consistent with those which have been previously reported (Miao et al., 2009).

35
However, despite claims of fast maturation by its commercial supplier, AsRed2 shows
general signs of being a slow-maturing fluorescent protein. It has a long half-life, and the
promoter-fusion constructions are carried on the high-copy plasmid pBluescript. These
properties of the AsRed2 system that was available to me may lead to inaccurate
description of gene activities, so I also made use of the French laboratory’s short half-life
GFP (GFP[LVA]), with an in vivo half-life of approximately 40 minutes (Andersen et al.,
1998), which helps to reveal the transient gene expression in the bacteria. In addition, the
gene gfp[LVA] (all promoter-fused gfp used in this study is gfp[LVA], so they will be
abbreviated as “gfp” hereafter) is carried on a low copy plasmid pPROBE (Miller et al.,
2000), so that we can have more confidence in the results being close to the natural
condition.
To validate the promoter-gfp and -AsRed2 fusions, promoters of three “life cycle” genes
with distinct functions were chosen with the rationale as explained earlier (Section 2.5).
fis (factor for inversion stimulation) translates to a nucleotide-associated protein in E. coli
that is abundant during early exponential growth in rich medium but is in short supply
during stationary phase (Nasser et al., 2002), hence making it an ideal “active growth”
representative gene. The gene chosen to represent “reduced metabolism” – mazEF – is a
suicide module specific for a stable toxin (MazF) and a labile antitoxin (MazE). It can
mediate programmed cell death induced by virus, H2O2, DNA damage, antibiotics and
starvation (Hazan et al., 2004; Kolodkin-Gal & Engelberg-Kulka, 2006). Stressful
conditions that inhibit mazEF expression lead to the MazF toxin persistence in absence of
de novo synthesis of the MazE antitoxin, eventually causing cell death (Aizenman et al.,
1996). The last is csgBA, which code for curlin and curlin nucleator proteins, the building
blocks of the extracellular structure curli (Hammar et al., 1995), and is induced in the
stationary phase (Olsen et al., 1993) and during biofilm development (Prigent-Combaret
et al., 1999). Promoter fusion constructions are described in materials and methods
(Section 6.7).
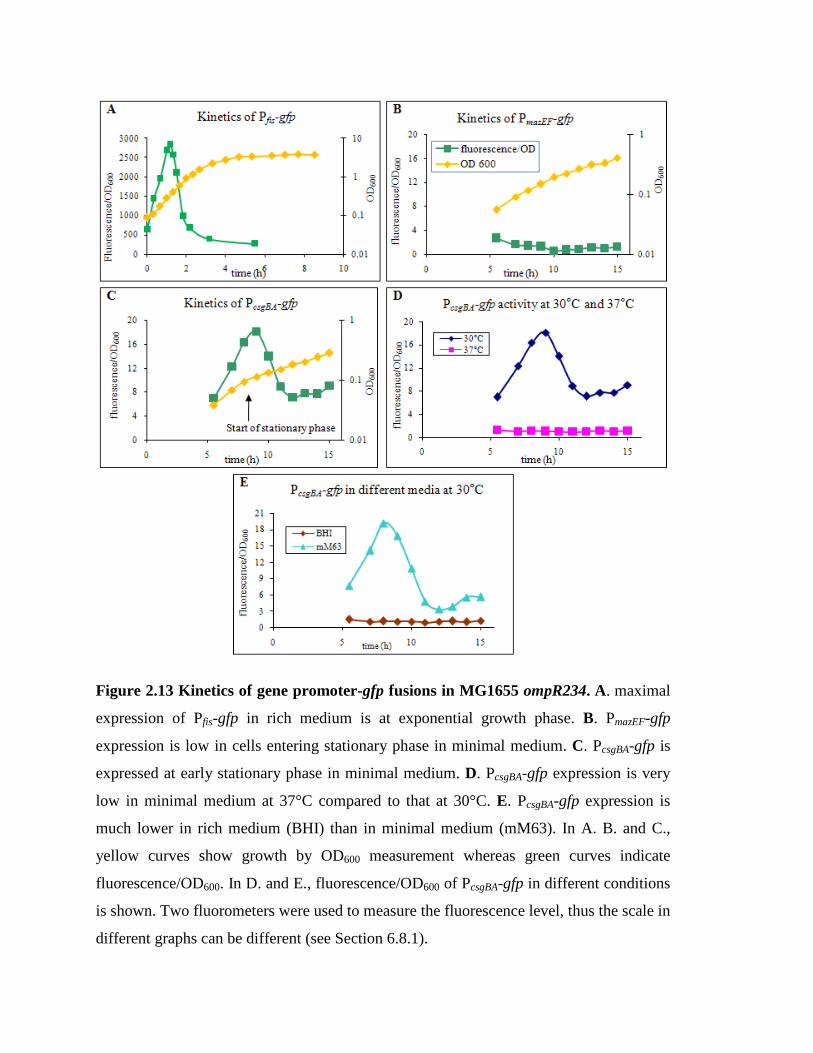
Figure 2.13 Kinetics of gene promoter-gfp fusions in MG1655 ompR234. A. maximal
expression of Pfis-gfp in rich medium is at exponential growth phase. B. PmazEF-gfp
expression is low in cells entering stationary phase in minimal medium. C. PcsgBA-gfp is
expressed at early stationary phase in minimal medium. D. PcsgBA-gfp expression is very
low in minimal medium at 37°C compared to that at 30°C. E. PcsgBA-gfp expression is
much lower in rich medium (BHI) than in minimal medium (mM63). In A. B. and C.,
yellow curves show growth by OD600 measurement whereas green curves indicate
fluorescence/OD600. In D. and E., fluorescence/OD600 of PcsgBA-gfp in different conditions
is shown. Two fluorometers were used to measure the fluorescence level, thus the scale in
different graphs can be different (see Section 6.8.1).

36
2.5.2 In planktonic culture
The expression of the promoter-GFP fusions were monitored in planktonic culture by
fluorometer measurement. As reported by Nasser and colleagues (Nasser et al., 2002), the
fis promoter (Pfis) is activated in the exponential phase in rich medium (Figure 2.13 A).
Marianovsky et al found that PmazEF was activated by FIS in exponentially growing cells
in rich media (Marianovsky et al., 2001); but Sat and colleagues reported that the cellular
level of MazE was significantly lower in minimal medium M9 than in LB medium (Sat et
al., 2001). In accordance with their observations, PmazEF-gfp activity is very low when
grown in minimal medium, in cells entering stationary phase (Figure 2.13 B).
When it comes to csgBA, more regulatory properties were tested, since the regulation of
curli gene expression is extraordinarily complex and is responsive to many environmental
cues. First of all, it is induced at the beginning of stationary phase (Figure 2.13 C). One
of the first conditions recognized to promote curli gene expression was growth at
temperature below 30°C (Olsen et al., 1989). Thus, csgBA gene expression was tested in
MG1655ompR234 background at 30 and 37°C, and the results showed that indeed PcsgBA
activity was very low at 37°C compared to that at 30°C (Figure 2.13 D). It is also
reported that curli expression occurs maximally in media without salt (Romling et al.,
1998), and nutrient limitation stimulates curli gene expression (Gerstel & Romling, 2001).
Therefore, PcsgBA activity was also tested in different media and showed the expected low
activity in the rich medium BHI compared to that in the low osmolarity M63 minimal
medium (Figure 2.13 D).
All these indicate that gfp-labeled promoters reflect the expression status of the gene,
known from published scientific data. We conclude that our GFP constructions allow to
properly estimate the transcriptional activity of the genes of interest.
The AsRed2-promoter fusions were also tested. However, fis activity was too low to be
detected by both fluorometer (Figure 2.14 B) and FACS (Figure 2.14 A). Likewise with
csgBA (Figure 2.14 C), the temperature regulation of which was not reflected (very low

Figure 2.14 Expression of promoter-AsRed2 fusions in MG1655ompR234. Gene
promoter-AsRed2 activity was measured using both FACS (24 hours culture, represented in
histogram) and fluorometer (kinetics). Pfis-AsRed2 and PmazEF-AsRed2 were cultured in BHI
(37°C) for optimal expression, whereas PcsgBA-AsRed2 in both mM63 at 30°C (D) and BHI at
37°C (E). Expression is very low for Pfis-AsRed2 (A & B) and PcsgBA-AsRed2 (C), whose
thermo- and osmo-regulation are not reflected (D & E). The expression of PmazEF-AsRed2, on
the other hand, was detectable by both FACS (F) and fluorometer (G). It also showed high
expression in cells grown in rich medium (BHI) in exponential phase (G) as reported
(Marianovsky et al., 2001). In FACS histograms, black curves represent the promoter-less
negative control, whereas red curves indicate Plac-AsRed2 positive control. Blue curves show
the fluorescence level of the promoters being tested. Two fluorometers were used to measure
the fluorescence level, thus the scale in different graphs can be different (see Section 6.8.1).
0.1
1
0
5
10
15
20
3 8 13
OD
60
0
Flu
ore
scen
ce/O
D6
00
Time (h)
0.001
0.01
0.1
1
10
0
400
800
1200
1600
2000
0 4 8 12
OD
600
Flu
ore
scen
ce/O
D6
00
Time (h)
fluorescence/OD
OD
0.001
0.01
0.1
1
0
400
800
1200
1600
2000
3 8 13
OD
600
Flu
ore
scen
ce/O
D6
00
Time (h)
0.0001
0.001
0.01
0.1
1
0
400
800
1200
1600
2000
3 8 13
OD
600
Flu
ore
scen
ce/O
D6
00
Time (h)
Red Fluorescence (arbit. units)
Red Fluorescence (arbit. units)
Red Fluorescence (arbit. units)
Promoter-less
Test promoter
Plac-AsRed2
Pfis-AsRed2
PcsgBA-AsRed2
PmazEF-AsRed2
Fluorometer mM63 30 C Fluorometer BHI 37 CFACS BHI 37 C
BA
D EC
GF

37
activity in both mM63 at 30°C and BHI 37°C) (Figure 2.14 D & E). PmazEF-AsRed2,
nevertheless, was detectable by FACS (Figure 2.14 F) and showed high activity in the
exponential phase in rich medium BHI (Figure 2.14 G), in agreement with Marianovsky’s
observation. Hence AsRed2 was found to be reporting only certain promoters properly. In
addition, our concern that AsRed2, being a slow-maturing, long half-life fluorescence
protein, will not accurately reflect the gene activity may, unfortunately be true, judging
by the lack of demonstration of thermo- and osmo-regulation of PcsgBA-AsRed2.
2.5.3 In biofilm
In biofilm, the promoter-gfp fusions were examined in the ompR234 background, because
of its capability to form biofilm and its relevance to the osmoregulation of csgBA
promoter. Cells were incubated in the low osmolarity M63 minimal medium at 30°C to
favour biofilm growth. After 24 hours’ incubation, Pfis activity was observed to be low in
biofilm (Figure 2.15 A). Since fis is mostly expressed in the exponential phase in
planktonic culture and not in stationary phase, by analogy, we suggest that the bacterial
cells in biofilm are not actively growing, or at least, not as actively growing as planktonic
cells in exponential phase. PcsgBA, on the other hand, shows very high activity in biofilm
with spatial heterogeneity (Figure 2.15 B), under the regulation of ompR234. It is
reported that csgBA expression is induced in the stationary phase in planktonic culture
and during biofilm development. This result suggests that bacterial cells in biofilm could
be in a physiological state similar to stationary phase, which was also reported by Beloin
and his co-workers (Beloin et al., 2004). In conclusion, the behaviour of Pfis and PcsgBA
suggest that when bacteria form biofilm, most of the population is in a slow growth
scheme of gene expression.
No PcsgBA activity is observed at 37°C (data not shown). This indicates that the
thermoregulation of PcsgBA is preserved in biofilm. PmazEF activity seems to be between
that of Pfis-gfp and PcsgBA-gfp, and shows activity heterogeneity (Figure 2.15 C). In
nutrient starvation, mazEF system responds with decreased mazE antitoxin synthesis,
mediating programmed cell death (Aizenman et al., 1996; Hazan et al., 2004). In biofilm
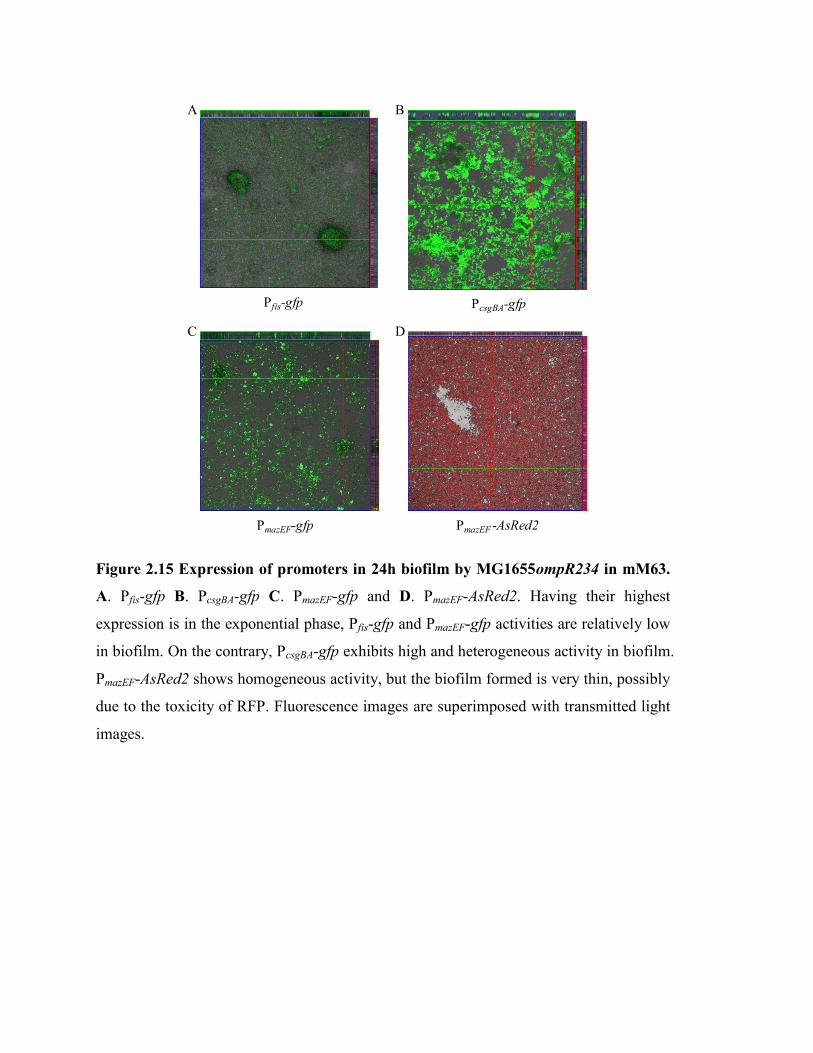
Figure 2.15 Expression of promoters in 24h biofilm by MG1655ompR234 in mM63.
A. Pfis-gfp B. PcsgBA-gfp C. PmazEF-gfp and D. PmazEF-AsRed2. Having their highest
expression is in the exponential phase, Pfis-gfp and PmazEF-gfp activities are relatively low
in biofilm. On the contrary, PcsgBA-gfp exhibits high and heterogeneous activity in biofilm.
PmazEF-AsRed2 shows homogeneous activity, but the biofilm formed is very thin, possibly
due to the toxicity of RFP. Fluorescence images are superimposed with transmitted light
images.
PcsgBA-gfp
PmazEF-gfp
Pfis-gfp
A B
C
PmazEF -AsRed2
D

38
grown in minimal medium mM63, most E. coli cells are in stationary phase and nutrient-
limited condition. Thus they are likely to have generally low mazEF gene activity.
In view of the fact that our biofilm is static and without continual supply of fresh nutrient,
as discussed in section 2.2.2, I suspected that biofilm morphology and gene expression
profiles observed in our biofilm system might be different from those with fresh supply
of nutrient. To test this, I renewed the medium every 24 hours for biofilms of E. coli
MG1655ompR234 carrying Pfis-gfp, PmazEF-gfp or PcsgBA-gfp, but did not observe
significant difference in biofilm morphology and gene expression pattern between
biofilms with and without renewal of medium at 48 and 72 hours of incubation (Figure
2.16). Therefore, I chose not to renew biofilm medium for the ease of manipulation as
well as to avoid disturbance of biofilm structure.
The AsRed2-reported promoters were also tested on biofilm. As in planktonic culture, the
activity of Pfis-AsRed2 and PcsgBA-AsRed2 were too weak to be detected by CLSM (data
not shown). PmazEF-AsRed2 shows homogeneous expression by cells (Figure 2.15 D), but
the biofilm is considerably thinner (~25µm) than that formed by cells carrying the
promoter-gfp fusions (~75µm). This may be due to the high metabolic cost exerted on the
bacteria to produce large amount of AsRed2 fluorescent protein, since it is carried by the
high copy number plasmid pBluescript. The potential cytotoxicity of RFPs may also be a
cause of hindered biofilm growth. Indeed, the burden of RFP production may lead to
exclusion of the plasmid by the cells, and this may be manifested as low AsRed2
expression and misleadingly interpreted as low promoter activity (discussed in Section
2.6).
After comparing the behaviour of GFP- and AsRed2-reported promoters in both
planktonic and biofilm conditions, we decided that the promoter-gfp fusions are more
suitable for use in the later experiments, based on their detectability, stability and
reliability in reporting gene activity.

Figure 2.16 Differential expression of genes in biofilm corresponding to different growth conditions. E. coli
MG1655ompR234 carrying Pfis-gfp (A&B), PmazEF-gfp (C&D) or PcsgBA-gfp (E - I) were incubated in saturated biofilm system
for 24, 48 and 72hours (only for PcsgBA-gfp). Biofilms formed without renewal of medium (upper row) are compared to those
with renewal (lower row). Fluorescence images are superposed with transmitted light images.
Pfis-gfp 48h PmazEF-gfp 48h PcsgBA-gfp 24h PcsgBA-gfp 48h PcsgBA-gfp 72h
With
renewal
Without
renewal
A C
B D
F H
G I
E

39
2.6 Dual fluorescence systems - attempts and disappointments
The Singapore laboratory has previously developed a dual fluorescence scheme (Miao et
al., 2009) to analyze the promoter activity of E. coli when it is in co-culture with other
species. In this system, the GFP is used to distinguish E. coli from other species, while
the AsRed2 reports the promoter activity (Figure 2.17).
The dual fluorescence system allows the fluorescently labelled species (in this case E.
coli, tagged green) to be analyzed for promoter activity (reported by red) even when it is
in co-culture with another species, by exploiting the single-cell resolution capacity of
FACS. The influence of a partner species can be analysed by detecting the green (E. coli)
particles and measuring its red fluorescence level (promoter activity), and even reveal the
inherent heterogeneity of gene expression in the population. Since my work deals with E.
coli in interaction with K. pneumoniae and E. faecalis, it will be useful if I can take
advantage of this scheme of analysis, to complement the population relationship studies
(chapter 4).
In the dual fluorescence scheme, two contrasting colours of fluorescence are required
(Figure 2.17). In Section 2.4.2, I have shown successful tagging of E. coli strains with
GFP, but the contrasting red FP (AsRed2) (Figure 2.17 A) reporters were not satisfactory,
at least for the few promoters I was interested in (Section 2.5.2 & 2.5.3). The alternative,
then, is to make use of the green FP promoter-reporter set, shown to be appropriate for
transcriptional analysis (Section 2.5.2 & 2.5.3) and at the same time, whole-cell label the
E. coli cell with red FP (Figure 2.17 B).
Theoretically, this reversed red- and green-labelling should be workable. An AsRed2
construct with fusion to the constitutive promoter PA01/04/03 – the same promoter used in
GFP whole-cell tagging (Miao et al., 2009) – was already available (pCCS325, refer to
Section 6.1 for detail), and it showed significant red fluorescent activity. Insertion of this
construct using the exact same genetic manipulation scheme as described in Section
2.4.2.2 for GFP-tagging has no conceivable reason to fail. To further improve its
reporting ability, a mutant version of the AsRed2 (hereafter referred to as mAsRed2) has
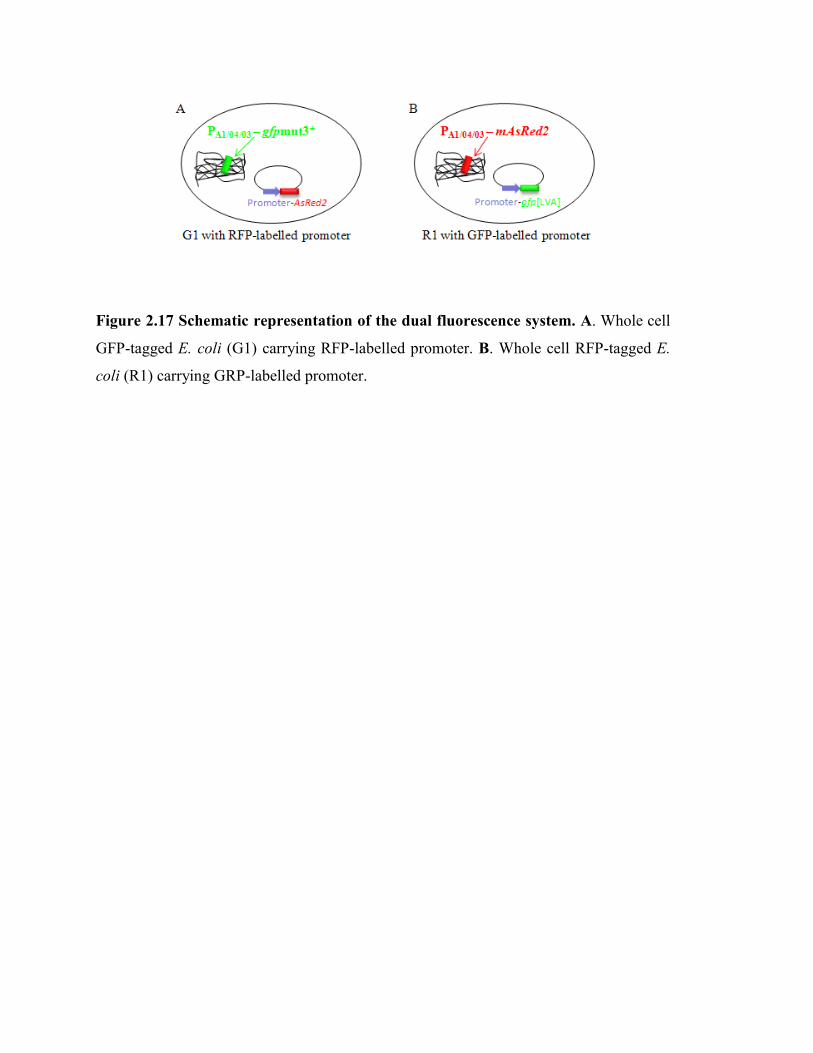
Figure 2.17 Schematic representation of the dual fluorescence system. A. Whole cell
GFP-tagged E. coli (G1) carrying RFP-labelled promoter. B. Whole cell RFP-tagged E.
coli (R1) carrying GRP-labelled promoter.

40
been generated using error prone PCR. Under the constitutive promoter PA1/04/03, it
showed up to 25 fold increase in fluorescence intensity compared to the wild type. With
this improved version of AsRed2, I tried to construct the red-tagged E. coli MG1655 R1
strain using the same method as G1 construction (Figure 2.18, also refer to Section
2.4.2.2). The detailed molecular work is presented in Chapter 6 Materials and Methods
(Section 6.7.3), but what needs to be highlighted here is that even though the construct
was genetically correct, the resultant strain of E. coli MG1655 “R1” cells failed to turn
red, i.e. did not sufficiently express the red fluorescence.
We suspected that this may be due to the cytotoxicity caused by aggregation of the
tetramer protein (Tao et al., 2007), as anecdotal evidence and published data suggest that
the use of RFPs as whole-cell labels has been limited by cytotoxicity (Strack et al., 2008).
Following this, I constructed another version of RFP-tagged MG1655 (named “R2”)
using DsRed-Max-N1 (Addgene), which is claimed to be noncytotoxic (Strack et al.,
2008), hoping that it could give a stable RFP expression. To my disappointment, the
genetically correct PA1/04/03-DsRed-Max-N1 showed severe instability in sub-culturing
even on intermediate plasmids before insertion into the chromosome (Figure 2.18). A red
colony carrying the intermediate construction was both streaked and inoculated as
planktonic culture twice, hence generating 2 sub-cultures and 2 plates (Figure 2.19 A).
After overnight incubation, although seeded from the same red colony, only 1 planktonic
culture was red, while the other merely showed a pinkish tint when pelleted (Figure 2.19
B). The puzzling observation was that the re-streaked colonies on both sets of plates were
all red (Figure 2.19 B). The plasmid of both cultures were extracted and analyzed by
restriction digestion to check the presence of the DsRed-Max insert. The red culture gave
an adequate plasmid yield containing the insert, as expected, whereas the non-red culture
very low yield and hardly any detectable insert. This suggests that cells tend to exclude
the plasmid carrying RFP, perhaps due to the extra burden or cytotoxicity it brought.
To further test the stability of DsRed-Max, 10 red colonies were used to inoculate 10
planktonic cultures. Only 2 cultures turned red and the 8 others were pinkish (Figure 2.19
D). I also tested sub-culturing by re-streaking of the red colonies on agar plate, since

Figure 2.18 Schematic representation of the molecular cloning for RFP-tagged E.
coli (R1) construction. The PA1/04/03-mAsRed2 cassette is excised from the high copy
plasmid and inserted to the suicide plasmid pDM4 by restriction digestion and ligation.
The resulting suicide plasmid carrying the PA1/04/03-mAsRed2 cassette is then allowed to
recombine with the chromosome of E. coli MG1655.
pDM4 (suicide plasmid)
XhoISpeI
1st recombination
MG1655 chromosome
CmrSacB
MG1655 chromosome
2nd recombination
E. coli is labeled with RFP
MG1655 chromosome
Region ARegion B
SpeI XhoI
PA1/04/03-rfp
High copy plasmid containing
homologous regions A and B

41
there seemed to be a difference between RFP expression in planktonic liquid cultures and
in bacterial colonies. Unfortunately, even though the majority of the colonies were red, a
subpopulation of white colonies appeared, especially in the high population density area
(Figure 2.19 E), indicating some loss in red fluorescence activity. Therefore, DsRed-Max
despite its claims (Strack et al., 2008), was also judged not stable enough for R1
construction.
We then laid our hope on mCherry (Shaner et al., 2004), which was reported to be fast
maturing (Strack et al., 2008) and the best general-purpose red monomer owing to its
superior photostability (Shaner et al., 2007; Shaner et al., 2005). It is even claimed to
have outperformed gfpmut3.1(Cormack et al., 1996) in fusions with recA promoter by
Martineau and his colleagues (Martineau et al., 2009). Unfortunately, again, already at
the intermediate plasmid stage, mCherry was showing unstable expression. While
continuing to work on the RFP whole-cell tagging by making mutants of the available
RFP and trying new candidates, we concluded that the whole-cell labelling with red
fluorescent protein was too problematic. The objective of transcriptional monitoring in
co-culture by the dual fluorescence scheme had to be abandoned. Instead, other aspects of
our experimental models are explored using the currently available and validated tools.
2.7 Concluding remarks on fluorescent tools design
Over the period of experimental model set-up, two systems were developed in this study,
depending on the strains involved and the culture condition (Table 4). For simplicity, we
name them after their biofilm setup model: the interface model and the saturated model.
The saturated model has been chosen over the interface model in this study for the
homogeneity of its biofilm, as well as the minimal manipulation involved in the sampling
process. While the interface system is the basic model employed in the Singapore
laboratory aiming to study interspecies interactions, the saturated system was developed
to integrate the French laboratory’s expertise in regulation and function of curli. Curli are
proteinaceous extracellular fibres that are involved in surface and cell-cell contacts. In the
natural multi-species context, they are highly likely to influence the interactions between

Figure 2.19 Schematic representation of the RFP instability. Refer to text for details
D. 10 colonies to
inoculate10 cultures
C. Plasmid
extracted and
digested for insert
2 turned red, the other 8 pinkish
White sub-
population
B. Overnight incubation
A. Inoculation and streaking
E

42
E. coli and its partner species (K. pneumonia and E. faecalis). To explore the possible
effects exerted on these interspecies interactions by curli, specific conditions favouring
curli expression such as low osmolarity (M63 minimal medium) and low temperature
(30°C) were adopted in the system. In the mean time, a series of E. coli mutants targeting
different regulatory levels of curli synthesis were generated to further investigate the
involvement of curli in interspecies interactions. A short half-life GFP was then tested
and shown to accurately report gene activity in both planktonic and biofilm condition. So
we attempted to reverse the FP labelling of the dual fluorescence system of the Singapore
laboratory, using instead promoter-gfp as the transcriptional reporter, and red FP for
whole-cell tagging. Unfortunately, the process of red whole-cell tagging with several
different RFPs (AsRed2, DsRed-Max, mCherry) has been problematic possibly due to its
toxicity or instability of expression. Although AsRed2 has successfully reported the
activity of some promoters (Miao et al., 2009), its potential toxicity and instability makes
it a less ideal choice as transcriptional reporter or whole-cell tag.
Interface System Saturated System
Base strain MG1655 MG1655ompR234,
Mutant strains G1 G1ompR234; G1ompR; G1ompR234csgA
Reporter FP AsRed2 GFP[LVA]
Reporter plasmid High copy pBlueScript Low copy pPROBE
Planktonic condition BHI, 37°C mM63, 30°C
Biofilm condition BHI+mucin, 37°C mM63, 30°C
Biofilm formation Air-liquid interface Surface immersed in medium
Table 4. Comparison between the interface system and saturated system.
Although accurate gene profiling in the multi-species context cannot be done due to the
AsRed2’s inability to serve faithfully as a promoter-reporter for many genes of my
interest, as well as expression and the unsuccessful construction of RFP-tagged E. coli,
the influence of curli on the interactions between E. coli, K. pneumonia and E. faecalis
can be examined by comparing the population relationship of E. coli and the partner

43
strains with respect to the curli-related mutants of E. coli. In E. coli single species culture,
differential gene expression in response to various external factors can be monitored in
the E. coli wild type and mutant background. In the following chapters, gene regulation
in response to mucin was investigated using the promoter-gfp fusion and curli-related
mutants. Curli’s contribution in the population relationship between E. coli, K.
pneumonia and E. faecalis was also evaluated.

44
Chapter 3 Mucin influences E. coli biofilm formation
through modulations of surface adhesion structures
It is well recognized now that biofilm is the most predominant form of bacteria existence
in nature and in the intestine (Probert & Gibson, 2002). To study the interspecies
interactions of intestinal bacteria in biofilm, the bacterial species chosen must be able to
form biofilm. However, the laboratory strains of E. coli, K. pneumonia and E. faecalis
used in this work do not readily form biofilm in vitro, under standard laboratory
conditions. It has been observed that mucin increased bacterial adherence to surface
(Zhang et al., 2002) and promoted biofilm formation (Bollinger et al., 2003) of E. coli
(Bollinger et al., 2006) and P. aeruginosa (Landry et al., 2006). The Singapore
laboratory has thus supplemented BHI with mucin in the interface biofilm system (refer
to section 2.3.5, Table 3). In published models, it can be seen that mucin composition and
concentrations vary in different experimental settings, ranging from 0.01% to 10%
(Zhang et al., 2002; Bollinger et al., 2003; Cole et al., 2004; Macfarlane et al., 2005;
Landry et al., 2006). In the case of the Singapore laboratory, Sigma-Aldrich Type III
Mucin from porcine stomach is being used, and BHI supplemented with 2% of this mucin
has been appointed the standard medium for the cultivation of multi-species biofilms on
glass in the interface system. This condition was based on the laboratory’s previous
testing of mucin at 0.1%, 0.5% and 2% for MG1655 biofilm formation, which showed
that for both 24 and 48 hours growth, 2% mucin resulted in the highest increase of
biofilm thickness and formed well-developed mushroom structures. The specific
condition (BHI + 2% mucin) has since then been used for biofilm co-cultures of E. coli
with the two commensal partners K. pneumoniae and E. faecalis. However, how mucin
promoted better E. coli biofilm development has never been investigated. The mechanism
behind this may have a role to play in the interspecies relationship of commensals.
As my thesis is part of a larger project aiming to characterize the transcriptional response
of E. coli in the presence of other commensal bacteria, we decided to focus on the aspect
relating to effect of mucin on E. coli. As a substantial amount of previous experiments
performed by others have been conducted on polystyrene plates (e.g. screening of

Figure 3.1 Biofilm formation on polystyrene 24-well plate visualised by crystal violet
staining. E. coli G1 and G1ompR234 were incubated in BHI (37°C) with 0-4% mucin
and mM63 (30°C) with 0-2% mucin. Biofilms were stained with crystal violet. Red
rectangles indicate mucin concentrations at which enhanced biofilm formation can be
observed.
G1
G1ompR234
BHI at 37 C
0 0.75 1 2 3 4
0 0.1 0.25 0.5 0.75 2
mM63 at 30 C
G1
G1ompR234
mucin%
mucin%

45
regulatory mutants libraries), we chose to investigate the role of mucin in biofilm
formation on polystyrene surface in the saturated system.
3.1 Low concentrations of mucin promote E. coli biofilm formation
The nature of biofilm development between the interface and saturated system is
expected to be fairly different. Hence we could not assume what is optimal for the
interface biofilm to be likewise for the saturated biofilm. To determine the optimal mucin
concentration in the saturated system, mucin concentrations in M63 minimal medium
from 0 to 10% (0, 2, 4, 6, 8 and 10%) were initially tested for both G1 and G1ompR234
in BHI (37°C) and M63+ BHI (30°C) on polystyrene (PS) 24-well plate to have a grasp
on the concentration range to focus on. Interestingly, high concentrations of mucin were
observed to result in very low biofilm formation (data not shown), so it was narrowed
down to 0 – 4% (0, 0.75, 1.5, 2, 3 and 4%) in BHI at 37°C, and 0 – 2% (0, 0.1, 0.25, 0.5,
0.75 and 2%) in mM63 (M63 supplemented with 2% glucose and 1% BHI, see materials
and methods) at 30°C (Table 5). Biofilm formed on PS 24-well plate was grossly
quantified by Crystal Violet (CV) staining (Figure 3.1).
Except for the G1 strain at 37°C in BHI medium, Mucin at certain concentration(s)
enhance biofilm formation (Figure 3.1, red rectangles). However, high concentrations of
mucin does not systematically guarantee thicker biofilm formation (e.g. G1 and
G1ompR234 in mM63 at 30°C with 2% mucin), and optimal concentration should be
determined for each strain and condition. As thicker biofilms were obtained in mM63 at
30°C further investigations were all carried out under this culture condition.
First, I tested if the chemical nature of the colonising surface affected mucin’s effect on
biofilm formation. Hence biofilm was also grown on glass cover slip in the saturated
system and the structure observed under CLSM (Figure 3.2). While the optimal mucin
concentration for biofilm growth on PS surface has been determined visually by CV
staining intensity (Figure 3.1), that on glass surface was analysed by comparing
microscope images and running calculation with COMSTAT with respect to biomass,

Figure 3.2 Biofilm formation on glass cover slip observed under CLSM. Biofilms of E. coli G1 (left panel) and
G1ompR234 (right panel) were grown in the saturated system with 0% (A & D), 0.25% (B & E) and 2% (C & F) mucin.
Confocal images were superimposed with fluorescence and transmitted light photos. Analysis of biomass using COMSTAT
was done for both G1 (G) and G1ompR234 (H).
0
5
10
15
20
25
30
35
40
45
50
0 0.25 2
Bio
mass
(µ
m^
3/µ
m^
2)
Mucin concentration (%)
0
5
10
15
20
25
30
35
40
45
50
0 0.25 2
Bio
mass
(µ
m^
3/µ
m^
2)
Mucin concentration (%)
A B C D E F
G HG1 G1ompR234

46
average thickness and maximum thickness (Figure 3.2, only images and biomass data are
shown). By simple eye-balling of the confocal microscope images, we can already
appreciate the increase in biomass brought about by 0.25% mucin in both strains (Figure
3.2). Moreover, strain G1 formed only scattered microcolonies without mucin, but with
the presence of 0.25% mucin, formed biofilm with adequate thickness and complex
mushroom structure. The improved biofilm structure in the presence of mucin suggests
that mucin promotes the development of biofilm.
The optimal mucin concentration for biofilm growth in the saturated system is listed in
Table 5. The discrepancy of the optimal mucin concentration between G1 growing on PS
and glass may be due to the difference of surface property between these two materials.
Nonetheless, all evidence points to the fact that low concentrations of mucin promote E.
coli biofilm formation.
It has been documented that mucin greatly increased the number of planktonic
Helicobacter pylori while not affecting biofilm bacteria, resulting in a decline in
adherence (Cole et al., 2004). We thus wondered if the increased biofilm formation is the
result of an overall increase of bacteria population giving a high adherence impression,
because mucin can be an important source of carbohydrate to certain bacteria
(Macfarlane et al., 2005; Vieira et al., 2010). To be sure that mucin acts specifically on
the biofilm fraction without affecting the total bacterial population, the effect of this
intestinal component on E. coli growth was investigated in the next section.
Strain Surface BHI 37°C mM63 30°C
G1 PS not obvious 0.50%
glass 3% 0.25%
G1ompR234 PS not obvious 0.25%
glass 2% 0.25%
Table 5. Concentrations of mucin that gave the maximum biofilm formation (the
“optimal” concentration) in different conditions. The optimal mucin concentration for
biofilm formation on PS surface is determined by direct visual observation of CV
staining intensity. On glass surface, it is determined by COMSTAT analysis on biomass,
average thickness and maximum thickness of CLSM Z-stacks (in bold).

Figure 3.3 Masking effect of mucin on bacteria OD600 measurement. The absorbance
(OD600) of medium containing various concentrations of mucin was measured (orange
curve). A constant amount of bacterial culture was then added into the medium
containing the same series of concentrations of mucin and the final OD600 measured again
(blue curve). The black horizontal line indicates the actual bacteria OD600 in the absence
of mucin. The absorbance due to mucin masks that of the bacteria.
0
1
2
3
4
5
6
0 0.1 0.25 0.5 0.75 1 2
OD
at 6
00nm
mucin concentration (%)
mucin
mucin+bact.
actual bacteria OD600

47
3.2 Mucin promotes biofilm formation in E. coli strains without
affecting bacteria growth
The antimicrobial activity of salivary mucin (MUC7) has been witnessed by several
groups against Streptococcus mutans (Wei et al., 2006), and clinical fungal strains
including Candida albicans (Situ & Bobek, 2000; Wei et al., 2007; Ogasawara et al.,
2007a). It has also been reported that antimicrobial agents at sub-inhibitory level induce
biofilm in a wide range of bacteria, probably as an adaptive survival strategy employed
by the bacteria under stressful conditions. For example, aminoglycoside antibiotics have
been demonstrated to stimulate biofilm formation of E. coli and P. aeruginosa (Hoffman
et al., 2005); sub-inhibitory concentrations of ribosome-targeting antibiotics lead to
strong E. coli biofilm induction (Boehm et al., 2009); strong detergents that disrupt cell
membranes also induce biofilm formation in Vibrio cholera (Hung et al., 2006), P.
aeruginosa (Klebensberger et al., 2007) and Bacteroides fragilis (Pumbwe et al., 2007);
metals toxic to bacteria such as Nickel, has been shown by the French laboratory to
promote E. coli biofilm formation (Perrin et al., 2009). Thus we suspect that mucin,
having antimicrobial activity, may likewise induce biofilm formation at the concentration
inferior to the biocidal level. To test this hypothesis, quantification of E. coli in the
presence of various concentrations of mucin is necessary.
3.2.1 Bacteria cannot be analysed by optical methods in the presence of
mucin.
Mucins are large, abundant, filamentous glycoproteins that cover the epithelial surfaces
in the human gastrointestinal tract (Dekker et al., 2002). Due to its high molecular weight,
mucin deflects light. Hence it is not possible to quantify bacteria by optical methods in
the presence of mucin. As can be observed in Figure 3.3, it was possible to measure the
absorbance due to mucin at 600 nm (OD600). When the same amount of bacteria was
added to various concentrations of mucin, the OD600 reading of bacteria was masked by
that of mucin. The difference between “mucin+bacteria” and “mucin” alone could not

Figure 3.4 Analysis of biofilm formation on polystyrene 24-well plate by CFU and
CV staining. Viable count was performed for both the planktonic and biofilm portion of
E. coli MG1655 (A) and MG1655ompR234 (C). Only adherence (curves) but not total
biomass (bars) was affected by the presence of mucin. CV staining of biofilm (B & D)
therefore reflects the adherence of bacteria.
0%
20%
40%
60%
80%
100%
1.00E+00
1.00E+02
1.00E+04
1.00E+06
1.00E+08
1.00E+10
0 0.1 0.25 0.5 0.75 2
MG1655
1
100
0
109
0 0.1 0.25 0.5 0.75 2
Mucin concentration (%)
To
tal b
iom
ass
(CF
U n
um
ber
)
50
0%
20%
40%
60%
80%
100%
1.00E+00
1.00E+02
1.00E+04
1.00E+06
1.00E+08
1.00E+10
0 0.1 0.25 0.5 0.75 2
MG1655ompR234
Ad
her
ence
(%)109
0 0.1 0.25 0.5 0.75 2
Mucin concentration (%)
1
100
0
50
A C
B D

48
reflect the actual bacteria OD600, especially with higher concentrations of mucin. Also,
bacteria grown in cultures containing mucin cannot be analysed by FACS as the mucin
clumps cannot be differentiated from the cells based on size. Furthermore, the machine’s
fluidic channels are prone to be clogged by the mucin clumps. Therefore, single cell
profiling of GFP-labelled promoter activity is not possible unless a second fluorescent
component on the bacterial cell is available to fine-tune FACS detection. As a
consequence, the laborious (but nonetheless effective) methodology of viable count on
agar plate was employed to ensure accurate quantification of bacteria.
3.2.2 Mucin neither inhibits nor promotes the growth of E. coli.
To test the hypothesis that the biofilm induction in E. coli by low concentrations of mucin
is due to mucin’s antimicrobial activity, total viable count of E. coli grown in different
concentrations of mucin was performed. Both E. coli MG1655 and MG1655ompR234
were inoculated at a cell density of 6x10⁶ cells/ml in mM63 at 30°C in the presence of
increasing amount of mucin (0 – 2%). After static incubation on 24-well PS plate for 48
hours, the planktonic and biofilm fractions were diluted and plated on LB agar for viable
count. Total bacteria population refers to the sum of the planktonic and biofilm portion,
while adherence is the percentage of biofilm in the total population.
To our surprise, mucin does not appear to have inhibitory effect on the growth of E. coli.
As is shown in Figure 3.4, despite the change in population of the biofilm portion with
respect to increasing mucin concentrations, the total population stays constant for both
strains (P = 0.69 by Anova analysis).
Other E. coli K-12 strains such as MC4100 and W3110 and their ompR234 derivatives
showed similar pattern to that of MG1655 (data not shown). These results led us to
abandon the hypothesis of “sub-inhibitory level of mucin induce biofilm formation”, and
conclude that mucin does not show antimicrobial activity against E. coli K-12 strains in
our experimental setting.

Figure 3.5 Curli producing status influences E. coli adherence without affecting
growth. The growth of E. coli MG1655ompR234csgA (curli--), MG1655 (curli+/-) and
MG1655ompR234 (curli++) on 24-well plate in the presence of 0-2% mucin was
calculated based on CFU (A) and showed no significant difference. However, the curli++
strain showed highly induced biofilm formation by low concentrations of mucin (B)
whereas the curli+/- and curli-- strains did not.
Figure 3.6 Adherence of E. coli MG1655ompR on 24-well plate. The biofilm formed
by MG1655ompR at 0 - 2% mucin was stained with CV. The ompR null mutation
decreased the overall adherence but did not eliminate the induction effect of mucin.
1.00E+05
1.00E+06
1.00E+07
1.00E+08
1.00E+09
1.00E+10
0 0.1 0.25 0.5 0.75 2
CF
U
mucin concentration (%)
MG1655
MG1655ompR234
MG1655ompR234csgA
0%
20%
40%
60%
80%
100%
0 0.1 0.25 0.5 0.75 2
Ad
heren
ce (
%)
mucin concentration (%)
A B
0 0.1 0.25 0.5 0.75 2mucin%

49
In addition, knowing that the total population of bacteria remains unchanged in the
presence of different concentrations of mucin, we can be confident that the CV staining
of biofilm reflects the actual biofilm proportion of the total bacteria population. The
induction effect exhibited by the CV staining method correlates well to that of the viable
count method (Figure 3.4 compare A and B, C and D), indicating that CV staining of 24-
well plate provides a satisfactory estimation of the biofilm induction level by mucin.
3.3 Curli are involved in mucin-induced biofilm formation
3.3.1 Mutations impairing curli production hamper mucin’s induction
effect on biofilm
Intriguingly, for all three lineage of E. coli strains used in my study (MG1655, W3110
and MC4100), the biofilm induction effect on PS surface is prominent for the ompR234
mutant, but very minimal for the wild type. Since the most apparent difference between
the two strains is in their curli expression, we speculate that curli may be involved in the
mucin-induced biofilm formation. In addition, previous observation (refer to section 3.1)
that the induction effect is very little in the ompR234 mutant grown under non curli-
expressing condition BHI (37°C) supports our speculation. To assess this, the curli null-
mutant MG1655ompR234csgA was subjected to the same adherence test. Results show
that while the growth of the MG1655 (curli+/-), MG1655ompR234 (curli++) and
MG1655ompR234csgA (curli--) mutants are not affected by the presence of mucin
(Figure 3.5 A), both strains deficient in curli expression (MG1655 and
MG1655ompR234csgA) have lost the biofilm induction effect by mucin (Figure 3.5 B).
Since the csgA mutant also carries the allele ompR234, and lacks only the structural gene
of curli, this set of data effectively eliminates the possibility that other effects of
ompR234 mutation are responsible for the mucin-induced biofilm formation. It therefore
strongly supports our hypothesis that curli is the mediator of this effect in E. coli K- 12
strains.

Figure 3.7 Mucin’s effect on PcsgBA-gfp activity in E. coli MG1655ompR234 colonies
on agar plates. 2% mucin in BHI, LB and mM63 agar up-regulates PcsgBA-gfp activity at
30°C, but very low activity was observed at 37°C. This up-regulation can be observed as
increased fluorescence intensity by direct visual assessment (A) and quantification of
fluorescence/OD600 (B) using fluorometer (refer to Section 6.8.1). Due to the poor growth
of colonies on mM63 agar plate, 0.25% and 0.5% mucin were only tested on BHI and LB
plate for induction effect of PcsgBA-gfp activity and both showed up-regulation of PcsgBA-
gfp activity (C). All measurements were based on at least three repeated experiments.
BHI
2%0%
LB
2%0%
mM63 at 30 C
2%0%
mM63 at 37 C
2%0%
A
B
C
0
5
10
15
20
25
30
35
40
BHI LB mM63 30 C mM63 37 C
Flu
oresc
en
ce/O
D6
00
without mucin
with 2% mucin
0
20000
40000
60000
80000
100000
120000
140000
BHI LB
flu
oresc
en
ce/O
D6
00
0% mucin
0.25% mucin
0.5% mucin
2% mucin

50
In view of the highly complex regulation of curli production pathway, we can only
speculate with the data that we have at this moment. In the E. coli MG1655 background,
while the ompR234 mutation lead to increased biofilm formation and showed higher
induction by mucin, the csgA mutation abolished biofilm formation completely,
indicating that the mucin-mediated biofilm formation is csgBA-dependent, that is, curli-
dependent. On the other hand, a null mutation of ompR reduced biofilm formation but did
not wipe out mucin’s induction effect (Figure 3.6). Since no expression of csgBA could
be observed in the absence of a functional ompR gene (Prigent-Combaret et al., 2001),
we conclude that other factor(s) beside curli are able to promote biofilm formation in a
mucin-inducible manner in the ompR mutant of the MG1655 strain.
3.3.2 Low concentrations of mucin up-regulate csgBA gene expression in
MG1655 genetic background
We further investigated curli’s involvement in mucin-induced biofilm formation at the
transcriptional level, making use of our transcriptional reporter fusion PcsgBA-gfp (refer to
section 2.3.3). Since 0.25 and 0.5% mucin produced the highest biofilm induction effect
on both PS and glass surfaces, these two concentrations were tested in comparison with 0%
mucin. The activity of PcsgBA-gfp was monitored in both planktonic and biofilm mode.
The plasmid PcsgBA-gfp, harbouring the short-life GFP[LVA] coding sequence under the
control of the csgBA promoter was transformed into both MG1655 and
MG1655ompR234, and the resulting strains were used in the following series of
experiments.
3.3.2.1 On agar surface
For a preliminary test, MG1655ompR234 carrying PcsgBA-gfp were streaked on BHI, LB
and mM63 agar plates with or without 2% mucin (concentration used in the interface
biofilm system, refer to the first paragraph of Chapter 3) and incubated for 24 hours at
30°C and 37°C. At 30°C, strong csgBA expression was visible on rich media BHI (Figure
3.7 A “BHI”, GFP expression resulted in bright yellow-green coloration within the

51
streaks and colonies) and LB agar (Figure 3.7 A “LB”). However, only very low
expression was visible on mM63 agar (Figure 3.7 A “mM63 at 30°C”), which could
partially be attributed to the poor growth of colonies. Although the growth on mM63 agar
was improved at 37°C, the PcsgBA-gfp activity remained low (Figure 3.7 A “mM63 at
37°C”), as was on BHI and LB agar (data not shown). For a more objective comparison,
PcsgBA-gfp activity was quantified by dissolving a loopful of cells in 1ml sterile water and
measuring the fluorescence level, then normalising against the cell density. As could
already be visually observed on agar, mucin up-regulated csgBA promoter activity at
30°C on all three media agar (Figure 3.7 B compare blue bar to red bar in blocks of
“BHI”, “LB” and “mM63 30°C”), while having the highest induction on LB
(approximately 6-fold increase in relative fluorescence compared to 2-fold on mM63 and
1.5-fold on BHI), whereas no induction can be observed on mM63 at 37°C (Figure 3.7 B
compare blue bar to red bar in the block of “mM63 37°C”). It has been routinely
observed that csgBA expression on agar plate is not affected by the osmolarity of the
medium. It is likely that osmolarity influence is not crucial in the agar culture condition,
considering that most cells in the colony are not in direct contact with the medium.
However, temperature regulation of csgBA expression remains critical even in the context
of agar cultures.
I then tested the induction effect of 0.25% and 0.5% mucin in BHI and LB agar plate
using the same method as that for 0% and 2% mucin. As shown in Figure 3.7 C, both
0.25% and 0.5% mucin up-regulated csgBA promoter activity on BHI and LB agar plate,
as with 2% mucin.
3.3.2.2 In planktonic culture
Strains MG1655 and MG1655ompR234 carrying PcsgBA-gfp were inoculated at a cell
density of 6x10⁶ cells/ml into mM63 supplemented with 0, 0.25 and 0.5% mucin. The
planktonic culture was gently shaken (60 rpm) and sample aliquots were collected hourly
from 3 to 14 hours of culture, followed by 24 and 48 hour time points. GFP expression
level was measured by fluorometer whereas cell concentration was determined by viable

Figure 3.8 The expression of csgBA is up-regulated by low concentrations of mucin.
The average activity (fluorescence/CFU, calculated as described in 6.8.1) of PcsgBA-gfp in
E. coli MG1655 (A) and MG1655ompR234 (B) in planktonic culture was calculated.
Mean values and SD of 2 experiments are indicated. Mucin did not affect the growth of
E. coli but significant up-regulated csgBA expression in MG1655ompR234. Black boxes
indicate enlarged regions for better observation. 5-fold (with 0.25% mucin) and 1.5-fold
(with 0.5% mucin) up-regulation of csgBA expression can be observed in MG1655,
whereas 2.5 fold (with 0.25% mucin) and as high as 13-fold up-regulation can be seen in
MG1655ompR234.
0
50
100
150
200
250
1.00E+00
1.00E+01
1.00E+02
1.00E+03
1.00E+04
1.00E+05
1.00E+06
1.00E+07
1.00E+08
1.00E+09
1.00E+10
0 5 10 15 20 25 30 35 40 45 50
Time (h)
CFU 0% mucin
CFU 0.25% mucin
CFU 0.5% mucin
csgBA activity 0% mucin
csgBA activity 0.25% mucin
csgBA activity 0.5% mucin
0.0
50.0
100.0
150.0
200.0
250.0
1.00E+00
1.00E+01
1.00E+02
1.00E+03
1.00E+04
1.00E+05
1.00E+06
1.00E+07
1.00E+08
1.00E+09
1.00E+10
0 5 10 15 20 25 30 35 40 45 50
Time (h)
A
B
CF
UC
FU

52
count on agar plates. The average activity of PcsgBA-gfp was calculated as measured
fluorescence per CFU. As expected, while the growth of bacteria is not influenced by
mucin, csgBA expression in MG1655 shows 5-fold increase in the presence of 0.25%
mucin and 1.5-fold increase with 0.5% mucin at 14 hours (Figure 3.8 A). In
MG1655ompR234, the “basal activity level” of PcsgBA-gfp is much higher than that in
MG1655, owing to the strong constitutive positive regulation of the ompR234 mutation.
Despite this, the up-regulation of PcsgBA-gfp is evident even at 8 hours of incubation
(Figure 3.8 B). 0.25% mucin increases PcsgBA-gfp activity up to 2.5 fold while 0.5%
mucin leads to as high as 13-fold increase at 24 hours.
The up-regulation of csgBA promoter activity by low concentrations of mucin in the
planktonic cultures corroborates that curli is involved in mucin-induced biofilm
formation. However, it should be borne in mind that the PcsgBA-gfp activity calculated here
is an averaged promoter activity of the whole population in the sample.
In recent years, we have become more aware that promoter expression may be
heterogeneous even within the same planktonic culture (Dubnau & Losick, 2006;
Davidson & Surette, 2008), and it should be noted that the averaged promoter activity
will not reflect heterogeneity even if it exists. For example, in the case of csgBA promoter
activity, if the average PcsgBA-gfp activity without mucin in the heterogeneous population
is designated as 1, as shown in Figure 3.9 A, the increased average PcsgBA-gfp activity (as
reflected by green fluorescence) in the presence of mucin may be a result of three
scenarios. First, it could be an increase in the csgBA-active (“green”) population (Figure
3.9 B); or the presence of mucin could lead to increased csgBA expression (“green”
intensity) of csgBA-active cells (Figure 3.9 C); lastly and most probably, the increased
average csgBA activity may be the result of both increased csgBA-active population and
csgBA expression (Figure 3.9 D).
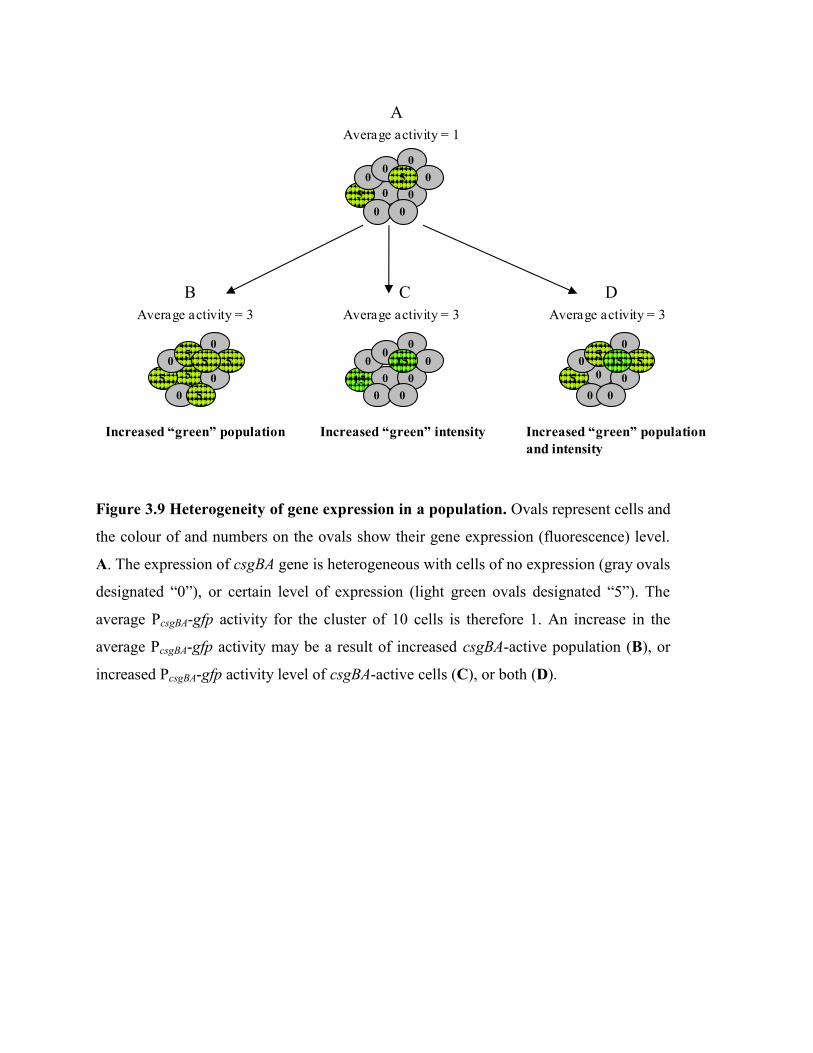
Figure 3.9 Heterogeneity of gene expression in a population. Ovals represent cells and
the colour of and numbers on the ovals show their gene expression (fluorescence) level.
A. The expression of csgBA gene is heterogeneous with cells of no expression (gray ovals
designated “0”), or certain level of expression (light green ovals designated “5”). The
average PcsgBA-gfp activity for the cluster of 10 cells is therefore 1. An increase in the
average PcsgBA-gfp activity may be a result of increased csgBA-active population (B), or
increased PcsgBA-gfp activity level of csgBA-active cells (C), or both (D).
Average activity = 1
Increased “green” population
05
00
0
0
0
0
05
55
0
0
0
0
55
5
5
15 0
00
0
0
0
0
015
05
0
0
0
0
55
0
15
Average activity = 3
Increased “green” intensity Increased “green” population
and intensity
Average activity = 3Average activity = 3
A
B C D

53
3.3.2.3 In biofilm
In biofilm, cells are considered to be even more heterogeneous than their counterparts in
planktonic culture, because of the existence of spatially restricted microenvironments in
biofilms (Grantcharova et al., 2010). Cells in different microenvironment may thus
exhibit heterogeneity, e.g., with respect to motility, antibiotic susceptibility and
production of extracellular matrix components (Klausen et al., 2003; Haagensen et al.,
2007; Chai et al., 2008). It has been demonstrated that CsgD is expressed in a bistable
manner during Salmonella biofilm development, that is, both high (CsgD-ON) and low
(CsgD-OFF) csgD-expressing subpopulations exist (Grantcharova et al., 2010). They also
suggested direct correlation between expression of the biofilm regulator CsgD and the
phenotypic output, i.e., the production of curli and cellulose. This is in agreement with
the observation by White and co-workers that the promoters of adrA (encoding a DGC
that activates cellulose biosynthesis) and csgBA are primarily activated in the
subpopulation of aggregated cells (White et al., 2008). Therefore, we can expect that the
expression of the CsgD-regulated csgBA to be highly heterogeneous in biofilm. Thanks to
CLSM and the advancement of image analysing software like COMSTAT and ImageJ,
the heterogeneity of PcsgBA-gfp activity can be examined and taken into account for the
assessment.
3.3.2.3.1 Difficulties in promoter activity measurement using traditional method
Traditionally, in biofilm, the measurement of promoter activity using promoter-
fluorescence fusion is achieved by calculating the proportion of the fluorescent cells (in
which the gene of interest is actively expressed) in the total population (Moller et al.,
1998; Dulla & Lindow, 2008). An increased promoter activity is thus shown as an
increase in the fluorescent population proportion, as explained in Section 3.3.2.2, Figure
3.9 B. However, this method could not be used in determining the promoter activity in
our biofilm system due to the nature of our experimental model, in which the
heterogeneity exists in several aspects including spatial distribution of cells and mucin, as

Figure 3.10 PcsgBA-gfp activity in biofilm by confocal microscopy. The expression of
csgBA in biofilm was observed under CLSM using PcsgBA-gfp fusion. csgBA expression in
the MG1655 (A, B and C) and MG1655ompR234 (D, E and F) background were tested in
the presence of 0, 0.25 and 0.5% mucin. Photos shown are superimposed with transmitted
light images.
0% 0.5%0.25%
0% 0.5%0.25%
MG1655
MG1655ompR234
A B C
D E F

54
well as gene expression, all of which rendering the analysis of promoter activity in
biofilm more complicated.
In the saturated system, biofilms are formed on glass cover slips at the bottom of the Petri
dish, where mucin sediments. Thus what we observe under the microscope is actually a
mixture of bacterial biofilm and mucin. Due to its high molecular weight, mucin appears
as dark substances in CLSM images, making it difficult to be discerned from non-
fluorescent cells (Figure 3.11 E). This adds on the complexity in determining total
bacterial population.
First of all, the gene expression of biofilm cells appears heterogeneous (see Section
3.3.2.3), as in planktonic cultures. Thus, not all cells carrying PcsgBA-gfp have their csgBA
promoter activated and turn green (Figure 3.10 D). As explained in Section 3.3.2.2,
Figure 3.9 B, the “up-regulation” of the csgBA promoter can be manifested as an increase
of the csgBA-expressing subpopulation with respect to the total bacterial population. In
microscopic images, it is reflected as an increased proportion of green cells in the whole
population (in the observation field). In COMSTAT programme, only fluorescent pixels
in the field are recognized as cells, giving us the possibility to compute the biomass of
csgBA-expressing population (refer to Section 2.3.3). Unfortunately, the other parameter
necessary to complete the analysis – total bacterial population – is difficult to determine,
since non-fluorescent cells are indistinguishable from mucin. Therefore we cannot use the
traditional method to quantify PcsgBA-gfp activity because in our case, the total bacterial
population cannot be determined easily.
The possibility of using fluorescent stain (such as SYTO 61) on biofilms mixed with
mucin for the determination of total bacterial population was decided against, because of
the observed disruption of biofilm during the staining process and its inconsistency in
staining even pure bacterial biofilm without mucin (refer to Section 2.4.1).
In the search for an alternative method for total bacterial population measurement, one
may consider using E. coli G1 biofilm or its derivative strains in the presence of mucin as

Figure 3.11 Heterogeneity in biofilm morphology and csgBA expression pattern.
Confocal microscopic observations of E. coli W3110 carrying PcsgBA-gfp biofilms in the
presence of mucin revealed heterogeneous biofilm morphology and csgBA expression
patterns (A - D). Two fields on the same coverslip are shown for each concentration of
mucin (A&B: 0.25% of mucin, C&D: 0.5% of mucin). Homogeneous structure can be
observed in sample containing mucin alone (without bacteria) (E). Confocal photos
shown are superposed with transmitted light images.
W3110 +
PcsgBA-gfp
0.25% mucin
W3110 +
PcsgBA-gfp
0.5% mucin
Mucin
alone
A B
C D
E

55
a parallel control sample, to serve as an estimation of the total bacterial population
because its “green” population is 98.70 – 99.60% of the whole population (Miao et al.,
2009). The complication is that the spatial distribution of cell clusters and mucin in the
saturated system is heterogeneous (and can be highly heterogeneous), thus a generalised
estimation of total bacterial population using E. coli G1 derivatives may not be
representative for different observation fields. For example, on the same cover slip,
various biofilm morphology and PcsgBA-gfp activity pattern can be observed in different
observation fields (Figure 3.11): some with highly developed 3D structure and high
csgBA-expressing population (Figure 3.11 A & D), some with flat biofilm and high
csgBA-expressing population (Figure 3.11 B), while examples also exist when the biofilm
structure is well developed but csgBA expression is sparse (Figure 3.11 C). Therefore, for
my experiments, at least 6 observation fields have been taken for each sample, and the
ones with the biofilm morphology and promoter activity pattern most representative of
the majority of the 6 have been chosen for presentation or discussion. If the parallel G1
derivative biofilms have to be assessed in similar ways in order to determine the
“corresponding” total bacterial population, too many factors of subjectiveness will be
compounded, and confidence in the final interpretation will be compromised.
Due to the inability to discern mucin from non-fluorescent cells, it may also seem
difficult to determine whether a correlation exists between csgBA expression and biofilm
development, i.e. we may see more “green cells” but how would we know if all “grey
patches” are not just mucin patches? To alleviate this worry, I compared the view of the
mucin on its own with other cell-containing samples (Figure 3.11). The increased
heterogeneity in morphology (complex 3D structure) brought about by bacterial cell
during biofilm formation (Figures 3.11 A - D) is not negligible, compared to the
homogeneous distribution of mucin alone (Figure 3.11 E). Hence qualitatively we could
still make assessment of the observation fields, but qualitatively, we were unable to
deepen the analysis.

Figure 3.12 Specific activity in an activity-heterogeneous population. In biofilm, the
fluorescence intensity measurement only deals with fluorescent cells. So the total
fluorescence intensity (summation of fluorescent intensity in the whole cluster of cells)
and fluorescent biomass (number of fluorescent cells) may not reflect the state of gene
expression (promoter activity) as well as the specific activity (total intensity divided by
the number of green cells only) does. A. An activity-heterogeneous population with
various promoter activity levels. B. An activity-heterogeneous population with the same
composition as A, but doubles its total population. Although the total intensity doubles,
the fluorescent biomass, proportion of fluorescent population and specific activity remain
the same. C & D. An increase in the total intensity may be able to reflect the increased
overall promoter activity but fails to reveal the how active the promoter-active cells are,
due to heterogeneous gene expression of the total population.
5
15
5
0
0
0
55
1530
05
0
0
0
0
55
0
15
30
0
0
5
0
0
0
01530
05
0
0
0
0
55
0
15
05
0
0
0
0
55
0
15
A B C D
Total intensity 30 60 80 80
Fluorescent biomass 4 8 8 4
“Green” population% 40% 40% 70% 40%
Specific activity 7.5 7.5 11.4 20
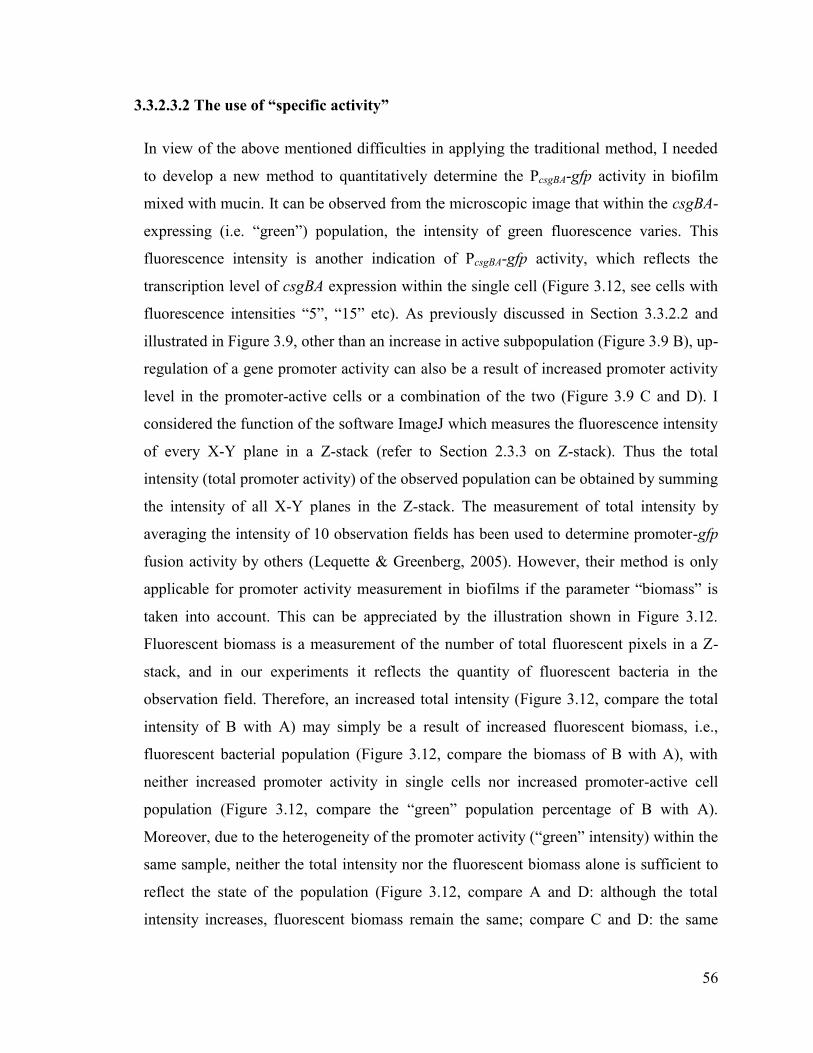
56
3.3.2.3.2 The use of “specific activity”
In view of the above mentioned difficulties in applying the traditional method, I needed
to develop a new method to quantitatively determine the PcsgBA-gfp activity in biofilm
mixed with mucin. It can be observed from the microscopic image that within the csgBA-
expressing (i.e. “green”) population, the intensity of green fluorescence varies. This
fluorescence intensity is another indication of PcsgBA-gfp activity, which reflects the
transcription level of csgBA expression within the single cell (Figure 3.12, see cells with
fluorescence intensities “5”, “15” etc). As previously discussed in Section 3.3.2.2 and
illustrated in Figure 3.9, other than an increase in active subpopulation (Figure 3.9 B), up-
regulation of a gene promoter activity can also be a result of increased promoter activity
level in the promoter-active cells or a combination of the two (Figure 3.9 C and D). I
considered the function of the software ImageJ which measures the fluorescence intensity
of every X-Y plane in a Z-stack (refer to Section 2.3.3 on Z-stack). Thus the total
intensity (total promoter activity) of the observed population can be obtained by summing
the intensity of all X-Y planes in the Z-stack. The measurement of total intensity by
averaging the intensity of 10 observation fields has been used to determine promoter-gfp
fusion activity by others (Lequette & Greenberg, 2005). However, their method is only
applicable for promoter activity measurement in biofilms if the parameter “biomass” is
taken into account. This can be appreciated by the illustration shown in Figure 3.12.
Fluorescent biomass is a measurement of the number of total fluorescent pixels in a Z-
stack, and in our experiments it reflects the quantity of fluorescent bacteria in the
observation field. Therefore, an increased total intensity (Figure 3.12, compare the total
intensity of B with A) may simply be a result of increased fluorescent biomass, i.e.,
fluorescent bacterial population (Figure 3.12, compare the biomass of B with A), with
neither increased promoter activity in single cells nor increased promoter-active cell
population (Figure 3.12, compare the “green” population percentage of B with A).
Moreover, due to the heterogeneity of the promoter activity (“green” intensity) within the
same sample, neither the total intensity nor the fluorescent biomass alone is sufficient to
reflect the state of the population (Figure 3.12, compare A and D: although the total
intensity increases, fluorescent biomass remain the same; compare C and D: the same

Figure 3.13 The specific activity of PcsgBA-gfp in the MG1655 (left) and
MG1655ompR234 (right) background. The specific activity of PcsgBA-gfp in biofilm
with 0, 0.25 and 0.5% mucin was calculated with the aid of softwares ImageJ and
COMSTAT. 0.25% mucin up-regulates the expression of csgBA in MG1655ompR234 but
has no significant effect on MG1655.
0
2000
4000
6000
8000
10000
12000
14000
0 0.25 0.5
Sp
ecif
ic a
ctiv
ity
mucin concentration (%)
MG1655
0
2000
4000
6000
8000
10000
12000
14000
0 0.25 0.5
Sp
ecif
ic a
ctiv
ity
mucin concentration (%)
MG1655ompR234
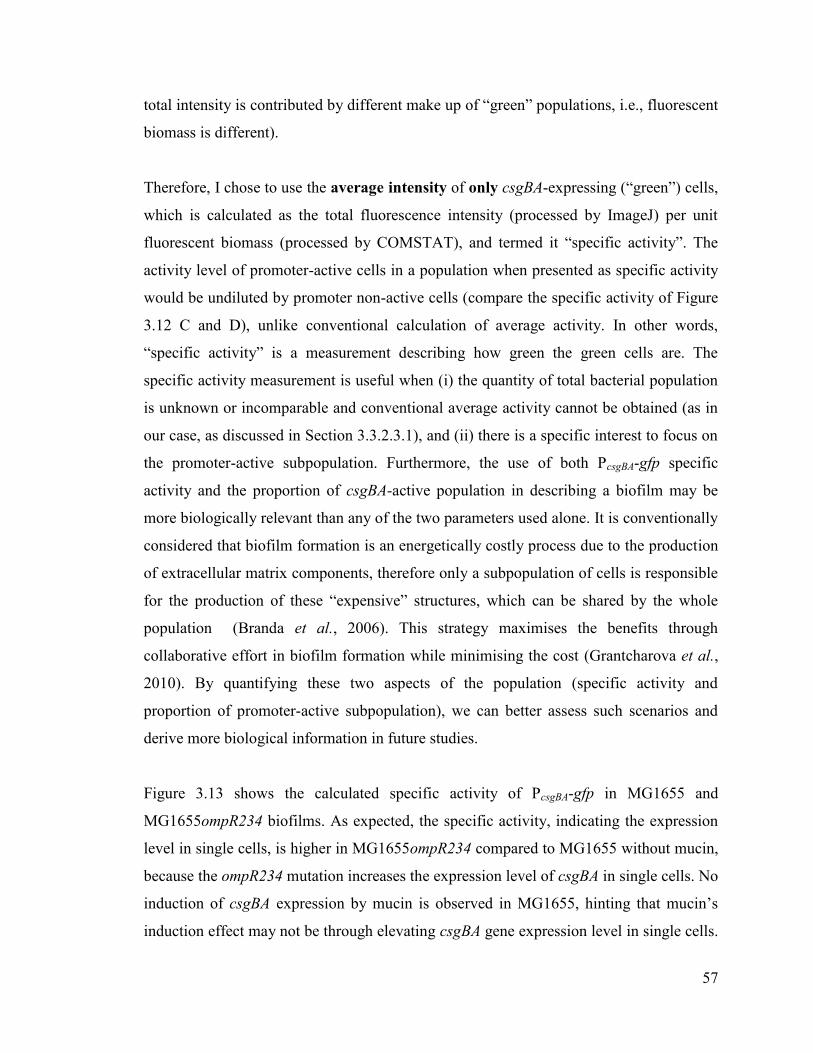
57
total intensity is contributed by different make up of “green” populations, i.e., fluorescent
biomass is different).
Therefore, I chose to use the average intensity of only csgBA-expressing (“green”) cells,
which is calculated as the total fluorescence intensity (processed by ImageJ) per unit
fluorescent biomass (processed by COMSTAT), and termed it “specific activity”. The
activity level of promoter-active cells in a population when presented as specific activity
would be undiluted by promoter non-active cells (compare the specific activity of Figure
3.12 C and D), unlike conventional calculation of average activity. In other words,
“specific activity” is a measurement describing how green the green cells are. The
specific activity measurement is useful when (i) the quantity of total bacterial population
is unknown or incomparable and conventional average activity cannot be obtained (as in
our case, as discussed in Section 3.3.2.3.1), and (ii) there is a specific interest to focus on
the promoter-active subpopulation. Furthermore, the use of both PcsgBA-gfp specific
activity and the proportion of csgBA-active population in describing a biofilm may be
more biologically relevant than any of the two parameters used alone. It is conventionally
considered that biofilm formation is an energetically costly process due to the production
of extracellular matrix components, therefore only a subpopulation of cells is responsible
for the production of these “expensive” structures, which can be shared by the whole
population (Branda et al., 2006). This strategy maximises the benefits through
collaborative effort in biofilm formation while minimising the cost (Grantcharova et al.,
2010). By quantifying these two aspects of the population (specific activity and
proportion of promoter-active subpopulation), we can better assess such scenarios and
derive more biological information in future studies.
Figure 3.13 shows the calculated specific activity of PcsgBA-gfp in MG1655 and
MG1655ompR234 biofilms. As expected, the specific activity, indicating the expression
level in single cells, is higher in MG1655ompR234 compared to MG1655 without mucin,
because the ompR234 mutation increases the expression level of csgBA in single cells. No
induction of csgBA expression by mucin is observed in MG1655, hinting that mucin’s
induction effect may not be through elevating csgBA gene expression level in single cells.

58
The specific activity of PcsgBA-gfp is increased in MG1655ompR234 with 0.25% mucin,
suggesting that 0.25% mucin up-regulates csgBA expression in csgBA-active
MG1655ompR234 cells.
It should be noted however, that the specific activity is also an averaged value of all the
csgBA-expressing cells in the sample. The heterogeneity in csgBA expression being very
high with 0.5% mucin in MG1655 implies that 0.5 % mucin may be involved in both
activation of csgBA in csgBA-inactive cell and augmentation of csgBA gene expression
level.
Even though quantification of the csgBA-expressing MG1655 population proportion is
impractical due to the difficulty in total bacterial population quantification, it is
nonetheless unmistakable from the confocal microscopic image that MG1655 without
mucin forms only microcolonies, but develops complex biofilm structure with 0.25%
mucin (Figure 3.10, compare A and B). The addition of 0.5% mucin further improves the
3D structure complexity of biofilm (Figure 3.10 C). P. aeruginosa biofilms formed on
glass coated with human airway or bovine submaxillary mucins display similar
aggregates (Landry et al., 2006). Therefore, induction of bacterial biofilms with complex
3D structure could be a general property of mucins. In our case, it is possible that mucin
possesses bacterial attachment sites mimicking those on intestinal epithelial cells
(Blomberg et al., 1993; Mack et al., 1999; Lillehoj et al., 2001). E. coli, belonging to the
enterobacteriaceae family, may recognise these sites and attach to mucin. Cell-surface
interactions induce remodelling of the bacterial envelope (Otto et al., 2001), this
attachment and change in envelope could also induce a cascade of changes in gene
expression that favour biofilm life style, leading to csgBA activation. It is shown that
enteropathogenic E. coli (EPEC) and enterohemorrhagic E. coli (EHEC), the major cause
of diarrheal disease, produce curli during adhesion to cultured epithelial cells through
activation of the regulator csgD (Saldana et al., 2009). I suggest that the early molecular
event leading to the csgD gene activation is the E. coli attachment to mucin.

Figure 3.14 PcsgBA-gfp activity in biofilm of W3110 and W3110ompR234 in the
presence of various concentrations of mucin. Confocal microscopic photos of W3110
(A, B and C) and W3110ompR234 (D, E and F) are shown as superposed fluorescence
and transmitted light images. Mucin concentrations of 0% (A & D), 0.25% (B & E) and
0.5% (C & F) were tested. COMSTAT analysis of fluorescent biomass was done for
W3110 (G), W3110ompR234 (H), MG1655 (I) and MG1655ompR234 (J). The W3110
strain and its ompR234 mutants showed much higher fluorescent biomass than their
MG1655 counterparts.
0
5
10
15
20
25
30
35
40
45
0 0.25 0.5
flu
oresc
en
t b
iom
ass
(µ
m^
3/µ
m^
2)
mucin concentration (%)
MG1655ompR234
0
5
10
15
20
25
30
35
40
45
0 0.25 0.5
flu
oresc
en
t b
iom
ass
(µ
m^
3/µ
m^
2)
mucin concentration (%)
W3110
0
5
10
15
20
25
30
35
40
45
0 0.25 0.5
flu
oresc
en
t b
iom
ass
(µ
m^
3/µ
m^
2)
mucin concentration (%)
MG1655
0
5
10
15
20
25
30
35
40
45
0 0.25 0.5
flu
oresc
en
t b
iom
ass
(µ
m^
3/µ
m^
2)
mucin concentration (%)
W3110ompR234
A B C D E F
GH
IJ

59
3.3.2.3.3 “Super-up” regulation in E. coli W3110
PcsgBA-gfp expression was then observed in W3110 backgrounds. Similar to E. coli
MG1655, mucin-induced biofilm formation trend was observed in E. coli W3110.
However, both visual examination (compare Figure 3.14 A - F with Figure 3.10 A - F)
and COMSTAT analysis of fluorescent biomass in the observation field showed up to 10-
fold higher “green” population in W3110 compared to that of MG1655 (compare Figure
3.14 G & H with I & J), suggesting that the structural curli operon is ten times more
active in W3110. Since both strains are closely related and commonly used E. coli K-12
strains in laboratory, analysis has been done to compare their genome sequences and
showed that although they highly resemble each other, 13 sites have an IS element or
defective phage in only W3110 or MG1655, as well as 8 sites with differences between
them, 7 of which are in open reading frames (orfs) and 1 in an rRNA gene (Hayashi et al.,
2006). Among these differences, four appeared to be relevant to this study. Found in
W3110 and not in MG1655 are: non-functional rpoS alleles, one IS insertion downstream
of csgC, one upstream of flhD, and one within the rcsC sequence. rpoS is a global
regulator of stationary phase expressed genes, and the non-functional rpoS in W3110 did
not lead to repressed csgBA expression but quite the contrary. The IS insertions in non-
coding regions is unlikely to have a direct effect on the expression of adjacent genes.
However, the disruption of rcsC sequence by IS insertion in W3110 is highly likely to
result in a non-functional Rcs regulatory system. The rcs regulatory pathway regulates
synthesis of the capsular polysaccharide colanic acid, and is activated at low temperature
with glucose as carbon source (Majdalani & Gottesman, 2005; Huang et al., 2006). It
represses expression of surface appendages such as flagella (through flhDC) (Francez-
Charlot et al., 2003), curli (through csgD), and Ag43 (through agn43/flu) (Ferrieres &
Clarke, 2003), to prevent mobility and surface attachment (Figure 1.2 & 1.5). Therefore
the down-regulation of csgBA expression in mature biofilm might be due to the
repression of csgD expression by RcsB, which is the downstream response regulator of
RcsC (Figure 1.2). Thus, the loss of function of Rcs system in W3110 might result in the
absence of csgBA repression, which is reflected as higher csgBA expression compared to
that in MG1655 in our experiment.
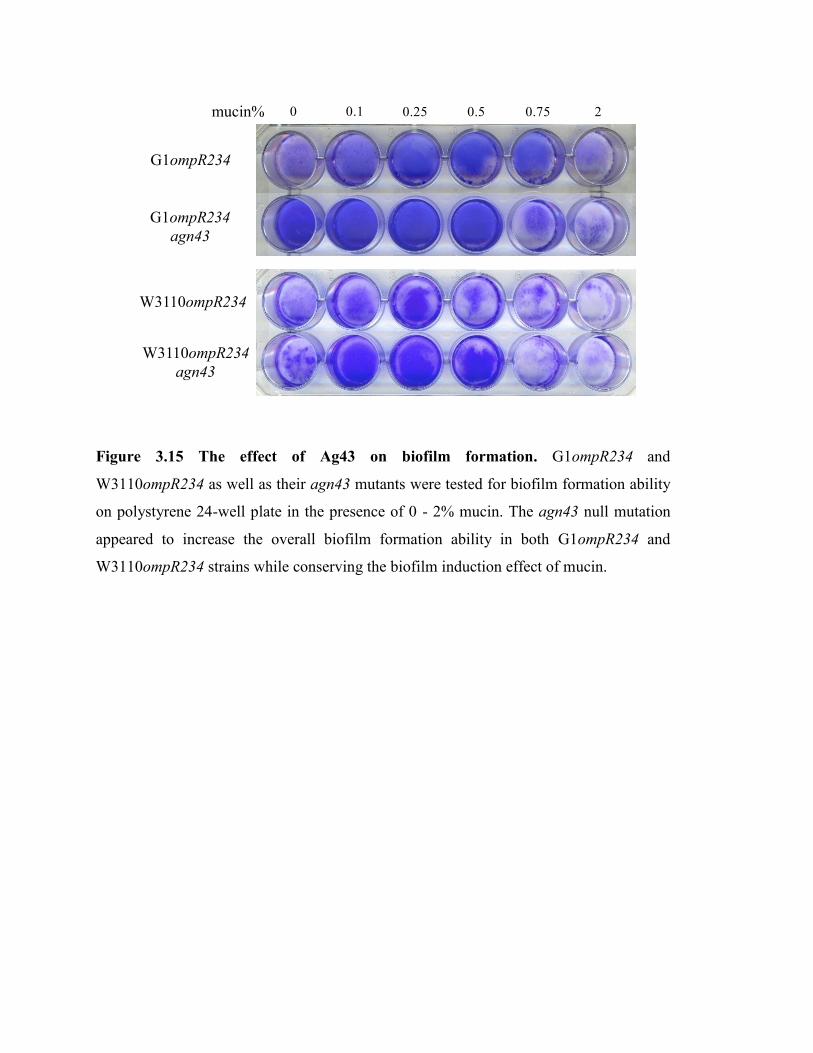
Figure 3.15 The effect of Ag43 on biofilm formation. G1ompR234 and
W3110ompR234 as well as their agn43 mutants were tested for biofilm formation ability
on polystyrene 24-well plate in the presence of 0 - 2% mucin. The agn43 null mutation
appeared to increase the overall biofilm formation ability in both G1ompR234 and
W3110ompR234 strains while conserving the biofilm induction effect of mucin.
G1ompR234
agn43
G1ompR234
W3110ompR234
W3110ompR234
agn43
0 0.1 0.25 0.5 0.75 2mucin%
60
3.4 Role of other extracellular structures in mucin induced biofilm
formation
The expression of type 1 pili in MG1655, as in fecal isolates, facilitates mucin-mediated
biofilm formation in Minimum Essential Medium (MEM) (Bollinger et al., 2006).
Besides curli, would other extracellular structures that contribute to biofilm formation be
involved in mucin-induced biofilm formation? The residual adherence observed in the
ompR mutant suggests it. Curli is involved in almost every step in biofilm formation
(Figure 1.1) (Van Houdt & Michiels, 2005), so I chose to preliminarily assess the role of
type 1 pili that is important for initial attachment and Ag43 for early biofilm structure
development in biofilm formation in the presence of mucin.
3.4.1 Antigen 43:
It is reported that Ag43 contributes to E. coli biofilm formation in glucose-minimal
medium, but not in LB broth (Danese et al., 2000a). When grown in 24-well plate in
mM63 at 30°C, deletion of agn43 did not significantly affect mucin-induced biofilm
formation of MG1655ompR234, if not slightly increased the overall biofilm quantity
(Figure 3.15). This effect was even more prominent in E. coli W3110 (Figure 3.15). This
suggests that Ag43 acts negatively in biofilm formation of E. coli MG1655 and W3110
on glass and PS. To further investigate the possible regulation of agn43 by ompR, the
GFP tagged Agn43 promoter Pagn43-gfp (Zaslaver et al., 2006) activity was observed in
biofilm of MG1655, MG1655ompR234 as well as W3110 and its ompR234 mutants, in
the presence of 0, 0.25 and 0.5% mucin. No Pagn43-gfp activity was detectable in biofilm
with these strains (data not shown). Suspecting that the ompR234 mutation might have
repressed the expression of Agn43, MG1655ompR background was used but gave the
same result. The effect of agn43 on the curli genes transcription has then to be
investigated. A repressor effect of Ag43 on the curli would help to understand how E.
coli coordinates the expression of its numerous adherence structures.

Figure 3.16 The interplay between type 1 pili and curli on biofilm formation. The effect
of fimA (coding for type 1 pili major subunit) null mutation of W3110 and W3110ompR234
and W3110ompR234 were tested for biofilm formation ability on polystyrene 24-well plate
in the presence of 0-2% mucin by cristal violet staining. The deletion of fimA seems to
abolish the biofilm formation ability of W3110. However, although the ompR234 mutation
increases the overall biofilm formation ability of W3110, it does not seem responsible for the
biofilm induction effect of mucin, because the deletion of curli structural subunit encoding
gene csgA did not remove the induction effect of mucin. On the other hand, deletion of fimA
in the ompR234 mutant of W3110 abolished the induction effect of mucin while maintaining
a relatively high biofilm formation. These results suggest that type 1 pili was involved in the
mucin-induced biofilm formation in W3110, while curli production enhances the overall
biofilm formation ability. This is different from MG1655 where curli is responsible for both
the enhanced biofilm forming ability and mucin-induced biofilm formation. Deletion of fimA
neither significantly affected the biofilm formation nor impairs the biofilm induction effect of
mucin.
W3110
W3110ompR234
W3110ompR234
csgA
W3110ompR234
fimA
MG1655ompR234
fimA
W3110fimA
W3110fimH
0 0.1 0.25 0.5 0.75 2mucin%

61
3.4.2 Type I pili:
Type 1 pili consist of the structural subunit protein FimA and the mannose-specific
adhesin FimH. In E. coli W3110, deletion of fimA or fimH both resulted in impairment of
biofilm formation with different concentrations of mucin (Figure 3.16), suggesting that
type 1 pili play an important role in mucin-induced biofilm formation in W3110.
While the ompR234 mutation augments biofilm formation of W3110 as on MG1655
regardless of mucin’s presence, insertional inactivation of csgA in W3110ompR234
reduced the overall biofilm formation but did not completely eliminate the induction
effect (Figure 3.16). This result shows that although curli are the main factor involved in
adherence to PS in this strain, another factor, such as type 1 pili, contributes to the
biofilm formation in the presence of mucin when curli fibers are missing. Two hypothesis
can be proposed: biofilm induction by mucin could be due either to a cooperative effect
of curli AND type 1 pili, or to the sole effect of type 1 pili. Deletion of fimA in
W3110ompR234 seems to result in loss of the induction effect by mucin (Figure 3.16).
Therefore, it is very tempting to speculate that mucin induces biofilm formation in
W3110 only through type 1 pili, while curli greatly improves the biovolume of biofilm.
Regulatory interplay between the two adherence factors has now to be investigated,
especially in the presence of mucin.
Interestingly, without FimA, not only the biofilm induction effect of mucin is abolished
(no increase in biofilm formation can be observed), the presence of mucin seems to even
reduce the biofilm forming ability of W3110 and W3110ompR234 (Figure 3.16, both
W3110fimA and W3110ompR234fimA have the highest biofilm formation at 0% mucin).
Therefore, in E. coli W3110, while overexpression of curli might boost the capability of
W3110 to form biofilm, type 1 pili is possibly involved in mucin-induced biofilm
formation, without which mucin may even decrease the biofilm forming ability of W3110.
In E. coli MG1655ompR234, on the other hand, deletion of fimA did not disrupt the
mucin-induced biofilm formation (Figure 3.16). This suggests that type 1 pili is not

62
involved in mucin-induced biofilm formation in this strain. These differences between E.
coli MG1655 and W3110 may be due to the difference in their genome, as described
above (refer to Section 3.3.2.3.3). However, why and how type 1 pili regulation or
expression interferes with that of curli in the presence of mucin remain to be elucidated.
Nevertheless, this could be another example of the coordinated regulation of surface
adhesins besides that between type 1 pili and Ag43 (Section 1.1.1.3) as well as between
curli and cellulose (Section 1.1.1.1). Indeed, microscopic observations have revealed that
in the biofilm of curli-deficient E. coli mutant flagella and type I pili were present
(Kikuchi et al., 2005). In Salmonella, pili-frimbriae were most abundant on curli mutant,
suggesting co-regulated expression of pili, curli and other surface structures (Jonas et al.,
2007). Crosstalk between the regulation of flagellar, Salmonella pathogenicity island 1
(SPI1), and type 1 fimbrial genes has recently been reported by Saini and co-workers
(Saini et al., 2010). It has also been suggested that fimC, encoding a PapD-like chaperone,
might have a CsgD binding site in its promoter region and that csgD null mutation led to
increased fimC mRNA level whereas csgD overexpression resulted in a decrease of the
mRNA level of fimC (Zakikhany et al., 2010). This indicates that curli genes expression
could be dominant on type 1 pili genes expression. Our results suggest that a
coexpression could occur in strain such as W3110, but further experiments are needed to
shed light on this point.

63
Chapter 4 Partnership of E. coli with K. pneumoniae
and E. faecalis
Biofilms in nature are mostly found to be composed of multispecies consortia (Stewart et
al., 1997; Stoodley et al., 2002; Burmolle et al., 2006; Klayman et al., 2009). The
coexistence of different species in a biofilm often confers fitness advantages owing to
cooperation between these species based on their different metabolic profiles, physical
properties and growth preferences (Klayman et al., 2009; Burmølle et al., 2010). For
example, in biofilms comprising of aerobic and anaerobic species, the aerobic species are
mostly found in the surface layer that is exposed to oxygen whereas the anaerobic species
are buried in the inner biofilm and shielded from oxygen by the aerobic partners
(Bradshaw et al., 1998). In a nitrifying wastewater treatment biofilm, nitrite-oxidizing
bacteria are found to form clusters around ammonia-oxidizing bacteria in nitrite-
oxidizing zones (Okabe et al., 1999). The persistence of the soil-inhabiting bacteria
Pseudomonas putida in a condition where benzyl alcohol is the sole carbon source is
dependent on Acinetobacter sp., because Acinetobacter converts benzyl alcohol into
benzoate, which can be metabolized by P. putida (Christensen et al., 2002). A
Lactobacillus strain has been demonstrated to proliferate in a mixed-species biofilm with
up to 20 times higher cell numbers than in its monoculture (Filoche et al., 2004). An E.
coli strain which was unable to irreversibly attach to glass surface when cultured alone
under continuous flow conditions was able to form biofilms in the presence of P.
aeruginosa. Closer observation showed that the adhered E. coli cells were attached to P.
aeruginosa cells, showing cooperativity at the level of physical interaction (Klayman et
al., 2009). Naturally, not all interactions are positive and cooperative. For example,
Ruminococcus gnavus strain E1 isolated from a human fecal sample was shown to inhibit
the growth of various pathogenic clostridia, due to its production of the bacteriocin
ruminococcin A (Dabard et al., 2001; Gomez et al., 2002). A newly discovered oral
streptococcal species, Streptococcus oligofermentans was observed to inhibit S. mutans
through conversion of lactic acid into inhibitory H2O2 (Tong et al., 2007).
64
Interspecies interactions can be studied using different approaches, such as by looking at
population relationship, gene expression changes, metabolic interplays, biofilm
development (colonization influence and spatial distribution) and interspecies
communication (e.g quorum sensing). Various studies have been performed on
environmental species such as the trichloroethylene (TCE)-degrading Burkholderia
cepacia, the oil/water isolate Klebsiella oxytoca (Komlos et al., 2005), marine alga
surface isolates (Burmolle et al., 2006), soil (Hansen et al., 2007), and oral bacteria
(Ledder et al., 2008; Kolenbrander et al., 2010; Koo et al., 2010). However, quite
surprisingly, studies on intestinal bacteria such as K. penumoniae and E. coli were
frequently partnered with pathogenic species P. aeruginosa (Siebel & Characklis, 1991;
Stewart et al., 1997; Liu & Li, 2008; Klayman et al., 2009; Burmølle et al., 2010), while
the interactions between intestinal commensal species themselves have not been
investigated much. In my work, I chose to investigate E. coli partnership with K.
pneumonia and E. faecalis with respect to their population relationship, since population
study is one of the most global assessments which could provide an overview of the
fitness and growth relationship of the co-cultured species.
4.1 Population relationship - Synergism, commensalism, parasitism
or antagonism?
When two organisms grow together, their relationship could be beneficial, neutral or
detrimental to each other’s growth. Several scenarios could take place. There is a
possibility of (i) synergistic relationship where both partners achieve better growth/fitness
together than if they are on their own. Alternatively, they could commit to (ii)
commensalism where one partner benefits and the other is not affected, or (iii) parasitic
interaction where one organism benefits but the other is harmed or disadvantaged. Finally
(iv) competition or antagonism could occur when both organisms are disadvantaged
compared to when they are alone.

65
4.2 Population Relationship in our model is not based on
antibiotics-mediated inhibition
Intestinal commensal species are generally believed to be interacting positively with each
other for mutual benefits, as well as the hosts’ benefit (Lievin-Le Moal & Servin, 2006).
However, it is ironic that for E. coli, K. pneumoniae and E. faecalis, the very few studies
that touch on their “interactions” dealt only with the extreme antagonistic end of the
interaction spectrum, i.e. biocidal activity against each other. All three bacterial species
have been reported to be able to produce bacteriocins, which exhibit antimicrobial
activity (Gillor et al., 2008). Specific strains of E. coli have long been known to produce
colicin (Gratia, 1925) and microcin (Duquesne et al., 2007). K. pneumoniae strains, on
the other hand, are famous for the production of microcin E492 (Destoumieux-Garzon et
al., 2003; Bieler et al., 2006), whereas strains of E. faecalis have been reported to secrete
enterocin As-48 (Archimbaud et al., 2002; Fernandez et al., 2008; Cebrian et al., 2010).
Each of these antibiotics produced by one species has been shown to have biocidal effects
on certain strains of the other two species.
To identify or eliminate possible effects of bacteriocins among the strains of our
experimental model, a simple growth inhibition test was performed based on the method
used by Fleming and colleagues (Fleming et al., 1975). In this test, aliquots of E. coli
MG1655 or G1 strains were spotted onto lawns of K. pneumoniae or E. faecalis, or vice
versa (refer to Section 6.4.6) . A clear halo around the spotted strain, showing inhibition
of growth of the test strain in the lawn, would indicate antibiotic production by the
spotted strain which is effective against the test strain. The strains in the list shown below
were tested as both spot (for antimicrobial production) and lawn (for antimicrobial
susceptibility) and no growth inhibition was observed in any of the combinations (data
not shown).

66
List 1. Antimicrobial activity test between E. coli and its partner species.
MG1655 G1
MG1655ompR234 G1ompR234
MG1655ompR G1ompR
K. pneumoniae G1ompR234csgA
E. faecalis
Hence the relationship of the strains of E. coli, K. pnuemoniae and E. faecalis which we
would study is independent of antibiotics-based growth inhibition. As interactions among
intestinal commensals are likely to be more moderate than extreme in nature, we hope
that our study using this combination of strains will be more biologically relevant than
those that were focused on antibiotics production (Gillor et al., 2008).
4.3 Influence of curli on population relationship
The Singapore laboratory has previously reported the dual- and multi-species population
relationship of the wild type E. coli MG1655 (and its GFP-expressing derivative strain
G1) with K. pneumoniae NCTC 9633 and/or E. faecalis OG1RF in rich media BHI at
37°C (Miao et al., 2009). Since in the natural intestinal environment, one of the
consequences of mucin’s presence is the induction of curli synthesis in certain strains of
E. coli (as shown in Chapter 3), we were interested to see the possible impact of curli
expression on the inter-species interaction between E. coli and its commensal partners.
Although the most often reported mode of bacterial cell-cell interaction is quorum
sensing (QS), which involves secreting and sensing signalling molecules such as n-acyl
homoserine lactones, peptides and furanones (Balestrino et al., 2005; Brenner et al., 2007;
Federle, 2009; De Araujo et al., 2010; Lopez et al., 2010; Dickschat, 2010), the physical
interactions between cells are recognized to be important for bacterial co-metabolism and
cooperative association, especially in the biofilm context (Drago et al., 1997;
Kolenbrander, 2000; Foster et al., 2003; Ledder et al., 2008). By replacing co-cultured
strains with their cell-free culture supernatant, it has been possible to demonstrate that
synergistic influences depend on both extracellular secreted factors and species-specific

67
physical interactions (Burmolle et al., 2006). Furthermore, contact-dependent growth
inhibition has been reported in E. coli strains (Aoki et al., 2005), underscoring the idea
that physical contacts between cells play significant biological roles. Therefore,
adherence structures on the cell surface such as curli which can alter the surface property
of the cell may influence the outcome of both intra-species and inter-species interactions.
The population relationship between E. coli and its partner species, K. pneumoniae and E.
faecalis were therefore examined with respect to E. coli’s curli expression status.
However, prior to the population analysis, I set out to obtain two sets of reference
parameters that could be used to qualify the differences in the surface properties of these
strains.
4.3.1 The surface property of the mutants
The initial attachment of bacteria to biotic or abiotic surfaces is the result of the
interplays of various fundamental physico-chemical forces (van Oss, 2003). For example,
van der Waals forces (McCarthy & McKay, 2004), electrostatic and Lewis acid–base
interactions (van Loosdrecht et al., 1987), hydration forces, hydration pressure, hydrogen
bonding, as well as hydrophobic associations have all been reported to influence bacterial
adhesion (Camesano & Abu-Lail, 2002; Abu-Lail & Camesano, 2003). Since most
naturally occurring surfaces carry a net negative charge under physiological conditions,
bacterial cells which are generally negatively charged on their surfaces need to overcome
this electrostatic repulsion, through the compounded effects of attractive van der Waals,
hydrophobic and specific interactive forces, in order to achieve adherence (van Merode et
al., 2006). It has been shown that curli production in some E. coli O157 strains correlated
with decreased hydrophobicity and showed higher attachment to hydrophilic glass
surface (Goulter et al., 2010). To obtain a perspective of the cell surface charges with
respect to curli expression under our experimental conditions, the zeta potentials of E.
coli strains with different curli expression status were measured (Section 4.3.1.1)
Other than physico-chemical forces, structures such as pili, curli and flagella which are
protruding from cell surfaces will have effects at the physical and steric level. First and
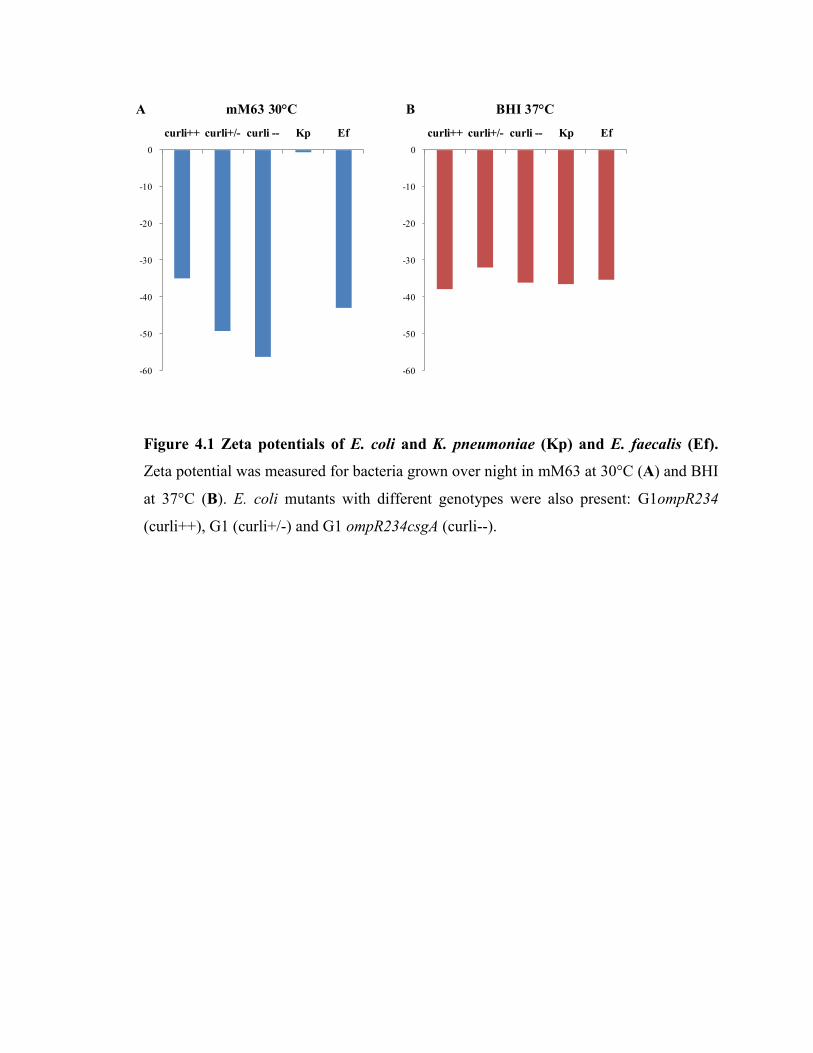
Figure 4.1 Zeta potentials of E. coli and K. pneumoniae (Kp) and E. faecalis (Ef).
Zeta potential was measured for bacteria grown over night in mM63 at 30°C (A) and BHI
at 37°C (B). E. coli mutants with different genotypes were also present: G1ompR234
(curli++), G1 (curli+/-) and G1 ompR234csgA (curli--).
-60
-50
-40
-30
-20
-10
0
curli++ curli+/- curli -- Kp Ef
-60
-50
-40
-30
-20
-10
0
curli++ curli+/- curli -- Kp Ef
A mM63 30 C BHI 37 CB

68
foremost, packing and compaction patterns of cells in a cluster or microcolony will be
affected. Hence one can imagine that population relationship may be influenced due to
the altered “packing” of cells of different species, especially in biofilms. The physical
nature of the cell surfaces will also affect the stability of random cell-cell association in a
planktonic setting, e.g. whether the cells will “bounce off” each other more readily or will
be “sticky” when they collide in fluids. Although steric properties are difficult to quantify
directly, the light scattering properties of cells can be used as an indirect indicator of
physical surface complexity. For this reason, FACS would be used to capture side- and
forward- light scattering profiles of E. coli cells differing in curli expression to obtain
reference paremeters reflecting such physical characteristics (Section 4.3.1.2). Unlike
zeta potential measurement which provides an averaged value for the whole population,
parameters detected by FACS are captured at single-cell level, giving an extra dimension
of information.
4.3.1.1 Electronegativity decreases with increasing curli expression
In fluid dynamics, the zeta potential is used to describe the colloidal nature of particles in
solvents. However, to facilitate discussions in the biological context here, we may view it
simplistically as the “surface electronegativity” of bacterial cells. The zeta potentials of E.
coli strains with different curli expression profiles: curli++ (G1ompR234), curli+/- (G1)
and curli-- (G1 ompR234csgA), as well as the two partner species, K. pneumoniae and E.
faecalis, were measured. When grown under conditions favouring curli expression (in
mM63 at 30°C), the curli++ E. coli strain was observed to have the lowest absolute zeta
potential, that is, the lowest electronegativity, whereas the curli-- strain exhibited the
highest electronegativity (Figure 4.1 A). In contrast, under rich medium (BHI) condition
at 37°C where curli expression is very limited even for the curli++ strain (G1ompR234),
the electronegativity of the three strains is similar (Figure 4.1 B). This suggests that
increased curli expression plays a role in decreasing cell surface electronegativity, which
may translate to lower electrostatic repulsion, both for cell-cell as well as cell-surface
association. Therefore, one of the ways in which curli expression facilitate aggregation

Figure 4.2 The FSC (forward scatter) and SSC (side scatter) profile of E. coli strains
varying in curli expression level. E. coli strains were cultured overnight in mM63 at 30°C (left
column) or BHI at 37°C (right column). In curli permissive condition (mM63 at 30°C), curli
over-expressing strain G1ompR234 harbours subpopulation of greater FSC and SSC values,
displayed as a “tail” and gated within a polygon in red (C). Closer look at the wild type G1 also
revealed a very small subpopulation falling within the “tail” region, also indicated with a red
polygon (B). In BHI (37°C), the curli--, curli+/- and curli++ E. coli strains showed similar
profiles. Null mutation in the ompR gene resulted in greater cell size than the other E. coli strains.
G1ompR234csgA
G1
G1ompR234
G1ompR
mM63 30 C BHI 37 C
A
2.14%
13.31%
B
C
D
E
F
G
H

69
between cells and cell attachment to surface in a M63-based environment may be through
this property.
K. pneumoniae and E. faecalis grown in mM63 at 30°C showed very different zeta
potentials, with K. pneumoniae exhibiting a drastic reduction in electronegativity.
However, when grown in BHI 37°C, their surface electronegativity does not appear to
differ much from each other or from the E. coli strains.
The data above affirmed that the strains’ surface property as indicated by zeta potentials
are sufficiently altered (i) due to curli expression of E. coli and (ii) between the differing
culture conditions, as well as (iii) between K. pneumoniae and E. faecalis. Hence it will
be worthwhile to see if these surface variations under different culture conditions could
influence the population relationship between E. coli, K. pneumoniae and E. faecalis, and
in what ways.
4.3.1.2 Distinct size and surface profiles of curli-related mutants by FACS analysis
The alteration in physical surface property with respect to curli expression was also
captured, using FACS. The curli-related E. coli G1 mutants were grown over night as
planktonic cultures both in the low osmolarity curli-inducing condition of mM63 at 30°C,
and the high osmolarity BHI medium at 37°C. Figure 4.2 shows plots from such analysis
whereby the x-axis indicates the forward scatter (FSC) reflecting cell or particle size, and
the y-axis indicates the side scatter (SSC), reflecting the surface complexity of bacterial
cells. In the curli permissive condition mM63 at 30°C, the curli++ (G1ompR234) strain
which over expresses curli showed a distinct FSC-SSC profile from the curli--
(G1ompR234csgA) strain: a “tail” sector (Figure 4.2 C, red polygon) indicating a
subpopulation (13.31%) of bigger cell size and greater light scattering. This seems
consistent with its high curli production status since it is expected that curli-producing
cells would have the curli fibres protruding from the cell surface and perhaps also
wrapping around the cells, which would manifest as higher SSC due to greater light
scattering. Curli-producing cells also tend to be bulkier due to the curli layers, and may
also form cell aggregates, both of which could be detected as larger FSC. In support of

Figure 4.3 The FSC (forward scatter) and SSC (side scatter) profile of E. coli
G1ompR234 along the growth. The profile of the curli++ E. coli strains was monitored
at 3, 6, 9 and 24 hours of growth in both mM63 (30°C) and BHI (37°C). While little
changes in FACS profiles was observed along the growth in curli repressing condition
(right column, BHI at 37°C), development of the “tail” can be seen along the growth in
mM63 at 30°C (left column).
3h
6h
9h
24h
mM63 30 C BHI 37 C

70
this interpretation, both the curli-- and curli++ E. coli strains were cultured in BHI at
37°C, where curli expression is generally repressed, and they both showed FSC/SSC
profiles lacking the “tail” sector (Figure 4.2 E & G).
Samples of the curli++ strain in both mM63 (30°C) and BHI (37°C) were also taken at 3,
6, 9 and 24 hours of growth to be analysed by FACS (Figure 4.2 B). In mM63 (30°C), the
profiles reveal that the “tail” only starts to form at 6 hours of culture and becomes more
and more prominent (Figure 4.3 “mM63 30°C” column). This observation is in
agreement with the fact that curli is not produced in the exponential phase but only when
cells enter the stationary phase (Olsen et al., 1993). When cultured in BHI (37°C) where
curli expression is repressed, E. coli can be observed to exhibit fairly unchanging profiles
at different growth phases (Figure 4.3 “BHI 37°C” column).
Incidentally, a more thorough examination of the profiles of the curli +/- (G1) strain
(which is not completely null in curli production) revealed a very small subpopulation
(2.14%) corresponding to the “tail” region of the curli ++ strain (Fig 4.2 B, red polygon).
Hence the “intermediate” curli expression level associated with this strain (Vidal et al.,
1998) is due to a small subpopulation of curli-expressing cells, and not a result of an
intermediate expression of curli by the entire population of cells.
Out of curiosity, I also checked the FACS profile of the curli- (G1ompR) strain with the
null mutation at the regulatory level of curli synthesis. The FSC/SSC profile shows no
“tail”, suggesting that curli is not present (Fig 4.2 D), similarly to other non-curli-
expressing strains. However, it appears that the G1ompR cells are generally bigger than
the other E. coli strains (refer position on the FSC scale). Since the osmolarity- and pH-
induced global regulator OmpR is not only involved in curli regulation, but also in porin
regulation (Pratt et al., 1996) and other physiological functions, this increase in cell size
in our experimental condition may be due to factors related to these functions .
Having affirmed that the expression of curli on E. coli indeed translates to detectable
physical properties, which may influence the interaction between cells of the same and/or
different species, I went on to explore the growth relationship between E. coli and its
commensal partner species K. pneumoniae and E. faecalis.
71
4.3.2 The population relationship of E. coli with K. pneumoniae and E.
faecalis
In the study of population relationship between E. coli and its commensal partner K.
pneumoniae and E. faecalis, the curli over-expressing E. coli strain G1ompR234 (curli++)
and the curli null mutant G1ompR234csgA (curli--) were analysed in parallel to the wild
type G1 strain (curli+/-) to examine how the range of curli expression influences inter-
species interactions that may lead to changes in population relationship. Since E. coli can
survive both in the flux of nutrient rich, high osmolarity conditions in the human gut and
in the nutritionally poor, low osmolarity conditions outside the host, and these contrasting
conditions affect its curli expression level, the population relationship were examined in
both BHI (37°C) and mM63 (30°C), and in the planktonic and the biofilm states.
The population relationship was analysed by comparing the population of partner species
in two ways: (i) between pure culture and dual-species (E. coli with either K. pneumoniae
or E. faecalis) or multi-species (all three species together) co-cultures, which provides
information about the influence of the partner species on the growth of the species of
interest and (ii) between the relative population proportions of each species in co-cultures,
which reveals the dominance relationship between partner species.
To determine whether a difference (or a change) in the population was significant
between a pair of data sets, the p-value was calculated using Student’s t-Test and the
difference was considered significant when the value of p < 0.05. For multiple
comparisons, Bonferroni correction was applied. Only significant differences will be
highlighted and considered in the discussion.
4.3.2.1 In planktonic culture
We were first interested to know how the growth (viable cell count) of one commensal
species was affected by the presence of another species. Therefore, dual- and multi-
species co-cultures were compared with controls of single species cultures which carried

Figure 4.4 The influence of partner species on E. coli, K. pneumoniae and E. faecalis in
planktonic co-cultures. The influence was investigated in both BHI (37°C) (first row) and
curli permissive condition mM63 (30°C) (second row). Absolute CFU/ml values were plotted
in order to compare the growth of one species in pure culture (blue bars) with that in co-culture
(other colored bars). Curli expression-related mutants of E. coli were compared: G1ompR234
curli++ (ompR234) and G1ompR234csgA curli--(ompR234csgA), along with the wild type
strain G1. The boxes indicate the species for which the cell density is presented in the plot. At
least three independent experiments were performed. Data shown are mean ± SD of triplicate
samples. Student’s t-Test was performed to determine whether the differences were statistically
significant.
1.00E+04
1.00E+05
1.00E+06
1.00E+07
1.00E+08
1.00E+09
1.00E+10
G1 ompR234 ΔcsgA
pure culture Ec+Kp Ec+Ef Ec+Kp+Ef
G1 ompR234 ΔcsgA G1 ompR234 ΔcsgA
1.00E+04
1.00E+05
1.00E+06
1.00E+07
1.00E+08
1.00E+09
1.00E+10
G1 ompR234 ΔcsgA G1 ompR234 ΔcsgA G1 ompR234 ΔcsgA
BHI
37 C
mM63
30 C
K. pneumoniaeE. coli E. faecalis
A B C
D E F
G1 ompR234 ompR234csgA G1 ompR234 ompR234csgA
G1 ompR234 ompR234csgA
G1 ompR234 ompR234csgA
G1 ompR234 ompR234csgAG1 ompR234 ompR234csgA

72
starting cell densities identical to that of each of the component species in the co-cultures.
This combination was executed for all three E. coli strains varying in curli-expression
status. After 24 hours, CFU count was performed for every species in co-cultures as well
as in pure cultures, and the absolute CFU/ml of each species were determined for
comparison (Figure 4.4). When cultured in BHI (37°C), all three E. coli strains and both
partner species showed lower growth in co-culture than in pure culture (Figure 4.4 A, B
and C, compare blue bar against other bars within each block). However, the situation is
different in mM63 (30°C): (i) although E. coli still showed better growth in pure culture
than in co-cultures (Figure 4.4 D), (ii) K. pneumoniae did not seem to be influenced by
the presence of G1 or the curli++ mutant E. coli (G1ompR234) (Figure 4.4 E, compare
blue against red bars of the respective E. coli strains). Nevertheless, it did display
significantly lower growth when co-cultured with the curli-- mutant (G1ompR234csgA).
When E. faecalis was also present in the co-culture i.e. in multi-species culture (purple
bar), this negative effect on K. pneumoniae by E. coli G1ompR234csgA was abolished
(compare red and purple bars for the “ompR234csgA” block). (iii) E. faecalis did not
appear to be significantly influenced when co-cultured with the curli+/- and curli++ E.
coli (Figure 4.4 F) but grew better in the presence of E. coli curli-- G1ompR234csgA
mutant, in dual-species co-culture (compare blue and green bars) as well as in multi-
species co-culture (compare blue and purple bars).
We note that in three-species co-cultures, the influence of the third member is generally
neutral or mildly cumulative in BHI medium (Figures 4.3 A, B, C, compare purple bars
against red and green bars). In M63 medium, this observation also applies, with the
exception of (i) the negative influence on E. coli G1ompR234 and G1ompR234csgA
strains by K. pneumoniae (Figure 4.4 D, compare blue against red bars of “ompR234”
and “ompR234csgA” blocks), which was considerably alleviated by the presence of E.
faecalis (purple bars), (ii) the negative influence on K. pneumoniae by E. coli curli- strain
(Figure 4.3 E, compare blue against red bars for the “ompR234csgA” block), which was
abolished in the presence of E. faecalis (purple bar) and (iii) the positive influence on E.
faecalis by curli- E. coli (Figure 4.3 F, compare blue and green bars of “ompR234csgA”
block), which was dampened in the presence of K. pneumoniae (purple bar). The

73
complexity involved in these phenomena will be difficult to unravel with this study, but
will certainly be of interest to pursue in the future (Section 5.3).
The observation in BHI (37°C), whereby E. coli and the partner species seem to interact
in an antagonistic or competitive manner (Figure 4.4 A, B and C), is fairly easy to
rationalize. In co-cultures, the inoculation cell density of each species was kept constant,
hence the total starting bacteria number in a dual- or multi-species culture is two or three
times of that in the single species culture respectively, and competition for nutrients
under higher overall cell density can be expected. However, surprisingly, this overall
trend of negative influence was not observed in nutrient-limited mM63 (30°C) situation,
which instead, showed varied influences including neutral or even positive ones.
Intuitively, we would imagine that a more drastic competition would occur in mM63 due
to its greater nutrient limitation. However, if we consider the fact that differential curli
expression and variation in surface properties between the three E. coli strains are more
pronounced under the mM63 than the BHI condition (refer sections 4.3.1.1 and 4.3.1.2),
it becomes apparent that there are more factors at play in interspecies interactions than
competition for nutrients. I will therefore attempt to discuss the data with curli expression
in perspective, in the following section.
4.3.2.1.1 Curli’s influence on bacteria growth in co-culture
From Figure 4.4 D we can see that although K. pneumoniae and E. faecalis both exert
negative effects on the growth of E. coli (compare blue against red and green bars within
each block), the influence of K. pneumoniae is more prominent than E. faecalis (compare
red against green bars). When we compare the effects on G1ompR234 against its csgA
derivative, we see that K. pneumoniae’s negative influence is especially drastic when E.
coli cannot produce curli (compare red bars between “ompR234” and “ompR234csgA”).
Since the two E. coli strains are genetically identical except for the null mutation of the
curlin structural gene csgA, this observation suggests that curli’s presence may serve to
counteract some of K. pneumoniae’s antagonistic effect on E. coli.
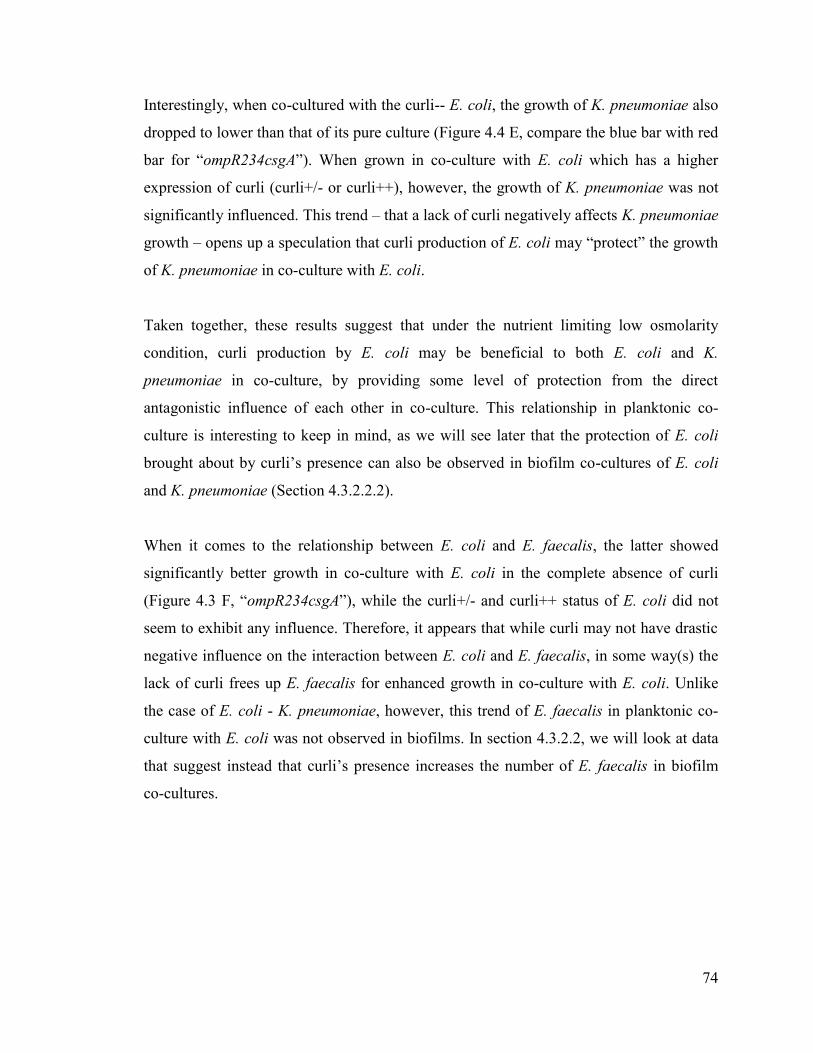
74
Interestingly, when co-cultured with the curli-- E. coli, the growth of K. pneumoniae also
dropped to lower than that of its pure culture (Figure 4.4 E, compare the blue bar with red
bar for “ompR234csgA”). When grown in co-culture with E. coli which has a higher
expression of curli (curli+/- or curli++), however, the growth of K. pneumoniae was not
significantly influenced. This trend – that a lack of curli negatively affects K. pneumoniae
growth – opens up a speculation that curli production of E. coli may “protect” the growth
of K. pneumoniae in co-culture with E. coli.
Taken together, these results suggest that under the nutrient limiting low osmolarity
condition, curli production by E. coli may be beneficial to both E. coli and K.
pneumoniae in co-culture, by providing some level of protection from the direct
antagonistic influence of each other in co-culture. This relationship in planktonic co-
culture is interesting to keep in mind, as we will see later that the protection of E. coli
brought about by curli’s presence can also be observed in biofilm co-cultures of E. coli
and K. pneumoniae (Section 4.3.2.2.2).
When it comes to the relationship between E. coli and E. faecalis, the latter showed
significantly better growth in co-culture with E. coli in the complete absence of curli
(Figure 4.3 F, “ompR234csgA”), while the curli+/- and curli++ status of E. coli did not
seem to exhibit any influence. Therefore, it appears that while curli may not have drastic
negative influence on the interaction between E. coli and E. faecalis, in some way(s) the
lack of curli frees up E. faecalis for enhanced growth in co-culture with E. coli. Unlike
the case of E. coli - K. pneumoniae, however, this trend of E. faecalis in planktonic co-
culture with E. coli was not observed in biofilms. In section 4.3.2.2, we will look at data
that suggest instead that curli’s presence increases the number of E. faecalis in biofilm
co-cultures.

Figure 4.5 The population percentage of E. coli (Ec), K. pneumoniae (Kp) and E.
faecalis (Ef) when co-cultured in planktonic condition. Data from Figure 4.4 are
presented as population percentages here. The upper row shows their population
relationship in BHI (37°C) and the lower in mM63 (30°C). The boxes in the middle
indicate the genotype of E. coli and their curli expression status in mM63 (30°C). The
broken lines separate different E. coli mutants.
BHI
37 C
mM63
30 C
G1ompR234
curli++
G1
curli+/-
G1ompR234csgA
curli--
A B C
D E F
0%
20%
40%
60%
80%
100%
Ec+Kp Ec+Ef Ec+Kp+Ef Ec+Kp Ec+Ef Ec+Kp+Ef Ec+Kp Ec+Ef Ec+Kp+Ef
Ef
Kp
Ec
0%
20%
40%
60%
80%
100%
Ec+Kp Ec+Ef Ec+Kp+Ef Ec+Kp Ec+Ef Ec+Kp+Ef Ec+Kp Ec+Ef Ec+Kp+Ef

75
4.3.2.1.2 Curli’s influence on population dominance status within planktonic co-
cultures
So far we have discussed the influence of one bacteria species on the growth of another
species in planktonic culture, and the impact of E. coli curli production on this influence
by comparing between growth in one species’ pure culture against the co-cultures.
However, in a bacterial co-culture, the interplay of various factors – such as differences
in growth rate, metabolism, physiology as well as the influence from the partner species
and the environment (Christensen et al., 2002; Komlos et al., 2005; Hansen et al., 2007;
Kolenbrander et al., 2010) – may also lead to changes in the majority or minority status
of the species involved. While the analysis in the last section (4.3.2.1.1) using absolute
cell counts may reveal how the growth of one species is quantitatively influenced by the
partner species, it cannot provide us with the gross perspective regarding their relative
occupancy in the co-cultures. We would not immediately know if one species has grown
into dominance when co-cultured with a second species, or if it has become the minority
in co-culture with a third species. For example, the negative influence of curli null
mutation on the growth of E. coli and K. pneumoniae that was highlighted in the last
section may equally likely present two scenarios: (i) a change in dominance of E. coli in
co-culture with K. pneumoniae, or (ii) no effect on their dominance relationship with only
proportionate decreases by both species in the total cell number. Therefore, it is necessary
to examine the proportion of each population relative to the whole co-culture, for a fuller
picture of their inter-relationship.
In Figure 4.5, the population percentage of co-cultured species in planktonic culture is
plotted. Several observations can be made: (i) In BHI (37°C), K. pneumoniae grow into
dominance when co-cultured with E. coli and is not influenced by the curli-related
mutations in E. coli (Figure 4.5 A, B and C, “Ec+Kp”). The dominance relationship
between the two species being invariable among different E. coli curli-related mutant is
not surprising since the difference in curli production is very minimal among the three E.
coli strains in this condition (refer to Section 4.3.1.2). The domination trend of K.
pneumoniae is also observed in mM63 (30°C), the condition under which curli
expression is induced (Figure 4.5 D, E and F, “Ec+Kp”). In fact, it showed greater

76
dominance in this condition compared to the BHI condition (compare “Ec+Kp” of Figure
4.5 A against D, B against E). Interestingly, when curli is not produced (curli--), E. coli
grows to a higher proportion in the E. coli-K. pneumoniae co-culture (Figure 4.5 F), i.e. K.
pnuemoniae dominance decreases. In planktonic co-culture, dominance of one species
over the other has often been attributed as the result of competition between partner
species, and could usually be predicted by the growth rate of the various species (Komlos
et al., 2005). I checked this explanation with regards to the dominance of K. pneumoniae
over E. coli in our system: In BHI (37°C), the generation time (refer that shown in Figure
2.1) of E. coli G1 is 41.7±1.6 minutes and 35.3±0.1 minutes for K. pneumoniae. The
ompR234 mutation does not significantly influence the growth rate of E. coli, with a
generation time of 40.1±0.2 minutes. In mM63 (30°C), the growth rate difference
between E. coli and K. pneumoniae is greater (168.4±0.5, 177.5±1.4 and 104.0±1.3
minutes for E. coli G1, G1ompR234 and K. pneumoniae respectively). These values
correlate well with our observation of higher dominance of K. pneumoniae under this
condition. In the low osmolarity condition of mM63 (30°C), curli expression induced in
the curli++ E. coli probably results in higher energy cost to the cell and hence longer
generation time. Therefore, when curli synthesis is inhibited (G1ompR234csgA), it is
possible that the reduced energy cost increases the growth rate of this E. coli strain,
allowing it to compete better against K. pneumoniae, thus altering the degree of
dominance. As discussed in the last section (4.3.2.1.1), curli’s presence may provide
protection to both species from each other’s antagonistic effect. Although curli’s presence
appeared to be protective towards both species, the combined effect of growth rate and
antagonism may somehow have rendered K. pneumonia more sensitive to the lack of
“protection” by curli.
(ii) When co-cultured with E. faecalis, E. coli G1 becomes the dominant partner in both
culture conditions (Figure 4.5 A and D, “Ec+Ef”). However, unlike E. coli - K.
pneumoniae relationship, this dominance does not seem to have originated from their
difference in growth rate: The generation time of E. coli and E. faecalis is similar in BHI
(37°C) (41.7 ± 1.6 minutes for E. coli and 42.8 ± 0.2 for E. faecalis), whereas in mM63
(30°C), E. coli even has a slightly longer generation time (168.4 ± 0.5 minutes) than that

77
of E. faecalis (152.6 ± 10.3 minutes). In addition, curli expression does not appear to
affect their dominance status (compare “Ec+Ef” of Figure 4.5 D, E and F). However,
when cultured in BHI (37°C), the ompR234 mutation seems to allow an increase in the
proportion of E. faecalis in co-culture with E. coli compared to its wild type background
(compare “Ec+Ef” of Figure 4.5 A against B and C), leading to E. faecalis dominance.
This effect is even more striking when all three species are cultured together (“Ec+Kp+Ef”
of Figure 4.5 A against B and C). Therefore, factor(s) other than curli expression, which
is/are related to the ompR234 genetic background, may be responsible for the dominance
of population in BHI. For example, the ompR234 mutation in E. coli may have triggered
changes in its expression of signalling molecules that could be sensed by E. faecalis,
resulting in its higher competitiveness. In mM63, although the dominance status of E.
coli over E. faecalis remained regardless of its curli expression status (“Ec+Ef” of Figure
4.5 D, E and F), the degree of E. coli dominance appears to decrease as curli expression
increases (from Fig 4.4 F -> D -> E). Hence curli seems to have positive effect on E.
faecalis in terms of its co-existence with E. coli.
4.3.2.2 In biofilm
In the previous section we have examined the inter-species interactions in planktonic
state, which deals with the average cell density of the bacterial species in suspension in
fluids (culture media). In the most natural form of bacterial existence, biofilm, where
surface attachment of the bacteria is the distinguishing feature, the interactions can be
completely different from that in the planktonic setting. For example, Klayman and
colleagues has observed that although E. coli O157:H7 grew 50% faster than P.
aeruginosa PAO1 in batch cultures, P. aeruginosa developed biofilm faster in flow cells
with approximately 100 times the biomass of E. coli. They showed that E. coli alone
could not attach irreversibly to glass surface to initiate biofilm development on its own,
but could form biofilm when P. aeruginosa was introduced. In this dual-species biofilm,
attached E. coli cells were in fact associated with P. aeruginosa cells instead of directly
with the surface (Klayman et al., 2009).

Figure 4.6 The influence of partner species on E. coli, K. pneumoniae, and E. faecalis in
biofilm co-cultures. The influence was investigated in both BHI (37°C) (first row) and curli
permissive condition mM63 (30°C) (second row). In BHI (37°C) biofilms are formed at the
air-medium interface with 2% mucin supplemented in the medium while in mM63 (30°C) the
biofilms are totally immersed. Absolute CFU/ml values were plotted in order to compare the
growth of one species in pure culture (blue bars) with that in co-culture (other colored bars).
Curli expression-related mutants of E. coli were compared: G1ompR234 curli++ (ompR234)
and G1ompR234csgA curli--(ompR234csgA), along with the wild type strain G1. The boxes
indicate the species for which the cell density is presented in the plot. At least three
independent experiments were performed. Data shown are mean ± SD of triplicate samples.
Student’s t-Test was performed to determine whether the differences were statistically
significant.
1.00E+04
1.00E+05
1.00E+06
1.00E+07
1.00E+08
1.00E+09
1.00E+10
G1 ompR234 ΔcsgA
pure culture Ec+Kp Ec+Ef Ec+Kp+Ef
G1 ompR234 ΔcsgA G1 ompR234 ΔcsgA
1.00E+04
1.00E+05
1.00E+06
1.00E+07
1.00E+08
1.00E+09
1.00E+10
1.00E+11
G1 ompR234 ΔcsgA G1 ompR234 ΔcsgA G1 ompR234 ΔcsgA
BHI
37 C
mM63
30 C
K. pneumoniaeE. coli E. faecalis
A B C
D E F
G1 ompR234 ompR234csgA
G1 ompR234 ompR234csgA
G1 ompR234 ompR234csgA
G1 ompR234 ompR234csgA
G1 ompR234 ompR234csgA
G1 ompR234 ompR234csgA

78
In this thesis, the population relationship of the three commensals in biofilm co-cultures
was also analysed and presented in the two formats (Figures 4.6 and 4.7) as shown for the
planktonic co-cultures (Figures 4.4 and 4.5). However, since biofilms have been collected
from a fixed surface area (refer to Chapter 6 Materials and Methods for details), the
absolute CFU/ml analysis method allows an estimation of the surface attached cell
number, instead of average cell density in suspension as in planktonic cultures. Thus
changes in surface attached biomass, in addition to the growth of one species under the
influence of its partner species in biofilm, would be reflected. The analysis of relative
population percentage, on the other hand, provides a snapshot of the biofilm’s
composition as a result of growth and interaction between the co-cultured species.
4.3.2.2.1 Growth on the surface
When co-cultured in BHI (37°C), K. pneumoniae in biofilms displayed antagonistic
effect on all strains of E. coli (Figure 4.6 A, compare blue and red bars within each block)
just as observed in the planktonic counterparts (Figure 4.4 A). The degree of negative
influence on the three E. coli strains differs (ompR234csgA > ompR234 > G1). Since we
know from several lines of evidence (section 4.3.1.1 & 4.3.1.2) that the curli expression
status of these three strains are similar under the BHI (37°C) condition, the difference is
most probably conferred by other unknown factors. On the other hand, the influence of E.
coli on K. pneunomiae (Figure 4.6 B), seems to be governed by the genotype of ompR:
while the wild type E. coli G1 exhibited statistically significant negative influence, the
ompR234 mutation of E. coli removed this negative influence on K. pneumoniae (Figure
4.6 B, compare the blue and red bars of “G1” against “ompR234” and “ompR234csgA”).
Under the mM63 condition, the K. pneumoniae influence on E. coli was also negative
across all three E. coli strains (Figure 4.6 D, compare blue and red bars within each
block). We further noted that in general, the additional presence of E. faecalis in multi-
species biofilms (purple bars) does not alleviate the negative effect of K. pneumoniae in
both culture conditions (Figures 4.6 A and D). As for E. coli influence on K. pneumoniae,
regardless of their differing curli-expressing status under the mM63 condition, E. coli
strains do not affect the growth of K. pneumoniae in biofilm co-cultures (Figure 4.6 E).

79
For E. coli – E. faecalis co-culture biofilms, under the BHI (37°C) condition, E. coli
strains do not appear to be affected by E. faecalis (Figure 4.5 A, compare blue against
green bars within each block). However, the positive effect of the ompR234 mutation in E.
coli on the growth of E. faecalis is hard to miss (compare the blue and green bars of “G1”
group against those of “ompR234” and “ompR234csgA” in Figure 4.6 C). This synergistic
effect is also exhibited by the ompR234 strain under the mM63 (30°C) condition (Figure
4.6 D and F, blue and green bars of “ompR234”). While the synergistic effect seems to be
caused by ompR234 mutation without the involvement of curli in BHI (37°C), the
synergistic effect in mM63 (30°C) was solely observed for the curli++ E. coli
G1ompR234 strain (approximately 16- and 14-fold increase for E. coli and E. faecalis
populations respectively, Figure 4.6 D and F) and may therefore be curli-mediated.
Consistent to that notion, co-culturing with the curli-- mutant E. coli G1ompR234csgA
showed dramatically decreased growth of both E. coli and E. faecalis. This is in contrast
to the planktonic co-culture situation whereby growth with curli- E. coli enhanced the
growth of E. faecalis (discussed in Section 4.3.2.1.1). By direct visual assessment of
biofilms formed on glass slides, we have observed that in mM63 (30°C), E. faecalis is a
poor biofilm former (data not shown). Since E. coli G1ompR234 is an excellent biofilm
former, it is possible that the synergistic relationship between E. coli G1ompR234 and E.
faecalis in biofilm is due to the biofilm-enhancing role of curli.
Synergistic relationship in dual-species biofilm formation has been reported previously in
other experimental models, such as between Listeria monocytogenes and P. putida
(Hassan et al., 2004) and between E. coli and P. putida (Castonguay et al., 2006). The
synergistic effect appears to be species-specific in the experiments of Castonguay and co-
workers as no such relationship between S. epidermidis and E. coli was observed. They
also demonstrated that direct cell–cell contact may be necessary for biofilm stimulation
by E. coli (Castonguay et al., 2006). Therefore, in the case of synergistic relationship
between curli-expressing E. coli and E. faecalis in biofilm, curli may not only promote
biofilm formation by mediating E. coli attachment to surface, but also by increasing the
coaggregation with E. faecalis, bringing more E. faecalis to settle in the growing biofilm.

Figure 4.7 The population percentage of E. coli (Ec), K. pneumoniae (Kp) and E.
faecalis (Ef) when co-cultured in biofilm. Data from Figure 4.6 are presented as
population percentage here. The upper row shows their population relationship in BHI
(37°C) and the lower in mM63 (30°C). The boxes in the middle indicate the genotype of
E. coli and their curli expression status in mM63 (30°C). The broken lines separate
different E. coli mutants.
BHI
37 C
G1ompR234
curli++
G1
curli+/-
G1ompR234csgA
curli--
mM63
30 C
A B C
D E F
0%
20%
40%
60%
80%
100%
Ec+Kp Ec+Ef Ec+Kp+Ef Ec+Kp Ec+Ef Ec+Kp+Ef Ec+Kp Ec+Ef Ec+Kp+Ef
Ef
Kp
Ec
0%
20%
40%
60%
80%
100%
Ec+Kp Ec+Ef Ec+Kp+Ef Ec+Kp Ec+Ef Ec+Kp+Ef Ec+Kp Ec+Ef Ec+Kp+Ef

80
4.3.2.2.2 Population dominance status within biofilm co-cultures
In biofilm, the dominance of K. pneumoniae over E. coli in both growth conditions,
which we have already observed in the corresponding planktonic co-cultures, is
conserved (Figure 4.7, “Ec+Kp”). However, unlike planktonic co-cultures, in mM63
(30°C), the expression of curli by G1ompR234 in biofilms appears to counteract the
dominance effect of K. pneumoniae (compare “Ec+Kp” of Figure 4.7 E against D and F),
increasing the population of E. coli from less than 10% for strains with less curli
production (Figure 4.7 D for E. coli curli+/- and Figure 4.7 F for curli-- mutant) to
approximately 30% of the total population (Figure 4.7 E). It could be that curli
production confers higher adherence to surface thus offering E. coli the advantage of
faster colonisation in competition with K. pneumoniae. It may also be possible that curli
production and/or the exhibition of curlin on E. coli cell surface is sensed by K.
pneumoniae, which changes its physiology in response, resulting in an altered population
relationship with E. coli.
Relating this back to the previous results, we could see that somehow curli expression
always has some influence on E. coli - K. pneumoniae interaction. For example, in
planktonic culture, curli expression seems to be important for the growth of E. coli in co-
culture with K. pneumoniae. Without curli, the antagonising effect of K. pneumoniae is
so strong that the growth of E. coli dropped by 1000 fold (discussed in Section 4.3.2.1,
Figure 4.4 D, compare blue and red bars of “ompR234csgA”). Surprisingly, while the null
mutation of curli structural gene resulted in such drastic decrease in the cell density of E.
coli in co-culture with K. pneumoniae, it increased E. coli’s population percentage
(Figure 4.5, Section 4.3.2.1.2). This occurs because the cell density of K. pneumoniae
also decreases when co-cultured with curli-defective E. coli (Figure 4.4 E
“ompR234csgA”). In biofilm co-cultures, we see the positive effect of curli in favour of E.
coli that affected K. pneumoniae dominance (compare “Ec+Kp” in Figure 4.7 E against D
and F). One speculation is that the presence of curli plays a signalling role to both E. coli
and K. pneumoniae, which affects the growth of both partners. I present this possibility
because it has been reported that microcin E492 secreted by K. pneumoniae could
assemble into amyloid fibrils (leading to loss of microcin activity) (Bieler et al., 2006),

81
suggesting it may possess mechanisms to sense the presence of this inactive form of
microcin E492. Hence although the K. pneumoniae strain used in this work does not
secret bacteriocins (Section 4.2), it may still have such sensing mechanisms. Since curli
belongs to the amyloid family, K. pneumoniae may be able to sense curli – as something
similar to the assembled microcin from its own kind, or alternatively, discern it as foreign
signalling molecules. In either case, K. pneumoniae could respond by increasing or
decreasing its own growth, with a consequence on the overall population relationship.
E. coli interacts considerably differently with E. faecalis in biofilm co-cultures compared
to planktonic ones. The dominance of E. coli over E. faecalis observed in mM63 (30°C)
in the planktonic condition (Figure 4.5 D, E, F, “Ec+Ef”) is replaced by almost equal
growth of both partners in biofilms, regardless of the E. coli strains’ curli-expression
status (Figure 4.7 D, E, F “Ec+Ef”). However, at the cell number level, we could see that
curli expression in fact resulted in increased biofilm cell number in both partners (Figure
4.5 D and F, “ompR234”, blue and green bars) while deletion of curli led to decreased
biofilm of both species (Figure 4.6 D and F, “ompR234csgA”, blue and green bars). Both
changes led to the similar net result of dominance patterns in co-cultures (Figure 4.7 D, E
and F). The equal growth of E. coli and E. faecalis in biofilm in mM63 (30°C) (Figure
4.6 D, E, F, “Ec+Ef”), as contrasted to the highly shifted equilibrium in BHI (37°C)
(Figure 4.7 A, B, C, “Ec+Ef”) shows that population relationship of commensal species
can shift greatly based on changes in environmental conditions. Hence we can perceive
that dietary changes of hosts will impact the microbiota equilibrium of intestinal
commensals.
4.4 Summary
In this Chapter, the relationship between E. coli and its commensal partners K.
pneumoniae and E. faecalis in dual- and multi-species culture were investigated. Their
relationship is not based on antiobiotics-mediated growth inhibition (Section 4.2). In
view of the altered surface property of curli-producing E. coli (Section 4.3.1), the
possible influence of curli on the inter-species interaction was examined in both
82
planktonic (Section 4.3.2.1) and biofilm (Section 4.3.2.2) conditions. Two comparison
methods were employed: (i) comparing the cell density of one species in pure culture
with that in co-cultures provides information about the influence of the partner species on
the growth of the species of interest and (ii) comparing between the relative population
proportions of co-cultured species reveals the dominance relationship between partner
species. Analysis based on the second method showed a general trend of dominance: K.
pneumoniae dominates over E. coli, while E. coli often exhibits dominance on E. faecalis.
In BHI (37°C) planktonic culture, co-cultured species mostly exhibit antagonistic
relationship (Figure 4.3 A, B and C). In the curli permissive condition mM63 (30°C),
curli expression appears to be important for the growth of both partners in E. coli - K.
pneumoniae co-culture. With the limited information on their interactions, we
hypothesize that curli may protect E. coli from the strong antagonistic effect of K.
pneumoniae, while curli fibre and/or curli subunit proteins may serve as signalling
molecules for K. pneumoniae. On the other hand, when comparing the relative population
proportion of E. coli - K. pneumoniae co-culture, the absence of curli seems to increase E.
coli’s proportion (or decrease K. pneumoniae’s proportion), implying that the loss of
curlin protein synthesis may have conferred lower energy cost, leading to higher fitness
of E. coli, and higher competitiveness against K. pneumoniae.
In biofilm co-culture, we have two main findings: (i) curli production of E. coli seems to
counteract the dominance of K. pneumoniae over E. coli, which may be the result of
increased fitness brought about by the presence of curli. (ii) curli production may
promote the synergistic relationship between E. coli and E. faecalis in biofilm, possibly
by increasing the coaggregation of E. coli with E. faecalis as E. coli attachment to surface
is facilitated by curli.
Due to the differing nature of cell-cell interactions in planktonic suspensions (random
collision of cells in moving fluids) and biofilms (cells are adherent and may attain close-
proximity to each other), the surface properties of cells may lead to different interactions
between the three species in the two modes of cultures. Based on my work, it can be seen
that the presence of curli on E. coli indeed has varying influence on E. coli interaction

83
with K. pneumoniae and E. faecalis in planktonic and biofilm modes. In addition,
although it may be at first assumed that because curli is produced by E. coli, it will serve
to benefit E. coli at the expense of the other two interacting species, my data clearly
showed that this is not always true. Depending on the situation, curli may in fact assist
the interacting species, and even alter the dominance status in favour of the non-E. coli
species at times.
Multi-species interactions in co-culture involve complex factors ranging from the
intrinsic physiological property of each partner species, the communications between
them to their distinct response to the external environment. Our current understanding of
inter-species interactions is still very limited and the study of their population provides
just one level of information. Further investigation on the influence of one species on the
gene expression of its partner species may help us to gain some insights on this, because
the manifestation of interactions ultimately boils down to the altered gene expression.

84
Chapter 5 Conclusions and perspectives
Commensal bacteria have lived in harmony with us since our birth, contributing to a
mutualistic relationship. However, much focus has been given to the interaction between
pathogen and the host historically. It is not until recently that the importance of
commensal-host interactions has come under the spotlight, pushing the scientific
community towards the commencement of the Human Microbiome Project (Qin et al.,
2010). Yet another important actor in these interactions, the local environment of the
commensals, has not been well addressed. In the intestine, commensal bacteria are in
direct contact with the mucus layer, which are complex mucin glycoproteins secreted by
the epithelial cells (Corfield et al., 2000). Mucins have been described to impact biofilm
development of many bacterial species but in different ways (Moniaux et al., 2001;
Corfield et al., 2001; Vieten et al., 2005); (Lievin-Le Moal & Servin, 2006), and have
been suggested to mediate biofilm formation by E. coli (Zhang et al., 2002); (Bollinger et
al., 2003); (Bollinger et al., 2006). However, the interaction between mucin and the
inhabiting bacteria is poorly investigated. In addition, the interaction between the
commensal microbiota species themselves has not been well addressed due to its complex
and highly diverse nature. Current methodologies have mostly been developed to meet
the demands of pure culture analysis, and may not be adequate to cover the demand of
studies involving more than one species.
These gaps in knowledge served as a motivation for me to target for my investigation, the
relation of E. coli – one of the most studied bacterial species and an intesintal commensal
– with the above-mentioned intestinal components: mucin, and commensal partners (K.
pneumoniae and E. faecalis). The common thread that runs through my study is curli: the
amyloid surface structure expressed by certain strains of E. coli, and known to have
adhesive, virulence-related and protective roles in E. coli’s life. My project has been
approached from three angles: the first undertaking aimed to develop and optimise new
experimental models and analytical tools that are better suited for the complexity of our
system. Once the models were established and the tools validated, I moved on to the
second aspect of the project, where the effect of mucin on E. coli biofilm formation was

85
investigated. The last part of this project concentrated on the inter-species interactions
between the commensal species E. coli, K. pneumoniae and E. faecalis through the study
of their population relationship with regards to curli’s expression status.
Through these studies I was able to derive these accomplishments:
1) The development and validation of experimental models and tools that permits (i)
tracking of E. coli within the multispecies context that constitute the human gut
commensals, (ii) surveying the expression of genes of interest in E. coli and (iii)
reliable co-culture and viability analysis of the three species under study.
2) The demonstration that low concentrations of mucin promotes biofilm formation by
inducing expressions of surface adhesion structures in E. coli K-12 strains such as
curli in the MG1655 background, and type 1 pili in the W3110 background.
3) The revelation that, due to the differing nature of cell-cell interactions in planktonic
suspensions (random collision of cells in moving fluids) and biofilms (cells are
adherent and may attain close-proximity to each other), the surface properties of cells
may lead to different interactions between the three species in the two modes of
cultures. I have shown in particular that, depending on the co-culture situation, E. coli
curli may assist the interacting species, and even alter the dominance status in favour
of the non-E. coli species at times.
However, as with any scientific endeavour, not everything would go according to original
plans, and one scientific conclusion would only lead to the realisation of how much more
we still do not know. Hence, in this chapter, I would like to raise some of the unresolved
questions I have encountered and discuss the perspectives for future exploration.
5.1 Fluorescent Proteins
One of the greatest disappointments in my project has been the situation that the dual
fluorescence system developed by the Singapore laboratory (Miao et al., 2009) could not

86
be fully exploited due to the slow maturation and possibly toxicity of the red fluorescent
proteins in the E. coli background I have used.
In the system where E. coli is whole cell-labelled with GFP, the coupled gene
transcriptional reporter using promoter-RFP fusion did not accurately report certain
genes’ expression and its reporter function seemed to be promoter- and strain- specific.
With the promoter-GFP[LVA] fusion, which faithfully reported the gene expression
status, we went on to construct a RFP whole cell tagged E. coli. Several attempts have
been made using three different RFPs, but unfortunately did not succeed due to the
instability of red fluorescence proteins that may be caused by their toxicity.
The necessity of using a fluorescent protein well distinguishable from the green FP
pushes us to continue to search for the good candidate. RFP has often been reported,
either in actual publications (Strack et al., 2008) or through anecdotal complaints, to be
toxic to cells. Although a number of groups have published successful work using RFP
for whole cell-labelling or promoter-fusion, we are now fairly convinced that we are not
alone in facing problems with RFP. We will continue to hunt for a better version of RFP
such as monomer or dimer, which could have lower toxicity to E. coli cells. It seems that
because there is a greater demand for the use of FPs in eukaryotic cell biology,
improvements of RFPs are mostly based on eukaryotic cell systems and claims made for
their applications are not always applicable to bacterial systems. For example, DsRed-
Max-N1 (Strack et al., 2008) and mCherry (Shaner et al., 2005) that we have tried were
both chosen based on positive testimonials in eukaryotic cells, but did not work out in our
strains. Even within bacterial species, one RFP may work well in one species e.g. DsRed-
Express was reliable in P. putida (Nancharaiah et al., 2003) but completely lost its
expression within one day in E. coli (Miao H, personal communication). There seems to
be no rational way to predict the success of RFP in a particular expression system. We
will have to empirically try the new claimants of “better RFP” such as the rapidly
maturing far-red derivative of DsRed-express2 (Strack et al., 2009) in our own system. In
the mean time, cyan, yellow or orange FP (Shaner et al., 2008) could be another option to

87
couple to our GFP, aided by the finer-tuned wavelength discriminatory functions of
newer models of CLSM and FACS.
5.2 Mucin-induced curli induction – mechanism, and inter-relation
with other regulatory factors?
5.2.1 Mucin up-regulates csgBA expression in E. coli K-12 MG1655
Although it was very encouraging to have found that mucin promotes biofilm formation
in E. coli MG1655 through up-regulation of csgBA expression, I am most curious about
the pathway by which mucin exerts its positive effect on csgBA expression. Since OmpR
is the main positive regulator of curli production and that ompR234 mutant has greatly
increased csgBA expression, an ompR mutant was used in my study. The overall
adherence of G1ompR decreased, but the induction effect remained. This suggests that
other factor(s) beside curli are able to promote biofilm formation in a mucin-inducible
manner in the ompR mutant of the MG1655 strain. The csgBA operon is regulated by
many known factors with CsgD being the principle positive regulator, which also
regulates the production of another cell surface structure, cellulose. Since curli expression
is under extremely complex regulation, we do not know for now the pathway through
which mucin up-regulates csgBA expression, but could only speculate which factors were
possibly involved. Preliminary experiments using a mutant of the main csgBA regulator,
csgD have been done to observe the effect of the mutation on biofilm induction by mucin
in 24-well plate, but gave contradictory results. More experiments using the two different
csgD mutants (refer to Section 6.1) available are needed to assess csgD’s involvement in
mucin’s up-regulation of csgBA expression. CsgD involvement in the response to mucin
is however very likely for the following reasons. I observed in my G1 and G1ompR234
incubated in BHI at 30°C that there is pellicle formation at the air-liquid interface,
difficult dissolution of biofilm- bound crystal violet and the decreased biofilm level at
high mucin concentration, implying possible existence of cellulose in biofilm. In
particular, decreased adherence was observed in the presence of high mucin
concentration (e.g., 0.75% and 2% in Figure 3.4). Landini’s group has reported that in E.

88
coli MG1655, cellulose may impair biofilm formation even in strong curli producing
strains probably by physically blocking curli from contacting the surface (Gualdi et al.,
2008). This model seems to support the hypothesized increase in CsgD and concurrent
cellulose production in response to increased mucin concentration.
To test whether mucin’s presence would favour cellulose production, calcofluor plate
with and without mucin can be used to assess cellulose production in the presence and
absence of mucin. Alternatively, cellulose’s presence can be directly observed using
electron microscopy or quantified (Gualdi et al., 2008). To determine whether csgBA up-
regulation by mucin was through up-regulation of csgD, the induction experiment in 24-
well plate of csgD mutant can be repeated. A more direct method would be to monitor
csgD gene activity with and without mucin, with the aid of a csgD-gfp fusion.
Another interesting observation that led me to the above hypothesis is that crystal violet
(CV) failed to dissolve in ethanol for quantification as described by Kikuchi (Kikuchi et
al., 2005) nor in ethanol-acetone (80:20 [vol/vol]) (Ferrieres & Clarke, 2003; Valle et al.,
2008; Korea et al., 2010), in experiments involving mucin. This is not directly due to
mucin itself binding CV, because no CV staining was observed in control wells
containing the mucin media without bacteria (data not shown). When the same strain was
used in the same experimental settings with metals instead of mucin, CV could be
completely dissolved. This led me to wonder if mucin is indirectly holding the CV dye
within the biofilm. After some literature search, I realized that there is no exact answer as
to what crystal violet binds, and no study was done on what component(s) are actually
stained by CV in the bacteria cell wall, and why the amount of cell-bound CV should be
assumed to be an indication of cell number. Bacterial cell wall is made of peptidoglycan,
which are linear glycan chains interlinked by short peptides. The glycan chains are
composed of alternating units of N-acetylglucosamine (GlcNAc) and N-acetylmuramic
acid (MurNAc), with all linkages between sugars being β,1→4 (Heijenoort,
2001). Cellulose is a homopolysaccharide consisting of D-glucopyranose units linked by
β,14 glycosidic bonds (Romling, 2002). Would crystal violet, staining the cell wall,
possibly stain cellulose, which is compositionally and structurally similar to the cell wall?
89
Testing the CV quantification procedure on MG1655 and cellulose overproducing or
deficient derivatives would help to solve the problem.
5.2.2 Mucin’s effect on other adherence structures
Mucin’s biofilm induction effect was also observed in other E. coli K-12 strains such as
W3110 and MC4100. However, the induction effect is not necessarily a result of higher
curli production. In W3110, type 1 pili seemed to be responsible for mucin’s biofilm
induction effect, while curli production greatly augments the strain’s biofilm formation
ability. Further investigations are needed to evaluate the interplay between different cell
surface adhesion structures in the presence of mucin. In both strains however, high
concentrations of mucin (0.75 – 2%) resulted in drastically decreased biofilm formation.
In the intestine where mucin is abundant, the expression of cell surface structures is likely
to be influenced. The concentration gradient of mucin from the mucus surface to the
epithelial lining of the intestine may thus result in decreased attachment and biofilm
forming ability of cells, preventing them from penetrating too deep into the mucus layer
in order to protect the underlying epithelial cells.
It should be noted however, we were only focusing on the possible influence of mucin on
the regulation of surface adhesion structures. Mucin could possibly influence the
expression of many other genes with various functions that may affect the bacteria’s
physiology as well as their interaction with commensal and pathogen species. More
effective ways to gain some insights in mucin’s influence may include the microarray
method, or the use of FACS to sort out the mucin up- and down- regulated genes from a
fluorescence-labelled gene promoter library (Zaslaver et al., 2006). However, although
FACS is a powerful tool, it needs to be optimised for our bacterial sorting. The presence
of mucin, which is insoluble with large molecule size, would add on the complexity and
difficulty to FACS analysis and sorting. To differentiate mucin from bacterial cells
carrying the fluorescence-labelled gene promoter library, the cells would need to be
tagged by fluorescence of another colour that can be effectively distinguished by FACS.

90
Although I have shown mucin’s effect on E. coli biofilm formation, how mucin
influences the physiology of K. pneumoniae and E. faecalis is still unknown and certainly
deserves attention. In the natural habitat where mucin is present, the interaction between
these commensal species may be different compared to in vitro conditions. Therefore, the
population relationship in mucin’s presence can be examined to shed some light on the
possible scenarios in the natural environment of their growth.
5.3 Partnership of E. coli with K. pneumoniae and E. faecalis
Microbiota functions are the product of interactions within communities of bacteria, the
resultant balance of various synergism and antagonism occuring concurrently between
multiple species. The production of curli which changes the surface property of E. coli
cells to the point that it can influence interactions with abiotic surfaces as well as with
mammalian cells, would probably also exert an effect on their commensal partners.
While a general trend of dominance can be observed that K. pneumoniae dominates over
E. coli, which often itself exhibits dominance on E. faecalis, the results showed inter-
species interactions are complex. In planktonic culture, curli expression appears to be
important for the growth of both partners in the E. coli - K. pneumoniae co-culture. The
antagonistic effect observed by K. pneumoniae on E. coli, prompted me to speculate that
curli expression on the surface of E. coli cells may serve as a protection against K.
pneumoniae, for which the curli fibre and/or curli subunit protein may be sensed by K.
pneumoniae as signalling molecules. On the other hand, loss of curli seems to increase E.
coli’s proportion (or decrease K. pneumoniae’s proportion), implying that the loss of
curlin protein synthesis conferring lower energy cost may lead to higher fitness of E. coli,
thus higher competitiveness against K. pneumoniae. To further investigate curli’s role in
K. pneumoniae growth, purified curli fibres or curlin proteins could be added to K.
pneumoniae culture to see if a slowed growth of K. pneumoniae could be observed.
Conditioning medium may be used to dissect the role of secreted factors from the role of
direct physical contact involving curli. In biofilm co-culture, two main findings must be
underlined: (i) curli production may promote the synergistic relationship between E. coli

91
and E. faecalis in biofilm, possibly by mediating E. coli attachment to surface, as well as
increasing the coaggregation with E. faecalis. (ii) Curli production of E. coli seems to
counteract the dominance of K. pneumoniae over E. coli, which may be the result of
increased fitness brought about by the presence of curli.
The different population relationship between commensal species obtained between
planktonic and biofilm culture confirmed that cells grown in biofilm are in different
physiological state from that in planktonic culture. However, in this project, only the
population relationship aspect of the co-cultures was examined. The biofilm formation by
dual- or multi-species involves the attachment of cells to surface, with one species under
the influence of its partner species, and the further inter-species interactions in the biofilm
maturation process all adds on to the complexity of multi-species biofilm analysis. In
addition to population studies, the spatial distribution of different species in biofilm may
be of particular interest. For example, E. faecalis being a poor biofilm former alone
showed greatly increased cell number when co-cultured with curli-expressing E. coli.
Would curli on E. coli cell surface, besides their higher attachment to surface, attract E.
faecalis cells and coaggregate with them, dragging them to settle in biofilm? To deepen
our understanding of this phenomenon, confocal investigations will help to determine if E.
faecalis cells are attached to E. coli cells in initial biofilm formation and when biofilm
forms, whether E. coli would be the one in contact with the surface. Fluorescent-tagging
of E. faecalis with a different colored FP will certainly facilitate such analysis.Another
approach is to study the gene expression profile of E. coli under the influence of the
partner species. The effective way would still be to use FACS to screen for genes that
have their expression level changed in the presence of the partner species from a
fluorescence-tagged gene library. This approach can also be used to examine mucin’s
effect on E. coli gene expression, as well as the influence of partner species on E. coli
gene expression in the presence of mucin, in a farther future.
Finally, we did not have time to consider in depth the influence of a third member in
three-species co-cultures in this study. After establishing more information from dual-
species co-culture, we may be able to put together such information and obtain better

92
insights. As it is now, all we know is that in M63 medium, there are conditions under
which the negative or positive influence on one species may be dampened or eliminated
by the presence of a third species. It will certainly be of interest to address the mechanism
of such neutralizing effects. One approach will be to supplement a dual-species co-
culture with the conditioned medium of a third member and compare the effects to the
corresponding three-species co-culture. The Singapore laboratory has also performed a
preliminary profiling of the medium composition of the various co-cultures in
comparision to pure cultures using tandem liquid-chromatography-mass spectrometry
(LC-MS) technique. We can be certain that much development of data mining and
analysis will be required in order to exploit these undertaking and unravel the levels of
complexity involved.
In conclusion, I would like to express my amazement at how every component in a tiny
bacterium is tightly regulated and highly cooperating with each other, that understanding
a fraction of it is not sufficient to grasp the whole picture. Not only that, the interaction
with biological partners have aspects that are surprising and beyond what we can fathom.
Such intricacy is involved in order for a “simple” bacterium to survive, to adapt to
various conditions, to proliferate, to conserve the species. Standing in awe of the vast
mysteries of life, I dedicate this thesis to the delicately composed symphony of nature.

93
Chapter 6 Materials and Methods
6.1 Strains and plasmids
Strains Relevant description Aba PHL
b ECS
c Source
E. coli strains
TOP10 Chemically competent cells Nil - 20 Invitrogen
S17 λ-pir provides Pir protein, which
is essential for replication of
R6K-based plasmids
Tpr
Smr
- 22 (Miller &
Mekalanos,
1988)
MG1655 λ- F
- prototroph Nil 1256 43 ATCC 700926
MG1655csgA MG1655 csgA::aadA7 Spr 1295 - C. Beloin,
Institut Pasteur
MG1655ompR234 MG1655 ompR234
malT::Tn10
Tcr 818 561 (Prigent-
Combaret et al.,
2001)
MG1655ompR234
csgA
MG1655 ompR234
malT::Tn10 csgA::uidA-Km
Tcr
Kmr
1137 761 (Perrin et al.,
2009)
MG1655ompR234
csgD
MG1655 ompR234
malT::Tn10 csgD::uidA-Km
Tcr
Kmr
1087 760 (Prigent-
Combaret et al.,
2001)
MG1655ompR234
agn43
MG1655 ompR234
malT::Tn10 agn43::Cm
Tcr
Cmr
1563 762 (Perrin et al.,
2009)
MG1655ompR234
fimA
MG1655 ompR234
malT::Tn10 fimA::Cm
Tcr
Cmr
1675 2634 This workd
MG1655ompR MG1655 ompR331::Tn10 Tcr 1171 763 Laboratory
collection
MG1655ompR
csgD
MG1655 ompR331::Tn10
csgD::uidA-Km
Tcr
Km
1089 - (Prigent-
Combaret et al.,
2001)
G1 MG1655 with chromosomal
insertion of PA1/04/03-
gfpmut3*
Cmr 1414 354 (Miao et al.,
2009)
G1ompR234 G1 ompR234 malT::Tn10 Cmr
Tcr
1581 562 This workd

94
Strains Relevant description Aba PHL
b ECS
c Source
G1ompR234csgA G1 ompR234 malT::Tn10
csgA::aadA7
Cmr
Tcr
Spr
1624 565 This workd
G1ompR G1 ompR331::Tn10 Cm
r
Tcr
1623 564 This workd
W3110 An E. coli K-12 strain
closely related to MG1655
Nil 1104 765 (Danese et al.,
2001)
W3110fimA W3110 fimA::Cm Cmr 1106 766 Gift from P.
Danese
W3110fimH W3110 fimH::Cm Cmr 1107 767 Gift from P.
Danese
W3110Ag43 W3110 (argF-lac)U169
agn::Cm
Cmr 1166 768 gift from R.
Kolter
W3110csgA W3110 csgA::uidA-Km Kmr 1144 2630 This work
d
W3110ompR234 W3110 ompR234
malT::Tn10
Tcr 1131 2628 Laboratory
collection
W3110ompR234
csgA
W3110 ompR234
malT::Tn10 csgA::uidA-Km
Tcr
Kmr
1145 2631 This workd
W3110ompR234
fimA
W3110 ompR234
malT::Tn10 fimA::Cm
Tcr
Cmr
1673 2632 This workd
W3110ompR234
fimH
W3110 ompR234
malT::Tn10 fimH::Cm
Tcr
Cmr
1674 2633 This workd
MC4100 araD139 Δ(argF-lac)U169
rpsL150 relA1 flbB5301
deoC1 ptsF25 rbsR
Nil 645 2624 (Vidal et al.,
1998)
MC4100ompR234 MC4100 ompR234
malT::Tn10
Tcr 744 2625 (Vidal et al.,
1998)
MC4100ompR234
csgA
MC4100 ompR234
malT::Tn10 csgA::uidA-Km
Tcr
Kmr
819 2627 (Dorel et al.,
1999)
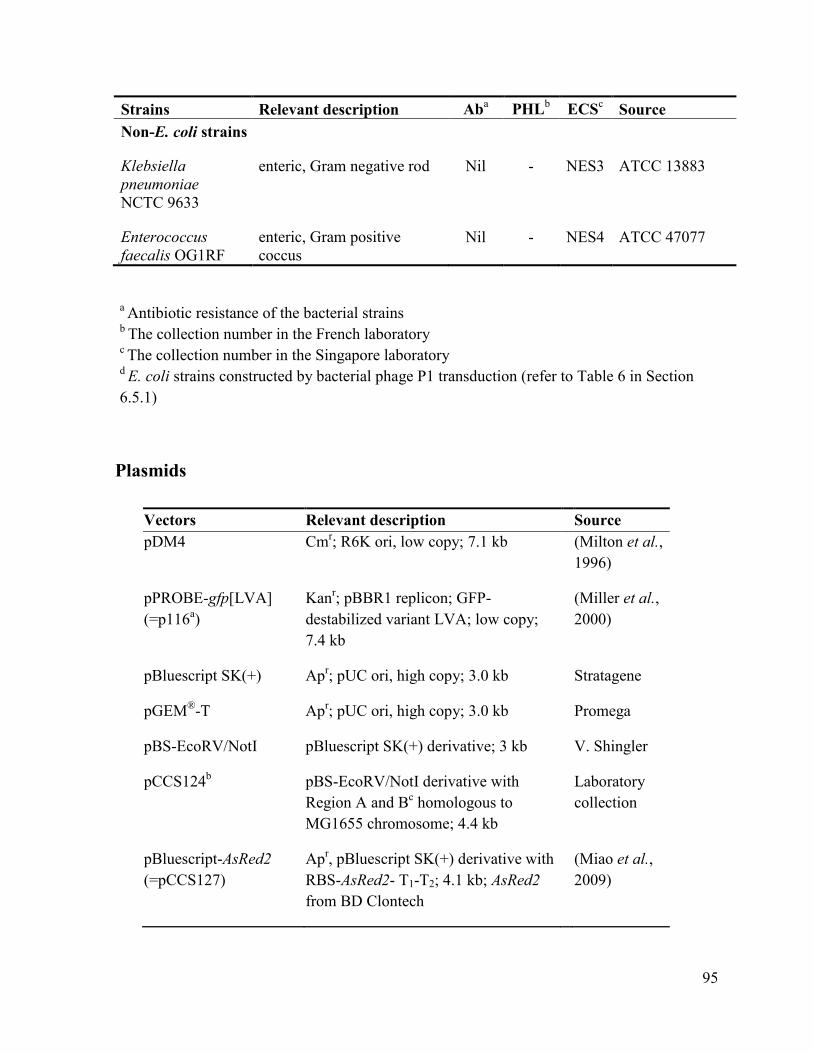
95
Strains Relevant description Aba PHL
b ECS
c Source
Non-E. coli strains
Klebsiella
pneumoniae
NCTC 9633
enteric, Gram negative rod Nil - NES3 ATCC 13883
Enterococcus
faecalis OG1RF
enteric, Gram positive
coccus
Nil - NES4 ATCC 47077
a Antibiotic resistance of the bacterial strains
b The collection number in the French laboratory
c The collection number in the Singapore laboratory
d E. coli strains constructed by bacterial phage P1 transduction (refer to Table 6 in Section
6.5.1)
Plasmids
Vectors Relevant description Source
pDM4 Cmr; R6K ori, low copy; 7.1 kb (Milton et al.,
1996)
pPROBE-gfp[LVA]
(=p116a)
Kanr; pBBR1 replicon; GFP-
destabilized variant LVA; low copy;
7.4 kb
(Miller et al.,
2000)
pBluescript SK(+) Apr; pUC ori, high copy; 3.0 kb Stratagene
pGEM®-T Ap
r; pUC ori, high copy; 3.0 kb Promega
pBS-EcoRV/NotI pBluescript SK(+) derivative; 3 kb V. Shingler
pCCS124b pBS-EcoRV/NotI derivative with
Region A and Bc homologous to
MG1655 chromosome; 4.4 kb
Laboratory
collection
pBluescript-AsRed2
(=pCCS127)
Apr, pBluescript SK(+) derivative with
RBS-AsRed2- T1-T2; 4.1 kb; AsRed2
from BD Clontech
(Miao et al.,
2009)

96
Plasmids Promoter fusion Relevant description Source
pDsRed-
Max-N1
Kanr; ori; 4.7 kb; used for cloning
of DsRed-Max gene for R1
construction
Addgene
plasmid
21718 (Strack
et al., 2008)
pCCS401
p173
PcsgBA-gfp Kanr; pPROBE-gfp[LVA] carrying
the csgBA promoter; 8.5 kb
This work
pCCS402
p171
Pfis-gfp Kanr; pPROBE-gfp[LVA] carrying
the fis promoter; 8.2 kb
This work
pCCS405
p175
PmazEF-gfp Kanr; pPROBE-gfp[LVA] carrying
the mazEF promoter; 8.4 kb
This work
pCCS407
p177
PcsgBA-AsRed2 Apr; pBluescript carrying the
csgBA promoter; 5.2 kb
This work
pCCS408
p178
Pfis-AsRed2 Apr; pBluescript carrying the fis
promoter; 4.9 kb
This work
pCCS411
p181
PmazEF-AsRed2 Apr; pBluescript carrying the
mazEF promoter; 5.2 kb
This work
pCCS325 PA1/04/03-AsRed2 Apr; pBluescript carrying the
mAsRed2 gene under the control of
PA1/04/03 promoter; 4.3 kb
Laboratory
collection
pCCS326 PA1/04/03-mAsRed2 Apr; pBluescript carrying the
mAsRed2 gene under the control of
PA1/04/03 promoter; 4.3 kb
This work
pCCS343 PA1/04/03-mAsRed2 Apr; pCCS124 carrying the ClaI-
PA1/04/03-mAsRed-BamHI fragment;
5.8 kb
This work
pCCS443 PA1/04/03-mAsRed2 pCCS343 derivative, removed the
extra XhoI site just upstream the
promoter PA1/04/03; 5.8 kb
This work
pCCS444 PA1/04/03-mAsRed2 Cmr; pDM4 carrying the XhoI-
Region A-PA1/04/03-mAsRed2-
Region B-SpeI fragment; 9.97 kb
This work

97
Plasmids Promoter fusion Relevant description Source
pCCS445 PA1/04/03-DsRed-Max Apr; pCCS124 carrying the DsRed-
Max-N1 gene under the control of
PA1/04/03 promoter
This work
pCCS446 PA1/04/03-DsRed-Max Cmr; pDM4 carrying the XhoI-
Region A-PA1/04/03-DsRed-Max-
Region B-SpeI fragment; 9.97 kb
This work
a p number refers to the collection number in the French laboratory
b pCCS number refers to the collection number in the Singapore laboratory
c Region A is a XhoI-ClaI fragment corresponding to base-pairs 312037-312754 and Region
B a BamHI-SpeI fragment corresponding to base-pairs 312771-313495 of E. coli MG1655
genome (GenBank accession no.U00096)
6.2 General reagents, kits and media
Laboratory stock solutions
10x TBE 0.9 M Tris, 0.9 M boric acid, 20 mM
Na2EDTA (pH 8.0),
TE 10 mM Tris/HCl (pH 8.0), 1 mM
Na2EDTA (pH 8.0)
Restriction enzymes From Fermentas, New England Biolabs
and Roche
Alkaline phosphatase (ClAP) From Fermentas
Taq DNA polymerase From Fermentas
Commercial kits
Rapid DNA Ligation Kit From Roche
Nucleospin Plasmid From Macherey-Nagel

98
NucleoBond PC100 From Macherey-Nagel
NucleoBond PC500 From Macherey-Nagel
Nucleospin® Extract II Kit From Macherey-Nagel
In-FusionTM
2.0 PCR Cloning Kit From BD Clontech
QIAfilter Midi and Maxi Kits From QIAGEN
QIAquick PCR Purification Kit From QIAGEN
Media for bacterial culture
All media were sterilised by autoclaving at 121°C for 20 min.
Luria-Bertani (LB) medium 1% (w/v) bacto-tryptone, 0.5% (w/v)
yeast extract, 1% (w/v) NaCl
LB agar LB media with 1.5% (w/v) bacto-agar
SOC 2% (w/v) bacto-tryptone, 0.5% (w/v)
yeast extract, 10 mM NaCl, 10 mM
MgCl2, 10 mM MgSO4, 10 mM KCl,
20 mM glucose
Brain-Heart Infusion broth From Becton Dickinson, Difcoa
Brain-Heart Infusion agar From Becton Dickinson, Difcoa
Lactobacilli MRS agar From Becton Dickinson, Difcoa
HiCrome UTI agar From HiMediaTM a
M63minimal medium supplemented
with glucose and BHI (= mM63) or LB
100 mM KH2PO4
15 mM (NH4)2SO4
1.7 μM FeSO4 ∙7H2O
Dissolve the above in ddH2O adjusting
the pH to 7 using KOH. After
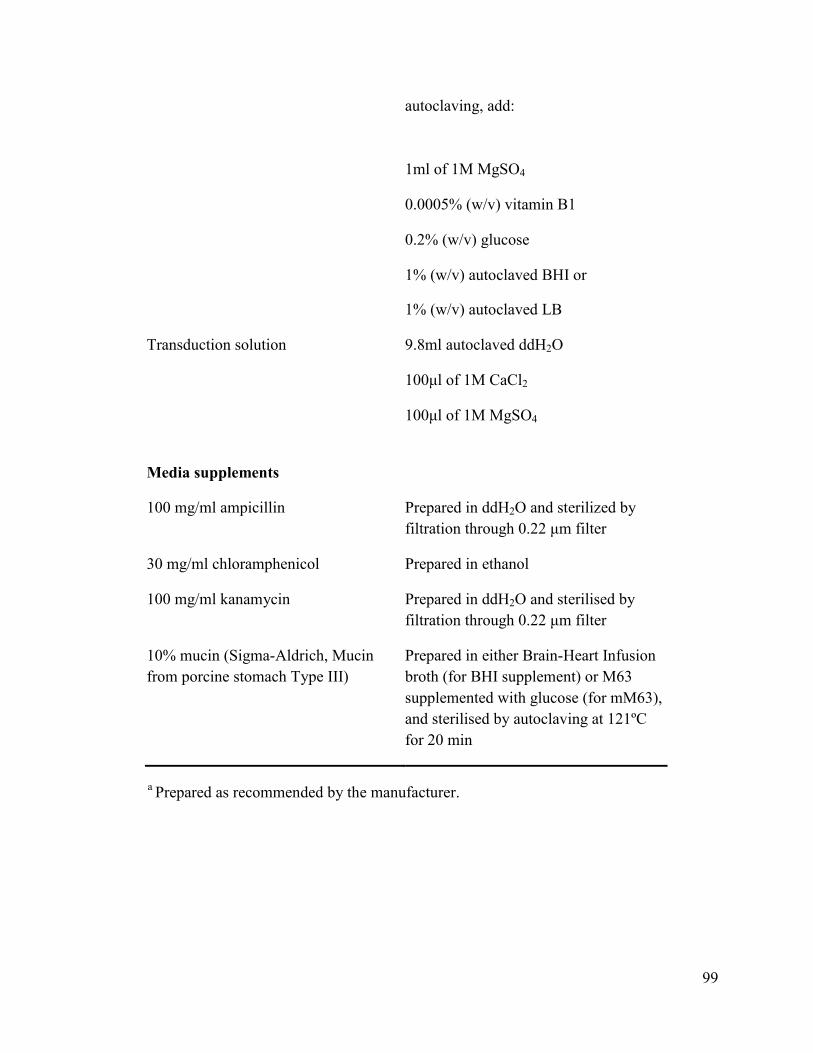
99
autoclaving, add:
1ml of 1M MgSO4
0.0005% (w/v) vitamin B1
0.2% (w/v) glucose
1% (w/v) autoclaved BHI or
1% (w/v) autoclaved LB
Transduction solution 9.8ml autoclaved ddH2O
100μl of 1M CaCl2
100μl of 1M MgSO4
Media supplements
100 mg/ml ampicillin Prepared in ddH2O and sterilized by
filtration through 0.22 μm filter
30 mg/ml chloramphenicol Prepared in ethanol
100 mg/ml kanamycin Prepared in ddH2O and sterilised by
filtration through 0.22 μm filter
10% mucin (Sigma-Aldrich, Mucin
from porcine stomach Type III)
Prepared in either Brain-Heart Infusion
broth (for BHI supplement) or M63
supplemented with glucose (for mM63),
and sterilised by autoclaving at 121ºC
for 20 min
a Prepared as recommended by the manufacturer.

100
6.3 Culture conditions
6.3.1 Single-species cultures
6.3.1.1 Planktonic cultures
Single-species planktonic cultures of E. coli MG1655 and G1, as well as their curli-
related mutants were routinely inoculated in LB (for general propagation and cloning
purposes) or BHI medium (for experiments involving co-cultures) and incubated at 37°C,
with shaking at 250 rpm unless otherwise stated. When gene transcriptional activity with
respect to curli-related genetic background was concerned, E. coli strains were shaken at
60 rpm in mM63 medium at 30°C. Where appropriate, media were supplemented with
antibiotics. Non-E. coli strains were grown without antibiotics in BHI at 37°C or mM63
medium at 30°C.
6.3.1.2 OD600-cell density relationship
Colonies of E. coli MG1655, E. coli G1 and their curli-related mutants as well as K.
pneumoniae and E. faecalis cultures were inoculated into BHI and mM63 media and
cultured at 37°C and 30°C, respectively. All bacteria were cultured in triplicate. After
culturing for 14 hours (in BHI at 37°C) or 16 hours (in mM63 at 30°C), the OD600 of each
culture was recorded and the culture was serially diluted before plating on agar. CFU
enumeration determined the cell densities (CFU/ml) of the cultures which were correlated
to their corresponding measured OD600 values. The calculated cell density of each species
under the particular growth condition for OD600 = 1 was then determined (Table 2).
Starting inocula were thereafter adjusted according to these values.
6.3.1.3 Biofilm single cultures
6.3.1.3.1 24-well polystyrene microtiter plate
Single-species E. coli overnight cultures were inoculated in BHI at 37°C or mM63 at
30°C (depending on the conditions of the biofilm culture) for 14 or 16 hours respectively
and their cell densities checked by OD600 measurement. They were then inoculated in 2ml

101
medium each well at the concentration of 6x10⁶ cells/ml, according to the OD600 - cell
density relationship (refer to Table 2 in Section 2.2.3) as determined in Section 6.3.1.2.
With biofilm cultures containing various concentrations of mucin, mucin was diluted
from 10% stock to the desired concentrations prior to bacterial inoculation. The biofilm
cultures were then incubated at 37°C (in BHI) or 30°C (in mM63) for 48 hours.
6.3.1.3.2 The saturated system
Overnight bacterial culture in mM63 at 30°C was used as seeding culture to inoculate
20ml mM63 in the presence of increasing amount of mucin at 6x10⁶ cells/ml
concentration in each Petri dish, according to the OD600 - cell density relationship (refer
to Table 2 in Section 2.2.3). Three well separated sterile glass cover slips (22x22 mm,
CellPath) were placed at the bottom of each Petri dish. After 24, 48 or 72 hours static
incubation at 30°C, biofilm formed on the entire surface of the cover slips.
6.3.1.3.3 The interface system
Overnight bacterial culture in BHI at 37°C was used as seeding culture to inoculate 30ml
BHI supplemented with 2% mucin (Sigma Aldrich) at 6x10⁶ cells/ml concentration,
according to the OD600 - cell density relationship (refer to Table 2 in Section 2.2.3). After
24 hours static incubation at 37°C, biofilms formed at the air-medium interface on glass
coverslips (24x50 mm, CellPath) slanted at a slight angle in a glass tank (Figure 2.4).
6.3.2 Co-cultures
For population relationship experiments involving co-cultures, individual strains were
first shaken in either BHI at 37°C for 14 hours or mM63 at 30°C for 16 hours (except
Enterococcus faecalis in mM63 for 24 hours due to its slow growth in minimal medium)
and their cell densities checked by measuring OD600. These cultures were then mixed at
1:1 ratio to achieve a final density of 6x10⁶ cells/ml for each species, according to the
OD600 - cell density relationship (refer to Table 2 in Section 2.2.3). The planktonic co-
cultures were shaken at 250 rpm while the biofilm co-cultures incubated statically in

102
either BHI (37°C) or mM63 (30°C) for 24 hours. Only the saturated and interface
systems were used for biofilm co-culture experiments.
6.4 Growth monitoring and analysis
6.4.1 Planktonic cultures
Growth of planktonic cultures was monitored via OD600 on a BioSpec-mini
spectrophotometer (Shimadzu). To obtain growth curves, the OD600 of 14 hours (in BHI
at 37°C) or 16 hours (for mM63 at 30°C) cultures were first determined and subsequently
diluted to an OD600 of 0.1 in 100 ml of corresponding fresh medium. Cultures were
shaken at 30 or 37°C at 250 rpm. OD600 was measured every 30 min for the first 4 h and
hourly after that. Mean data of the triplicate cultures in exponential phase were used to
calculate generation time (G) using the formula: G = t / [3.3 x lg(b/B)].
This is derived from:
(i): G (generation time) = t/n;
(ii): b = B x 2n;
where t: time interval in minutes; b: OD600 of culture at the end of the time interval; B:
OD600 of culture at the start of the time interval; n: number of generations (cell population
doubling) during the time interval. The time interval is taken to be the linear range of the
growth curve (early exponential to late exponential phases)
From (ii), solve for n:
lgb = lgB + nlg2;
n = (lgb – lgB)/lg2;
n = 3.3 lg(b/B),
Since (i) G = t/n
therefore G = t / [3.3 x lg(b/B)].

103
6.4.2 Colony Forming Unit (CFU) enumeration
Viable cell numbers were determined by CFU counts. A series of 10-fold dilutions were
performed by transferring 200 μl cultures to 1800 μl sterile ddH2O in 5 ml snap-cap tubes
and colony forming units per ml (CFU/ml) were determined by plating 100 µl of suitably
diluted cultures on LB (for E. coli single-species cultures) or UTI (for K. pneumoniae and
E. faecalis single species cultures as well as co-cultures) agar plate in triplicates. Cultures
with E. faecalis were also spread onto deMan, Rogosa and Sharpe (MRS) agar plates for
selective enumeration of E. faecalis. LB and UTI agar plates were routinely incubated for
12~16 h at 37°C, while MRS agar plates were incubated for 24 h under the same
conditions. Only plates with the number of colonies in the range of 30~300 were counted.
6.4.3 Biofilms
6.4.3.1 The 24-well plate
To obtain the test strain’s adherence property, the 2ml supernatant was carefully collected
without disturbing the biofilm and referred to as “planktonic portion” The well was then
gently washed with 1ml mM63 and pooled to the planktonic portion. The biofilm at the
bottom of the well was recovered with 1ml of mM63 by scraping with the blue pipette in
3 directions and referred to as “biofilm portion”. For OD600 measurement, both portions
were vortexed for 3 min before measurement. For direct enumeration by CFU count in
biofilm cultures containing mucin, both the planktonic and biofilm portions were
vigorously vortexed for 20 pulses, followed by sonication at 50% power on an ultrasonic
bath (Tru-SweepTM
Ultrasonic Cleaners 575, Crest Ultrasonics) for 2 cycles of 15 min,
and vigorously vortexted for 20 pulses after each round of sonication. Then both portions
were diluted and plated on LB agar plate. Total bacteria population is the sum of the
planktonic and biofilm portion, while adherence is the percentage of biofilm in the total
population.
6.4.3.2 The saturated system
For enumeration of the biofilm by CFU count, the glass cover slips were taken from the
Petri dish with the aid of a sterile needle and a pair of autoclaved forceps and place in a

104
small Petri dish. The edge of the cover slip was gently dabbed the on tissue paper to
remove excess culture before placed in the small Petri dish, with the biofilm growing side
facing upward. Two cover slips were place side by side in the small Petri dish and
scraped twice by a blue pipette tip with 500µl of sterile water. The total 1ml scraped
biofilm was then collected in a 1.5ml Eppendorf tube and sonicated as described in
Section 6.4.3.1 before serial-diluted into the appropriate dilution and plated on agar plate.
6.4.3.3 The interface system
For enumeration of the biofilm by CFU count, the cover slip was withdrawn from the
tank and the planktonic cells below the interface biofilm were washed by dipping in
sterile water. The interface biofilm on both sides of the cover slip was scraped twice by a
blue pipette tip with 500µl of sterile water and the total 1ml scraped biofilm was then
collected in a 1.5ml Eppendorf tube and sonicated as described in Section 6.4.3.1 before
serial-diluted into the appropriate dilution and plated on agar plate.
6.4.4 Crystal violet staining of biofilm formed on 24-well polystyrene plate
For biofilm formation estimation by crystal violet staining, the 2ml supernatant was
gently removed without disturbing the biofilm and discarded. Then each well was washed
carefully with 1ml of medium and discarded before fixing the bacteria at 80°C for 1 and a
half hours. After the plate was cooled down, each well was stained by 1% crystal violet
(CV) for approximately 1 min before being gently washed 3 times to remove excess
crystal violet. The plate was then air dried and scanned.
6.4.5 Biofilm observation using CLSM
6.4.5.1 Biofilm formed in the saturated system
For biofilm observation using CLSM, the cover slip was taken out from the Petri dish by
lifting up one side of the cover slip with a needle and then holding it with a pair of

105
forceps. The Petri dish-contacting side of the cover slip was wiped with ethanol, and the
whole cover slip was place directly on the observation stage of Zeiss inverted microscope
with its biofilm side facing up. For observation using the Nikon up-right microscope, the
cover slip was placed on the flow cell chamber filled with water with the biofilm side
facing down in contact with water and the Petri dish-contacting side facing up.
6.4.5.2 Biofilm formed in the interface system
For biofilm observation using Nikon up-right CLSM, the cover slip was withdrawn from
the tank and the biofilm on the side facing the medium was wiped away with ethanol.
Then the planktonic cells below the interface biofilm were washed in sterile water and the
cover slip mounted on flow cell chamber (Bjarke Bak Christensen, Technical University
of Denmark) containing water.
6.4.6 Growth inhibition test
To test whether E. coli, K. pneumoniae and E. faecalis have antimicrobial effect against
each other, growth inhibition test was performed on soft agar of BHI and mM63. E. coli
MG1655, G1 and their curli-related mutants, as well as E. coli, K. pneumoniae and E.
faecalis were inoculated in BHI and mM63 and shaken overnight at 37ºC and 30ºC
respectively. 50 µl of the overnight culture of each strain was added into 5 ml of 0.75%
molten soft agar of either BHI or mM63, shaken gently to mix well and immediately
poured onto the appropriate plate. The resulting soft agar plate was then swirled to even
out the surface and left to solidify. Then they are dried for at least half an hour before
drops of 3 µl of strains for testing antibiotic production were aliquoted, and incubated for
24 hours at 37ºC (for BHI plates) or 30ºC (for mM63 plates). Inhibitory antimicrobials
against the test strain in the lawn after overnight growth will result in a clear halo around
the “drop” strain’s patch.

106
6.5 Bacterial genetic manipulation
6.5.1 Generation of mutants by P1 Transduction
6.5.1.1 Phage stock preparation in liquid culture
Bacterial phage P1 vir was used for transduction in this project. The E. coli strains
constructed by transduction are listed in Table 6. To prepare a phage stock containing the
gene fragment to transduce, the bacterial strain carrying this gene was shaken at 37ºC,
250 rpm overnight, and 100μl of which was then inoculated in a glass tube containing
5ml LB supplemented with 50μl of 20% MgSO4 and 100μl 0.2M CaCl2. After shaking at
37ºC for 2 and half hours, 500μl phage P1 that does not contain the selection antibiotic
resistance of the gene of interest was added to the culture and incubated statically at room
temperature (RT) for 30 mins. The phage-bacterial cell mixture was then shaken at 37ºC,
250 rpm until lysis of bacterial cells was complete (if lysis does not occur after 4 hours of
incubation, it is not likely to occur, thus the whole process needed to be repeated). To kill
the remaining bacterial cells, 5 drops of chloroform was added to the mixture and
vortexed for 30 seconds before left at RT for 30 min and on ice for 10 min. After that, the
tube was vortexed for 30 seconds again and left on ice for 10 min before centrifuged at
15ºC 6000 rpm for 10 min. The supernatant containing the phage P1 was carefully
collected without touching the pellet and conserved in a sterile glass tube at 4ºC. The
stock of phage was prepared and ready to be used.
6.5.1.2 Transduction
For transduction of the recipient bacterial cells by phage P1, the recipient bacterial strain
was incubated in 5ml LB at 37ºC, 250 rpm overnight. 1.5ml of the overnight culture was
collected in a sterile Eppendorf tube and centrifuges to remove the supernatant. The pellet
was resuspended in 0.9ml transduction solution and 0.1ml of phage stock. Negative
controls were set up to check possible contamination of phage stock (0.9ml LB + 0.1ml
phage stock) and the recipient strain (1.5ml pelleted overnight culture + 0.9ml
transduction solution +0.1ml LB). The mixture of bacterial cells and phage were
incubated statically at 37 ºC for precisely 20 min before centrifuged at 10000g for 1min.
107
The pellet was washed three times with 1ml LB containing 0.1% citrate (w/v) to
eliminate phages that were attached to the bacterial cells. The bacterial cells were then
incubated in the last wash solution at 37 ºC for 45 min before spread on LB agar plates
containing citrate and appropriate antibiotics. 6 to 12 colonies with antibiotic resistance
were re-streaked on a fresh agar plate containing the appropriate antibiotics before
phenotypic analysis.
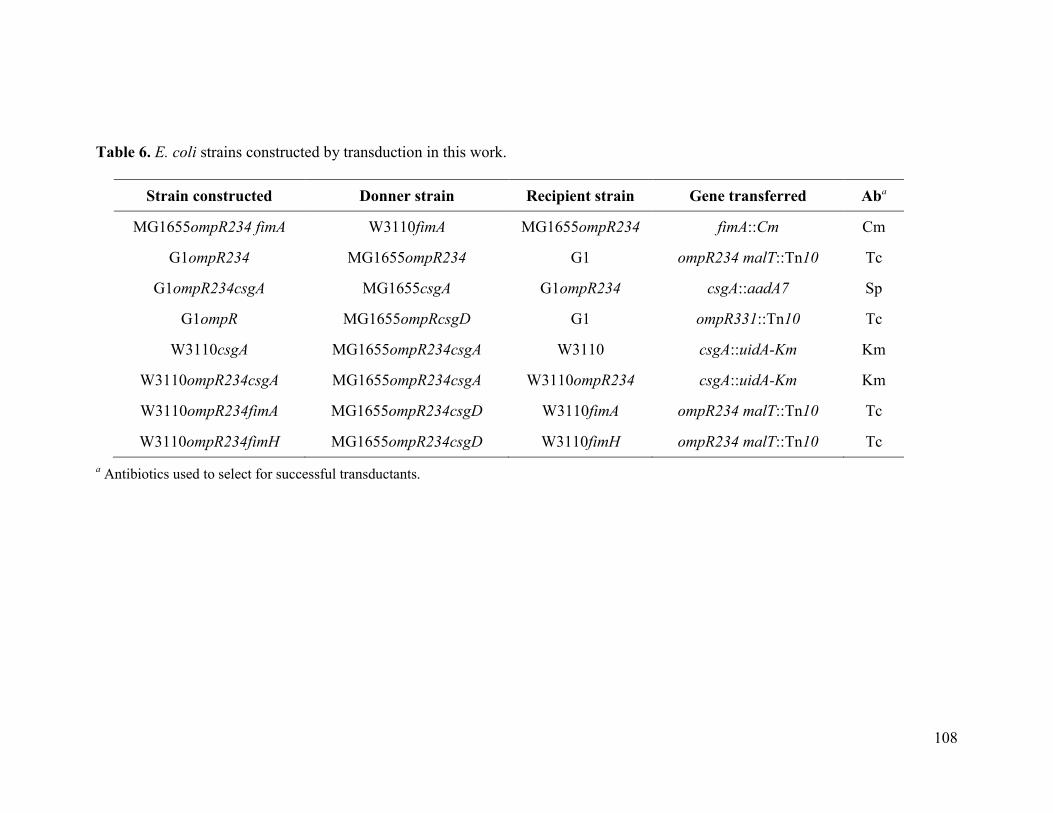
108
Table 6. E. coli strains constructed by transduction in this work.
Strain constructed Donner strain Recipient strain Gene transferred Aba
MG1655ompR234 fimA W3110fimA MG1655ompR234 fimA::Cm Cm
G1ompR234 MG1655ompR234 G1 ompR234 malT::Tn10 Tc
G1ompR234csgA MG1655csgA G1ompR234 csgA::aadA7 Sp
G1ompR MG1655ompRcsgD G1 ompR331::Tn10 Tc
W3110csgA MG1655ompR234csgA W3110 csgA::uidA-Km Km
W3110ompR234csgA MG1655ompR234csgA W3110ompR234 csgA::uidA-Km Km
W3110ompR234fimA MG1655ompR234csgD W3110fimA ompR234 malT::Tn10 Tc
W3110ompR234fimH MG1655ompR234csgD W3110fimH ompR234 malT::Tn10 Tc
a Antibiotics used to select for successful transductants.
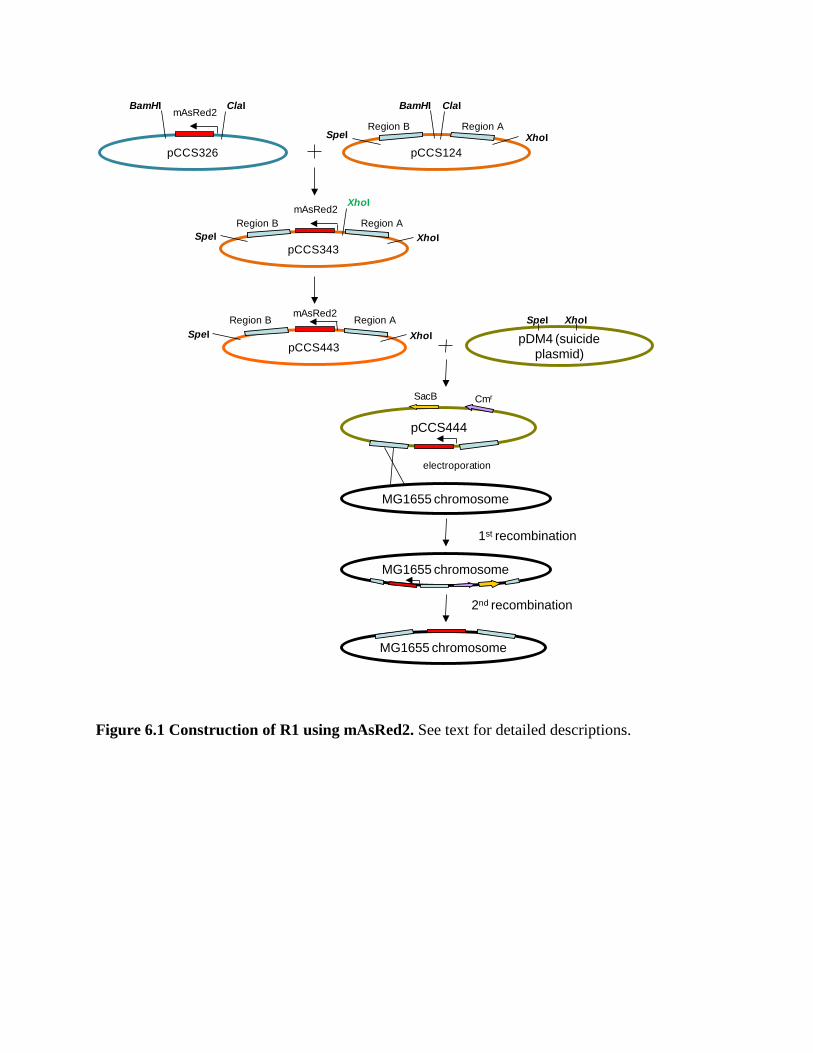
Figure 6.1 Construction of R1 using mAsRed2. See text for detailed descriptions.
pDM4 (suicide plasmid)
XhoISpeI
pCCS343
mAsRed2
SpeI XhoI
XhoI
pCCS443 SpeI XhoI
mAsRed2
pCCS326
mAsRed2 ClaIBamHI
pCCS124
Region ASpeI XhoI
ClaIBamHI
pCCS444
electroporation
MG1655 chromosome
CmrSacB
1st recombination
MG1655 chromosome
MG1655 chromosome
2nd recombination
Region A
Region A
Region B
Region B
Region B

109
6.5.2 Suicide-plasmid based chromosomal insertion for construction of E.
coli strain R1 and R2
Insertion of the red fluorescence cassette into the E. coli chromosome (refer to Section
6.7.3) using R6K suicide-plasmid based chromosomal insertion was performed by two
rounds of recombination events, as shown in Figure 6.1.
6.5.2.1 First recombination event
The chloramphenicol resistance gene on pDM4-derived suicide plasmids was utilized for
the first round of screening for plasmid integration. After electroporation (refer to Section
6.6.6.2), both static (incubate without shaking in 1ml SOC at 37°C overnight before
plating on LA Cm) and patch (drop 5 µl of the newly electroporated cells in 1ml SOC on
LA to incubate overnight, then take a scoop to spread on LA Cm) methods are used to
obtain colonies containing cells which have undergone first recombination. After 24h
incubation, many (more than 700) colonies grew for MG1655 1st recombinants but none
for MG1655ompR234. PCR was performed using PR304 and PR307 to verify the
presence of mAsRed2 insert.
Primer sequences are:
PR304: 5' - GCGGATAACAATTTCACACACTGCAG - 3'
PR307: 5' - CTGAGATGAGTTTTTGTTCTAGAAAGCT - 3'
6.5.2.2 Second recombination event
The sacB gene on the suicide plasmid served as a counter selective marker for the
screening of those strains that had recombined a second time, and hence likely to have
excised the plasmid backbone out of the chromosome, leaving only PA1/04/03-mAsRed2
cassette remaining on the chromosome. With the induction by sucrose, the sacB gene
encodes an enzyme (levansucrase) that is lethal to Gram negative bacteria in the presence
of 5% sucrose in the agar medium (Gay et al., 1985). Only strains that did not carry the
sacB gene could survive on 5% sucrose plate. Due to the delay of this lethal effect, strains

110
with sacB gene could, in reality, form colonies on the sucrose-containing agar. However,
they would lyse upon longer incubation, and this would be manifested by “sticky”
colonies when picked by toothpicks. To screen for second recombination events, the
strains screened as described above were pooled together, of which 200µl was used to
inoculate to 20ml low salt LB for overnight shaking. The next morning 5% sucrose was
added, and shaken for the day at 37°C before being spread on LB 5% sucrose plates to
screen for “sticky” colonies.
6.6 Molecular cloning
6.6.1 Polymerase chain reaction (PCR)
Amplification of DNA fragments was carried out using PCR. PCR primers were designed
with the aid of Oligo Calc, an online oligonucleotide properties calculator to maintain a
value of %GC between 40 - 60 and to ensure the absence of significant secondary
structures. PCR was routinely performed in a 50 μl reaction volume. A typical PCR
reaction contained less than 5 ng/μl template of chromosomal DNA, 200 μM of each
oligonucleotide primer, 200μM of each dNTP, 1.5 mM MgCl2, 1x buffer (provided in
10x concentration by the manufacturers) and 1~1.5U DNA polymerase. Taq DNA
polymerase (Fermentas) was used for colony PCR screening. For colony PCR, colonies
were picked with inoculation loop and suspended in 100 µl sterile water, followed by 3
minutes’ vortex. Then 5 µl of the solution was taken as template DNA.
Standard thermocycling reactions involved the initial denaturation at 94ºC for 5 min
followed by 30 cycles of 94°C for 30 s (denaturation), Annealing temperatures (Ta) °C
for 1min (annealing), and 72°C for 1 min (extension). The reaction was completed by a
further 7 min at 70°C. Annealing temperatures was set at 5ºC lower than the higher Tm of
the two primers. Tm refers to the melting temperature of the primer, at which 50% of
DNA duplexes become single-stranded. All PCR experiments included a sample without
DNA template which served as a negative control to check for the presence of
contamination in any of the reagents.

111
6.6.2 Agarose gel electrophoresis
Agarose gel of 0.7% agarose in 1x TBE was routinely used for electrophoresis. Agarose
was casted in gel apparatus (Bio-Rad) and set at RT for at least 30 min. Electrophoresis
was carried out in the same apparatus with the gel submerged 1~2 mm below the surface
in 1x TBE. DNA samples were loaded into the wells with 1x loading dye. Electric field
of about 10 volt/cm was usually applied for the separation of DNA fragments. After
electrophoresis, the gel was transferred into 1 μg/ml ethidium bromide (EB) solution for
staining. DNA fragments were then visualized by fluorescence over a UV light (302 nm,
UV transluminator TM-20, UVP), under which DNA/EB complexes fluoresce, and the
image was recorded with a Mitsubishi video copy processor.
6.6.3 DNA quantification and purification
DNA concentration was determined either with agarose gel electrophoresis or by the
NanoDrop™ 1000 UV-Vis Spectrophotometer (NanoDrop Technologies). For agarose
gel electrophoresis, the intensity of DNA was compared against that of known
concentrations on a 100 bp or 1 kb DNA ladder (GeneRuler™, Fermentas) and the
sample concentration was estimated. A more precise quantification was achieved with the
NanoDrop™ which requires molecular grade water as a blank reference and only 1μl of
sample for measurement.
Agarose gel electrophoresis was also used to isolate a particular DNA fragment in a
mixture of fragments, for ligation. For optimal separation, the gel was run with 8 volt/cm.
Gel containing DNA fragments of interest was excised under 70% power of UV light
(Vilber Lourmat) and DNA was extracted using Nucleospin®
Extract II Kit (Macherey-
Nagel) according to the manufacturer’s instructions.

112
6.6.4 Restriction endonuclease digestion
Restriction endonuclease digestions were usually carried out in 20μl or 100μl reaction
volume for verification or DNA extraction purpose respectively. In 20μl reaction volume,
5U of enzyme for 500ng DNA was used and incubated at 37ºC for 2~5 h whereas 20U of
enzyme for 2μg DNA was incubated at 37ºC for 12~16 h for 100μl reaction volume.
Digestion with two enzymes was carried out simultaneously in a suitable buffer
according to the manufacturer’s instruction. All PCR-amplified fragments for cloning
was digested with the corresponding endonuclease for which the sites were designed into
the primers, unless otherwise stated. Both vectors and inserts for cloning were purified
with Nucleospin® ExtractII Kit (Macherey-Nagel) to remove the restriction enzymes and
buffers prior to ligation.
6.6.5 DNA ligation
6.6.5.1 Conventional ligation
DNA vectors with compatible ends were prepared by restriction enzyme digestion and
followed by treatment with alkaline phosphatase, unless otherwise stated. Vector DNA
(about 200 ng) and insert DNA (in 3:1 molar ratio to vector) were ligated using the Rapid
DNA Ligation Kit (Roche). A reaction without insert DNA was included as negative
control.
6.6.5.2 In-FusionTM
2.0 PCR Cloning Kit
Ligation using In-FusionTM
2.0 PCR Cloning Kit (Clontech) was also used. The DNA
insert was PCR-amplified with the primers containing at least 15 bases of homology with
the sequence that flank the site of insertion in the linearized vector. The PCR-amplified
DNA insert was then fused with the linearized vector via single stranded regions
generated by In-Fusion enzyme. PCR fragment and vector at a molar ratio of 2:1 were
mixed in deionized H2O in a total volume of 10μl and added into the tube provided,
mixed by pipetting up and down. The tube was incubated at 37ºC for 15 min, then at

113
50ºC for 15 min, and then transfered on ice. Mastercycler® ep gradient thermal cycler
(Eppendorf) was used for the required incubations.
6.6.6 E. coli competent cell preparation and transformation
6.6.6.1 Chemically competent cells
Fresh colonies were prepared by streaking out cells from the -80C frozen stock onto LB
agar plate and incubating them overnight at 37°C. On the second day, a single colony of
E. coli strain was inoculated into 3 ml LB medium and grown overnight at 37°C. On the
third day, 2 ml of the overnight E. coli culture was transferred into flask containing
100ml LB medium and incubated at 250 rpm at 37°C until the OD600 reached 0.4~0.6.
The flask was put on ice for 10 min to cool the cells. The cells were then transferred to
250 ml centrifuge bottles and centrifuged at 4ºC for 10 min at 6000rpm with AvantiTM
J-
25 centrifuge (Beckman CoulterTM
). The pellet was resuspended in 50 ml ice-cold
100mM CaCl2 and incubated on ice for 20 min. After centrifugation as before, the cells
were resuspended in 10 ml 100 mM CaCl2 with 15% glycerol. The cells were then
aliquoted by 400μl into sterile Eppendorf tubes and stored at -80°C.
For Transformation of DNA into chemically competent cells, 200 μl competent cells
were thawed quickly and stored on ice immediately after thawing. After the addition of
DNA (200 ng~300 ng), the mixture was mixed by tapping gently and then incubating on
ice for 30 min. A negative control was performed in parallel without addition of DNA to
detect any possible contamination of the competent cells. Then the mixture was heat
shocked at 42ºC for 90 seconds and immediately cooled on ice for 5 min. Then 800μl LB
medium was added into the tube, followed by incubation at 37ºC for 45 min with shaking.
The cells were then spread onto agar plates containing the appropriate antibiotics. To
ensure that single colonies can be obtained with samples of unknown transformation
efficiency, 100 μl cells were spread on one agar plate and the remaining 900 μl spun
down and resuspended in 100 μl LB and spread on another agar plate.
114
6.6.6.2 Electrocompetent cells
Similar to that of the preparation of chemically competent cells, cells of the strain of
interest were cultured in 100 ml LB medium at 250 rpm at 37ºC until the OD600 reached
0.7~0.9. The cells were harvested by centrifugation at 4355g for 10 min at 4°C. The
pellet was rinsed in sterile ice-cold ddH2O twice (100 ml and 50 ml respectively) and
finally resuspended in 5 ml sterile ice-cold 10% glycerol solution. The cells were then
aliquoted into 100 μl/tube and stored at -80°C.
For each electroporation, electrocompetent cells were thawed and 45 μl of which were
transferred to ice-cold 0.2 cm electropration cuvette (Bio-Rad) and approximately 1 μg
DNA (maximum volume 10 μl) was added. Another 45μl of cells were used as negative
control with no DNA added. The cuvettes were gently tapped to mix and to ensure that
there were no air bubbles. Gene Pulser (Bio-Rad) apparatus was set at 25 μF, 200 ohm
and a voltage of 2.5 kV. Time constant would be displayed as >4.5 for high
electroporation efficiency. Immediately after electroporation, 1ml of SOC medium was
added into the cuvette and transferred to a sterile Eppendorf tube to be shaken at 37ºC for
1 hour. The mixture was spread onto plates containing the appropriate antibiotics. To
ensure that single colonies can be obtained for samples with unknown transformation
efficiency, 100 μl cells were spread on one agar plate and the rest 900 μl spun down and
resuspended in 100 μl LB and spread on another agar plate.
6.6.7 DNA extraction
For small scale purification of plasmid DNA, 3 ml (for high copy plasmids) or 5ml (for
low copy plasmids) of LB medium with appropriate antibiotics was inoculated with a
single colony of the required strain and incubated at 37ºC, for 12~16 h, with shaking at
250 rpm. A Nucleospin Plasmid Kit (Macherey-Nagel) was used to extract DNA. For
large scale purification of plasmid DNA, a QIAfilter Midi (in France) or NucleoBond
PC100 Kit (in Singapore) was used for high copy plasmids and QIAfilter Maxi Kits (in
France) or NucleoBond PC500 (in Singapore) was used for low copy plasmids. All kits
were used according to the manufacturer’s instructions.

115
6.7 Plasmid Construction
6.7.1 Construction of promoter-gfp fusions
The promoters of the genes of interest were PCR-amplified from purified E. coli
MG1655 genomic DNA and inserted into the plasmid pPROBE-gfp between its EcoRI
and BamHI sites. Approximately 1kb upstream of the transcription start site of the gene
was amplified with reference to the promoter regions documented (“Ref” column in
Table 7).
6.7.2 Construction of promoter-AsRed2 fusions
The promoters of the genes of interest were PCR-amplified from purified E. coli
MG1655 genomic DNA and inserted into the pGEM®-T vector. Approximately 1kb
upstream of the transcription start site of the gene was amplified with reference to the
promoter regions documented (“Ref” column in Table 7). The orientation of the inserted
promoters was verified. The promoters were subsequently digested from the pGEM®-T
vector and inserted into the plasmid pBluescript-AsRed2 between its SphI and BglII sites.

116
Table 7. Primers used for construction of promoter-gfp and promoter-AsRed2 fusions.
Promoter fusiona Pr
b Sequence (5’->3’) Limit
c Ref
d
PcsgB-gfp 149 CGGGATCC(EcoRI)CGGCCGTTGATATGAGGCCAG -1072 (Hammar et
al., 1995) 150 GGAATTC(BamHI)CGTTGTCACCCTGGACCTG -1
Pfis-gfp 145 CGGGATCC(EcoRI)CGCCCATCCAACCACCTCTCTG -789 (Nasser et al.,
2002) 146 GGAATTC(BamHI)CGAGTTAAGAAATGACCATACTGTGACTGC -1
PmazEF-gfp 165 CGGGATCC(EcoRI)CGCGCTTACCACATCCACAGTG -1032 (Marianovsky
et al., 2001) 166 GGAATTC(BamHI)CCAACGCTTTACGCTACTGTG +26
PcsgB-AsRed2 147 GCCGTTGATATGAGGCCAG -1072 (Hammar et
al., 1995)
148 GAAGATCT(BglII)TCGTTGTCACCCTGGACCTG -1
Pfis-AsRed2 143 CCCATCCAACCACCTCTCTG -789 (Nasser et al.,
2002)
144 GGAAGATCT(BglII)TTCGAGTTAAGAAATGACCATACTGTGACTGC -1
PmazEF-AsRed2 163 CGCTTACCACATCCACAGTG -1032 (Marianovsky
et al., 2001) 164 CGTAGATCT(BglII)TCCAACGCTTTACGCTACTGTG +26
a Promoter fusion refers to promoters of interest, fused with fluorescence protein gene of either GFP[LVA] (gfp) or AsRed2.
b Pr refers to primers used to PCR-ampilfy each promoter of interest. The numbering follows the French laboratory primer collection number.
c Limit refers to limits of promoters cloned upstream of AsRed2 gene as defined by the primers. The numbers shown are with respect to the start
codon of each gene.
d Ref refers to the references that documented the transcriptional start site of each promoter.

Figure 6.2 Construction of R2 using DsRed-Max. See text for detailed descriptions.
pDM4 (suicide plasmid)
XhoISpeI
pCCS443
mAsRed2 Region B Region A
SpeI XhoI
NcoIEcoRI
DsRed PCR with 15bp extension each end
In-Fusion kit cloning
pCCS445
Region ARegion BSpeI XhoI
DsRed-Max
NcoIEcoRI
pCCS446
CmrSacB

117
6.7.3 Plasmid construction for the generation of E. coli strain R1 and R2
6.7.3.1 Using mAsRed2 for construction of E. coli R1
Previously, the high copy plasmid pBluescript carrying mAsRed2 gene under the
promoter PA1/04/03 (pCCS326) was constructed in the Singapore laboratory. To construct
R1 following the same principle as that of G1 (refer to section 2.4.2.2), the PA1/04/03-
mAsRed2 cassette was digested from pCCS326 and inserted into the backbone containing
the regions homologous to the chromosome of E. coli MG1655 (pCCS124) for
recombination (Figure 6.1), giving rise to pCCS343. The whole Region A- PA1/04/03-
mAsRed2-Region B cassette needed to be then digested from pCCS343 and inserted into
the R6K-based suicide plasmid pDM4 with the restriction digestion sites SpeI and XhoI.
However, there was an unexpected additional XhoI site (in green in Figure 6.1) just
upstream of the PA1/04/03-mAsRed2 cassette. Therefore, this additional XhoI was
eliminated by partially digesting pCCS343 with XhoI restriction enzyme and blunt-
ending the digested site with Klenow Fragment (Fermentas) followed by ligation. The
Region A- PA1/04/03-mAsRed2-Region B cassette was then digested from the resulting
plasmid pCCS443 and ligated to the pDM4 backbone pre-digested with SpeI and XhoI.
The purified ligation mixture was then transformed into the permissive strain E. coli S17
λ-pir. The highest transformation yield was given by vector:insert ratio of 1:5 with excess
ligation buffer. The plasmid was then extracted, verified for insertion by restriction
digestion and purified before being electroporated into E. coli MG1655 and
MG1655ompR234.
6.7.3.2 Using DsRed-Max for construction of E. coli R2
The general procedure for construction of E. coli strain R2 using PA1/04/03-DsRed-Max
was the same as that with PA1/04/03-mAsRed2 except for the first step of plasmid
construction. DsRed-Max was PCR amplified from the plasmid pDsRed-Max-N1 (Strack
et al., 2008) to replace the mAsRed2 sequence in the plasmid pCCS443 (Figure 6.2). This
was done with In-Fusion® Dry-Down PCR Cloning Kits (BD Clontech), which can clone
a PCR fragment into a linearized vector with the aid of the In-Fusion Enzyme that can
fuse PCR-generated sequences to linearized vectors efficiently and precisely by

118
recognizing a 15 bp overlap at their ends. Primers PR365 and PR366 containing
restriction digestion sites EcoRI and NcoI were designed according to the manufacturer’s
instruction and plasmid pCCS443 were digested with EcoRI and NcoI that flanks the
mAsRed2 gene. The insert and vector backbone were then ligated and transformed
following the manufacturer’s instruction, and gave rise to the plasmid pCCS445
containing the Region A- PA1/04/03- DsRed-Max -Region B cassette.
Primer sequences are:
PR365: 5' – AACAGAAGGAATTACCCATGGA(NcoI)TAGCACTGAGAACG - 3'
PR366: 5' – AGAAAGCTTCGAATTC(EcoRI)CGCTACTGGAACAGGTGG - 3'
Blue sequences: 15 bp extension homologous to linearised pCCS443 vector.
Black sequences: sequence homologous to DsRed-Max gene.
6.8 Equipment settings
6.8.1 Fluorometric microplate reader / Fluorometer
Fluorescence levels of bacterial cultures were measured using different fluorometer in the
Singapore and French laboratory. The Singapore laboratory possesses an InfiniteTM
M200
multi-mode monochromator-based microplate reader (Tecan) (referred to as “microplate
reader”). The excitation/emission wavelength settings were 488 nm/530 nm for samples
with Gfpmut3* expression, and 570 nm/600 nm for samples with AsRed2 expression.
The French laboratory on the other hand, is equipped with a Kontron SMF25 fluorometer
(referred to as “fluorometer”), whose excitation/emission wavelength were set to 490
nm/510 nm for samples with Gfp[LVA] expression, and 570 nm/600 nm for samples with
AsRed2 expression.
For measurement using the microplate reader, duplicate aliquots of 200 μl of each
appropriately diluted culture were dispensed into a 96-well black-wall clear-bottom
microplate (Greiner). When using the fluorometer, samples were aliquoted in a 3.5 ml 4-

119
side fluorometer cuvette without dilution. The green and red fluorescence levels (in
Fluorescence Unit) and spectrophotometric absorbance at 600 nm (in Absorbance Unit)
were sequentially measured and corrected by the medium control (blank). The
fluorescence level was calculated as measured fluorescence unit divided by OD600.
6.8.2 Zeta potential measurement
E. coli MG1655, G1 and their curli-related mutants, as well as E. coli, K. pneumoniae
and E. faecalis were inoculated in BHI and mM63 and shaken at 37ºC for 14 hours and
30ºC for 16 hours (except E. faecalis for 24 hours) respectively. Each strain was then
adjusted to a density of 107 cells/ml in ddH2O (according to the OD600 - cell density
relationship listed in Table 2 in Section 2.2.3) before running on Nano Zetasizer
(Malvern Instrument, UK) at 150 V, room temperature.
6.8.3 Confocal laser scanning microscope
Biofilms were observed under either an Eclipse 90i inverted CLSM (Nikon) equipped
with 488 nm and 543 nm lasers or Zeiss LSM 510 upright CLSM (Carl Zeiss).
For the Eclipse 90i inverted CLSM, green fluorescence was observed using the channel
set at 488 nm excitation and 515/30 nm emission; for red fluorescence, 543 nm excitation
and 605/25 nm emission. The confocal images of the two fluorescences were taken
sequentially to minimize the crosstalk between them. Controls of the microscope were
manipulated by iControl software (Nikon). Images were processed by EZ-C1 3.20
FreeViewer software (Nikon).
For the Zeiss upright CLSM, green fluorescence was observed at excitation/emission
wavelengths of 488 nm/505-530 nm, whereas red fluorescence of SYTO 61 was observed
with excitation of 633 nm and emission of 650 nm. Controls of the microscope were
manipulated by LSM 510 software and images were processed by LSM Image Browser
software (Nikon).

120
6.8.4 Fluorescence activated cell sorter
Analysis of cell size, surface properties and fluorescence at the single cell level was
achieved by using the FACSAriaTM
Cell Sorter (Becton Dickinson), which is equipped
with air-cooled argon lasers at 488 nm. The detection of green fluorescence GFPmut3*
was through the FITC filter (530/30 nm) and for the red fluorescence proteins, the PE
filter (585/42 nm). Since FACSAriaTM
was designed for the use of mammalian cells, we
have optimised its settings to suit our analysis of bacterial cells. The flow rate for the
FACSAriaTM
was kept at the minimum value of 1. The optimised settings are as follows:
threshold voltage: SSC 200; PMT voltages: FSC 300, SSC 300, FITC 500, PE 650.
To achieve analysis and sorting resolution approximating 1 event = 1 cell, the samples
were diluted to a cell density of 107 cells/ml (see section 4.4.1), and kept on ice prior to
analysis. 10,000 events of each sample were analysed in duplicates.
The gates separating green fluorescent or red fluorescent cells from non-green or non-red
population (G+/G- or R+/R-) were defined using control strains that are green negative (E.
coli MG1655) or red negative (E. coli MG1655 and G1) in fluorescence. Fluorescence
levels higher than those of the negative controls were defined as green positive (G+) or
red positive (R+).

121
Reference
Abraham, J.M., Freitag, C.S., Clements, J.R. & Eisenstein, B.I. (1985) An invertible element
of DNA controls phase variation of type 1 fimbriae of Escherichia coli. Proc Natl Acad
Sci U S A 82(17), 5724-7.
Abu-Lail, N.I. & Camesano, T.A. (2003) Role of lipopolysaccharides in the adhesion, retention,
and transport of Escherichia coli JM109. Environ Sci Technol 37(10), 2173-83.
Aizenman, E., Engelberg-Kulka, H. & Glaser, G. (1996) An Escherichia coli chromosomal
"addiction module" regulated by guanosine [corrected] 3',5'-bispyrophosphate: a model
for programmed bacterial cell death. Proc Natl Acad Sci U S A 93(12), 6059-63.
Anderl, J.N., Franklin, M.J. & Stewart, P.S. (2000) Role of antibiotic penetration limitation in
Klebsiella pneumoniae biofilm resistance to ampicillin and ciprofloxacin. Antimicrob
Agents Chemother 44(7), 1818-24.
Andersen, J.B., Sternberg, C., Poulsen, L.K., Bjorn, S.P., Givskov, M. & Molin, S. (1998)
New unstable variants of green fluorescent protein for studies of transient gene
expression in bacteria. Appl Environ Microbiol 64(6), 2240-6.
Aoki, S.K., Pamma, R., Hernday, A.D., Bickham, J.E., Braaten, B.A. & Low, D.A. (2005)
Contact-Dependent Inhibition of Growth in Escherichia coli. Science 309(5738), 1245-
1248.
Archimbaud, C., Shankar, N., Forestier, C., Baghdayan, A., Gilmore, Michael S.,
Charbonné, F. & Joly, B. (2002) In vitro adhesive properties and virulence factors of
Enterococcus faecalis strains. Research in Microbiology 153(2), 75-80.
Arnqvist, A., Olsen, A. & Normark, S. (1994) Sigma S-dependent growth-phase induction of
the csgBA promoter in Escherichia coli can be achieved in vivo by sigma 70 in the
absence of the nucleoid-associated protein H-NS. Mol Microbiol 13(6), 1021-32.
Backhed, F. & Crawford, P.A. (2010) Coordinated regulation of the metabolome and lipidome
at the host-microbial interface. Biochim Biophys Acta 1801(3), 240-5.
Backhed, F., Ding, H., Wang, T., Hooper, L.V., Koh, G.Y., Nagy, A., Semenkovich, C.F. &
Gordon, J.I. (2004) The gut microbiota as an environmental factor that regulates fat
storage. Proc Natl Acad Sci U S A 101(44), 15718-23.
Bak, J., Ladefoged, S.r.D., Begovic, T. & Winding, A. (2010) UVC fluencies for preventative
treatment of Pseudomonas aeruginosa contaminated polymer tubes. Biofouling: The
Journal of Bioadhesion and Biofilm Research 26(7), 821 - 828.
Balestrino, D., Haagensen, J.A.J., Rich, C. & Forestier, C. (2005) Characterization of Type 2
Quorum Sensing in Klebsiella pneumoniae and Relationship with Biofilm Formation. J.
Bacteriol. 187(8), 2870-2880.

122
Barbas, A.S., Lesher, A.P., Thomas, A.D., Wyse, A., Devalapalli, A.P., Lee, Y.-H., Tan, H.-
E., Orndorff, P.E., Bollinger, R.R. & Parker, W. (2009) Altering and Assessing
Persistence of Genetically Modified E. coli MG1655 in the Large Bowel. Exp. Biol. Med.
234(10), 1174-1185.
Barnhart, M.M. & Chapman, M.R. (2006) Curli biogenesis and function. Annu Rev Microbiol
60, 131-47.
Barrett, K.E. (2009) The world within--impact of the intestinal micobiota on whole body
physiology and pathophysiology. J Physiol 587(Pt 17), 4151.
Beloin, C., Roux, A. & Ghigo, J.M. (2008) Escherichia coli biofilms. Curr Top Microbiol
Immunol 322, 249-89.
Beloin, C., Valle, J., Latour-Lambert, P., Faure, P., Kzreminski, M., Balestrino, D.,
Haagensen, J.A., Molin, S., Prensier, G., Arbeille, B. & Ghigo, J.M. (2004) Global
impact of mature biofilm lifestyle on Escherichia coli K-12 gene expression. Mol
Microbiol 51(3), 659-74.
Ben Nasr, A., Olsen, A., Sjobring, U., Muller-Esterl, W. & Bjorck, L. (1996) Assembly of
human contact phase proteins and release of bradykinin at the surface of curli-expressing
Escherichia coli. Mol Microbiol 20(5), 927-35.
Berg, R.D. (1996) The indigenous gastrointestinal microflora. Trends Microbiol 4(11), 430-5.
Bian, Z., Brauner, A., Li, Y. & Normark, S. (2000) Expression of and cytokine activation by
Escherichia coli curli fibers in human sepsis. J Infect Dis 181(2), 602-12.
Bian, Z., Yan, Z.Q., Hansson, G.K., Thoren, P. & Normark, S. (2001) Activation of inducible
nitric oxide synthase/nitric oxide by curli fibers leads to a fall in blood pressure during
systemic Escherichia coli infection in mice. J Infect Dis 183(4), 612-9.
Bieler, S., Silva, F., Soto, C. & Belin, D. (2006) Bactericidal activity of both secreted and
nonsecreted microcin E492 requires the mannose permease. J Bacteriol 188(20), 7049-61.
Blomberg, L., Krivan, H.C., Cohen, P.S. & Conway, P.L. (1993) Piglet ileal mucus contains
protein and glycolipid (galactosylceramide) receptors specific for Escherichia coli K88
fimbriae. Infect Immun 61(6), 2526-31.
Blomfield, I.C., Kulasekara, D.H. & Eisenstein, B.I. (1997) Integration host factor stimulates
both FimB- and FimE-mediated site-specific DNA inversion that controls phase variation
of type 1 fimbriae expression in Escherichia coli. Mol Microbiol 23(4), 705-17.
Boehm, A., Steiner, S., Zaehringer, F., Casanova, A., Hamburger, F., Ritz, D., Keck, W.,
Ackermann, M., Schirmer, T. & Jenal, U. (2009) Second messenger signalling governs
Escherichia coli biofilm induction upon ribosomal stress. Mol Microbiol 72(6), 1500-16.
123
Bollinger, R.R., Everett, M.L., Palestrant, D., Love, S.D., Lin, S.S. & Parker, W. (2003)
Human secretory immunoglobulin A may contribute to biofilm formation in the gut.
Immunology 109(4), 580-7.
Bollinger, R.R., Everett, M.L., Wahl, S.D., Lee, Y.H., Orndorff, P.E. & Parker, W. (2006)
Secretory IgA and mucin-mediated biofilm formation by environmental strains of
Escherichia coli: role of type 1 pili. Mol Immunol 43(4), 378-87.
Bougdour, A., Lelong, C. & Geiselmann, J. (2004) Crl, a low temperature-induced protein in
Escherichia coli that binds directly to the stationary phase sigma subunit of RNA
polymerase. J Biol Chem 279(19), 19540-50.
Bradshaw, D.J., Marsh, P.D., Watson, G.K. & Allison, C. (1998) Role of Fusobacterium
nucleatum and coaggregation in anaerobe survival in planktonic and biofilm oral
microbial communities during aeration. Infect Immun 66(10), 4729-32.
Branda, S.S., Chu, F., Kearns, D.B., Losick, R. & Kolter, R. (2006) A major protein
component of the Bacillus subtilis biofilm matrix. Mol Microbiol 59(4), 1229-38.
Brenner, K., Karig, D.K., Weiss, R. & Arnold, F.H. (2007) Engineered bidirectional
communication mediates a consensus in a microbial biofilm consortium. Proc Natl Acad
Sci U S A 104(44), 17300-4.
Brown, P.K., Dozois, C.M., Nickerson, C.A., Zuppardo, A., Terlonge, J. & Curtiss, R., 3rd (2001) MlrA, a novel regulator of curli (AgF) and extracellular matrix synthesis by
Escherichia coli and Salmonella enterica serovar Typhimurium. Mol Microbiol 41(2),
349-63.
Bryan, A., Roesch, P., Davis, L., Moritz, R., Pellett, S. & Welch, R.A. (2006) Regulation of
type 1 fimbriae by unlinked FimB- and FimE-like recombinases in uropathogenic
Escherichia coli strain CFT073. Infect Immun 74(2), 1072-83.
Burmølle, M., Thomsen, T.R., Fazli, M., Dige, I., Christensen, L., Homøe, P., Tvede, M.,
Nyvad, B., Tolker-Nielsen, T., Givskov, M., Moser, C., Kirketerp-Møller, K.,
Johansen, H.K., Høiby, N., Jensen, P.Ø., Sørensen, S.J. & Bjarnsholt, T. (2010)
Biofilms in chronic infections – a matter of opportunity – monospecies biofilms in
multispecies infections. FEMS Immunology & Medical Microbiology 59(3), 324-336.
Burmolle, M., Webb, J.S., Rao, D., Hansen, L.H., Sorensen, S.J. & Kjelleberg, S. (2006)
Enhanced Biofilm Formation and Increased Resistance to Antimicrobial Agents and
Bacterial Invasion Are Caused by Synergistic Interactions in Multispecies Biofilms. Appl.
Environ. Microbiol. 72(6), 3916-3923.
Bushnak, I.A., Labeed, F.H., Sear, R.P. & Keddie, J.L. (2010) Adhesion of microorganisms
to bovine submaxillary mucin coatings: effect of coating deposition conditions.
Biofouling 26(4), 387-97.

124
Caiazza, N.C. & O'Toole, G.A. (2004) SadB is required for the transition from reversible to
irreversible attachment during biofilm formation by Pseudomonas aeruginosa PA14. J
Bacteriol 186(14), 4476-85.
Camesano, T.A. & Abu-Lail, N.I. (2002) Heterogeneity in bacterial surface polysaccharides,
probed on a single-molecule basis. Biomacromolecules 3(4), 661-7.
Castonguay, M.H., van der Schaaf, S., Koester, W., Krooneman, J., van der Meer, W.,
Harmsen, H. & Landini, P. (2006) Biofilm formation by Escherichia coli is stimulated
by synergistic interactions and co-adhesion mechanisms with adherence-proficient
bacteria. Res Microbiol 157(5), 471-8.
Cebrian, R., Maqueda, M., Neira, J.L., Valdivia, E., Martinez-Bueno, M. & Montalban-
Lopez, M. (2010) Insights into the functionality of the putative residues involved in
enterocin AS-48-maturation. Appl. Environ. Microbiol., AEM.01154-10.
Ceri, H., Olson, M.E., Stremick, C., Read, R.R., Morck, D.W. & Buret, A.G. (1999) The
Calgary Biofilm Device: New technology for rapid determination of antibiotic
susceptibilities in bacterial biofilms. Journal of Clinical Microbiology 37, 1771-1776.
Chai, Y., Chu, F., Kolter, R. & Losick, R. (2008) Bistability and biofilm formation in Bacillus
subtilis. Mol Microbiol 67(2), 254-63.
Chalfie, M., Tu, Y., Euskirchen, G., Ward, W.W. & Prasher, D.C. (1994) Green fluorescent
protein as a marker for gene expression. Science 263(5148), 802-5.
Chapman, M.R., Robinson, L.S., Pinkner, J.S., Roth, R., Heuser, J., Hammar, M.,
Normark, S. & Hultgren, S.J. (2002) Role of Escherichia coli curli operons in directing
amyloid fiber formation. Science 295(5556), 851-5.
Chiti, F. & Dobson, C.M. (2006) Protein misfolding, functional amyloid, and human disease.
Annu Rev Biochem 75, 333-66.
Christensen, B.B., Haagensen, J.A., Heydorn, A. & Molin, S. (2002) Metabolic
commensalism and competition in a two-species microbial consortium. Appl Environ
Microbiol 68(5), 2495-502.
Cohen, F.E. & Kelly, J.W. (2003) Therapeutic approaches to protein-misfolding diseases.
Nature 426(6968), 905-9.
Cole, S.P., Harwood, J., Lee, R., She, R. & Guiney, D.G. (2004) Characterization of
monospecies biofilm formation by Helicobacter pylori. J Bacteriol 186(10), 3124-32.
Collinson, S.K., Doig, P.C., Doran, J.L., Clouthier, S., Trust, T.J. & Kay, W.W. (1993) Thin,
aggregative fimbriae mediate binding of Salmonella enteritidis to fibronectin. J Bacteriol
175(1), 12-8.

125
Cookson, A.L., Cooley, W.A. & Woodward, M.J. (2002) The role of type 1 and curli fimbriae
of Shiga toxin-producing Escherichia coli in adherence to abiotic surfaces. Int J Med
Microbiol 292(3-4), 195-205.
Corfield, A.P., Carroll, D., Myerscough, N. & Probert, C.S. (2001) Mucins in the
gastrointestinal tract in health and disease. Front Biosci 6, D1321-57.
Corfield, A.P., Myerscough, N., Longman, R., Sylvester, P., Arul, S. & Pignatelli, M. (2000)
Mucins and mucosal protection in the gastrointestinal tract: new prospects for mucins in
the pathology of gastrointestinal disease. Gut 47(4), 589-94.
Cormack, B.P., Valdivia, R.H. & Falkow, S. (1996) FACS-optimized mutants of the green
fluorescent protein (GFP). Gene 173(1 Spec No), 33-8.
Costerton, J.W., Stewart, P.S. & Greenberg, E.P. (1999) Bacterial biofilms: a common cause
of persistent infections. Science 284(5418), 1318-22.
Da Re, S. & Ghigo, J.-M. (2006) A CsgD-Independent Pathway for Cellulose Production and
Biofilm Formation in Escherichia coli. J. Bacteriol. 188(8), 3073-3087.
Dabard, J., Bridonneau, C., Phillipe, C., Anglade, P., Molle, D., Nardi, M., Ladire, M.,
Girardin, H., Marcille, F., Gomez, A. & Fons, M. (2001) Ruminococcin A, a new
lantibiotic produced by a Ruminococcus gnavus strain isolated from human feces. Appl
Environ Microbiol 67(9), 4111-8.
Danese, P.N., Pratt, L.A., Dove, S.L. & Kolter, R. (2000a) The outer membrane protein,
antigen 43, mediates cell-to-cell interactions within Escherichia coli biofilms. Mol
Microbiol 37(2), 424-32.
Danese, P.N., Pratt, L.A. & Kolter, R. (2000b) Exopolysaccharide production is required for
development of Escherichia coli K-12 biofilm architecture. J Bacteriol 182(12), 3593-6.
Danese, P.N., Pratt, L.A., Kolter, R. & Ron, J.D. (2001) [2] Biofilm formation as a
developmental process. In Methods in Enzymology, Vol. Volume 336, pp. 19-26.
Academic Press.
Danhorn, R., Hentzer, M., Givskov, M., Parsek, M.R. & Fuqua, C. (2004) Phosphorus
limitation enhances biofilm formation of the plant pathogen Agrobacterium tumefaciens
through the PhoR-PhoB regulatory system. J. Bacteriol. 186, 4492-4501.
Davidson, C.J. & Surette, M.G. (2008) Individuality in bacteria. Annu Rev Genet 42, 253-68.
De Araujo, C., Balestrino, D., Roth, L., Charbonnel, N. & Forestier, C. (2010) Quorum
sensing affects biofilm formation through lipopolysaccharide synthesis in Klebsiella
pneumoniae. Research in Microbiology 161(7), 595-603.
Dekker, J., Rossen, J.W., Buller, H.A. & Einerhand, A.W. (2002) The MUC family: an
obituary. Trends Biochem Sci 27(3), 126-31.

126
Destoumieux-Garzon, D., Thomas, X., Santamaria, M., Goulard, C., Barthelemy, M.,
Boscher, B., Bessin, Y., Molle, G., Pons, A.M., Letellier, L., Peduzzi, J. & Rebuffat,
S. (2003) Microcin E492 antibacterial activity: evidence for a TonB-dependent inner
membrane permeabilization on Escherichia coli. Mol Microbiol 49(4), 1031-41.
Dethlefsen, L., McFall-Ngai, M. & Relman, D.A. (2007) An ecological and evolutionary
perspective on human-microbe mutualism and disease. Nature 449(7164), 811-8.
Dickschat, J.S. (2010) Quorum sensing and bacterial biofilms. Natural Product Reports 27(3),
343-369.
Diderichsen, B. (1980) flu, a metastable gene controlling surface properties of Escherichia coli.
J Bacteriol 141(2), 858-67.
Domig, K.J., Mayer, H.K. & Kneifel, W. (2003) Methods used for the isolation, enumeration,
characterisation and identification of Enterococcus spp. 2. Pheno- and genotypic criteria.
Int J Food Microbiol 88(2-3), 165-88.
Dong, T. & Schellhorn, H. (2009) Control of RpoS in global gene expression of Escherichia
coli in minimal media. Molecular Genetics and Genomics 281(1), 19-33.
Donlan, R.M. (2002) Biofilms: microbial life on surfaces. Emerg Infect Dis 8(9), 881-90.
Dorel, C., Lejeune, P. & Rodrigue, A. (2006) The Cpx system of Escherichia coli, a strategic
signaling pathway for confronting adverse conditions and for settling biofilm
communities? Res Microbiol 157(4), 306-14.
Dorel, C., Vidal, O., Prigent-Combaret, C., Vallet, I. & Lejeune, P. (1999) Involvement of
the Cpx signal transduction pathway of E. coli in biofilm formation. FEMS Microbiol
Lett 178(1), 169-75.
Dorman, C.J. (2004) H-NS: a universal regulator for a dynamic genome. Nat Rev Microbiol
2(5), 391-400.
Dorman, C.J. (2007) H-NS, the genome sentinel. Nat Rev Microbiol 5(2), 157-61.
Dorman, C.J., Allen I. Laskin, S.S. & Geoffrey, M.G. (2009) Chapter 2 Nucleoid-Associated
Proteins and Bacterial Physiology. In Advances in Applied Microbiology, Vol. Volume
67, pp. 47-64. Academic Press.
Drago, L., Gismondo, M.R., Lombardi, A., de Haen, C. & Gozzini, L. (1997) Inhibition of in
vitro growth of enteropathogens by new Lactobacillus isolates of human intestinal origin.
FEMS Microbiol Lett 153(2), 455-63.
Dubnau, D. & Losick, R. (2006) Bistability in bacteria. Mol Microbiol 61(3), 564-72.
Duerkop, B.A., Vaishnava, S. & Hooper, L.V. (2009) Immune responses to the microbiota at
the intestinal mucosal surface. Immunity 31(3), 368-76.
127
Dulla, G. & Lindow, S.E. (2008) Quorum size of Pseudomonas syringae is small and dictated
by water availability on the leaf surface. Proc Natl Acad Sci U S A 105(8), 3082-7.
Duncan, M.J., Mann, E.L., Cohen, M.S., Ofek, I., Sharon, N. & Abraham, S.N. (2005) The
distinct binding specificities exhibited by enterobacterial type 1 fimbriae are determined
by their fimbrial shafts. J Biol Chem 280(45), 37707-16.
Duquesne, S., Destoumieux-Garzon, D., Peduzzi, J. & Rebuffat, S. (2007) Microcins, gene-
encoded antibacterial peptides from enterobacteria. Nat Prod Rep 24(4), 708-34.
Engelberg-Kulka, H., Hazan, R. & Amitai, S. (2005) mazEF: a chromosomal toxin-antitoxin
module that triggers programmed cell death in bacteria. J Cell Sci 118(Pt 19), 4327-32.
Epstein, E.A. & Chapman, M.R. (2008) Polymerizing the fibre between bacteria and host cells:
the biogenesis of functional amyloid fibres. Cell Microbiol 10(7), 1413-20.
Fakhry, S., Manzo, N., D'Apuzzo, E., Pietrini, L., Sorrentini, I., Ricca, E., De Felice, M. &
Baccigalupi, L. (2009) Characterization of intestinal bacteria tightly bound to the human
ileal epithelium. Res Microbiol 160(10), 817-23.
Fanaro, S., Chierici, R., Guerrini, P. & Vigi, V. (2003) Intestinal microflora in early infancy:
composition and development. Acta Paediatr Suppl 91(441), 48-55.
Federle, M.J. (2009) Autoinducer-2-based chemical communication in bacteria: complexities of
interspecies signaling. Contrib Microbiol 16, 18-32.
Fernandez, L.A. & Berenguer, J. (2000) Secretion and assembly of regular surface structures
in Gram-negative bacteria. FEMS Microbiol Rev 24(1), 21-44.
Fernandez, M., Sanchez-Hidalgo, M., Garcia-Quintans, N., Martinez-Bueno, M., Valdivia,
E., Lopez, P. & Maqueda, M. (2008) Processing of as-48ABC RNA in AS-48 enterocin
production by Enterococcus faecalis. J Bacteriol 190(1), 240-50.
Ferrieres, L. & Clarke, D.J. (2003) The RcsC sensor kinase is required for normal biofilm
formation in Escherichia coli K-12 and controls the expression of a regulon in response to
growth on a solid surface. Mol Microbiol 50(5), 1665-82.
Filoche, S.K., Anderson, S.A. & Sissons, C.H. (2004) Biofilm growth of Lactobacillus species
is promoted by Actinomyces species and Streptococcus mutans. Oral Microbiol Immunol
19(5), 322-6.
Fleming, H.P., Etchells, J.L. & Costilow, R.N. (1975) Microbial inhibition by an isolate of
pediococcus from cucumber brines. Appl Microbiol 30(6), 1040-2.
Flint, H.J., Duncan, S.H., Scott, K.P. & Louis, P. (2007) Interactions and competition within
the microbial community of the human colon: links between diet and health. Environ
Microbiol 9(5), 1101-11.

128
Foster, J.S., Palmer, R.J., Jr. & Kolenbrander, P.E. (2003) Human oral cavity as a model for
the study of genome-genome interactions. Biol Bull 204(2), 200-4.
Francez-Charlot, A., Laugel, B., Van Gemert, A., Dubarry, N., Wiorowski, F., Castanie-
Cornet, M.P., Gutierrez, C. & Cam, K. (2003) RcsCDB His-Asp phosphorelay system
negatively regulates the flhDC operon in Escherichia coli. Mol Microbiol 49(3), 823-32.
Gally, D.L., Bogan, J.A., Eisenstein, B.I. & Blomfield, I.C. (1993) Environmental regulation
of the fim switch controlling type 1 fimbrial phase variation in Escherichia coli K-12:
effects of temperature and media. J Bacteriol 175(19), 6186-93.
Gally, D.L., Leathart, J. & Blomfield, I.C. (1996) Interaction of FimB and FimE with the fim
switch that controls the phase variation of type 1 fimbriae in Escherichia coli K-12. Mol
Microbiol 21(4), 725-38.
Gay, P., Le Coq, D., Steinmetz, M., Berkelman, T. & Kado, C.I. (1985) Positive selection
procedure for entrapment of insertion sequence elements in gram-negative bacteria. J
Bacteriol 164(2), 918-21.
Gebbink, M.F., Claessen, D., Bouma, B., Dijkhuizen, L. & Wosten, H.A. (2005) Amyloids--a
functional coat for microorganisms. Nat Rev Microbiol 3(4), 333-41.
Germino, J. & Bastia, D. (1983) Interaction of the plasmid R6K-encoded replication initiator
protein with its binding sites on DNA. Cell 34(1), 125-34.
Gerstel, U., Kolb, A. & Romling, U. (2006) Regulatory components at the csgD promoter--
additional roles for OmpR and integration host factor and role of the 5' untranslated
region. FEMS Microbiol Lett 261(1), 109-17.
Gerstel, U. & Romling, U. (2001) Oxygen tension and nutrient starvation are major signals that
regulate agfD promoter activity and expression of the multicellular morphotype in
Salmonella typhimurium. Environ Microbiol 3(10), 638-48.
Ghigo, J.M. (2001) Natural conjugative plasmids induce bacterial biofilm development. Nature
412(6845), 442-5.
Gillor, O., Etzion, A. & Riley, M. (2008) The dual role of bacteriocins as anti- and probiotics.
Applied Microbiology and Biotechnology 81(4), 591-606.
Gomez, A., Ladire, M., Marcille, F. & Fons, M. (2002) Trypsin mediates growth phase-
dependent transcriptional tegulation of genes involved in biosynthesis of ruminococcin A,
a lantibiotic produced by a Ruminococcus gnavus strain from a human intestinal
microbiota. J Bacteriol 184(1), 18-28.
Gophna, U., Barlev, M., Seijffers, R., Oelschlager, T.A., Hacker, J. & Ron, E.Z. (2001) Curli
fibers mediate internalization of Escherichia coli by eukaryotic cells. Infect Immun 69(4),
2659-65.

129
Gophna, U., Oelschlaeger, T.A., Hacker, J. & Ron, E.Z. (2002) Role of fibronectin in curli-
mediated internalization. FEMS Microbiol Lett 212(1), 55-8.
Goulter, R.M., Gentle, I.R. & Dykes, G.A. (2010) Characterisation of curli production, cell
surface hydrophobicity, autoaggregation and attachment behaviour of Escherichia coli
O157. Curr Microbiol 61(3), 157-62.
Grantcharova, N., Peters, V., Monteiro, C., Zakikhany, K. & Romling, U. (2010) Bistable
expression of CsgD in biofilm development of Salmonella enterica serovar typhimurium.
J Bacteriol 192(2), 456-66.
Gratia, A. (1925) Sur un remarquable exemple d'antagonisme entre deux souches de coilbacille.
Comp Rend Soc Biol 93, 1040-1041.
Gualdi, L., Tagliabue, L., Bertagnoli, S., Ierano, T., De Castro, C. & Landini, P. (2008)
Cellulose modulates biofilm formation by counteracting curli-mediated colonization of
solid surfaces in Escherichia coli. Microbiology 154(Pt 7), 2017-24.
Guarner, F., Bourdet-Sicard, R., Brandtzaeg, P., Gill, H.S., McGuirk, P., van Eden, W.,
Versalovic, J., Weinstock, J.V. & Rook, G.A. (2006) Mechanisms of disease: the
hygiene hypothesis revisited. Nat Clin Pract Gastroenterol Hepatol 3(5), 275-84.
Guarner, F. & Malagelada, J.R. (2003) Gut flora in health and disease. Lancet 361(9356), 512-
9.
Haagensen, J.A., Klausen, M., Ernst, R.K., Miller, S.I., Folkesson, A., Tolker-Nielsen, T. &
Molin, S. (2007) Differentiation and distribution of colistin- and sodium dodecyl sulfate-
tolerant cells in Pseudomonas aeruginosa biofilms. J Bacteriol 189(1), 28-37.
Haagmans, W. & van der Woude, M. (2000) Phase variation of Ag43 in Escherichia coli:
Dam-dependent methylation abrogates OxyR binding and OxyR-mediated repression of
transcription. Mol Microbiol 35(4), 877-87.
Hagiwara, D., Sugiura, M., Oshima, T., Mori, H., Aiba, H., Yamashino, T. & Mizuno, T. (2003) Genome-wide analyses revealing a signaling network of the RcsC-YojN-RcsB
phosphorelay system in Escherichia coli. J Bacteriol 185(19), 5735-46.
Hahn, E., Wild, P., Hermanns, U., Sebbel, P., Glockshuber, R., Haner, M., Taschner, N.,
Burkhard, P., Aebi, U. & Muller, S.A. (2002) Exploring the 3D molecular architecture
of Escherichia coli type 1 pili. J Mol Biol 323(5), 845-57.
Hall-Stoodley, L. & Stoodley, P. (2005) Biofilm formation and dispersal and the transmission
of human pathogens. Trends Microbiol 13(1), 7-10.
Hammar, M., Arnqvist, A., Bian, Z., Olsen, A. & Normark, S. (1995) Expression of two csg
operons is required for production of fibronectin- and congo red-binding curli polymers
in Escherichia coli K-12. Mol Microbiol 18(4), 661-70.

130
Hanna, A., Berg, M., Stout, V. & Razatos, A. (2003) Role of capsular colanic acid in adhesion
of uropathogenic Escherichia coli. Appl Environ Microbiol 69(8), 4474-81.
Hansen, S.K., Rainey, P.B., Haagensen, J.A. & Molin, S. (2007) Evolution of species
interactions in a biofilm community. Nature 445(7127), 533-6.
Haruta, S., Kato, S., Yamamoto, K. & Igarashi, Y. (2009) Intertwined interspecies
relationships: approaches to untangle the microbial network. Environ Microbiol 11(12),
2963-9.
Hasman, H., Chakraborty, T. & Klemm, P. (1999) Antigen-43-mediated autoaggregation of
Escherichia coli is blocked by fimbriation. J Bacteriol 181(16), 4834-41.
Hassan, A.N., Birt, D.M. & Frank, J.F. (2004) Behavior of Listeria monocytogenes in a
Pseudomonas putida biofilm on a condensate-forming surface. J Food Prot 67(2), 322-7.
Hayashi, K., Morooka, N., Yamamoto, Y., Fujita, K., Isono, K., Choi, S., Ohtsubo, E., Baba,
T., Wanner, B.L., Mori, H. & Horiuchi, T. (2006) Highly accurate genome sequences
of Escherichia coli K-12 strains MG1655 and W3110. Mol Syst Biol 2, 2006 0007.
Hazan, R., Sat, B. & Engelberg-Kulka, H. (2004) Escherichia coli mazEF-mediated cell death
is triggered by various stressful conditions. J Bacteriol 186(11), 3663-9.
Heijenoort, J.v. (2001) Formation of the glycan chains in the synthesis of bacterial
peptidoglycan. Glycobiology 11(3), 25R-36R.
Henderson, I.R. & Owen, P. (1999) The major phase-variable outer membrane protein of
Escherichia coli structurally resembles the immunoglobulin A1 protease class of exported
protein and is regulated by a novel mechanism involving Dam and oxyR. J Bacteriol
181(7), 2132-41.
Herwald, H., Morgelin, M., Olsen, A., Rhen, M., Dahlback, B., Muller-Esterl, W. & Bjorck,
L. (1998) Activation of the contact-phase system on bacterial surfaces--a clue to serious
complications in infectious diseases. Nat Med 4(3), 298-302.
Heydorn, A., Nielsen, A.T., Hentzer, M., Sternberg, C., Givskov, M., Ersboll, B.K. & Molin,
S. (2000) Quantification of biofilm structures by the novel computer program
COMSTAT. Microbiology 146 ( Pt 10), 2395-407.
Hibbing, M.E., Fuqua, C., Parsek, M.R. & Peterson, S.B. (2010) Bacterial competition:
surviving and thriving in the microbial jungle. Nat Rev Microbiol 8(1), 15-25.
Hidalgo, G., Chen, X., Hay, A.G. & Lion, L.W. (2010) Curli Produced by Escherichia coli
PHL628 Provide Protection from Hg(II). Appl. Environ. Microbiol. 76(20), 6939-6941.
Hoffman, L.R., D'Argenio, D.A., MacCoss, M.J., Zhang, Z., Jones, R.A. & Miller, S.I. (2005)
Aminoglycoside antibiotics induce bacterial biofilm formation. Nature 436(7054), 1171-
5.

131
Holden, N.J., Totsika, M., Mahler, E., Roe, A.J., Catherwood, K., Lindner, K., Dobrindt, U.
& Gally, D.L. (2006) Demonstration of regulatory cross-talk between P fimbriae and
type 1 fimbriae in uropathogenic Escherichia coli. Microbiology 152(Pt 4), 1143-53.
Holmqvist, E., Reimegard, J., Sterk, M., Grantcharova, N., Romling, U. & Wagner, E.G. (2010) Two antisense RNAs target the transcriptional regulator CsgD to inhibit curli
synthesis. EMBO J 29(11), 1840-50.
Hoskins, L.C., Agustines, M., McKee, W.B., Boulding, E.T., Kriaris, M. & Niedermeyer, G. (1985) Mucin degradation in human colon ecosystems. Isolation and properties of fecal
strains that degrade ABH blood group antigens and oligosaccharides from mucin
glycoproteins. J Clin Invest 75(3), 944-53.
Hu, Z., Hidalgo, G., Houston, P.L., Hay, A.G., Shuler, M.L., Abruna, H.D., Ghiorse, W.C.
& Lion, L.W. (2005) Determination of spatial distributions of zinc and active biomass in
microbial biofilms by two-photon laser scanning microscopy. Appl Environ Microbiol
71(7), 4014-21.
Hu, Z., Jin, J., Abruna, H.D., Houston, P.L., Hay, A.G., Ghiorse, W.C., Shuler, M.L.,
Hidalgo, G. & Lion, L.W. (2007) Spatial distributions of copper in microbial biofilms
by scanning electrochemical microscopy. Environ Sci Technol 41(3), 936-41.
Huang, Y.H., Ferrieres, L. & Clarke, D.J. (2006) The role of the Rcs phosphorelay in
Enterobacteriaceae. Res Microbiol 157(3), 206-12.
Hung, D.T., Zhu, J., Sturtevant, D. & Mekalanos, J.J. (2006) Bile acids stimulate biofilm
formation in Vibrio cholerae. Mol Microbiol 59(1), 193-201.
Jeter, C. & Matthysse, A.G. (2005) Characterization of the binding of diarrheagenic strains of
E. coli to plant surfaces and the role of curli in the interaction of the bacteria with alfalfa
sprouts. Mol Plant Microbe Interact 18(11), 1235-42.
Jonas, K., Tomenius, H., Kader, A., Normark, S., Romling, U., Belova, L.M. & Melefors, O. (2007) Roles of curli, cellulose and BapA in Salmonella biofilm morphology studied by
atomic force microscopy. BMC Microbiol 7, 70.
Jubelin, G., Vianney, A., Beloin, C., Ghigo, J.M., Lazzaroni, J.C., Lejeune, P. & Dorel, C. (2005) CpxR/OmpR interplay regulates curli gene expression in response to osmolarity in
Escherichia coli. J Bacteriol 187(6), 2038-49.
Kaplan, J.B. (2010) Biofilm dispersal: mechanisms, clinical implications, and potential
therapeutic uses. J Dent Res 89(3), 205-18.
Kikuchi, T., Mizunoe, Y., Takade, A., Naito, S. & Yoshida, S. (2005) Curli fibers are required
for development of biofilm architecture in Escherichia coli K-12 and enhance bacterial
adherence to human uroepithelial cells. Microbiol Immunol 49(9), 875-84.

132
Kjaergaard, K., Schembri, M.A., Hasman, H. & Klemm, P. (2000a) Antigen 43 from
Escherichia coli induces inter- and intraspecies cell aggregation and changes in colony
morphology of Pseudomonas fluorescens. J Bacteriol 182(17), 4789-96.
Kjaergaard, K., Schembri, M.A., Ramos, C., Molin, S. & Klemm, P. (2000b) Antigen 43
facilitates formation of multispecies biofilms. Environ Microbiol 2(6), 695-702.
Klausen, M., Heydorn, A., Ragas, P., Lambertsen, L., Aaes-Jorgensen, A., Molin, S. &
Tolker-Nielsen, T. (2003) Biofilm formation by Pseudomonas aeruginosa wild type,
flagella and type IV pili mutants. Mol Microbiol 48(6), 1511-24.
Klayman, B.J., Volden, P.A., Stewart, P.S. & Camper, A.K. (2009) Escherichia coli O157:H7
Requires Colonizing Partner to Adhere and Persist in a Capillary Flow Cell.
Environmental Science & Technology 43(6), 2105-2111.
Klebensberger, J., Lautenschlager, K., Bressler, D., Wingender, J. & Philipp, B. (2007)
Detergent-induced cell aggregation in subpopulations of Pseudomonas aeruginosa as a
preadaptive survival strategy. Environ Microbiol 9(9), 2247-59.
Klemm, P. (1986) Two regulatory fim genes, fimB and fimE, control the phase variation of type
1 fimbriae in Escherichia coli. EMBO J 5(6), 1389-93.
Klemm, P., Hjerrild, L., Gjermansen, M. & Schembri, M.A. (2004) Structure-function
analysis of the self-recognizing Antigen 43 autotransporter protein from Escherichia coli.
Mol Microbiol 51(1), 283-96.
Kolenbrander, P.E. (2000) Oral microbial communities: biofilms, interactions, and genetic
systems. Annu Rev Microbiol 54, 413-37.
Kolenbrander, P.E., Palmer, R.J., Periasamy, S. & Jakubovics, N.S. (2010) Oral
multispecies biofilm development and the key role of cell-cell distance. Nat Rev Micro
8(7), 471-480.
Kolodkin-Gal, I. & Engelberg-Kulka, H. (2006) Induction of Escherichia coli chromosomal
mazEF by stressful conditions causes an irreversible loss of viability. J Bacteriol 188(9),
3420-3.
Komlos, J., Cunningham, A.B., Camper, A.K. & Sharp, R.R. (2005) Interaction of Klebsiella
oxytoca and Burkholderia cepacia in dual-species batch cultures and biofilms as a
function of growth rate and substrate concentration. Microb Ecol 49(1), 114-25.
Koo, H., Xiao, J., Klein, M.I. & Jeon, J.G. (2010) Exopolysaccharides Produced by
Streptococcus mutans Glucosyltransferases Modulate the Establishment of Microcolonies
within Multispecies Biofilms. J. Bacteriol. 192(12), 3024-3032.
Korea, C.G., Badouraly, R., Prevost, M.C., Ghigo, J.M. & Beloin, C. (2010) Escherichia coli
K-12 possesses multiple cryptic but functional chaperone-usher fimbriae with distinct
surface specificities. Environ Microbiol 12(7), 1957-77.
133
Landini, P. (2009) Cross-talk mechanisms in biofilm formation and responses to environmental
and physiological stress in Escherichia coli. Research in Microbiology 160(4), 259-266.
Landry, R.M., An, D., Hupp, J.T., Singh, P.K. & Parsek, M.R. (2006) Mucin-Pseudomonas
aeruginosa interactions promote biofilm formation and antibiotic resistance. Mol
Microbiol 59(1), 142-51.
Ledder, R.G., Timperley, A.S., Friswell, M.K., Macfarlane, S. & McBain, A.J. (2008)
Coaggregation between and among human intestinal and oral bacteria. FEMS Microbiol
Ecol 66(3), 630-6.
Lequette, Y. & Greenberg, E.P. (2005) Timing and localization of rhamnolipid synthesis gene
expression in Pseudomonas aeruginosa biofilms. J Bacteriol 187(1), 37-44.
Lievin-Le Moal, V. & Servin, A.L. (2006) The front line of enteric host defense against
unwelcome intrusion of harmful microorganisms: mucins, antimicrobial peptides, and
microbiota. Clin Microbiol Rev 19(2), 315-37.
Lillehoj, E.P., Hyun, S.W., Kim, B.T., Zhang, X.G., Lee, D.I., Rowland, S. & Kim, K.C. (2001) Muc1 mucins on the cell surface are adhesion sites for Pseudomonas aeruginosa.
Am J Physiol Lung Cell Mol Physiol 280(1), L181-7.
Lindberg, S., Xia, Y., Sonden, B., Goransson, M., Hacker, J. & Uhlin, B.E. (2008)
Regulatory Interactions among adhesin gene systems of uropathogenic Escherichia coli.
Infect Immun 76(2), 771-80.
Little, A.E., Robinson, C.J., Peterson, S.B., Raffa, K.F. & Handelsman, J. (2008) Rules of
engagement: interspecies interactions that regulate microbial communities. Annu Rev
Microbiol 62, 375-401.
Liu, Y. & Li, J. (2008) Role of Pseudomonas aeruginosa biofilm in the initial adhesion, growth
and detachment of Escherichia coli in porous media. Environ Sci Technol 42(2), 443-9.
Lopez, D., Vlamakis, H. & Kolter, R. (2010) Biofilms. Cold Spring Harbor Perspectives in
Biology 2(7).
Lutgendorff, F., Akkermans, L.M. & Soderholm, J.D. (2008) The role of microbiota and
probiotics in stress-induced gastro-intestinal damage. Curr Mol Med 8(4), 282-98.
Luthje, P. & Brauner, A. (2010) Ag43 Promotes Persistence of Uropathogenic Escherichia coli
Isolates in the Urinary Tract. J. Clin. Microbiol. 48(6), 2316-2317.
Macfarlane, G.T. & McBain, A.J. (Eds.) (1999) The human colonic microbiota.: Kluwer
Academic Publishers.
Macfarlane, S. & Dillon, J.F. (2007) Microbial biofilms in the human gastrointestinal tract. J
Appl Microbiol 102(5), 1187-96.

134
Macfarlane, S., Woodmansey, E.J. & Macfarlane, G.T. (2005) Colonization of mucin by
human intestinal bacteria and establishment of biofilm communities in a two-stage
continuous culture system. Appl Environ Microbiol 71(11), 7483-92.
Mack, D.R., Michail, S., Wei, S., McDougall, L. & Hollingsworth, M.A. (1999) Probiotics
inhibit enteropathogenic E. coli adherence in vitro by inducing intestinal mucin gene
expression. Am J Physiol 276(4 Pt 1), G941-50.
Mackie, R.I., Sghir, A. & Gaskins, H.R. (1999) Developmental microbial ecology of the
neonatal gastrointestinal tract. Am J Clin Nutr 69(5), 1035S-1045S.
Majdalani, N. & Gottesman, S. (2005) The Rcs phosphorelay: a complex signal transduction
system. Annu Rev Microbiol 59, 379-405.
Marianovsky, I., Aizenman, E., Engelberg-Kulka, H. & Glaser, G. (2001) The regulation of
the Escherichia coli mazEF promoter involves an unusual alternating palindrome. J Biol
Chem 276(8), 5975-84.
Martin, F.P., Dumas, M.E., Wang, Y., Legido-Quigley, C., Yap, I.K., Tang, H., Zirah, S.,
Murphy, G.M., Cloarec, O., Lindon, J.C., Sprenger, N., Fay, L.B., Kochhar, S., van
Bladeren, P., Holmes, E. & Nicholson, J.K. (2007) A top-down systems biology view
of microbiome-mammalian metabolic interactions in a mouse model. Mol Syst Biol 3,
112.
Martineau, R.L., Stout, V. & Towe, B.C. (2009) Whole cell biosensing via recA::mCherry and
LED-based flow-through fluorometry. Biosens Bioelectron 25(4), 759-66.
McCarthy, J.F. & McKay, L.D. (2004) Colloid transport in the subsurface: past, present, and
future challenges. Vadose Zone Journal 3(2), 326-337.
Merritt, J.H., Kadouri, D.E. & O'Toole, G.A. (2005) Growing and analyzing static biofilms.
Curr Protoc Microbiol Chapter 1, Unit 1B 1.
Miao, H., Ratnasingam, S., Pu, C.S., Desai, M.M. & Sze, C.C. (2009) Dual fluorescence
system for flow cytometric analysis of Escherichia coli transcriptional response in multi-
species context. J Microbiol Methods 76(2), 109-19.
Miller, V.L. & Mekalanos, J.J. (1988) A novel suicide vector and its use in construction of
insertion mutations: osmoregulation of outer membrane proteins and virulence
determinants in Vibrio cholerae requires toxR. J Bacteriol 170(6), 2575-83.
Miller, W.G., Leveau, J.H. & Lindow, S.E. (2000) Improved gfp and inaZ broad-host-range
promoter-probe vectors. Mol Plant Microbe Interact 13(11), 1243-50.
Milton, D.L., O'Toole, R., Horstedt, P. & Wolf-Watz, H. (1996) Flagellin A is essential for
the virulence of Vibrio anguillarum. J Bacteriol 178(5), 1310-9.
135
Moller, S., Sternberg, C., Andersen, J.B., Christensen, B.B., Ramos, J.L., Givskov, M. &
Molin, S. (1998) In situ gene expression in mixed-culture biofilms: evidence of
metabolic interactions between community members. Appl Environ Microbiol 64(2),
721-32.
Moncada, D.M., Kammanadiminti, S.J. & Chadee, K. (2003) Mucin and Toll-like receptors
in host defense against intestinal parasites. Trends Parasitol 19(7), 305-11.
Moniaux, N., Escande, F., Porchet, N., Aubert, J.P. & Batra, S.K. (2001) Structural
organization and classification of the human mucin genes. Front Biosci 6, D1192-206.
Nancharaiah, Y.V., Wattiau, P., Wuertz, S., Bathe, S., Mohan, S.V., Wilderer, P.A. &
Hausner, M. (2003) Dual labeling of Pseudomonas putida with fluorescent proteins for
in situ monitoring of conjugal transfer of the TOL plasmid. Appl Environ Microbiol 69(8),
4846-52.
Nasser, W., Rochman, M. & Muskhelishvili, G. (2002) Transcriptional regulation of fis
operon involves a module of multiple coupled promoters. EMBO J 21(4), 715-24.
Nilsen, T.W. & Graveley, B.R. (2010) Expansion of the eukaryotic proteome by alternative
splicing. Nature 463(7280), 457-63.
O'Toole, G.A., Pratt, L.A., Watnick, P.I., Newman, D.K., Weaver, V.B. & Kolter, R. (1999)
Genetic approaches to study of biofilms. Methods Enzymol 310, 91-109.
Ogasawara, A., Komaki, N., Akai, H., Hori, K., Watanabe, H., Watanabe, T., Mikami, T. &
Matsumoto, T. (2007a) Hyphal formation of Candida albicans is inhibited by salivary
mucin. Biol Pharm Bull 30(2), 284-6.
Ogasawara, H., Hasegawa, A., Kanda, E., Miki, T., Yamamoto, K. & Ishihama, A. (2007b)
Genomic SELEX search for target promoters under the control of the PhoQP-RstBA
signal relay cascade. J Bacteriol 189(13), 4791-9.
Ogasawara, H., Yamada, K., Kori, A., Yamamoto, K. & Ishihama, A. (2010a) Regulation of
the Escherichia coli csgD promoter: interplay between five transcription factors.
Microbiology 156(Pt 8), 2470-83.
Ogasawara, H., Yamamoto, K. & Ishihama, A. (2010b) Regulatory role of MlrA in
transcription activation of csgD, the master regulator of biofilm formation in Escherichia
coli. FEMS Microbiology Letters, no-no.
Okabe, S., Satoh, H. & Watanabe, Y. (1999) In situ analysis of nitrifying biofilms as
determined by in situ hybridization and the use of microelectrodes. Appl Environ
Microbiol 65(7), 3182-91.
Olenych, S.G., Claxton, N.S., Ottenberg, G.K. & Davidson, M.W. (2007) The fluorescent
protein color palette. Curr Protoc Cell Biol Chapter 21, Unit 21 5.

136
Olsen, A., Arnqvist, A., Hammar, M., Sukupolvi, S. & Normark, S. (1993) The RpoS sigma
factor relieves H-NS-mediated transcriptional repression of csgA, the subunit gene of
fibronectin-binding curli in Escherichia coli. Mol Microbiol 7(4), 523-36.
Olsen, A., Jonsson, A. & Normark, S. (1989) Fibronectin binding mediated by a novel class of
surface organelles on Escherichia coli. Nature 338(6217), 652-5.
Ophir, T. & Gutnick, D.L. (1994) A role for exopolysaccharides in the protection of
microorganisms from desiccation. Appl Environ Microbiol 60(2), 740-5.
Orndorff, P.E., Devapali, A., Palestrant, S., Wyse, A., Everett, M.L., Bollinger, R.R. &
Parker, W. (2004) Immunoglobulin-mediated agglutination of and biofilm formation by
Escherichia coli K-12 require the type 1 pilus fiber. Infect Immun 72(4), 1929-38.
Otto, K., Norbeck, J., Larsson, T., Karlsson, K.A. & Hermansson, M. (2001) Adhesion of
type 1-fimbriated Escherichia coli to abiotic surfaces leads to altered composition of
outer membrane proteins. J Bacteriol 183(8), 2445-53.
Patterson, G.H. (2007) Fluorescent proteins for cell biology. Methods Mol Biol 411, 47-80.
Pawley, J.B. (2006) Handbook of Biological Confocal Microscopy Berlin: Springer.
Perrin, C., Briandet, R., Jubelin, G., Lejeune, P., Mandrand-Berthelot, M.A., Rodrigue, A.
& Dorel, C. (2009) Nickel promotes biofilm formation by Escherichia coli K-12 strains
that produce curli. Appl Environ Microbiol 75(6), 1723-33.
Pesavento, C., Becker, G., Sommerfeldt, N., Possling, A., Tschowri, N., Mehlis, A. &
Hengge, R. (2008) Inverse regulatory coordination of motility and curli-mediated
adhesion in Escherichia coli. Genes & Development 22(17), 2434-2446.
Pool-Zobel, B., Veeriah, S. & Bohmer, F.D. (2005) Modulation of xenobiotic metabolising
enzymes by anticarcinogens -- focus on glutathione S-transferases and their role as
targets of dietary chemoprevention in colorectal carcinogenesis. Mutat Res 591(1-2), 74-
92.
Possemiers, S., Bolca, S., Verstraete, W. & Heyerick, A. (2010) The intestinal microbiome: A
separate organ inside the body with the metabolic potential to influence the bioactivity of
botanicals. Fitoterapia.
Pratt, L.A., Hsing, W., Gibson, K.E. & Silhavy, T.J. (1996) From acids to osmZ: multiple
factors influence synthesis of the OmpF and OmpC porins in Escherichia coli. Mol
Microbiol 20(5), 911-7.
Pratt, L.A. & Kolter, R. (1998) Genetic analysis of Escherichia coli biofilm formation: roles of
flagella, motility, chemotaxis and type I pili. Mol Microbiol 30(2), 285-93.
Prigent-Combaret, C., Brombacher, E., Vidal, O., Ambert, A., Lejeune, P., Landini, P. &
Dorel, C. (2001) Complex regulatory network controls initial adhesion and biofilm
137
formation in Escherichia coli via regulation of the csgD gene. J Bacteriol 183(24), 7213-
23.
Prigent-Combaret, C. & Lejeune, P. (1999) Monitoring gene expression in biofilms. Methods
Enzymol 310, 56-79.
Prigent-Combaret, C., Prensier, G., Le Thi, T.T., Vidal, O., Lejeune, P. & Dorel, C. (2000)
Developmental pathway for biofilm formation in curli-producing Escherichia coli strains:
role of flagella, curli and colanic acid. Environ Microbiol 2(4), 450-64.
Prigent-Combaret, C., Vidal, O., Dorel, C. & Lejeune, P. (1999) Abiotic surface sensing and
biofilm-dependent regulation of gene expression in Escherichia coli. J Bacteriol 181(19),
5993-6002.
Probert, H.M. & Gibson, G.R. (2002) Bacterial biofilms in the human gastrointestinal tract.
Curr Issues Intest Microbiol 3(2), 23-7.
Pruss, B.M., Besemann, C., Denton, A. & Wolfe, A.J. (2006) A Complex Transcription
Network Controls the Early Stages of Biofilm Development by Escherichia coli. J.
Bacteriol. 188(11), 3731-3739.
Pultz, N.J., Hoskins, L.C. & Donskey, C.J. (2006) Vancomycin-resistant Enterococci may
obtain nutritional support by scavenging carbohydrate fragments generated during mucin
degradation by the anaerobic microbiota of the colon. Microb Drug Resist 12(1), 63-7.
Pumbwe, L., Skilbeck, C.A., Nakano, V., Avila-Campos, M.J., Piazza, R.M. & Wexler, H.M. (2007) Bile salts enhance bacterial co-aggregation, bacterial-intestinal epithelial cell
adhesion, biofilm formation and antimicrobial resistance of Bacteroides fragilis. Microb
Pathog 43(2-3), 78-87.
Qin, J., Li, R., Raes, J., Arumugam, M., Burgdorf, K.S., Manichanh, C., Nielsen, T., Pons,
N., Levenez, F., Yamada, T., Mende, D.R., Li, J., Xu, J., Li, S., Li, D., Cao, J., Wang,
B., Liang, H., Zheng, H., Xie, Y., Tap, J., Lepage, P., Bertalan, M., Batto, J.M.,
Hansen, T., Le Paslier, D., Linneberg, A., Nielsen, H.B., Pelletier, E., Renault, P.,
Sicheritz-Ponten, T., Turner, K., Zhu, H., Yu, C., Jian, M., Zhou, Y., Li, Y., Zhang,
X., Qin, N., Yang, H., Wang, J., Brunak, S., Dore, J., Guarner, F., Kristiansen, K.,
Pedersen, O., Parkhill, J., Weissenbach, J., Bork, P. & Ehrlich, S.D. (2010) A human
gut microbial gene catalogue established by metagenomic sequencing. Nature 464(7285),
59-65.
Raivio, T.L. & Silhavy, T.J. (2001) Periplasmic stress and ECF sigma factors. Annu Rev
Microbiol 55, 591-624.
Rang, C., Galen, J.E., Kaper, J.B. & Chao, L. (2003) Fitness cost of the green fluorescent
protein in gastrointestinal bacteria. Can J Microbiol 49(9), 531-7.
Reid, G. & Bruce, A.W. (2006) Probiotics to prevent urinary tract infections: the rationale and
evidence. World J Urol 24(1), 28-32.

138
Reisner, A., Krogfelt, K.A., Klein, B.M., Zechner, E.L. & Molin, S. (2006) In vitro biofilm
formation of commensal and pathogenic Escherichia coli strains: impact of
environmental and genetic factors. J Bacteriol 188(10), 3572-81.
Remaut, H., Tang, C., Henderson, N.S., Pinkner, J.S., Wang, T., Hultgren, S.J., Thanassi,
D.G., Waksman, G. & Li, H. (2008) Fiber formation across the bacterial outer
membrane by the chaperone/usher pathway. Cell 133(4), 640-52.
Ren, D., Bedzyk, L.A., Thomas, S.M., Ye, R.W. & Wood, T.K. (2004) Gene expression in
Escherichia coli biofilms. Appl Microbiol Biotechnol 64(4), 515-24.
Romling, U. (2002) Molecular biology of cellulose production in bacteria. Res Microbiol 153(4),
205-12.
Romling, U., Sierralta, W.D., Eriksson, K. & Normark, S. (1998) Multicellular and
aggregative behaviour of Salmonella typhimurium strains is controlled by mutations in
the agfD promoter. Mol Microbiol 28(2), 249-64.
Ruas-Madiedo, P., Gueimonde, M., Fernandez-Garcia, M., de los Reyes-Gavilan, C.G. &
Margolles, A. (2008) Mucin degradation by Bifidobacterium strains isolated from the
human intestinal microbiota. Appl Environ Microbiol 74(6), 1936-40.
Ryu, J.H. & Beuchat, L.R. (2005) Biofilm formation by Escherichia coli O157:H7 on stainless
steel: effect of exopolysaccharide and Curli production on its resistance to chlorine. Appl
Environ Microbiol 71(1), 247-54.
Sachs, J.L., Mueller, U.G., Wilcox, T.P. & Bull, J.J. (2004) The evolution of cooperation. Q
Rev Biol 79(2), 135-60.
Saini, S., Slauch, J.M., Aldridge, P.D. & Rao, C.V. (2010) The role of crosstalk in regulating
the dynamic expression of the flagellar, Salmonella pathogenicity island 1 (SPI1), and
type 1 fimbrial genes. J. Bacteriol., JB.00624-10.
Saldana, Z., Xicohtencatl-Cortes, J., Avelino, F., Phillips, A.D., Kaper, J.B., Puente, J.L. &
Giron, J.A. (2009) Synergistic role of curli and cellulose in cell adherence and biofilm
formation of attaching and effacing Escherichia coli and identification of Fis as a
negative regulator of curli. Environ Microbiol 11(4), 992-1006.
Salta, M., Wharton, J.A., Stoodley, P., Dennington, S.P., Goodes, L.R., Werwinski, S.p.,
Mart, U., Wood, R.J.K. & Stokes, K.R. (2010) Designing biomimetic antifouling
surfaces. Philosophical Transactions of the Royal Society A: Mathematical,
Physical and Engineering Sciences 368(1929), 4729-4754.
Sambrook, J. & Russell, D.W. (Eds.) (2001) Molecular cloning: A laboratory manual. Cold
Spring Harbor.
139
Sat, B., Hazan, R., Fisher, T., Khaner, H., Glaser, G. & Engelberg-Kulka, H. (2001)
Programmed cell death in Escherichia coli: some antibiotics can trigger mazEF lethality.
J Bacteriol 183(6), 2041-5.
Sauer, F.G., Mulvey, M.A., Schilling, J.D., Martinez, J.J. & Hultgren, S.J. (2000) Bacterial
pili: molecular mechanisms of pathogenesis. Curr Opin Microbiol 3(1), 65-72.
Sauer, K. & Camper, A.K. (2001) Characterization of phenotypic changes in Pseudomonas
putida in response to surface-associated growth. J Bacteriol 183(22), 6579-89.
Sauer, K., Camper, A.K., Ehrlich, G.D., Costerton, J.W. & Davies, D.G. (2002)
Pseudomonas aeruginosa displays multiple phenotypes during development as a biofilm.
J Bacteriol 184(4), 1140-54.
Schembri, M.A., Hjerrild, L., Gjermansen, M. & Klemm, P. (2003a) Differential expression
of the Escherichia coli autoaggregation factor antigen 43. J Bacteriol 185(7), 2236-42.
Schembri, M.A., Kjaergaard, K. & Klemm, P. (2003b) Global gene expression in Escherichia
coli biofilms. Mol Microbiol 48(1), 253-67.
Schembri, M.A. & Klemm, P. (2001) Coordinate gene regulation by fimbriae-induced signal
transduction. EMBO J 20(12), 3074-81.
Schilling, J.D., Mulvey, M.A. & Hultgren, S.J. (2001) Structure and function of Escherichia
coli type 1 pili: new insight into the pathogenesis of urinary tract infections. J Infect Dis
183 Suppl 1, S36-40.
Shaner, N.C., Campbell, R.E., Steinbach, P.A., Giepmans, B.N., Palmer, A.E. & Tsien, R.Y. (2004) Improved monomeric red, orange and yellow fluorescent proteins derived from
Discosoma sp. red fluorescent protein. Nat Biotechnol 22(12), 1567-72.
Shaner, N.C., Lin, M.Z., McKeown, M.R., Steinbach, P.A., Hazelwood, K.L., Davidson,
M.W. & Tsien, R.Y. (2008) Improving the photostability of bright monomeric orange
and red fluorescent proteins. Nat Methods 5(6), 545-51.
Shaner, N.C., Patterson, G.H. & Davidson, M.W. (2007) Advances in fluorescent protein
technology. J Cell Sci 120(Pt 24), 4247-60.
Shaner, N.C., Steinbach, P.A. & Tsien, R.Y. (2005) A guide to choosing fluorescent proteins.
Nat Methods 2(12), 905-9.
Sharma, R., Young, C. & Neu, J. (2010) Molecular modulation of intestinal epithelial barrier:
contribution of microbiota. J Biomed Biotechnol 2010, 305879.
Shimomura, O., Johnson, F.H. & Saiga, Y. (1962) Extraction, purification and properties of
aequorin, a bioluminescent protein from the luminous hydromedusan, Aequorea. J Cell
Comp Physiol 59, 223-39.

140
Siebel, M.A. & Characklis, W.G. (1991) Observations of binary population biofilms.
Biotechnol Bioeng 37(8), 778-89.
Simm, R., Morr, M., Kader, A., Nimtz, M. & Römling, U. (2004) GGDEF and EAL domains
inversely regulate cyclic di-GMP levels and transition from sessility to motility.
Molecular Microbiology 53(4), 1123-1134.
Situ, H. & Bobek, L.A. (2000) In vitro assessment of antifungal therapeutic potential of salivary
histatin-5, two variants of histatin-5, and salivary mucin (MUC7) domain 1. Antimicrob
Agents Chemother 44(6), 1485-93.
Sledjeski, D.D. & Gottesman, S. (1996) Osmotic shock induction of capsule synthesis in
Escherichia coli K-12. J Bacteriol 178(4), 1204-6.
Smith, A.M., Callow, J.A., Landini, P., Jubelin, G. & Dorel-Flaman, C. (2006) The
Molecular Genetics of Bioadhesion and Biofilm Formation. In Biological Adhesives, pp.
21-40. Springer Berlin Heidelberg.
Smith, C.L. (2006) Basic confocal microscopy. Curr Protoc Microbiol Chapter 2, Unit 2C 1.
Smyth, C.J., Marron, M.B., Twohig, J.M. & Smith, S.G. (1996) Fimbrial adhesins:
similarities and variations in structure and biogenesis. FEMS Immunol Med Microbiol
16(2), 127-39.
Solano, C., Garcia, B., Valle, J., Berasain, C., Ghigo, J.M., Gamazo, C. & Lasa, I. (2002)
Genetic analysis of Salmonella enteritidis biofilm formation: critical role of cellulose.
Mol Microbiol 43(3), 793-808.
Sommerfeldt, N., Possling, A., Becker, G., Pesavento, C., Tschowri, N. & Hengge, R. (2009)
Gene expression patterns and differential input into curli fimbriae regulation of all
GGDEF/EAL domain proteins in Escherichia coli. Microbiology 155(Pt 4), 1318-31.
Sonnenburg, J.L. (2010) Microbiology: Genetic pot luck. Nature 464(7290), 837-8.
Sorensen, M., Lippuner, C., Kaiser, T., Misslitz, A., Aebischer, T. & Bumann, D. (2003)
Rapidly maturing red fluorescent protein variants with strongly enhanced brightness in
bacteria. FEBS Lett 552(2-3), 110-4.
Soutourina, O.A. & Bertin, P.N. (2003) Regulation cascade of flagellar expression in Gram-
negative bacteria. FEMS Microbiol Rev 27(4), 505-23.
Stepanovic, S., Vukovic, D., Jezek, P., Pavlovic, M. & Svabic-Vlahovic, M. (2001) Influence
of dynamic conditions on biofilm formation by staphylococci. Eur J Clin Microbiol
Infect Dis 20(7), 502-4.
Sternberg, C. & Tolker-Nielsen, T. (2006) Growing and analyzing biofilms in flow cells. Curr
Protoc Microbiol Chapter 1, Unit 1B 2.

141
Stewart, E.J., Madden, R., Paul, G. & Taddei, F. (2005) Aging and death in an organism that
reproduces by morphologically symmetric division. PLoS Biol 3(2), e45.
Stewart, P.S. (2001) Multicellular resistance: biofilms. Trends Microbiol 9(5), 204.
Stewart, P.S., Camper, A.K., Handran, S.D., Huang, C. & Warnecke, M. (1997) Spatial
Distribution and Coexistence of Klebsiella pneumoniae and Pseudomonas aeruginosa in
Biofilms. Microb Ecol 33(1), 2-10.
Stewart, P.S. & Costerton, J.W. (2001) Antibiotic resistance of bacteria in biofilms. Lancet
358(9276), 135-8.
Stoodley, P., Lewandowski, Z., Boyle, J.D. & Lappin-Scott, H.M. (1999) The formation of
migratory ripples in a mixed species bacterial biofilm growing in turbulent flow. Environ
Microbiol 1(5), 447-55.
Stoodley, P., Sauer, K., Davies, D.G. & Costerton, J.W. (2002) Biofilms as complex
differentiated communities. Annu Rev Microbiol 56, 187-209.
Strack, R.L., Hein, B., Bhattacharyya, D., Hell, S.W., Keenan, R.J. & Glick, B.S. (2009) A
rapidly maturing far-red derivative of DsRed-Express2 for whole-cell labeling.
Biochemistry 48(35), 8279-81.
Strack, R.L., Strongin, D.E., Bhattacharyya, D., Tao, W., Berman, A., Broxmeyer, H.E.,
Keenan, R.J. & Glick, B.S. (2008) A noncytotoxic DsRed variant for whole-cell
labeling. Nat Methods 5(11), 955-7.
Strombeck, D.R. & Harrold, D. (1974) Binding of cholera toxin to mucins and inhibition by
gastric mucin. Infect Immun 10(6), 1266-72.
Tagliabue, L., Maciąg, A., Antoniani, D. & Landini, P. (2010) The yddV-dos operon controls
biofilm formation through the regulation of genes encoding curli fibers' subunits in
aerobically growing Escherichia coli. FEMS Immunology & Medical Microbiology 59(3),
477-484.
Tao, W., Evans, B.G., Yao, J., Cooper, S., Cornetta, K., Ballas, C.B., Hangoc, G. &
Broxmeyer, H.E. (2007) Enhanced green fluorescent protein is a nearly ideal long-term
expression tracer for hematopoietic stem cells, whereas DsRed-express fluorescent
protein is not. Stem Cells 25(3), 670-8.
Tiihonen, K., Ouwehand, A.C. & Rautonen, N. (2010) Human intestinal microbiota and
healthy ageing. Ageing Res Rev 9(2), 107-16.
Tilman, D. (2004) Niche tradeoffs, neutrality, and community structure: a stochastic theory of
resource competition, invasion, and community assembly. Proc Natl Acad Sci U S A
101(30), 10854-61.
142
Tong, H., Chen, W., Merritt, J., Qi, F., Shi, W. & Dong, X. (2007) Streptococcus
oligofermentans inhibits Streptococcus mutans through conversion of lactic acid into
inhibitory H2O2: a possible counteroffensive strategy for interspecies competition.
Molecular Microbiology 63(3), 872-880.
Torres, A.G., Zhou, X. & Kaper, J.B. (2005) Adherence of diarrheagenic Escherichia coli
strains to epithelial cells. Infect Immun 73(1), 18-29.
Turnbaugh, P.J. & Gordon, J.I. (2009) The core gut microbiome, energy balance and obesity.
J Physiol 587(Pt 17), 4153-8.
Uhlich, G.A., Cooke, P.H. & Solomon, E.B. (2006) Analyses of the red-dry-rough phenotype
of an Escherichia coli O157:H7 strain and its role in biofilm formation and resistance to
antibacterial agents. Appl Environ Microbiol 72(4), 2564-72.
Uhlich, G.A., Keen, J.E. & Elder, R.O. (2001) Mutations in the csgD promoter associated with
variations in curli expression in certain strains of Escherichia coli O157:H7. Appl
Environ Microbiol 67(5), 2367-70.
Ulett, G.C., Valle, J., Beloin, C., Sherlock, O., Ghigo, J.-M. & Schembri, M.A. (2007)
Functional Analysis of Antigen 43 in Uropathogenic Escherichia coli Reveals a Role in
Long-Term Persistence in the Urinary Tract. Infect. Immun. 75(7), 3233-3244.
Valle, J., Mabbett, A.N., Ulett, G.C., Toledo-Arana, A., Wecker, K., Totsika, M., Schembri,
M.A., Ghigo, J.M. & Beloin, C. (2008) UpaG, a new member of the trimeric
autotransporter family of adhesins in uropathogenic Escherichia coli. J Bacteriol 190(12),
4147-61.
van der Woude, M.W. (2006) Re-examining the role and random nature of phase variation.
FEMS Microbiol Lett 254(2), 190-7.
van der Woude, M.W. & Baumler, A.J. (2004) Phase and antigenic variation in bacteria. Clin
Microbiol Rev 17(3), 581-611, table of contents.
Van Houdt, R. & Michiels, C.W. (2005) Role of bacterial cell surface structures in Escherichia
coli biofilm formation. Res Microbiol 156(5-6), 626-33.
van Loosdrecht, M.C., Lyklema, J., Norde, W., Schraa, G. & Zehnder, A.J. (1987)
Electrophoretic mobility and hydrophobicity as a measured to predict the initial steps of
bacterial adhesion. Appl Environ Microbiol 53(8), 1898-901.
van Merode, A.E., van der Mei, H.C., Busscher, H.J. & Krom, B.P. (2006) Influence of
culture heterogeneity in cell surface charge on adhesion and biofilm formation by
Enterococcus faecalis. J Bacteriol 188(7), 2421-6.
van Oss, C.J. (2003) Long-range and short-range mechanisms of hydrophobic attraction and
hydrophilic repulsion in specific and aspecific interactions. J Mol Recognit 16(4), 177-90.

143
Vermis, K., Vandamme, P.A. & Nelis, H.J. (2002) Enumeration of viable anaerobic bacteria
by solid phase cytometry under aerobic conditions. J Microbiol Methods 50(2), 123-30.
Vianney, A., Jubelin, G., Renault, S., Dorel, C., Lejeune, P. & Lazzaroni, J.C. (2005)
Escherichia coli tol and rcs genes participate in the complex network affecting curli
synthesis. Microbiology 151(Pt 7), 2487-97.
Vidal, O., Longin, R., Prigent-Combaret, C., Dorel, C., Hooreman, M. & Lejeune, P. (1998)
Isolation of an Escherichia coli K-12 mutant strain able to form biofilms on inert surfaces:
involvement of a new ompR allele that increases curli expression. J Bacteriol 180(9),
2442-9.
Vieira, M.A., Gomes, T.A., Ferreira, A.J., Knobl, T., Servin, A.L. & Lievin-Le Moal, V. (2010) Two atypical enteropathogenic Escherichia coli strains induce the production of
secreted and membrane-bound mucins to benefit their own growth at the apical surface of
human mucin-secreting intestinal HT29-MTX cells. Infect Immun 78(3), 927-38.
Vieten, D., Corfield, A., Carroll, D., Ramani, P. & Spicer, R. (2005) Impaired mucosal
regeneration in neonatal necrotising enterocolitis. Pediatr Surg Int 21(3), 153-60.
Waksman, G. & Hultgren, S.J. (2009) Structural biology of the chaperone-usher pathway of
pilus biogenesis. Nat Rev Micro 7(11), 765-774.
Walters, M.C., 3rd, Roe, F., Bugnicourt, A., Franklin, M.J. & Stewart, P.S. (2003)
Contributions of antibiotic penetration, oxygen limitation, and low metabolic activity to
tolerance of Pseudomonas aeruginosa biofilms to ciprofloxacin and tobramycin.
Antimicrob Agents Chemother 47(1), 317-23.
Wang, X., Rochon, M., Lamprokostopoulou, A., Lünsdorf, H., Nimtz, M. & Römling, U. (2006) Impact of biofilm matrix components on interaction of commensal Escherichia
coli with the gastrointestinal cell line HT-29. Cellular and Molecular Life Sciences
63(19), 2352-2363.
Wang, X., Zhou, Y., Ren, J.J., Hammer, N.D. & Chapman, M.R. (2010) Gatekeeper residues
in the major curlin subunit modulate bacterial amyloid fiber biogenesis. Proc Natl Acad
Sci U S A 107(1), 163-8.
Weber, H., Pesavento, C., Possling, A., Tischendorf, G. & Hengge, R. (2006) Cyclic-di-
GMP-mediated signalling within the σS network of Escherichia coli. Molecular
Microbiology 62(4), 1014-1034.
Wei, G.X., Campagna, A.N. & Bobek, L.A. (2006) Effect of MUC7 peptides on the growth of
bacteria and on Streptococcus mutans biofilm. J Antimicrob Chemother 57(6), 1100-9.
Wei, G.X., Campagna, A.N. & Bobek, L.A. (2007) Factors affecting antimicrobial activity of
MUC7 12-mer, a human salivary mucin-derived peptide. Ann Clin Microbiol Antimicrob
6, 14.

144
White, A.P., Gibson, D.L., Grassl, G.A., Kay, W.W., Finlay, B.B., Vallance, B.A. & Surette,
M.G. (2008) Aggregation via the red, dry, and rough morphotype is not a virulence
adaptation in Salmonella enterica serovar Typhimurium. Infect Immun 76(3), 1048-58.
Whiteley, M., Bangera, M.G., Bumgarner, R.E., Parsek, M.R., Teitzel, G.M., Lory, S. &
Greenberg, E.P. (2001) Gene expression in Pseudomonas aeruginosa biofilms. Nature
413(6858), 860-4.
Wolfaardt, G.M., Lawrence, J.R., Robarts, R.D., Caldwell, S.J. & Caldwell, D.E. (1994)
Multicellular organization in a degradative biofilm community. Appl Environ Microbiol
60(2), 434-46.
Wood, T.K., Gonzalez Barrios, A.F., Herzberg, M. & Lee, J. (2006) Motility influences
biofilm architecture in Escherichia coli. Appl Microbiol Biotechnol 72(2), 361-7.
Xie, Y., Yao, Y., Kolisnychenko, V., Teng, C.H. & Kim, K.S. (2006) HbiF regulates type 1
fimbriation independently of FimB and FimE. Infect Immun 74(7), 4039-47.
Yang, F., Wang, J., Li, X., Ying, T., Qiao, S., Li, D. & Wu, G. (2007) 2-DE and MS analysis
of interactions between Lactobacillus fermentum I5007 and intestinal epithelial cells.
Electrophoresis 28(23), 4330-9.
Zakikhany, K., Harrington, C.R., Nimtz, M., Hinton, J.C. & Romling, U. (2010)
Unphosphorylated CsgD controls biofilm formation in Salmonella enterica serovar
Typhimurium. Mol Microbiol 77(3), 771-86.
Zaslaver, A., Bren, A., Ronen, M., Itzkovitz, S., Kikoin, I., Shavit, S., Liebermeister, W.,
Surette, M.G. & Alon, U. (2006) A comprehensive library of fluorescent transcriptional
reporters for Escherichia coli. Nat Methods 3(8), 623-8.
Zhang, H., Tsang, T.K., Jack, C.A. & Pollack, J. (2002) Role of bile mucin in bacterial
adherence to biliary stents. J Lab Clin Med 139(1), 28-34.
Zhao, L. (2010) Genomics: The tale of our other genome. Nature 465(7300), 879-880.
Zobell, C.E. & Anderson, D.Q. (1936) OBSERVATIONS ON THE MULTIPLICATION OF
BACTERIA IN DIFFERENT VOLUMES OF STORED SEA WATER AND THE
INFLUENCE OF OXYGEN TENSION AND SOLID SURFACES. Biol Bull 71(2), 324-
342.
Zogaj, X., Bokranz, W., Nimtz, M. & Romling, U. (2003) Production of cellulose and curli
fimbriae by members of the family Enterobacteriaceae isolated from the human
gastrointestinal tract. Infect Immun 71(7), 4151-8.
Zogaj, X., Nimtz, M., Rohde, M., Bokranz, W. & Romling, U. (2001) The multicellular
morphotypes of Salmonella typhimurium and Escherichia coli produce cellulose as the
second component of the extracellular matrix. Mol Microbiol 39(6), 1452-63.