Embed Size (px)
Citation preview

MTN GroupLimited
Interim financial resultsfor the six months ended 30 June 2019
* Constant currency information after accounting for the impact of the pro forma adjustments as defined and IFRS 16 for comparative purposes
** Reported is IFRS 16 vs IAS 17 ^ IAS 17 2019 vs IAS 17 2018˜ EBITDA is defined as earnings before finance income and finance costs (which includes gains or losses on foreign exchange transactions),
tax, depreciation and amortisation, and is also presented before recognising the following items: Impairment of joint venture and goodwill (MEIH); net monetary gain resulting from the application of hyperinflation; share of results of associates and joint ventures after tax; hyperinflation; tower sale profits; gain on disposal of subsidiary (Cyprus); CBN resolution; and gain on dilution of investment in associates and joint ventures (Travelstart and Jumia). EBITDA after once-off items increased 39,9%**
ROE is calculated based on reported group HEPS of 195 cps plus non-operational impacts of 102 cps.Any forward-looking financial information disclosed in this results announcement has not been reviewed or audited or otherwise reported on by our external joint auditors.Service revenue excludes device and SIM card revenue.Data revenue is mobile and fixed access data and excludes roaming and wholesale.Fintech includes Mobile Money (MoMo), insurance, airtime lending and ecommerce.All financial numbers are year on year (YoY) unless otherwise stated.All subscriber numbers are compared to end December 2018 unless otherwise stated.Pages 9 and 10 provides the impact of IFRS 16 on the numbers disclosed in these results.All prior period financial and non-financial numbers have been adjusted for the disposal of MTN Cyprus for comparability purposes.
Certain information presented in these results constitutes pro forma financial information. This is presented for illustrative purposes only. Because of its nature, the pro forma financial information may not fairly present MTN’s financial position, changes in equity, and results of operations or cash flows. It has not been audited or reviewed or otherwise reported on by our external joint auditors.
1. The financial information presented in these consolidated financial results has been prepared excluding the impact of hyperinflation and the goodwill and asset impairments, tower profits, the Nigerian regulatory fine (consisting of the re-measurement impact when thesettlement was entered into and the finance costs recognised as a result of the unwind of the initial discounting of the liability), gain on dilution of Jumia, impairment of investment in MEIH and gain on Travelstart and impact of IFRS 16 (“the pro forma adjustments”) and constitutes pro forma financial information to the extent that it is not extracted from the segment disclosure included in the reviewed condensed consolidated interim financial statements for the six months ended 30 June 2019. This pro forma financial information has been presented to eliminate the impact of the pro forma adjustments from the consolidated financial results to achieve a comparable YoY analysis. The pro forma adjustments have been calculated in terms of the group accounting policies disclosed in the consolidatedfinancial statements for the year ended 31 December 2018, except for the changes in accounting policies as a result of the adoption of the accounting standards effective 1 January 2019, and the change in the presentation of cash flows.
2. Constant currency information has been presented to illustrate the impact of changes in currency rates on the group’s results. Indetermining the change in constant currency terms, the current financial reporting period’s results have been adjusted to the prior period average exchange rates determined as the average of the monthly exchange rates. The measurement has been performed for each of the group’s currencies, materially being that of the US dollar and Nigerian naira. The constant currency growth percentage has been calculated based on the current year constant currency results compared to the prior year results. In addition, in respect of MTN Irancell, MTN Sudan, MTN South Sudan and MTN Syria, the constant currency information has been prepared excluding the impact ofhyperinflation. The economies of Sudan, South Sudan and Syria were assessed to be hyperinflationary for the period under review and hyperinflation accounting was applied.
The group’s results are presented in line with the group’s operational structure. This is South Africa, Nigeria, the Southern and East Africa and Ghana (SEAGHA) region, the West and Central Africa (WECA) region and the Middle East and North Africa (MENA) region and their respective underlying operations.
The SEAGHA region includes Ghana, Uganda, Zambia, Rwanda, South Sudan, Botswana (held for sale), eSwatini (joint venture-equity accounted) and Business Group. The WECA region includes Cameroon, Ivory Coast, Benin, Congo Brazzaville, Liberia, Guinea Conakry and Guinea Bissau. The MENA region includes Iran (joint venture-equity accounted), Syria, Sudan, Yemen, and Afghanistan. The operation in Cyprus was disposed of and is no longer included in the results effective 4 September 2018.
Although Iran, Botswana and eSwatini form part of their respective regions geographically and operationally, they are excluded from their respective regional results because Iran and eSwatini are equity accounted for by the group and Botswana is held for sale.
Results overview 01 Highlights
02 Results overview
29 Reviewed condensed consolidated interim financial statements
30 Independent auditors’ review on the condensed consolidated interim financial statements
31 Condensed consolidated income statement
32 Condensed consolidated statement of comprehensive income
33 Condensed consolidated statement of financial position
34 Condensed consolidated statement of changes in equity
35 Condensed consolidated statement of cash flows
36 Notes to the condensed consolidated interim financial statements
68 Administration

Results overviewfor the six months ended 30 June 2019
MTN Group Limited Interim financial results for the six months ended 30 June 2019 1Results overview
Highlights
Subscribers
Û 7,7 millionto 240 million
Non-operational impacts; lowered HEPS
by 102 cps (includes 39 cents IFRS 16)
Service revenueÛ 9,7%*
EBITDA~ (before once-off items)
Û 10,2%* (34,7%**)
EBITDA marginimproved to
35,2%* (43,1%**)
Holding Companyleverage stable
at 2,3x
Reported group HEPS
Û 8,8%^to 195 cps
Interim dividend
of 195 cents per share up 11,4%
MTN Group Limited Interim financial results for the six months ended 30 June 20192
Group president and CEO, Rob Shuter comments: “We delivered encouraging results for the period, against the backdrop of difficult trading conditions. South Africa in particular was impacted by a weak economy as well as the implementation of lower out-of-bundle pricing and the new ICASA subscriber regulations in the first quarter of the year. Despite these headwinds, we progressed with our plans to build a digital operator, growing service revenue by 9,7%* and EBITDA by 10,2%*, which supported solid growth in operational earnings. Our holding company leverage ratio remained stable at 2,3x and we reduced our capex intensity to 16,9%^.
Commercial momentum continued, with growth in our subscriber base of 7,7 million, in our active data users of 3,5 million, and in our Mobile Money users of 2,4 million. We now have leading network NPS in more than half of our markets, supported by the continued expansion and quality of our data networks.
We delivered on several strategic projects including the listings of MTN Nigeria on the Nigerian Stock Exchange and Jumia, our e-commerce venture, on the New York Stock Exchange. The asset realisation programme delivered R2,1 billion to the group in the second quarter, we launched our Ayoba messaging platform in 3 markets and we were awarded a super-agent licence in Nigeria, enabling the expansion of our fintech business.
We remain focused on building our digital operator strategy, focusing on being a scale player in both our evolving telco services as well as digital and fintech and delivering on our medium-term targets.”
OverviewMTN reported encouraging operational results for the 6 months as we remained focused on
executing our BRIGHT strategy. We continued to grow service revenue ahead of inflation, to
increase our margin on earnings before interest, taxation, depreciation and amortisation
(EBITDA) slightly and to reduce capital expenditure (capex) intensity.
Macroeconomic conditions were challenging, particularly in South Africa, with the economy
contracting in the first quarter and the rand weakening against the US dollar.
Group service revenue increased by 9,7%* in constant currency terms. This was led by growth
of 12,2%* by MTN Nigeria, 18,7%* by MTN Ghana and 3,3% by MTN South Africa. The
performance of MTN South Africa was impacted by changes to out-of-bundle (OOB) tariffs
and a reassessment of revenue recognition criteria and adjustments required due to delayed
payments under the network roaming agreement with Cell C. As a result of the reassessment
and in compliance with IFRS 15 Revenue from Contracts with Customers, we have not
recognised revenue amounting to R393 million for network roaming services provided to
Cell C during the period. We are evaluating a sustainable solution to the agreement with Cell C.
MTN Group Limited Interim financial results for the six months ended 30 June 2019 3Results overview
Voice revenue increased by 4,5%*. This was underpinned by customer growth, the benefits of
our customer value management (CVM) initiatives and our focus on segmented offers. Group
subscribers increased by 7,7 million to 240 million and we rolled out our Pulse youth offer in
16 markets.
Group data revenue expanded by 19,8%*, supported by healthy growth in active data users to
82 million as we improved the coverage and quality of our data networks. Across our markets,
we increased 3G and 4G population coverage by 24,4 million and 32,5 million people
respectively. The effective rate per megabyte across our markets declined by 26,1%, with
average usage up 24,6% at 2,7GB per month.
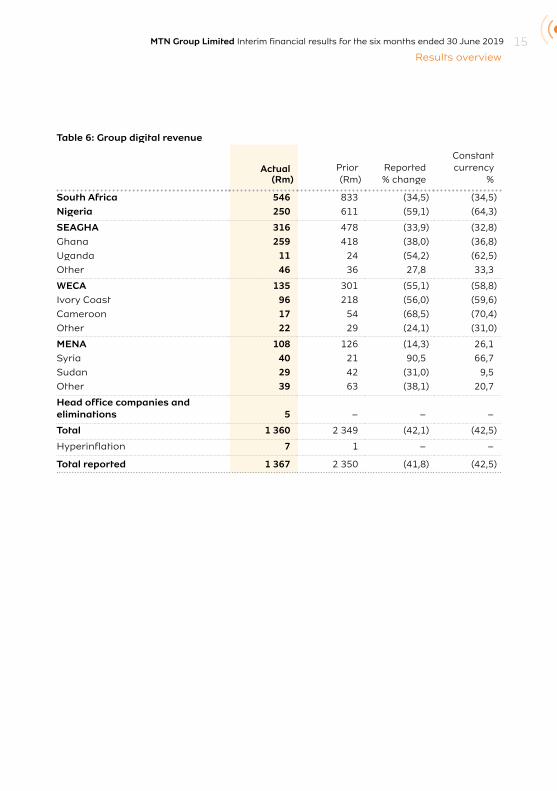
Digital revenue decreased by 42,5%*. This was largely the result of the continued optimisation
of traditional value-added services. In June, we recorded an increase in digital revenue
month-on-month. We are focused on growing our modern digital offerings through our music,
instant messaging and advertising platforms. We continued to expand MusicTime!, focusing
on customer awareness and refining our go-to-market strategy. Following the launch of
Ayoba in 3 markets, we recorded 300 000 monthly active users at the end of the period.
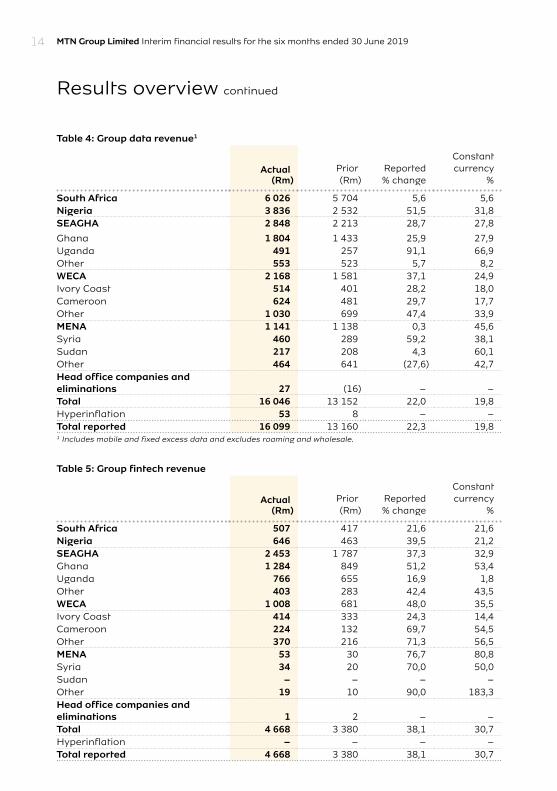
Fintech revenue increased by 30,7%*, supported by customer growth of 8,9% to 30 million
active Mobile Money (MoMo) users with a monthly ARPU of US$1,30. The total value of
transactions in the six months to June was US$44,1 billion, and we processed 9 193
transactions per minute. In May, we launched Africa’s first MoMo artificial intelligence service
or chatbot in Ivory Coast. Our aYo joint venture insurance business recorded almost 4,2 million
registered policy holders across our African footprint in the first half, as we launched the
offering in Ghana.
Enterprise revenue increased by 6,8%*, supported by 31,2%* growth in MTN Nigeria’s
enterprise revenue. We continue to execute our turnaround plan in South Africa and month-
on-month revenue trends improved in the period.
Wholesale revenue continued to grow, up by 127,9%*, driven by national roaming contracts in
South Africa (Cell C and Telkom), and solid growth in MTN GlobalConnect where we signed up
more key accounts and grew our application-to-person messaging services through the
Yellow Connect platform.
Improvements in the quality and capacity of our networks supported overall growth. We
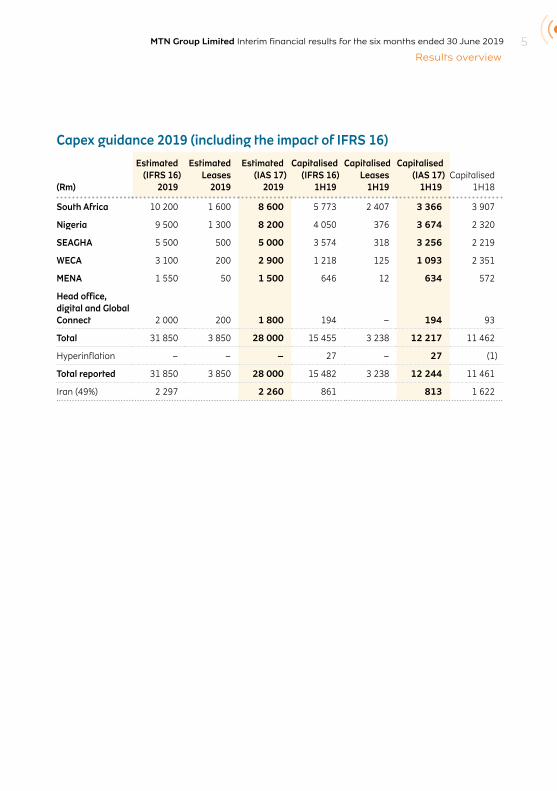
invested R12 244 million^, rolling out a total of 3 378 3G and 6 099 4G sites. Capex intensity
reduced to 16,9%^ from 19,3% in December.
The group’s EBITDA margin in constant currency terms improved marginally to 35,2%*. A 1,5
percentage point (pp)* improvement in the Nigerian margin was offset by the lower margin in
MTN South Africa, impacted by the reduction of OOB tariffs on data services and the Cell C
receivable impairment. The group’s reported EBITDA margin was 43,1%** compared to
35,6%** in June 2018, impacted by the adoption of IFRS 16, foreign exchange gains on
translation and the gain on dilution of our e-commerce venture Jumia upon listing.
MTN Group Limited Interim financial results for the six months ended 30 June 20194
Basic earnings per share increased to 247 cents** from 244 cents**. This was negatively
impacted by 39 cents or 13,6% because of the implementation of IFRS 16.
Reported headline earnings per share (HEPS) were 195 cents** from 215 cents** in June
2018.
HEPS were negatively impacted in aggregate by 102 cents from the following items: a 39 cents
impact of IFRS 16; 8 cents relating to the Nigeria fine interest (from 17 cents in June 2018);
hyperinflation (excluding impairments) of 8 cents (from 27 cents in June 2018); the impact of
foreign exchange gains and losses of 39 cents (from 21 cents in June 2018); and divestments
of 8 cents (-15 cents in June 2018). HEPS were further impacted by the depreciation of the
Iranian rial, which resulted in lower earnings from MTN Irancell.
On an IAS 17 basis, return on equity (ROE) increased to 12,9% from 11,5% in December 2018.
Taking into account the adoption of IFRS 16, ROE declined to 11,2%.
Regulatory and legal considerationsWe continued to work toward resolving various regulatory issues.
In Uganda, we continue to engage with the Ugandan authorities on the licence renewal.
In Nigeria, the tax dispute between MTN Nigeria and the Attorney General is ongoing. In June
the matter was adjourned to 29 October 2019 for the purposes of trial. We remain resolute
that MTN Nigeria has not committed any offence and will continue to defend this position.
Mobile money regulations issued by central banks are at various stages of development and
implementation across the group’s operations. These regulations govern the way mobile
money services are conducted as well as the rights and obligations of all parties to the mobile
money service offering, including rights to cash backing the mobile money issued held with
the banks and obligations to make payments to subscribers. Laws and regulations differ from
country to country and in some instances do not explicitly state who takes on the credit risk.
The group therefore applies a level of judgement and continues to monitor and assess these
regulations to determine the impact on its operations and results.
DividendsThe board declared a gross interim dividend of 195 cents per share.
MTN Group Limited Interim financial results for the six months ended 30 June 2019 5Results overview
Capex guidance 2019 (including the impact of IFRS 16)
(Rm)
Estimated(IFRS 16)
2019
Estimated Leases
2019
Estimated(IAS 17)
2019
Capitalised(IFRS 16)
1H19
Capitalised Leases
1H19
Capitalised(IAS 17)
1H19 Capitalised
1H18
South Africa 10 200 1 600 8 600 5 773 2 407 3 366 3 907
Nigeria 9 500 1 300 8 200 4 050 376 3 674 2 320
SEAGHA 5 500 500 5 000 3 574 318 3 256 2 219
WECA 3 100 200 2 900 1 218 125 1 093 2 351
MENA 1 550 50 1 500 646 12 634 572
Head office, digital and Global Connect 2 000 200 1 800 194 – 194 93
Total 31 850 3 850 28 000 15 455 3 238 12 217 11 462
Hyperinflation – – – 27 – 27 (1)
Total reported 31 850 3 850 28 000 15 482 3 238 12 244 11 461
Iran (49%) 2 297 2 260 861 813 1 622
Results overview continued
MTN Group Limited Interim financial results for the six months ended 30 June 20196
Financial reviewHeadline earnings reconciliation
(Rm)IFRS
reported
Impair-ment of
goodwill, PPE, JV
and associates1
Gain on dilution of
investment in JV/
associate2 Other3Headline earnings
Nigeria fine
interest4
Hyper-inflation
(excluding impair-
ments)5
Impact of foreign
exchange losses
and gains6Divest-
ments7Impact of
IFRS 168Adjusted
2019 % move-
ment
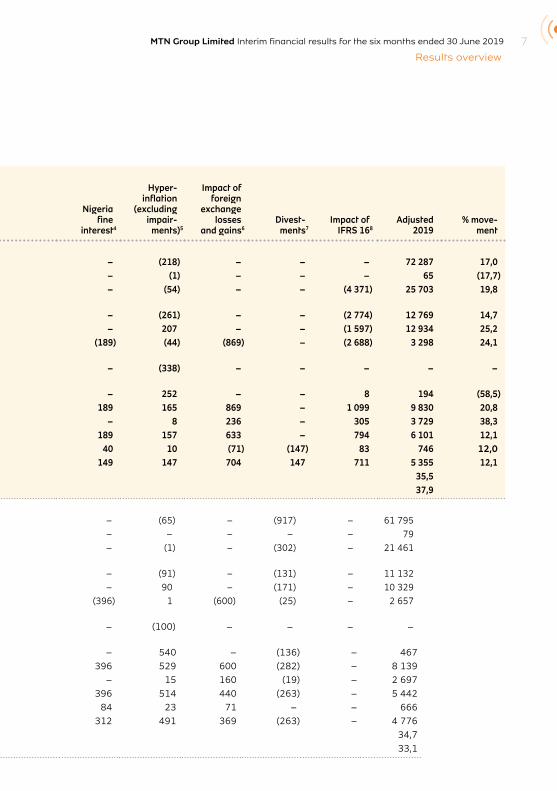
1H19Revenue 72 505 – – – 72 505 – (218) – – – 72 287 17,0Other income 1 242 – (1 151) (25) 66 – (1) – – – 65 (17,7)EBITDA 31 245 59 (1 151) (25) 30 128 – (54) – – (4 371) 25 703 19,8Depreciation, amortisation and impairment of goodwill 15 995 (191) – – 15 804 – (261) – – (2 774) 12 769 14,7Profit from operations 15 250 250 (1 151) (25) 14 324 – 207 – – (1 597) 12 934 25,2Net finance cost 7 088 – – – 7 088 (189) (44) (869) – (2 688) 3 298 24,1Hyperinflationary monetary gain 338 – – – 338 – (338) – – – – –Share of results of associates and joint ventures after tax (29) – (37) – (66) – 252 – – 8 194 (58,5)Profit before tax 8 471 250 (1 188) (25) 7 508 189 165 869 – 1 099 9 830 20,8Income tax expense 3 180 – – 3 180 – 8 236 – 305 3 729 38,3Profit after tax 5 291 250 (1 188) (25) 4 328 189 157 633 – 794 6 101 12,1Non-controlling interests 858 (25) – (2) 831 40 10 (71) (147) 83 746 12,0Attributable profit 4 433 275 (1 188) (23) 3 497 149 147 704 147 711 5 355 12,1EBITDA margin (%) 43,1 41,5 35,5Effective tax rate (%) 37,5 42,4 37,9
1H18Revenue 62 777 – – – 62 777 – (65) – (917) – 61 795 Other income 406 – (304) (23) 79 – – – – – 79 EBITDA 22 335 (244) (304) (23) 21 764 – (1) – (302) – 21 461 Depreciation, amortisation and impairment of goodwill 11 503 (149) – – 11 354 – (91) – (131) – 11 132 Profit from operations 10 832 (95) (304) (23) 10 410 – 90 – (171) – 10 329 Net finance cost 3 677 – – – 3 677 (396) 1 (600) (25) – 2 657 Hyperinflationary monetary gain 100 – – – 100 – (100) – – – – Share of results of associates and joint ventures after tax 197 – (134) – 63 – 540 – (136) – 467 Profit before tax 7 452 (95) (438) (23) 6 896 396 529 600 (282) – 8 139Income tax expense 2 541 – – – 2 541 – 15 160 (19) – 2 697 Profit after tax 4 911 (95) (438) (23) 4 355 396 514 440 (263) – 5 442 Non-controlling interests 530 (42) – – 488 84 23 71 – – 666 Attributable profit 4 381 (53) (438) (23) 3 867 312 491 369 (263) – 4 776 EBITDA margin (%) 35,6 34,7 34,7Effective tax rate (%) 34,1 36,8 33,1
MTN Group Limited Interim financial results for the six months ended 30 June 2019 7Results overview
Financial reviewHeadline earnings reconciliation
(Rm)IFRS
reported
Impair-ment of
goodwill, PPE, JV
and associates1
Gain on dilution of
investment in JV/
associate2 Other3Headline earnings
Nigeria fine
interest4
Hyper-inflation
(excluding impair-
ments)5
Impact of foreign
exchange losses
and gains6Divest-
ments7Impact of
IFRS 168Adjusted
2019 % move-
ment
1H19Revenue 72 505 – – – 72 505 – (218) – – – 72 287 17,0Other income 1 242 – (1 151) (25) 66 – (1) – – – 65 (17,7)EBITDA 31 245 59 (1 151) (25) 30 128 – (54) – – (4 371) 25 703 19,8Depreciation, amortisation and impairment of goodwill 15 995 (191) – – 15 804 – (261) – – (2 774) 12 769 14,7Profit from operations 15 250 250 (1 151) (25) 14 324 – 207 – – (1 597) 12 934 25,2Net finance cost 7 088 – – – 7 088 (189) (44) (869) – (2 688) 3 298 24,1Hyperinflationary monetary gain 338 – – – 338 – (338) – – – – –Share of results of associates and joint ventures after tax (29) – (37) – (66) – 252 – – 8 194 (58,5)Profit before tax 8 471 250 (1 188) (25) 7 508 189 165 869 – 1 099 9 830 20,8Income tax expense 3 180 – – 3 180 – 8 236 – 305 3 729 38,3Profit after tax 5 291 250 (1 188) (25) 4 328 189 157 633 – 794 6 101 12,1Non-controlling interests 858 (25) – (2) 831 40 10 (71) (147) 83 746 12,0Attributable profit 4 433 275 (1 188) (23) 3 497 149 147 704 147 711 5 355 12,1EBITDA margin (%) 43,1 41,5 35,5Effective tax rate (%) 37,5 42,4 37,9
1H18Revenue 62 777 – – – 62 777 – (65) – (917) – 61 795 Other income 406 – (304) (23) 79 – – – – – 79 EBITDA 22 335 (244) (304) (23) 21 764 – (1) – (302) – 21 461 Depreciation, amortisation and impairment of goodwill 11 503 (149) – – 11 354 – (91) – (131) – 11 132 Profit from operations 10 832 (95) (304) (23) 10 410 – 90 – (171) – 10 329 Net finance cost 3 677 – – – 3 677 (396) 1 (600) (25) – 2 657 Hyperinflationary monetary gain 100 – – – 100 – (100) – – – – Share of results of associates and joint ventures after tax 197 – (134) – 63 – 540 – (136) – 467 Profit before tax 7 452 (95) (438) (23) 6 896 396 529 600 (282) – 8 139Income tax expense 2 541 – – – 2 541 – 15 160 (19) – 2 697 Profit after tax 4 911 (95) (438) (23) 4 355 396 514 440 (263) – 5 442 Non-controlling interests 530 (42) – – 488 84 23 71 – – 666 Attributable profit 4 381 (53) (438) (23) 3 867 312 491 369 (263) – 4 776 EBITDA margin (%) 35,6 34,7 34,7Effective tax rate (%) 34,1 36,8 33,1

MTN Group Limited Interim financial results for the six months ended 30 June 20198
Results overview continued
1 Represents the exclusion of the impact of goodwill, PPE and joint venture impairments. 2019: In relation to
impairments in MEIH (R191 million). 2018: In relation to MTN Yemen (R149 million) and reversal of the hyperinflation-
related asset impairment in MTN Sudan (R306 million).2 Represents the gain on dilution of the group’s investments. In 2019: R1 188 million (Jumia: R1 039 million, MEIH:
R37 million and and a gain on disposal of TravelStart R112 million). 2018: Gain on dilution of investment in IIG
(R304 million share in group and R134 million in Iran).3 Release of a deferred gain of R18 million (2018: R12 million) in Ghana on the sale of tower assets during the prior
period and offset by losses incurred on the disposal of items of property, plant and equipment.4 Exclusion of finance cost recognised as a result of the unwind of the discounting of the financial liability created on
conclusion of the Nigeria regulatory fine.5 The impact of hyperinflation is excluded for the operations that are currently accounted for on a hyperinflationary
basis (MTN Syria, MTN Sudan and MTN South Sudan) as well as those that have previously been accounted for on
a hyperinflationary basis. The economy of MTN Sudan was assessed to be hyperinflationary effective 1 July 2018.
The economy of Iran was assessed to no longer be hyperinflationary effective 1 July 2015 and hyperinflation
accounting was discontinued from this date onwards. For this operation the impact of hyperinflation unwinds over
time mainly through depreciation, amortisation or subsequent asset impairments.6 Adjustment for the net forex losses impacting earnings for the respective periods (2019: R704 million;
2018: R369 million). This includes the impact of forex gains in Iran.7 Represents divestments in the group. 2019: Dilution of Ghana shareholding from 97.65% to 85.49%. 2018: Sale of
Cyprus operations and Botswana operations which is now held for sale.8 Removing the impact of IFRS 16 to get an IAS 17 view.
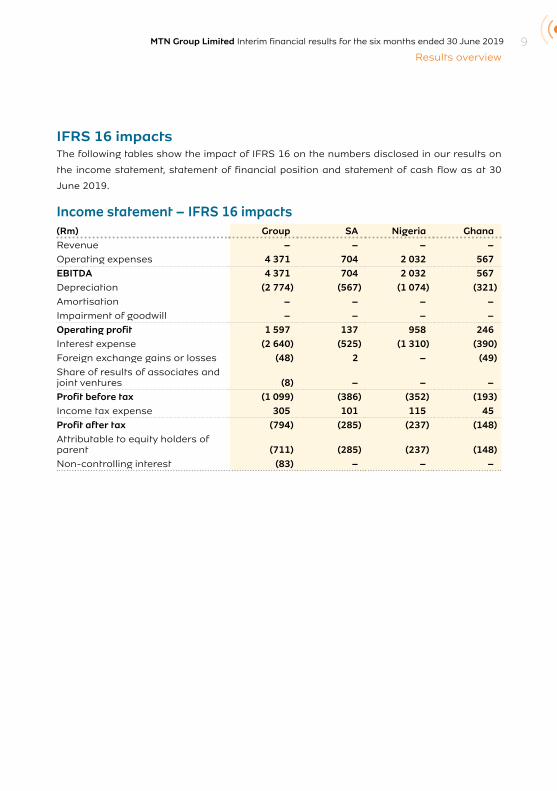
MTN Group Limited Interim financial results for the six months ended 30 June 2019 9Results overview
IFRS 16 impactsThe following tables show the impact of IFRS 16 on the numbers disclosed in our results on
the income statement, statement of financial position and statement of cash flow as at 30
June 2019.
Income statement – IFRS 16 impacts(Rm) Group SA Nigeria GhanaRevenue – – – –Operating expenses 4 371 704 2 032 567EBITDA 4 371 704 2 032 567Depreciation (2 774) (567) (1 074) (321)Amortisation – – – –Impairment of goodwill – – – –Operating profit 1 597 137 958 246Interest expense (2 640) (525) (1 310) (390)Foreign exchange gains or losses (48) 2 – (49)Share of results of associates and joint ventures (8) – – –Profit before tax (1 099) (386) (352) (193)Income tax expense 305 101 115 45Profit after tax (794) (285) (237) (148)Attributable to equity holders of parent (711) (285) (237) (148)Non-controlling interest (83) – – –
MTN Group Limited Interim financial results for the six months ended 30 June 201910
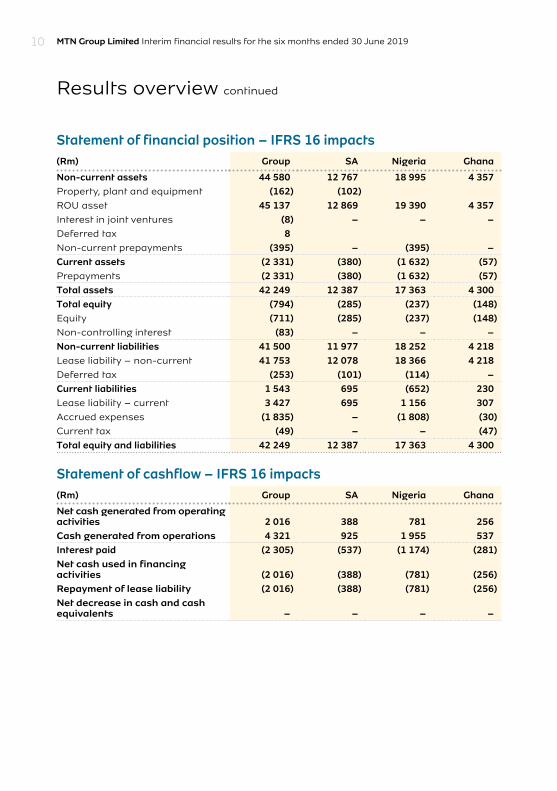
Statement of financial position – IFRS 16 impacts(Rm) Group SA Nigeria Ghana
Non-current assets 44 580 12 767 18 995 4 357Property, plant and equipment (162) (102)ROU asset 45 137 12 869 19 390 4 357Interest in joint ventures (8) – – –Deferred tax 8Non-current prepayments (395) – (395) –Current assets (2 331) (380) (1 632) (57)Prepayments (2 331) (380) (1 632) (57)Total assets 42 249 12 387 17 363 4 300Total equity (794) (285) (237) (148)Equity (711) (285) (237) (148)Non-controlling interest (83) – – –Non-current liabilities 41 500 11 977 18 252 4 218Lease liability – non-current 41 753 12 078 18 366 4 218Deferred tax (253) (101) (114) –Current liabilities 1 543 695 (652) 230Lease liability – current 3 427 695 1 156 307Accrued expenses (1 835) – (1 808) (30)Current tax (49) – – (47)Total equity and liabilities 42 249 12 387 17 363 4 300
Statement of cashflow – IFRS 16 impacts(Rm) Group SA Nigeria Ghana
Net cash generated from operating activities 2 016 388 781 256Cash generated from operations 4 321 925 1 955 537Interest paid (2 305) (537) (1 174) (281)Net cash used in financing activities (2 016) (388) (781) (256)Repayment of lease liability (2 016) (388) (781) (256)Net decrease in cash and cash equivalents – – – –
Results overview continued
MTN Group Limited Interim financial results for the six months ended 30 June 2019 11Results overview
Exchange rates The weaker average rand and stronger Nigerian naira had a positive translation impact on
rand-reported results, while the depreciation of the Iranian rial had a negative impact on
rand-reported results. The average naira remained flat against the US dollar YoY, and the
closing rate at end-June 2019 was up 1,0% YoY. The average rand weakened by 15,4% YoY
against the US dollar and closed 1,9% stronger.
RevenueTable 1: Group revenue by country
Actual (Rm)
Prior(Rm)
Reported% change
Constant currency
%
Contribution to revenue
%
South Africa 22 394 21 163 5,8 5,8 30,9
Nigeria 22 232 17 230 29,0 12,1 30,7
SEAGHA 12 664 10 342 22,5 19,6 17,5
Ghana 6 492 5 546 17,1 18,7 9,0
Uganda 3 189 2 440 30,7 13,8 4,4
Other 2 983 2 356 26,6 27,5 4,1
WECA 10 582 9 617 10,0 0,3 14,6
Ivory Coast 3 403 3 487 (2,4) (10,2) 4,7
Cameroon 2 612 2 384 9,6 (0,6) 3,6
Other 4 567 3 746 21,9 10,7 6,3
MENA 4 104 4 396 (6,6) 19,8 5,7
Syria 1 342 1 025 30,9 14,0 1,9
Sudan 807 829 (2,7) 49,2 1,1
Other 1 955 2 542 (23,1) 8,4 2,7
Head office companies and eliminations 311 (36) – – 0,3
Total 72 287 62 712 15,3 10,2 99,7
Hyperinflation 218 65 – – 0,3
Total reported 72 505 62 777 15,5 10,2 100,0
Group revenue increased by 10,2%* and service revenue increased by 9,7%*, supported by
growth in MTN Nigeria (up 12,2%*), MTN Ghana (up 18,7%*), MTN Uganda (up 13,7%*) and
MTN South Africa (up 3,3%). Growth in MTN South Africa was impacted by a decline in
consumer prepaid revenue following the implementation of new rules and the reduction of
out-of-bundle tariffs, as well as lower revenue from Cell C. MTN Cameroon reversed service
revenue declines, reporting flat growth, while MTN Ivory Coast’s service revenue declined by
10,1%*.
MTN Group Limited Interim financial results for the six months ended 30 June 201912
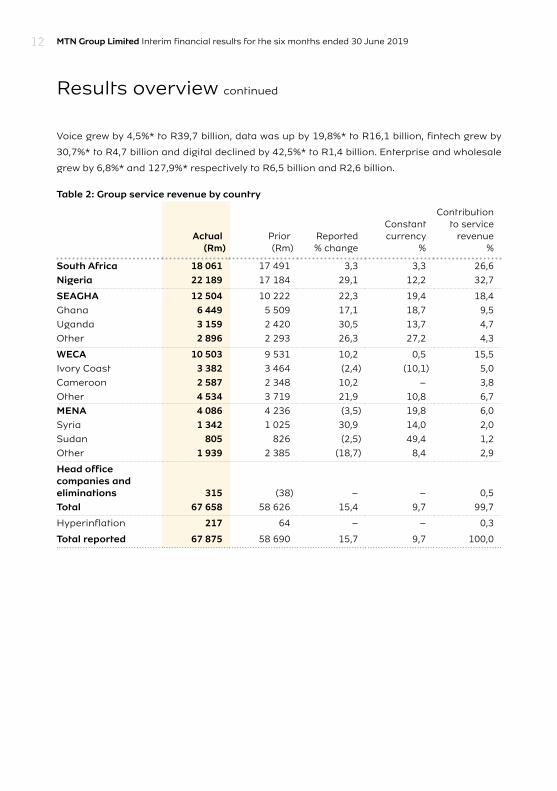
Voice grew by 4,5%* to R39,7 billion, data was up by 19,8%* to R16,1 billion, fintech grew by
30,7%* to R4,7 billion and digital declined by 42,5%* to R1,4 billion. Enterprise and wholesale
grew by 6,8%* and 127,9%* respectively to R6,5 billion and R2,6 billion.
Table 2: Group service revenue by country
Actual (Rm)
Prior(Rm)
Reported% change
Constantcurrency
%
Contribution to service
revenue%
South Africa 18 061 17 491 3,3 3,3 26,6
Nigeria 22 189 17 184 29,1 12,2 32,7
SEAGHA 12 504 10 222 22,3 19,4 18,4
Ghana 6 449 5 509 17,1 18,7 9,5
Uganda 3 159 2 420 30,5 13,7 4,7
Other 2 896 2 293 26,3 27,2 4,3
WECA 10 503 9 531 10,2 0,5 15,5
Ivory Coast 3 382 3 464 (2,4) (10,1) 5,0
Cameroon 2 587 2 348 10,2 – 3,8
Other 4 534 3 719 21,9 10,8 6,7
MENA 4 086 4 236 (3,5) 19,8 6,0
Syria 1 342 1 025 30,9 14,0 2,0
Sudan 805 826 (2,5) 49,4 1,2
Other 1 939 2 385 (18,7) 8,4 2,9
Head office companies and eliminations 315 (38) – – 0,5
Total 67 658 58 626 15,4 9,7 99,7
Hyperinflation 217 64 – – 0,3
Total reported 67 875 58 690 15,7 9,7 100,0
Results overview continued
MTN Group Limited Interim financial results for the six months ended 30 June 2019 13Results overview
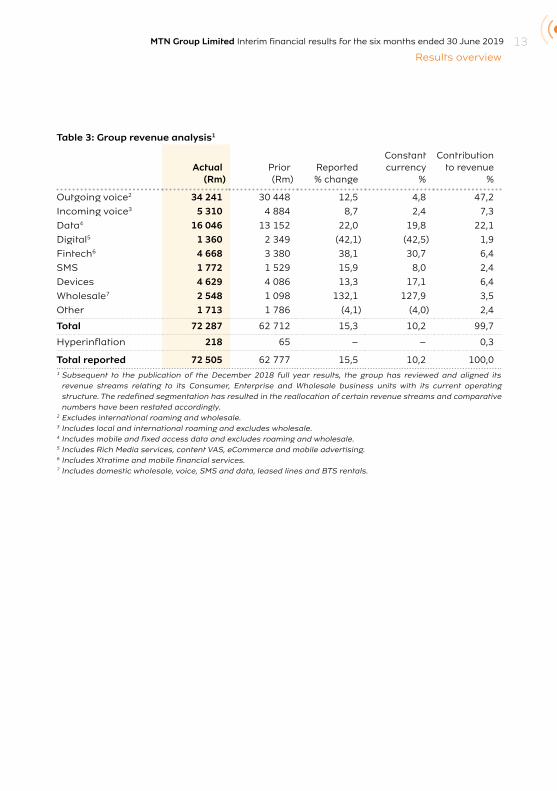
Table 3: Group revenue analysis1
Actual (Rm)
Prior(Rm)
Reported% change
Constantcurrency
%
Contribution to revenue
%
Outgoing voice2 34 241 30 448 12,5 4,8 47,2
Incoming voice3 5 310 4 884 8,7 2,4 7,3
Data4 16 046 13 152 22,0 19,8 22,1
Digital5 1 360 2 349 (42,1) (42,5) 1,9
Fintech6 4 668 3 380 38,1 30,7 6,4
SMS 1 772 1 529 15,9 8,0 2,4
Devices 4 629 4 086 13,3 17,1 6,4
Wholesale7 2 548 1 098 132,1 127,9 3,5
Other 1 713 1 786 (4,1) (4,0) 2,4
Total 72 287 62 712 15,3 10,2 99,7
Hyperinflation 218 65 – – 0,3
Total reported 72 505 62 777 15,5 10,2 100,0 1 Subsequent to the publication of the December 2018 full year results, the group has reviewed and aligned its
revenue streams relating to its Consumer, Enterprise and Wholesale business units with its current operating structure. The redefined segmentation has resulted in the reallocation of certain revenue streams and comparative numbers have been restated accordingly.
2 Excludes international roaming and wholesale.3 Includes local and international roaming and excludes wholesale.4 Includes mobile and fixed access data and excludes roaming and wholesale.5 Includes Rich Media services, content VAS, eCommerce and mobile advertising.6 Includes Xtratime and mobile financial services.7 Includes domestic wholesale, voice, SMS and data, leased lines and BTS rentals.
Results overview continued
MTN Group Limited Interim financial results for the six months ended 30 June 201914
Table 4: Group data revenue1
Actual (Rm)
Prior(Rm)
Reported% change
Constantcurrency
%
South Africa 6 026 5 704 5,6 5,6 Nigeria 3 836 2 532 51,5 31,8 SEAGHA 2 848 2 213 28,7 27,8
Ghana 1 804 1 433 25,9 27,9 Uganda 491 257 91,1 66,9 Other 553 523 5,7 8,2 WECA 2 168 1 581 37,1 24,9 Ivory Coast 514 401 28,2 18,0 Cameroon 624 481 29,7 17,7 Other 1 030 699 47,4 33,9 MENA 1 141 1 138 0,3 45,6Syria 460 289 59,2 38,1 Sudan 217 208 4,3 60,1 Other 464 641 (27,6) 42,7Head office companies and eliminations 27 (16) – – Total 16 046 13 152 22,0 19,8Hyperinflation 53 8 – – Total reported 16 099 13 160 22,3 19,81 Includes mobile and fixed excess data and excludes roaming and wholesale.
Table 5: Group fintech revenue
Actual (Rm)
Prior(Rm)
Reported% change
Constantcurrency
%
South Africa 507 417 21,6 21,6 Nigeria 646 463 39,5 21,2 SEAGHA 2 453 1 787 37,3 32,9 Ghana 1 284 849 51,2 53,4 Uganda 766 655 16,9 1,8 Other 403 283 42,4 43,5 WECA 1 008 681 48,0 35,5Ivory Coast 414 333 24,3 14,4 Cameroon 224 132 69,7 54,5Other 370 216 71,3 56,5 MENA 53 30 76,7 80,8Syria 34 20 70,0 50,0 Sudan – – – – Other 19 10 90,0 183,3Head office companies and eliminations 1 2 – –Total 4 668 3 380 38,1 30,7 Hyperinflation – – – – Total reported 4 668 3 380 38,1 30,7
MTN Group Limited Interim financial results for the six months ended 30 June 2019 15Results overview
Table 6: Group digital revenue
Actual (Rm)
Prior(Rm)
Reported% change
Constantcurrency
%
South Africa 546 833 (34,5) (34,5)
Nigeria 250 611 (59,1) (64,3)
SEAGHA 316 478 (33,9) (32,8)
Ghana 259 418 (38,0) (36,8)
Uganda 11 24 (54,2) (62,5)
Other 46 36 27,8 33,3
WECA 135 301 (55,1) (58,8)
Ivory Coast 96 218 (56,0) (59,6)
Cameroon 17 54 (68,5) (70,4)
Other 22 29 (24,1) (31,0)
MENA 108 126 (14,3) 26,1
Syria 40 21 90,5 66,7
Sudan 29 42 (31,0) 9,5
Other 39 63 (38,1) 20,7
Head office companies and eliminations 5 – – –
Total 1 360 2 349 (42,1) (42,5)
Hyperinflation 7 1 – –
Total reported 1 367 2 350 (41,8) (42,5)
Results overview continued
MTN Group Limited Interim financial results for the six months ended 30 June 201916
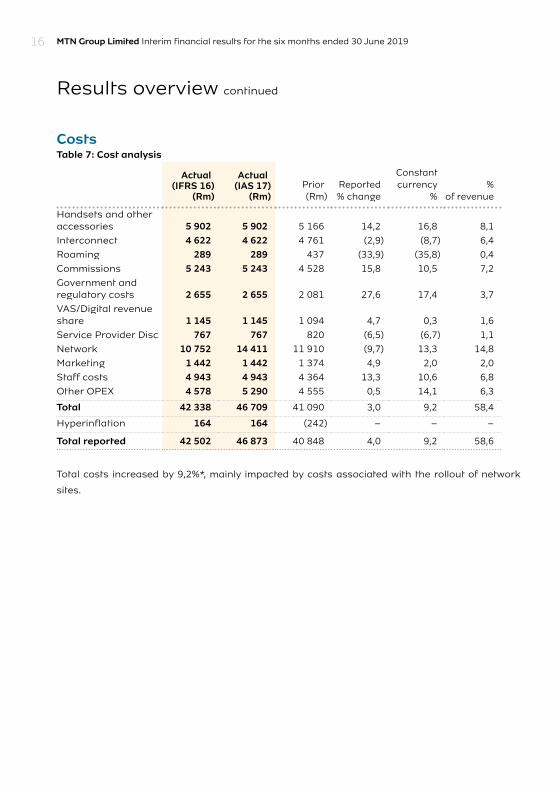
CostsTable 7: Cost analysis
Actual (IFRS 16)
(Rm)
Actual (IAS 17)
(Rm) Prior(Rm)
Reported% change
Constantcurrency
%%
of revenue
Handsets and other accessories 5 902 5 902 5 166 14,2 16,8 8,1
Interconnect 4 622 4 622 4 761 (2,9) (8,7) 6,4
Roaming 289 289 437 (33,9) (35,8) 0,4
Commissions 5 243 5 243 4 528 15,8 10,5 7,2
Government and regulatory costs 2 655 2 655 2 081 27,6 17,4 3,7
VAS/Digital revenue share 1 145 1 145 1 094 4,7 0,3 1,6
Service Provider Disc 767 767 820 (6,5) (6,7) 1,1
Network 10 752 14 411 11 910 (9,7) 13,3 14,8
Marketing 1 442 1 442 1 374 4,9 2,0 2,0
Staff costs 4 943 4 943 4 364 13,3 10,6 6,8
Other OPEX 4 578 5 290 4 555 0,5 14,1 6,3
Total 42 338 46 709 41 090 3,0 9,2 58,4
Hyperinflation 164 164 (242) – – –
Total reported 42 502 46 873 40 848 4,0 9,2 58,6
Total costs increased by 9,2%*, mainly impacted by costs associated with the rollout of network
sites.
MTN Group Limited Interim financial results for the six months ended 30 June 2019 17Results overview
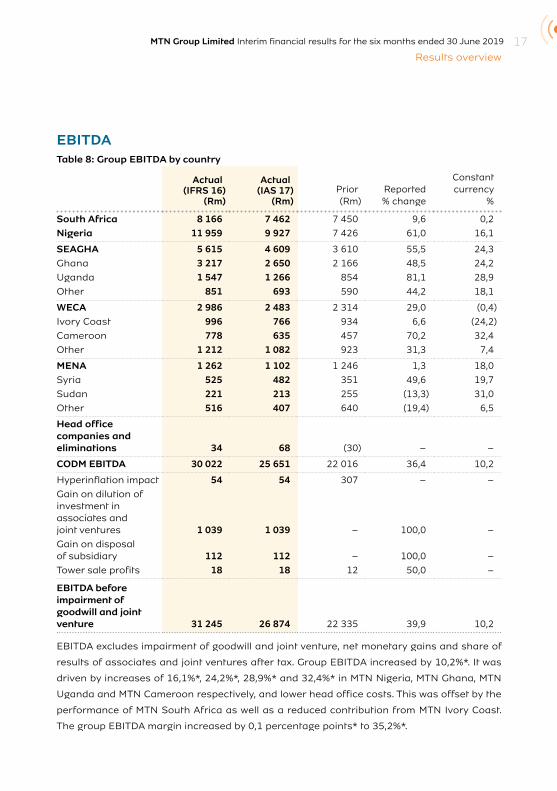
EBITDATable 8: Group EBITDA by country
Actual (IFRS 16)
(Rm)
Actual (IAS 17)
(Rm) Prior(Rm)
Reported% change
Constantcurrency
%
South Africa 8 166 7 462 7 450 9,6 0,2
Nigeria 11 959 9 927 7 426 61,0 16,1
SEAGHA 5 615 4 609 3 610 55,5 24,3
Ghana 3 217 2 650 2 166 48,5 24,2
Uganda 1 547 1 266 854 81,1 28,9
Other 851 693 590 44,2 18,1
WECA 2 986 2 483 2 314 29,0 (0,4)
Ivory Coast 996 766 934 6,6 (24,2)
Cameroon 778 635 457 70,2 32,4
Other 1 212 1 082 923 31,3 7,4
MENA 1 262 1 102 1 246 1,3 18,0
Syria 525 482 351 49,6 19,7
Sudan 221 213 255 (13,3) 31,0
Other 516 407 640 (19,4) 6,5
Head office companies and eliminations 34 68 (30) – –
CODM EBITDA 30 022 25 651 22 016 36,4 10,2
Hyperinflation impact 54 54 307 – –
Gain on dilution of investment in associates and joint ventures 1 039 1 039 – 100,0 –
Gain on disposal of subsidiary 112 112 – 100,0 –
Tower sale profits 18 18 12 50,0 –
EBITDA before impairment of goodwill and joint venture 31 245 26 874 22 335 39,9 10,2
EBITDA excludes impairment of goodwill and joint venture, net monetary gains and share of
results of associates and joint ventures after tax. Group EBITDA increased by 10,2%*. It was
driven by increases of 16,1%*, 24,2%*, 28,9%* and 32,4%* in MTN Nigeria, MTN Ghana, MTN
Uganda and MTN Cameroon respectively, and lower head office costs. This was offset by the
performance of MTN South Africa as well as a reduced contribution from MTN Ivory Coast.
The group EBITDA margin increased by 0,1 percentage points* to 35,2%*.
Results overview continued
MTN Group Limited Interim financial results for the six months ended 30 June 201918
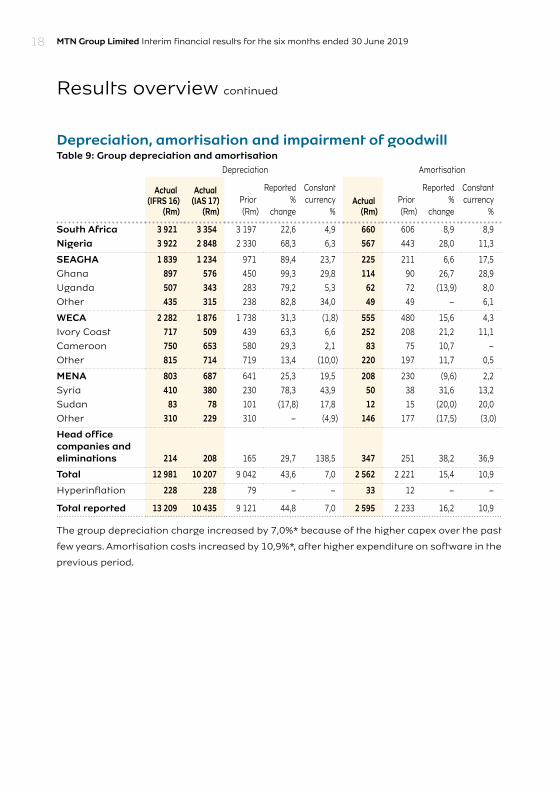
Depreciation, amortisation and impairment of goodwillTable 9: Group depreciation and amortisation
Depreciation Amortisation
Actual (IFRS 16)
(Rm)
Actual (IAS 17)
(Rm)Prior(Rm)
Reported%
change
Constantcurrency
%Actual
(Rm)Prior(Rm)
Reported%
change
Constantcurrency
%
South Africa 3 921 3 354 3 197 22,6 4,9 660 606 8,9 8,9
Nigeria 3 922 2 848 2 330 68,3 6,3 567 443 28,0 11,3
SEAGHA 1 839 1 234 971 89,4 23,7 225 211 6,6 17,5
Ghana 897 576 450 99,3 29,8 114 90 26,7 28,9
Uganda 507 343 283 79,2 5,3 62 72 (13,9) 8,0
Other 435 315 238 82,8 34,0 49 49 – 6,1
WECA 2 282 1 876 1 738 31,3 (1,8) 555 480 15,6 4,3
Ivory Coast 717 509 439 63,3 6,6 252 208 21,2 11,1
Cameroon 750 653 580 29,3 2,1 83 75 10,7 –
Other 815 714 719 13,4 (10,0) 220 197 11,7 0,5
MENA 803 687 641 25,3 19,5 208 230 (9,6) 2,2
Syria 410 380 230 78,3 43,9 50 38 31,6 13,2
Sudan 83 78 101 (17,8) 17,8 12 15 (20,0) 20,0
Other 310 229 310 – (4,9) 146 177 (17,5) (3,0)
Head office companies and eliminations 214 208 165 29,7 138,5 347 251 38,2 36,9
Total 12 981 10 207 9 042 43,6 7,0 2 562 2 221 15,4 10,9
Hyperinflation 228 228 79 – – 33 12 – –
Total reported 13 209 10 435 9 121 44,8 7,0 2 595 2 233 16,2 10,9
The group depreciation charge increased by 7,0%* because of the higher capex over the past
few years. Amortisation costs increased by 10,9%*, after higher expenditure on software in the
previous period.
MTN Group Limited Interim financial results for the six months ended 30 June 2019 19Results overview
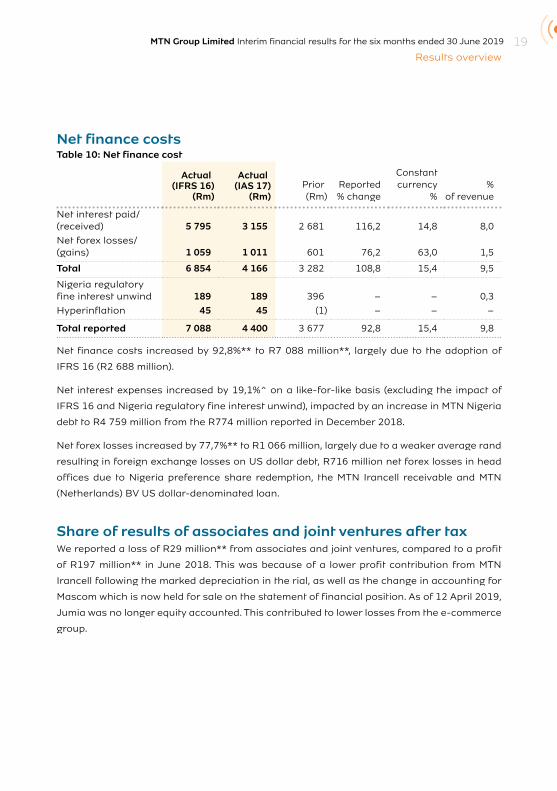
Net finance costsTable 10: Net finance cost
Actual (IFRS 16)
(Rm)
Actual (IAS 17)
(Rm) Prior (Rm)
Reported% change
Constantcurrency
%%
of revenue
Net interest paid/(received) 5 795 3 155 2 681 116,2 14,8 8,0
Net forex losses/(gains) 1 059 1 011 601 76,2 63,0 1,5
Total 6 854 4 166 3 282 108,8 15,4 9,5
Nigeria regulatory fine interest unwind 189 189 396 – – 0,3
Hyperinflation 45 45 (1) – – –
Total reported 7 088 4 400 3 677 92,8 15,4 9,8
Net finance costs increased by 92,8%** to R7 088 million**, largely due to the adoption of
IFRS 16 (R2 688 million).
Net interest expenses increased by 19,1%^ on a like-for-like basis (excluding the impact of
IFRS 16 and Nigeria regulatory fine interest unwind), impacted by an increase in MTN Nigeria
debt to R4 759 million from the R774 million reported in December 2018.
Net forex losses increased by 77,7%** to R1 066 million, largely due to a weaker average rand
resulting in foreign exchange losses on US dollar debt, R716 million net forex losses in head
offices due to Nigeria preference share redemption, the MTN Irancell receivable and MTN
(Netherlands) BV US dollar-denominated loan.
Share of results of associates and joint ventures after taxWe reported a loss of R29 million** from associates and joint ventures, compared to a profit
of R197 million** in June 2018. This was because of a lower profit contribution from MTN
Irancell following the marked depreciation in the rial, as well as the change in accounting for
Mascom which is now held for sale on the statement of financial position. As of 12 April 2019,
Jumia was no longer equity accounted. This contributed to lower losses from the e-commerce
group.
Results overview continued
MTN Group Limited Interim financial results for the six months ended 30 June 201920
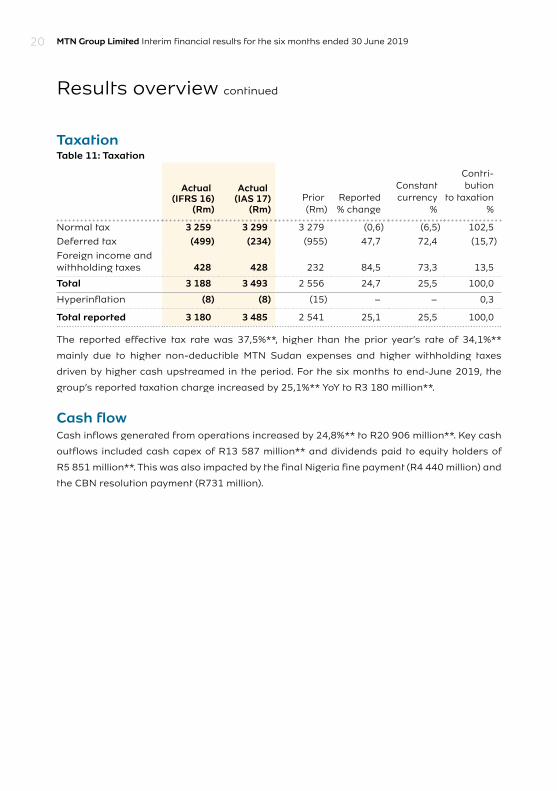
TaxationTable 11: Taxation
Actual (IFRS 16)
(Rm)
Actual (IAS 17)
(Rm) Prior (Rm)
Reported% change
Constantcurrency
%
Contri-bution
to taxation%
Normal tax 3 259 3 299 3 279 (0,6) (6,5) 102,5
Deferred tax (499) (234) (955) 47,7 72,4 (15,7)
Foreign income and withholding taxes 428 428 232 84,5 73,3 13,5
Total 3 188 3 493 2 556 24,7 25,5 100,0
Hyperinflation (8) (8) (15) – – 0,3
Total reported 3 180 3 485 2 541 25,1 25,5 100,0
The reported effective tax rate was 37,5%**, higher than the prior year’s rate of 34,1%**
mainly due to higher non-deductible MTN Sudan expenses and higher withholding taxes
driven by higher cash upstreamed in the period. For the six months to end-June 2019, the
group’s reported taxation charge increased by 25,1%** YoY to R3 180 million**.
Cash flowCash inflows generated from operations increased by 24,8%** to R20 906 million**. Key cash
outflows included cash capex of R13 587 million** and dividends paid to equity holders of
R5 851 million**. This was also impacted by the final Nigeria fine payment (R4 440 million) and
the CBN resolution payment (R731 million).
MTN Group Limited Interim financial results for the six months ended 30 June 2019 21Results overview
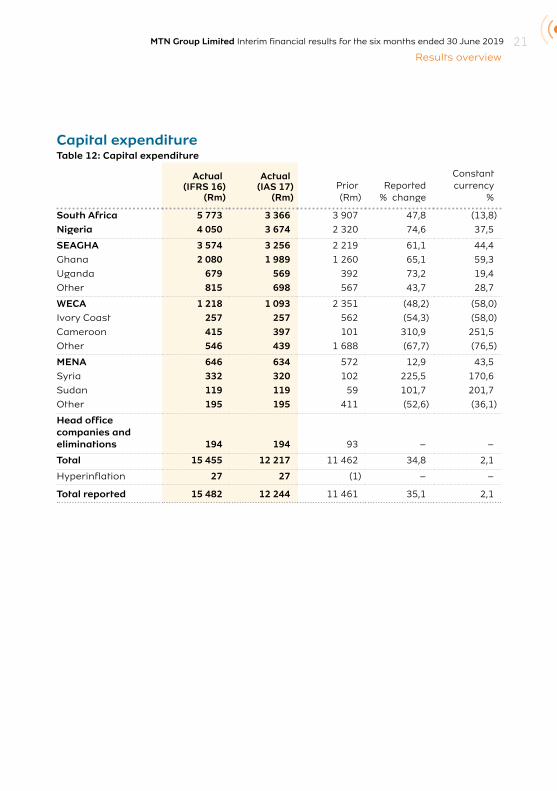
Capital expenditureTable 12: Capital expenditure
Actual (IFRS 16)
(Rm)
Actual (IAS 17)
(Rm) Prior (Rm)
Reported% change
Constantcurrency
%
South Africa 5 773 3 366 3 907 47,8 (13,8)
Nigeria 4 050 3 674 2 320 74,6 37,5
SEAGHA 3 574 3 256 2 219 61,1 44,4
Ghana 2 080 1 989 1 260 65,1 59,3
Uganda 679 569 392 73,2 19,4
Other 815 698 567 43,7 28,7
WECA 1 218 1 093 2 351 (48,2) (58,0)
Ivory Coast 257 257 562 (54,3) (58,0)
Cameroon 415 397 101 310,9 251,5
Other 546 439 1 688 (67,7) (76,5)
MENA 646 634 572 12,9 43,5
Syria 332 320 102 225,5 170,6
Sudan 119 119 59 101,7 201,7
Other 195 195 411 (52,6) (36,1)
Head office companies and eliminations 194 194 93 – –
Total 15 455 12 217 11 462 34,8 2,1
Hyperinflation 27 27 (1) – –
Total reported 15 482 12 244 11 461 35,1 2,1
Results overview continued
MTN Group Limited Interim financial results for the six months ended 30 June 201922
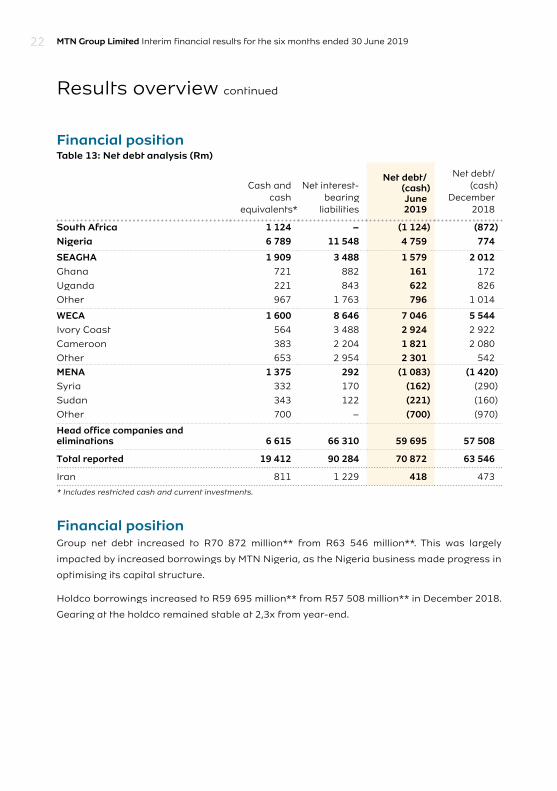
Financial positionTable 13: Net debt analysis (Rm)
Cash and cash
equivalents*
Net interest-bearing
liabilities
Net debt/(cash)June2019
Net debt/(cash)
December2018
South Africa 1 124 – (1 124) (872)Nigeria 6 789 11 548 4 759 774
SEAGHA 1 909 3 488 1 579 2 012 Ghana 721 882 161 172
Uganda 221 843 622 826
Other 967 1 763 796 1 014
WECA 1 600 8 646 7 046 5 544 Ivory Coast 564 3 488 2 924 2 922
Cameroon 383 2 204 1 821 2 080
Other 653 2 954 2 301 542
MENA 1 375 292 (1 083) (1 420)Syria 332 170 (162) (290)
Sudan 343 122 (221) (160)
Other 700 – (700) (970)
Head office companies and eliminations 6 615 66 310 59 695 57 508
Total reported 19 412 90 284 70 872 63 546
Iran 811 1 229 418 473
* Includes restricted cash and current investments.
Financial positionGroup net debt increased to R70 872 million** from R63 546 million**. This was largely
impacted by increased borrowings by MTN Nigeria, as the Nigeria business made progress in
optimising its capital structure.
Holdco borrowings increased to R59 695 million** from R57 508 million** in December 2018.
Gearing at the holdco remained stable at 2,3x from year-end.
MTN Group Limited Interim financial results for the six months ended 30 June 2019 23Results overview
Operational review
MTN South Africa■■ Service revenue increased by 3,3%■■ Data revenue increased by 5,6%■■ Fintech revenue increased by 21,6%■■ Digital revenue decreased by 34,5%■■ EBITDA increased by 0,2%* to R7 462 million■■ EBITDA margin decreased by 1,9 pp* to 33,3%*■■ Capex decreased by 13,8%*
MTN South Africa reported improved service revenue in the period. Growth in wholesale and consumer postpaid revenue supported service revenue growth but was offset by a 5,5% reduction in prepaid service revenue coupled by the Cell C adjustments made.
The prepaid business negatively impacted service revenue growth mainly as a result of the implementation of ICASA’s End User Subscriber Service Charter regulations and the reduction of out-of-bundle (OOB) tariffs on data services, as well as the impact on consumer spending of the contraction of the economy.
The consumer postpaid business remained resilient in tough conditions delivering a 7% service revenue growth. Consumer additions were muted on the back of stricter vetting rules targeting a reduction in credit risk due to tougher economic times.
A combination of changes in the acquisition strategy in consumer postpaid as well as the discontinuation of the 1GB acquisition promotion in prepaid in order to drive distribution efficiencies resulted in a 1,9 million decrease in the subscriber base from December 2018 to a closing subscriber base of 29,2 million.
We continued to execute on the turnaround of the enterprise business, leading to lower service revenue reductions of -7,8% from -11,3% in the 2018 full year as we stabilised churn and added new corporate customers. We are confident that this trend will gain further traction in the second half of the year.
The 1,9pp decline in the EBITDA margin was a result of the reduction of OOB tariffs and the Cell C adjustments. MTN South Africa increased the distribution of 3G and 4G devices by 22% as enablers of future data growth. Operating expenses were impacted by a number of external factors such as load shedding, battery theft and site vandalisation. These, together with the progressively expanding network footprint, resulted in a 3,7% (+ 8,9%^) increase in total costs YoY. MTN South Africa’s network investments continue to deliver network leadership endorsement from subscribers and industry bodies such as MyBroadband and Ookla. Subscribers ranked MTN South Africa as having the best customer service, reflected in our move to the market’s leading net promoter score.
After the end of the period, the Minister of Communications and Digital Technologies issued a policy on high-demand spectrum and policy direction on the licensing of a Wireless Open Access Network (WOAN). This policy direction initiates a process by which ICASA will license spectrum from various bands. We note the policy direction and will have further engagements with the authorities. We are also engaging with the Minister and ICASA on the release of further high-demand spectrum including the 5G bands, which will further enable the drive to lower the cost of data.
Results overview continued
MTN Group Limited Interim financial results for the six months ended 30 June 201924
MTN Nigeria■■ Service revenue increased by 12,2%*■■ Data revenue increased by 31,8%*■■ Fintech revenue increased by 21,2%*■■ Digital revenue decreased by 64,3%*■■ EBITDA grew by 16,1%* to R8 623 million* ■■ EBITDA margin increased by 1,5 pp* to 44,6%* ■■ Capex increased by 37,5%*
MTN Nigeria delivered a solid performance, with strong voice (+11,4%) and data revenue (+31,8%) driving double-digit service revenue growth and further improving the EBITDA margin.
Voice revenue growth was supported by an increase in subscribers (+5,7%), relatively stable tariffs and our focus on pro-consumer activities. This was boosted by our targeted customer value management (CVM) initiatives.
Data revenue growth was driven by an increased number of smartphones on the network, greater data usage and growth in the number of active data users. We added 2,5 million smartphones, increasing smartphone penetration by 2,1pp to 39,2%. Active data users increased by 11,0% to 20,7 million and data traffic rose by 67% YoY.
Our fintech business continued to gain momentum with 21,2% growth in revenue YoY. The super-agent licence will allow us to leverage our established distribution channels to offer a wide range of mobile financial services. We will continue to work towards obtaining a payment service banking licence that we applied for in late 2018. Digital revenue continued to be impacted by the optimisation of value-added services (VAS). Our focus remains on building a sustainable base of active digital users in order to boost revenue growth.
Our enterprise business also delivered satisfactory results, with revenue increasing by 31,3%, to contribute 12,0% to service revenue.
The 1,5pp improvement in the EBITDA margin was supported by a stable naira against the US dollar benefiting our operating expenses as well as lower digital expenses arising from our VAS optimisation initiatives.
Southern and East Africa and Ghana (SEAGHA)■■ Service revenue increased by 19,4%*■■ Data revenue increased by 27,8%*■■ Fintech revenue increased by 32,9%*■■ Digital revenue declined by 32,8%*
The solid performance of the SEAGHA region was largely driven by MTN Ghana, which lifted service revenue by 18,7%*, supported by contributions from voice, data and fintech revenue. MTN Ghana and MTN Uganda continued to drive fintech revenue growth, with an increasing contribution from MTN MoMo, lending, pension and insurance services.
West and Central Africa (WECA) ■■ Service revenue increased by 0,5%*■■ Data revenue increased by 24,9%*■■ Fintech revenue increased by 35,5%*■■ Digital revenue declined by 58,8%*
We delivered on our plans to stabilise our WECA region, recording a stronger second quarter performance. In a highly contested market, MTN Ivory Coast returned to competitiveness and implemented an aggressive efficiency programme to reduce costs in support of margin
MTN Group Limited Interim financial results for the six months ended 30 June 2019 25Results overview
improvements. The operating environment in Cameroon remained challenging, given the conflict in the Northwest and Southwest, however we are encouraged by the positive YoY service revenue trends in the first half. We reported strong net additions and value share gains in both MTN Cameroon and MTN Ivory Coast. Across the region we saw a sharp increase in MoMo users, which supported fintech revenue growth.
Middle East and North Africa (MENA) (excluding Iran)■■ Service revenue increased by 19,8%*■■ Data revenue increased by 45,6%*■■ Fintech revenue increased by 80,8%*■■ Digital revenue increased by 26,1%*
Despite the geopolitical challenges across the region, MTN operations in MENA delivered a strong performance, largely driven by MTN Syria and MTN Sudan, delivering service revenue growth of 14,0%* and 49,4%* respectively. This was supported by the solid growth in data and voice revenue.
Associates, joint ventures and investments Telecoms operationsMTN Irancell recorded a pleasing result given the challenges the business faced following the re-introduction of US sanctions, the depreciation of the currency and high inflation rates. Service revenue grew by 17,9%*, with voice up by 24,4%* and data revenue up by 22,4%*. The reported results from Iran were however negatively impacted on translation following the move to report exchange rates at the Sana rate as of August 2018. The average Sana rate in the reporting period was 51,3% weaker relative to the prior period. This added to the additional forex losses against the Iranian receivable of R1 295 million at the end of the period. The value of the Irancell receivable as at 30 June 2019 was R3,0 billion.
E-commerce investments Following the Jumia IPO and making reference to the NYSE share price of the business at the end of the period (30 June 2019), we now value our 18,9% stake at R5,5 billion at an American Depositary Share (ADS) price of $26,42. As at 6 August 2019 the Jumia ADS price was at $13,81.
Middle East Internet Holding disposed of online platform Wadi, simplifying the portfolio and reducing ongoing capital requirements. Ride-hailing service Jeeny recorded a 75% YoY increase in ride numbers and bookings on cleaning service app Helpling increased by 54% YoY. As at 30 June 2019 an impairment of R191 million was recognised for MEIH.
Within IIG, ride-hailing app Snapp recorded 2 million rides daily, ranking it among the top ride-hailing apps globally. Food delivery app Snappfood grew by 197% YoY and led the market with almost 80% market share. Snapptrip grew by 116% YoY and is number 1 in the local hotel booking market.
As MTN re-focuses its business on building an integrated digital operator, these e-commerce holdings, while important investments, are not viewed as long-term strategic holdings for the group.
Investments in tower companiesOur associate tower businesses include our 49% holdings in both ATC Ghana and ATC Uganda. During the first half we saw a strong contribution from both of R58 million in June 2019. Our 29% investment in IHS was fair valued at R23,1 billion at 30 June 2019.
Although towers are an important operational component of the business, the investments in the existing tower companies are not viewed as long-term strategic holdings of the group.
Results overview continued
MTN Group Limited Interim financial results for the six months ended 30 June 201926
Prospects and guidance Well positioned to deliver growthGuided by our BRIGHT strategy, we are well positioned to grow by leveraging our scale and enhancing our competitive position. Our markets are characterised by significant population growth, youthful demographics, low levels of smartphone penetration and data and digital adoption, as well as large unbanked populations. The enterprise and wholesale sectors are relatively undeveloped and growing fast. The combination of our large customer base, extensive networks and deep distribution gives us access to large pools of revenue. We are committed to building a digital operator, being a scale player in both the evolving telco and fintech and digital services spaces.
Following data price reductions in South Africa and Nigeria, we expect price elasticity in the second half of the year to improve data revenue growth. We expect lower wholesale revenue in MTN South Africa to be a drag on service revenue following the end of the national wholesale deal with Telkom on 28 June 2019.
We plan to launch MoMo in South Africa in the second half of the year. On the back of the award of the super-agent licence in Nigeria, we will accelerate our fintech ambitions and now fully leverage the extensive distribution we have across the country to offer a range of transfer and payment services to our GSM customer base. We will continue to work towards obtaining a payment service banking licence in Nigeria. We will roll out our MTN Homeland offering, allowing money to be sent to MoMo recipients in Africa from Europe quickly and affordably.
We will continue to expand our insurance business and leverage the partnership with Sanlam that we announced in July 2019.
We plan to roll out Ayoba in Nigeria, South Africa, Uganda and Liberia in the second half of the year. We will also integrate payments into the Ayoba service as part of our broadening of the fintech business, as well as integrate Ayoba into MTN segmented offers. After launching our time-based music streaming service MusicTime! in South Africa in December 2018, we plan to launch this next in Nigeria and Ghana.
Medium-term guidanceWe reiterate our guidance for the medium term (3 to 5 years) of double-digit growth in group service revenue in constant currency terms, double-digit growth in MTN Nigeria’s service revenue and mid-single-digit growth in service revenue from MTN South Africa. Over this period, we expect to continue to increase our group EBITDA margin.
By leveraging historical investments, improved procurement processes and an increasing revenue contribution from our digital businesses, we expect the group capex intensity to steadily improve over the medium term.
Our improving revenue growth, margins and capex intensity are anticipated to drive significant improvements in group returns and cash flow.
The board remains committed to targeting growth of 10% to 20% in the dividend.
Portfolio optimisation and asset realisation programmeIn the first half, we made progress on the asset realisation programme that we announced in March 2019. The programme aims, over the next 3 years, to simplify our portfolio, reduce risk, improve returns and realise capital of R15 billion, excluding IHS.
MTN Group Limited Interim financial results for the six months ended 30 June 2019 27Results overview
In the first half, we realised R2,1 billion through the sale of our shareholder loan in ATC Ghana to American Tower Corporation for R900 million and the sale of our interests in investment fund Amadeus and its associated holding in Travelstart for net proceeds of R1,2 billion.
In April 2019, Jumia Technologies AG successfully raised fresh capital and listed on the New York Stock Exchange, resulting in a dilution of our shareholding from 29,7% to 18,9%. At 30 June 2019, this investment was valued at R5,5 billion at an American Depositary Share (ADS) share price of $26,42. As of 6 August 2019 the Jumia ADS price was $13,81.
The redemption of MTN Nigeria preference shares for a consideration of US$315 million has always been envisaged as a necessary part of the simplification of our capital structure. The redemption process is underway and will be completed after the necessary regulatory processes.
Our plan to dispose of our shareholding in Mascom Wireless Botswana for a consideration of US$300 million is in progress. We expect this to be concluded during the second half of the year, subject to various conditions precedents being met.
Board changes In May, we announced changes to the board. Chairman Phuthuma Nhleko will step down on 15 December 2019, when chairman-designate Mcebisi Jonas will take the helm. This follows a specific request from our largest shareholder that the board consider extending Nhleko’s term beyond the date originally envisaged of 31 December 2018.
On 15 December 2019, Dr Khotso Mokhele will assume the responsibilities of lead independent director and Alan Harper, Jeff van Rooyen and Koosum Kalyan will step down from the board. Peter Mageza and Dawn Marole will retire as directors on 30 April 2020.
On 1 July 2019 Lamido Sanusi and Vincent Rague joined the board as non-executive directors.
We also announced the establishment of an international advisory board (IAB). The IAB is a non-statutory entity which does not undertake fiduciary duties. It comprises prominent persons of considerable and wide-ranging experience. The primary purpose of the IAB will be to counsel the MTN Group in fulfilling its objective of being one of the premier African corporations and provide perspectives as it strives to contribute to certain areas of development in the countries where MTN operates. While the IAB will be non-statutory in nature and not have any fiduciary responsibility, it will make an important contribution in ensuring that the board is assisted in achieving MTN’s vision in a technically complex world with uncertain and shifting geopolitical interests.
The IAB is chaired by His Excellency former President of the Republic of South Africa, President Thabo Mbeki and constituted of:■■ His Excellency President John Kufuor, former President of Ghana■■ Dr Aisha Abdullahi, former African Union Commissioner for Political Affairs■■ Dr Mohammed ElBaradei, former Director General of the International Atomic Energy Agency
■■ Dr Momar Nguer, President of Marketing & Services, Total S.A. (France)■■ Phuthuma Nhleko, Chairman of MTN Group
Results overview continued
MTN Group Limited Interim financial results for the six months ended 30 June 201928
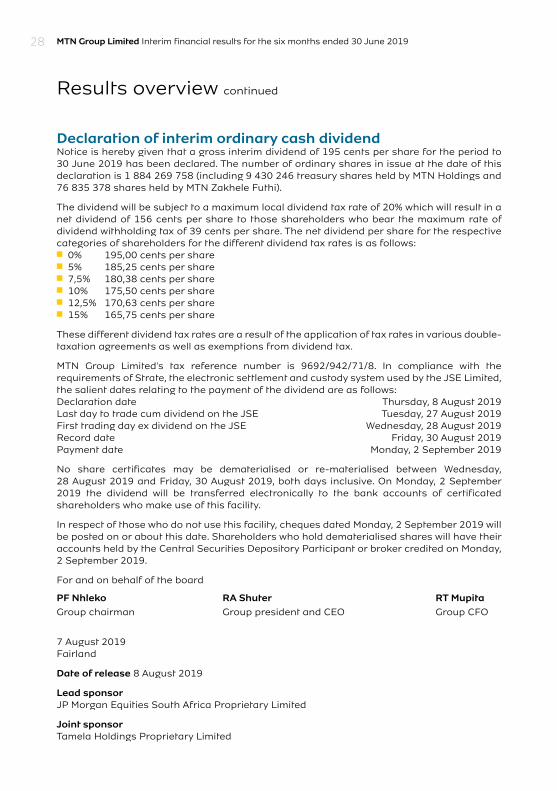
Declaration of interim ordinary cash dividend Notice is hereby given that a gross interim dividend of 195 cents per share for the period to 30 June 2019 has been declared. The number of ordinary shares in issue at the date of this declaration is 1 884 269 758 (including 9 430 246 treasury shares held by MTN Holdings and 76 835 378 shares held by MTN Zakhele Futhi).
The dividend will be subject to a maximum local dividend tax rate of 20% which will result in a net dividend of 156 cents per share to those shareholders who bear the maximum rate of dividend withholding tax of 39 cents per share. The net dividend per share for the respective categories of shareholders for the different dividend tax rates is as follows:■■ 0% 195,00 cents per share■■ 5% 185,25 cents per share■■ 7,5% 180,38 cents per share■■ 10% 175,50 cents per share■■ 12,5% 170,63 cents per share■■ 15% 165,75 cents per share
These different dividend tax rates are a result of the application of tax rates in various double-taxation agreements as well as exemptions from dividend tax.
MTN Group Limited's tax reference number is 9692/942/71/8. In compliance with the requirements of Strate, the electronic settlement and custody system used by the JSE Limited, the salient dates relating to the payment of the dividend are as follows:Declaration date Thursday, 8 August 2019Last day to trade cum dividend on the JSE Tuesday, 27 August 2019First trading day ex dividend on the JSE Wednesday, 28 August 2019Record date Friday, 30 August 2019Payment date Monday, 2 September 2019
No share certificates may be dematerialised or re-materialised between Wednesday, 28 August 2019 and Friday, 30 August 2019, both days inclusive. On Monday, 2 September 2019 the dividend will be transferred electronically to the bank accounts of certificated shareholders who make use of this facility.
In respect of those who do not use this facility, cheques dated Monday, 2 September 2019 will be posted on or about this date. Shareholders who hold dematerialised shares will have their accounts held by the Central Securities Depository Participant or broker credited on Monday, 2 September 2019.
For and on behalf of the board
PF Nhleko RA Shuter RT MupitaGroup chairman Group president and CEO Group CFO
7 August 2019Fairland
Date of release 8 August 2019
Lead sponsorJP Morgan Equities South Africa Proprietary Limited
Joint sponsor Tamela Holdings Proprietary Limited

MTN Group Limited Interim financial results for the six months ended 30 June 2019 29Results overview
Results overviewReviewed condensed consolidated interim
financial statements for the six months ended 30 June 2019
The group’s reviewed condensed consolidated interim financial statements for the six months ended 30 June 2019 have been independently reviewed by the group’s external auditors.
The group’s reviewed condensed consolidated interim financial statements have been prepared by the MTN finance staff under the guidance of the group finance operations executive,
S Perumal, CA(SA) and were supervised by the group chief financial officer, RT Mupita, BScEng (Hons), MBA, GMP.
The results were made available on 8 August 2019.
MTN Group Limited Interim financial results for the six months ended 30 June 201930
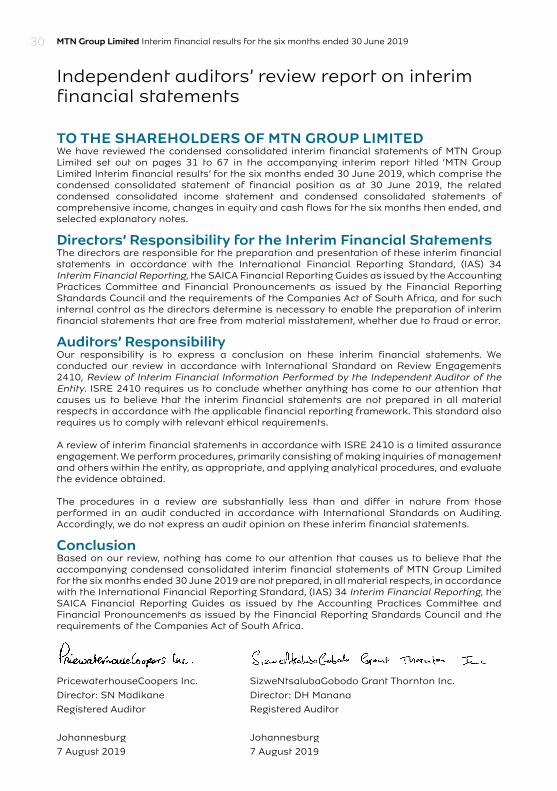
TO THE SHAREHOLDERS OF MTN GROUP LIMITEDWe have reviewed the condensed consolidated interim financial statements of MTN Group Limited set out on pages 31 to 67 in the accompanying interim report titled ‘MTN Group Limited Interim financial results’ for the six months ended 30 June 2019, which comprise the condensed consolidated statement of financial position as at 30 June 2019, the related condensed consolidated income statement and condensed consolidated statements of comprehensive income, changes in equity and cash flows for the six months then ended, and selected explanatory notes. Directors’ Responsibility for the Interim Financial StatementsThe directors are responsible for the preparation and presentation of these interim financial statements in accordance with the International Financial Reporting Standard, (IAS) 34 Interim Financial Reporting, the SAICA Financial Reporting Guides as issued by the Accounting Practices Committee and Financial Pronouncements as issued by the Financial Reporting Standards Council and the requirements of the Companies Act of South Africa, and for such internal control as the directors determine is necessary to enable the preparation of interim financial statements that are free from material misstatement, whether due to fraud or error.
Auditors’ ResponsibilityOur responsibility is to express a conclusion on these interim financial statements. We conducted our review in accordance with International Standard on Review Engagements 2410, Review of Interim Financial Information Performed by the Independent Auditor of the Entity. ISRE 2410 requires us to conclude whether anything has come to our attention that causes us to believe that the interim financial statements are not prepared in all material respects in accordance with the applicable financial reporting framework. This standard also requires us to comply with relevant ethical requirements.
A review of interim financial statements in accordance with ISRE 2410 is a limited assurance engagement. We perform procedures, primarily consisting of making inquiries of management and others within the entity, as appropriate, and applying analytical procedures, and evaluate the evidence obtained.
The procedures in a review are substantially less than and differ in nature from those performed in an audit conducted in accordance with International Standards on Auditing. Accordingly, we do not express an audit opinion on these interim financial statements. ConclusionBased on our review, nothing has come to our attention that causes us to believe that the accompanying condensed consolidated interim financial statements of MTN Group Limited for the six months ended 30 June 2019 are not prepared, in all material respects, in accordance with the International Financial Reporting Standard, (IAS) 34 Interim Financial Reporting, the SAICA Financial Reporting Guides as issued by the Accounting Practices Committee and Financial Pronouncements as issued by the Financial Reporting Standards Council and the requirements of the Companies Act of South Africa.
PricewaterhouseCoopers Inc. SizweNtsalubaGobodo Grant Thornton Inc.
Director: SN Madikane Director: DH Manana
Registered Auditor Registered Auditor
Johannesburg Johannesburg
7 August 2019 7 August 2019
Independent auditors’ review report on interim financial statements
MTN Group Limited Interim financial results for the six months ended 30 June 2019 31Results overview
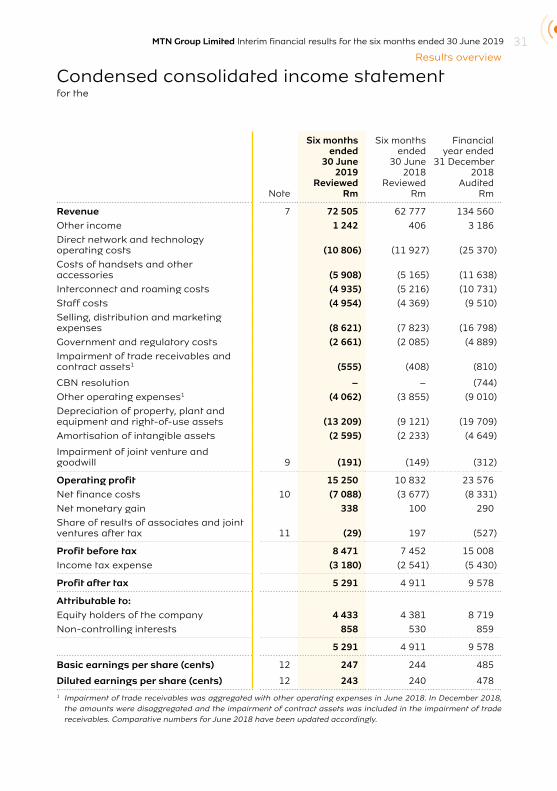
Note
Six months ended
30 June2019
ReviewedRm
Six months ended
30 June2018
ReviewedRm
Financial year ended
31 December2018
AuditedRm
Revenue 7 72 505 62 777 134 560
Other income 1 242 406 3 186
Direct network and technology operating costs (10 806) (11 927) (25 370)
Costs of handsets and other accessories (5 908) (5 165) (11 638)
Interconnect and roaming costs (4 935) (5 216) (10 731)
Staff costs (4 954) (4 369) (9 510)
Selling, distribution and marketing expenses (8 621) (7 823) (16 798)
Government and regulatory costs (2 661) (2 085) (4 889)
Impairment of trade receivables and contract assets1 (555) (408) (810)
CBN resolution – – (744)
Other operating expenses1 (4 062) (3 855) (9 010)
Depreciation of property, plant and equipment and right-of-use assets (13 209) (9 121) (19 709)
Amortisation of intangible assets (2 595) (2 233) (4 649)
Impairment of joint venture and goodwill 9 (191) (149) (312)
Operating profit 15 250 10 832 23 576
Net finance costs 10 (7 088) (3 677) (8 331)
Net monetary gain 338 100 290
Share of results of associates and joint ventures after tax 11 (29) 197 (527)
Profit before tax 8 471 7 452 15 008
Income tax expense (3 180) (2 541) (5 430)
Profit after tax 5 291 4 911 9 578
Attributable to:Equity holders of the company 4 433 4 381 8 719
Non-controlling interests 858 530 859
5 291 4 911 9 578
Basic earnings per share (cents) 12 247 244 485
Diluted earnings per share (cents) 12 243 240 4781 Impairment of trade receivables was aggregated with other operating expenses in June 2018. In December 2018,
the amounts were disaggregated and the impairment of contract assets was included in the impairment of trade receivables. Comparative numbers for June 2018 have been updated accordingly.
Condensed consolidated income statementfor the
MTN Group Limited Interim financial results for the six months ended 30 June 201932
Condensed consolidated statement of comprehensive incomefor the
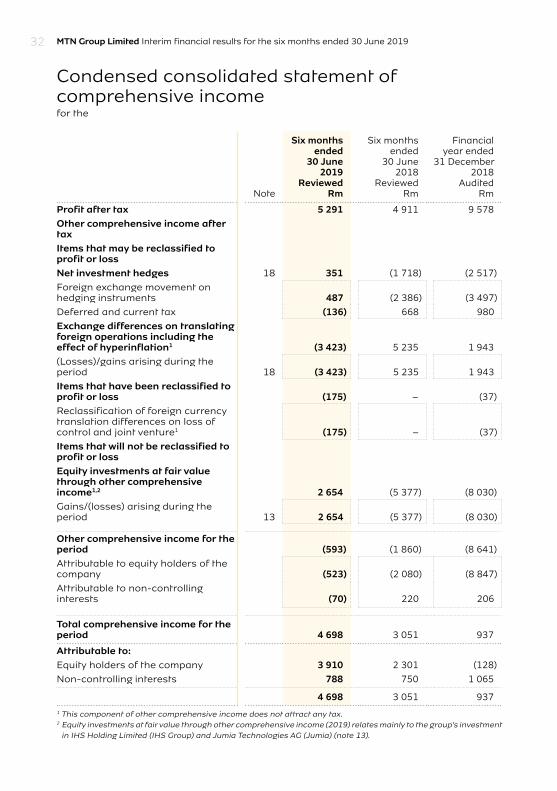
Note
Six monthsended
30 June2019
ReviewedRm
Six monthsended
30 June2018
ReviewedRm
Financialyear ended
31 December2018
AuditedRm
Profit after tax 5 291 4 911 9 578
Other comprehensive income after taxItems that may be reclassified to profit or lossNet investment hedges 18 351 (1 718) (2 517)
Foreign exchange movement on hedging instruments 487 (2 386) (3 497)
Deferred and current tax (136) 668 980
Exchange differences on translating foreign operations including the effect of hyperinflation1 (3 423) 5 235 1 943
(Losses)/gains arising during the period 18 (3 423) 5 235 1 943
Items that have been reclassified to profit or loss (175) – (37)
Reclassification of foreign currency translation differences on loss of control and joint venture1 (175) – (37)
Items that will not be reclassified to profit or lossEquity investments at fair value through other comprehensive income1,2 2 654 (5 377) (8 030)
Gains/(losses) arising during the period 13 2 654 (5 377) (8 030)
Other comprehensive income for the period (593) (1 860) (8 641)
Attributable to equity holders of the company (523) (2 080) (8 847)
Attributable to non-controlling interests (70) 220 206
Total comprehensive income for the period 4 698 3 051 937
Attributable to:Equity holders of the company 3 910 2 301 (128)
Non-controlling interests 788 750 1 065
4 698 3 051 9371 This component of other comprehensive income does not attract any tax.2 Equity investments at fair value through other comprehensive income (2019) relates mainly to the group’s investment
in IHS Holding Limited (IHS Group) and Jumia Technologies AG (Jumia) (note 13).
MTN Group Limited Interim financial results for the six months ended 30 June 2019 33Results overview
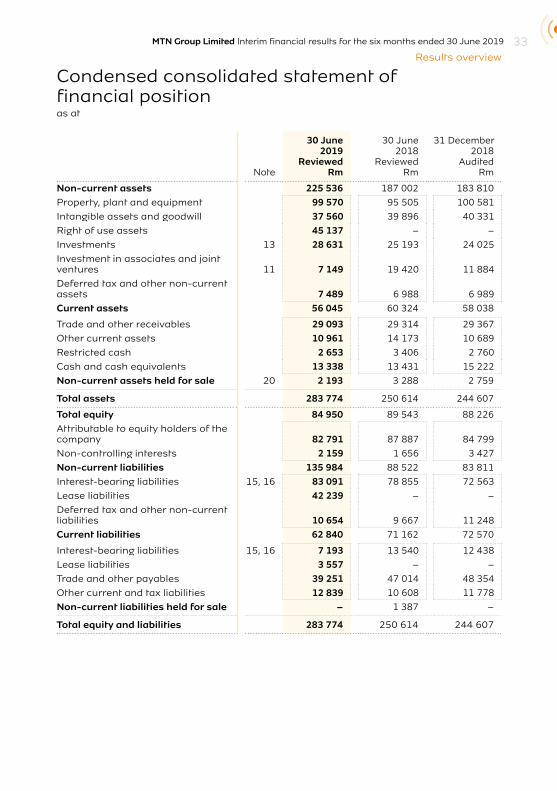
Condensed consolidated statement of financial positionas at
Note
30 June2019
ReviewedRm
30 June2018
ReviewedRm
31 December2018
AuditedRm
Non-current assets 225 536 187 002 183 810
Property, plant and equipment 99 570 95 505 100 581
Intangible assets and goodwill 37 560 39 896 40 331
Right of use assets 45 137 – –
Investments 13 28 631 25 193 24 025
Investment in associates and joint ventures 11 7 149 19 420 11 884
Deferred tax and other non-current assets 7 489 6 988 6 989
Current assets 56 045 60 324 58 038
Trade and other receivables 29 093 29 314 29 367
Other current assets 10 961 14 173 10 689
Restricted cash 2 653 3 406 2 760
Cash and cash equivalents 13 338 13 431 15 222
Non-current assets held for sale 20 2 193 3 288 2 759
Total assets 283 774 250 614 244 607
Total equity 84 950 89 543 88 226
Attributable to equity holders of the company 82 791 87 887 84 799
Non-controlling interests 2 159 1 656 3 427
Non-current liabilities 135 984 88 522 83 811
Interest-bearing liabilities 15, 16 83 091 78 855 72 563
Lease liabilities 42 239 – –
Deferred tax and other non-current liabilities 10 654 9 667 11 248
Current liabilities 62 840 71 162 72 570
Interest-bearing liabilities 15, 16 7 193 13 540 12 438
Lease liabilities 3 557 – –
Trade and other payables 39 251 47 014 48 354
Other current and tax liabilities 12 839 10 608 11 778
Non-current liabilities held for sale – 1 387 –
Total equity and liabilities 283 774 250 614 244 607
MTN Group Limited Interim financial results for the six months ended 30 June 201934
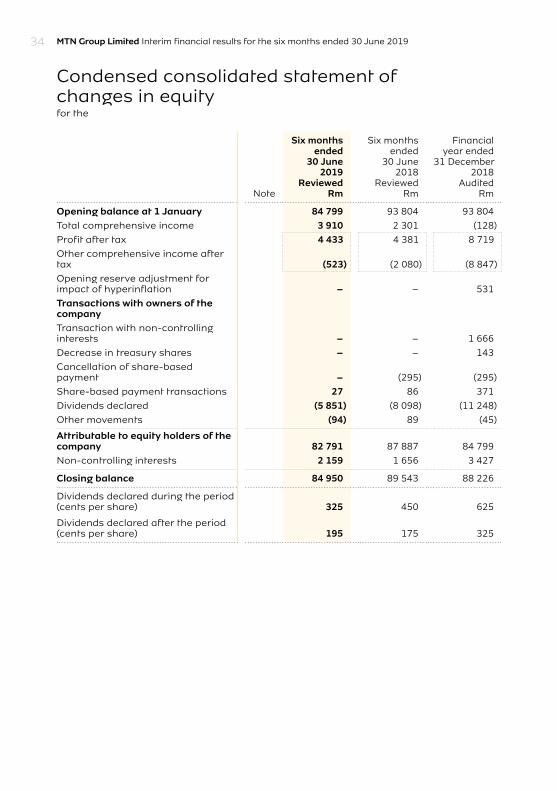
Condensed consolidated statement of changes in equityfor the
Note
Six months ended
30 June2019
ReviewedRm
Six monthsended
30 June2018
ReviewedRm
Financialyear ended
31 December2018
AuditedRm
Opening balance at 1 January 84 799 93 804 93 804
Total comprehensive income 3 910 2 301 (128)
Profit after tax 4 433 4 381 8 719
Other comprehensive income after tax (523) (2 080) (8 847)
Opening reserve adjustment for impact of hyperinflation – – 531
Transactions with owners of the companyTransaction with non-controlling interests – – 1 666
Decrease in treasury shares – – 143
Cancellation of share-based payment – (295) (295)
Share-based payment transactions 27 86 371
Dividends declared (5 851) (8 098) (11 248)
Other movements (94) 89 (45)
Attributable to equity holders of the company 82 791 87 887 84 799
Non-controlling interests 2 159 1 656 3 427
Closing balance 84 950 89 543 88 226
Dividends declared during the period (cents per share) 325 450 625
Dividends declared after the period (cents per share) 195 175 325
MTN Group Limited Interim financial results for the six months ended 30 June 2019 35Results overview
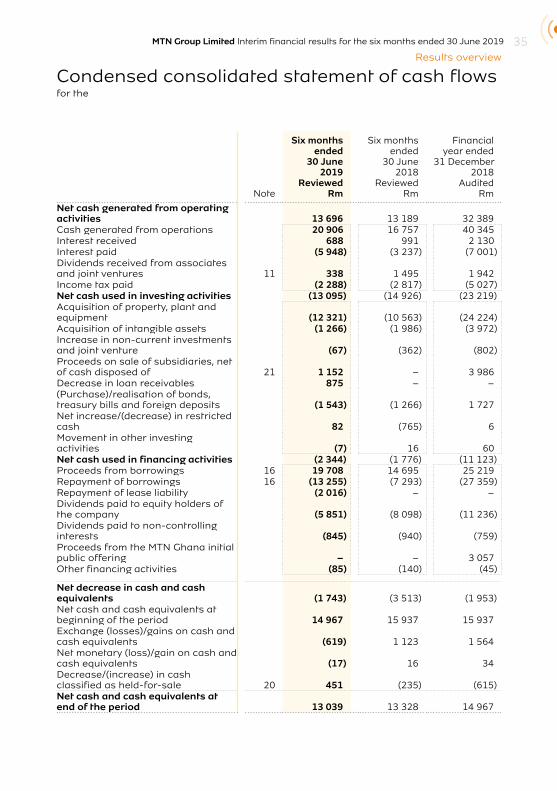
Condensed consolidated statement of cash flowsfor the
Note
Six months ended
30 June2019
ReviewedRm
Six months ended
30 June2018
ReviewedRm
Financialyear ended
31 December2018
AuditedRm
Net cash generated from operating activities 13 696 13 189 32 389Cash generated from operations 20 906 16 757 40 345 Interest received 688 991 2 130Interest paid (5 948) (3 237) (7 001)Dividends received from associates and joint ventures 11 338 1 495 1 942Income tax paid (2 288) (2 817) (5 027)Net cash used in investing activities (13 095) (14 926) (23 219)Acquisition of property, plant and equipment (12 321) (10 563) (24 224)Acquisition of intangible assets (1 266) (1 986) (3 972)Increase in non-current investments and joint venture (67) (362) (802)Proceeds on sale of subsidiaries, net of cash disposed of 21 1 152 – 3 986Decrease in loan receivables 875 – –(Purchase)/realisation of bonds, treasury bills and foreign deposits (1 543) (1 266) 1 727Net increase/(decrease) in restricted cash 82 (765) 6Movement in other investing activities (7) 16 60Net cash used in financing activities (2 344) (1 776) (11 123)Proceeds from borrowings 16 19 708 14 695 25 219Repayment of borrowings 16 (13 255) (7 293) (27 359)Repayment of lease liability (2 016) – –Dividends paid to equity holders of the company (5 851) (8 098) (11 236)Dividends paid to non-controlling interests (845) (940) (759)Proceeds from the MTN Ghana initial public offering – – 3 057Other financing activities (85) (140) (45)
Net decrease in cash and cash equivalents (1 743) (3 513) (1 953)Net cash and cash equivalents at beginning of the period 14 967 15 937 15 937Exchange (losses)/gains on cash and cash equivalents (619) 1 123 1 564Net monetary (loss)/gain on cash and cash equivalents (17) 16 34Decrease/(increase) in cash classified as held-for-sale 20 451 (235) (615)Net cash and cash equivalents at end of the period 13 039 13 328 14 967
MTN Group Limited Interim financial results for the six months ended 30 June 201936
1. Independent reviewThe directors of the company take full responsibility for the preparation of the condensed consolidated interim financial statements. The condensed consolidated interim financial statements have been reviewed by our joint auditors PricewaterhouseCoopers Inc. and SizweNtsalubaGobodo Grant Thornton Inc., who have expressed an unmodified conclusion thereon. The joint auditors have performed their review in accordance with International Standard on Review Engagements (ISRE) 2410.
2. General informationMTN Group Limited (the company) carries on the business of investing in the telecommunications industry through its subsidiary companies, joint ventures, associates and related investments.
3. Basis of preparationThe condensed consolidated interim financial statements for the six months ended 30 June 2019 are prepared in accordance with the requirements of the JSE Limited Listings Requirements for interim financial statements and the requirements of the Companies Act applicable to interim financial statements. The interim financial statements were prepared in accordance with the framework concepts and the measurement and recognition requirements of International Financial Reporting Standards (IFRS), SAICA Financial Reporting Guides as issued by the Accounting Practices Committee, Financial Pronouncements as issued by the Financial Reporting Standards Council (FRSC), and to also, as a minimum, contain the information required by IAS 34 Interim Financial Reporting.
The condensed consolidated interim financial statements should be read in conjunction with the annual financial statements for the year ended 31 December 2018, which have been prepared in accordance with IFRS.
4. Principal accounting policiesThe accounting policies applied in the preparation of the condensed consolidated interim financial statements are in terms of IFRS and are consistent with those accounting policies applied in the preparation of the previous consolidated annual financial statements except as described below.
The group has adopted IFRS 16 Leases (IFRS 16) with effect from 1 January 2019. A number of other new standards are effective from 1 January 2019, but they do not have a material effect on the group’s interim financial statements.
4.1 Adoption of IFRS 16IFRS 16 introduced a single, on-balance sheet accounting model for lessees. As a result, the group, as a lessee, has recognised right-of-use assets representing its rights to use the underlying assets and lease liabilities representing its obligation to make lease payments. After the adoption of IFRS 16, the group recognised a depreciation expense on the right-of-use assets and an interest expense accruing on the lease liabilities and no longer recognised an operating lease expense for these leases. Cash generated from operations increased as lease costs are no longer included in this category. Interest paid increased, as it includes the interest portion of the lease liability payments and the capital portion of lease liability repayments is included in cash used in financing activities. Lessor accounting remains similar to previous accounting policies.
Notes to the condensed consolidated interim financial statementsfor the six months ended 30 June 2019
MTN Group Limited Interim financial results for the six months ended 30 June 2019 37Results overview
4. Principal accounting policies continued
4.1 Adoption of IFRS 16 continued
The group has adopted IFRS 16 retrospectively from 1 January 2019, but has not restated comparatives for the 2018 reporting period, as permitted under the specific transitional provisions in the standard. The reclassifications and the adjustments arising from the adoption of IFRS 16 are therefore recognised in the opening statement of financial position on 1 January 2019.
4.1.1 The group’s leasing activities and significant accounting policies The group’s leases include network infrastructure (including tower space and land), retail stores, vehicles and office equipment. Rental contracts are typically made for fixed periods varying between two to 15 years but may have renewal periods as described below.
As a lessee, the group previously classified leases as operating or finance leases based on its assessment of whether the lease transferred substantially all of the risks and rewards of ownership. Payments made under operating leases (net of any incentives received from the lessor) were charged to profit or loss on a straight-line basis over the period of the lease.
From 1 January 2019, the group recognises right-of-use assets and lease liabilities at the lease commencement date for most leases. However, the group has elected not to recognise right-of-use assets and lease liabilities for some leases of low-value assets (e.g. office equipment) and for short-term leases, i.e. leases that at commencement date have lease terms of 12 months or less. The group defines low-value leases as leases of assets for which the value of the underlying asset when it is new is US$5 000 or less and is not considered fundamental to its network. The group recognises the lease payments associated with these leases as an expense on a straight-line basis over the lease term.
The recognised right-of-use assets relate to the following types of assets:
30 June 2019
Rm
1 January 2019
Rm
Network infrastructure 33 702 36 113
Land and buildings 9 575 9 456
Licences 1 800 –
Other 60 73
Total right-of-use assets 45 137 45 642
The lease liability is initially measured at the present value of the following lease payments:■■ Fixed payments (including in-substance fixed payments), less any incentives receivable.
■■ Variable lease payments that are based on an index or rate, measured using the index or rate as at the lease commencement date.
■■ Amounts that are expected to be payable by the lessee under residual value guarantees.
■■ The exercise price of a purchase option if the lessee is reasonably certain to exercise that option.
■■ Payments of penalties for terminating the lease, if the lease term reflects the lessee exercising that option.
Notes to the condensed consolidated interim financial statements continuedfor the six months ended 30 June 2019
MTN Group Limited Interim financial results for the six months ended 30 June 201938
4. Principal accounting policies continued
4.1 Adoption of IFRS 16 continued
4.1.1 The group’s leasing activities and significant accounting policies continued The lease payments are discounted using the interest rate implicit in the lease. If that rate cannot be readily determined, the group’s incremental borrowing rate is used, being the rate that the lessee would have to pay to borrow the funds necessary to obtain an asset of similar value in a similar economic environment with similar terms and conditions. Generally, the group uses its incremental borrowing rate as the discount rate.
The lease liability is subsequently increased by the interest cost on the lease liability and decreased by lease payments made. Interest costs are charged to the income statement over the lease period so as to produce a constant periodic rate of interest on the remaining balance of the liability for each period. It is remeasured when there is a change in future lease payments arising from a change in index or rate, a change in the estimate of the amount payable under a residual value guarantee, or as appropriate, changes in the assessment of whether a purchase or extension option is reasonably certain to be exercised or a termination option is reasonably certain not to be exercised.
The right-of-use assets are initially measured at cost comprising the following:■■ The amount of the initial measurement of the lease liability. ■■ Any lease payments made at or before the commencement date less any lease incentives received.
■■ Any initial direct costs.■■ Decommissioning costs.
The right-of-use assets are subsequently measured at cost less any accumulated depreciation and impairment losses and adjusted for certain remeasurements of the lease liability. The right-of-use assets are depreciated over the shorter of the assets’ useful lives and the lease terms on a straight-line basis.
Renewal and termination options A number of lease contracts include the option to renew the lease for a further period or terminate the lease earlier. The majority of extension and termination options held are exercisable only by the group and not by the respective lessor.
In determining the lease term, management considers all facts and circumstances that create an economic incentive to exercise an extension option, or not exercise a termination option. Extension options (or periods after termination options) are only included in the lease term if the lease is reasonably certain to be extended (or not terminated). The group applies judgement in assessing whether it is reasonably likely that options will be exercised. Factors considered include how far in the future an option occurs, the group’s business planning cycle of three to five years and past history of terminating/not renewing leases.
The assessment is reviewed if a significant event or a significant change in circumstances occurs which affects this assessment and that is within the control of the lessee.
A number of leases entitle both the group and the lessor to terminate the lease without a termination penalty. In determining whether the group has an economic incentive to not exercise the termination option, the group considers the broader economics of the contract and not only contractual termination payments.
Notes to the condensed consolidated interim financial statements continuedfor the six months ended 30 June 2019
MTN Group Limited Interim financial results for the six months ended 30 June 2019 39Results overview
4. Principal accounting policies continued
4.1 Adoption of IFRS 16 continued
4.1.1 The group’s leasing activities and significant accounting policies continued Lease and non-lease componentsA number of lease contracts include both lease and non-lease components. The group allocates the consideration in the contract to each lease and non-lease component on the basis of their relative stand-alone selling prices. The stand-alone selling prices of each component are based on available market prices. The group has not elected the practical expedient to account for non-lease components as part of its lease liabilities and right-of-use assets. Therefore, non-lease components are accounted for as operating expenses and are recognised in profit or loss as they are incurred.
4.1.2 Transition At transition, for leases classified as operating leases under IAS 17, lease liabilities were measured at the present value of the remaining lease payments, discounted at the group’s incremental borrowing rate, for the remaining lease terms, as at 1 January 2019. Right-of-use assets were measured at an amount equal to the lease liability, adjusted by the amount of any prepaid or accrued lease payments.
The group used the following practical expedients as permitted by the standard, when applying IFRS 16 to leases previously classified as operating leases under IAS 17:■■ Applied a single discount rate to a portfolio of leases with reasonably similar characteristics.
■■ Accounted for leases with a remaining lease term of less than 12 months as at 1 January 2019 as short-term leases.
■■ Excluded initial direct costs from measuring the right-of-use asset at the date of initial application.
■■ Used hindsight when determining the lease term if the contract contains options to extend or terminate the lease.
■■ Relied on previous assessments on whether leases are onerous contracts as opposed to performing an impairment review on 1 January 2019.
The group has also elected not to reassess whether a contract is, or contains a lease, at the date of initial application. Instead, for contracts entered into before the transition date the group relied on its assessment made applying IAS 17 and IFRIC 4 Determining whether an Arrangement Contains a Lease (IFRIC 4).
The group classified a number of leases of vehicles and land and buildings as finance leases under IAS 17. For finance leases, the carrying amount of the right-of-use asset and the lease liability at 1 January 2019 were determined at the carrying amount of the lease asset and lease liability under IAS 17 immediately before that date.
Notes to the condensed consolidated interim financial statements continuedfor the six months ended 30 June 2019
MTN Group Limited Interim financial results for the six months ended 30 June 201940
4. Principal accounting policies continued
4.1 Adoption of IFRS 16 continued
4.1.3 Impacts on financial statements4.1.3.1 Impacts on transition
On transition to IFRS 16, the group recognised right-of-use assets and lease liabilities. The impact on transition is summarised below:
1 January2019
Rm
Property, plant and equipment (149)
Right-of-use assets 45 642Non-current prepayments1 (182)Prepayments2 (622)
Total assets 44 689
Lease liabilities – non-current 42 052Other non-current liabilities3 (615)Lease liabilities – current 3 303Trade and other payables (51)
Total liabilities 44 6891 Included in the “Deferred tax and other non-current assets” line item on the statement of financial
position.2 Included in the “Trade and other receivables” line item on the statement of financial position.3 Included in the “Deferred tax and other non-current liabilities” line item on the statement of financial
position.
The right-of-use assets recognised on 1 January 2019 relate to the following operating segments:
Rm
South Africa 11 038Nigeria 20 264SEAGHA 9 041WECA 3 920MENA 1 274Head office companies 105
45 642
Notes to the condensed consolidated interim financial statements continuedfor the six months ended 30 June 2019
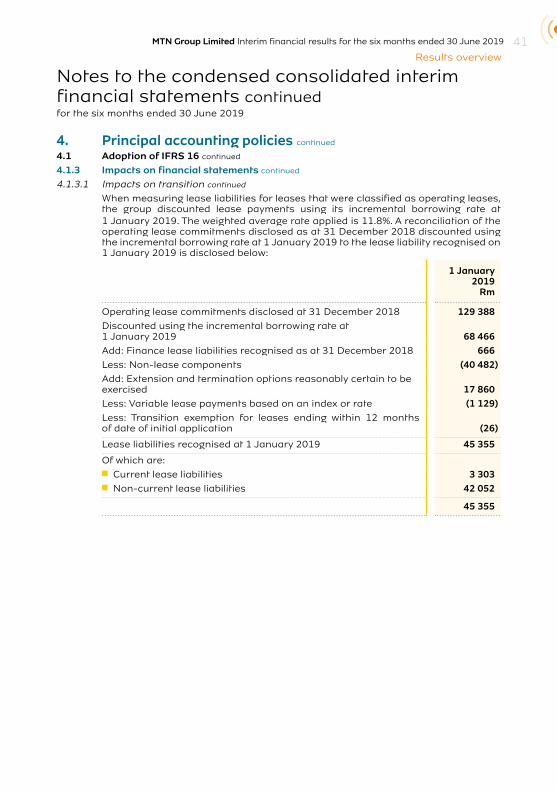
MTN Group Limited Interim financial results for the six months ended 30 June 2019 41Results overview
4. Principal accounting policies continued
4.1 Adoption of IFRS 16 continued
4.1.3 Impacts on financial statements continued
4.1.3.1 Impacts on transition continued
When measuring lease liabilities for leases that were classified as operating leases, the group discounted lease payments using its incremental borrowing rate at 1 January 2019. The weighted average rate applied is 11.8%. A reconciliation of the operating lease commitments disclosed as at 31 December 2018 discounted using the incremental borrowing rate at 1 January 2019 to the lease liability recognised on 1 January 2019 is disclosed below:
1 January2019
Rm
Operating lease commitments disclosed at 31 December 2018 129 388Discounted using the incremental borrowing rate at 1 January 2019 68 466Add: Finance lease liabilities recognised as at 31 December 2018 666Less: Non-lease components (40 482)Add: Extension and termination options reasonably certain to be exercised 17 860Less: Variable lease payments based on an index or rate (1 129)Less: Transition exemption for leases ending within 12 months of date of initial application (26)
Lease liabilities recognised at 1 January 2019 45 355
Of which are:■■ Current lease liabilities 3 303■■ Non-current lease liabilities 42 052
45 355
Notes to the condensed consolidated interim financial statements continuedfor the six months ended 30 June 2019
MTN Group Limited Interim financial results for the six months ended 30 June 201942
4. Principal accounting policies continued
4.1 Adoption of IFRS 16 continued
4.1.3 Impacts on financial statements continued
4.1.3.2 Impacts for the periodAs a result of applying IFRS 16, in relation to the leases that were previously classified as operating leases, the group recognised R44 975 million of right-of-use assets and R45 180 million of lease liabilities as at 30 June 2019.
Also in relation to those leases under IFRS 16, the group has recognised depreciation and interest costs, instead of operating lease expenses of R4 371 million that would have been recognised under IAS 17. During the six months ended 30 June 2019, the group recognised R2 774 million of depreciation charges and R2 640 million of interest costs from these leases. Foreign exchange losses of R48 million were recognised on foreign denominated lease liabilities.
Earnings per share decreased by 39 cents per share for the six months ended 30 June 2019 as a result of the adoption of IFRS 16. Due to the impact of the reducing finance charges over the life of the lease, the impact of adopting IFRS 16 is initially dilutive, before being accretive in later periods.
Cash from operating activities includes interest paid on lease liabilities of R2 305 million and cash used in financing activities includes R2 016 million for the capital portion of lease liability repayments. The cash flows were previously recognised as net cash generated from operations.
5. Critical accounting judgement 5.1 Accounting for Mobile Money customer deposits and related bank balances
The group offers payment services from mobile devices in the majority of its operations. These Mobile Money services involve the issuing of electronic money (MoMo) into a MoMo electronic wallet in return for cash paid by the mobile phone subscriber. MTN provides the software to administer the MoMo wallet. In all instances, any monetary value stored on a customer’s MoMo wallet must be supported by an equivalent cash deposit held with a bank or multiple banks. Mobile Money regulations by central banks are at various stages of development and implementation across the group’s operations. These regulations govern the way mobile money services are conducted as well as the rights and obligations of all parties to the Mobile Money service offering, including rights to cash backing the Mobile Money issued, held with the banks and obligations to make payments to subscribers.
In considering the appropriate accounting treatment for MoMo cash balances held by banks and the subscribers’ right to the cash, the group considered several factors relating to the underlying cash balances. In exercising its judgement, the group concluded that the most significant factor considered was the group’s exposure to MoMo holders in the event of a credit risk event relating to the cash balances held by the banks. In instances where the group is exposed to MoMo holders in the event of a credit risk event, the cash held with banks and related liabilities are recognised in the MTN Group statement of financial position.
Notes to the condensed consolidated interim financial statements continuedfor the six months ended 30 June 2019
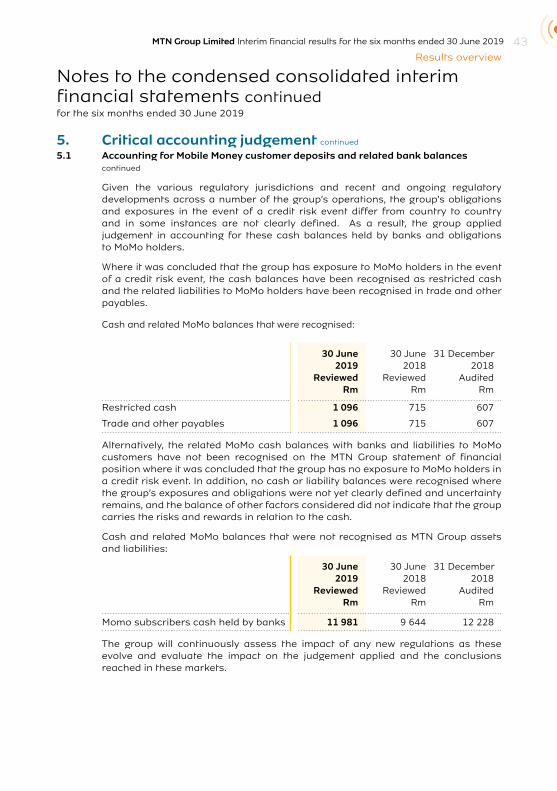
MTN Group Limited Interim financial results for the six months ended 30 June 2019 43Results overview
Notes to the condensed consolidated interim financial statements continuedfor the six months ended 30 June 2019
5. Critical accounting judgement continued
5.1 Accounting for Mobile Money customer deposits and related bank balances continued
Given the various regulatory jurisdictions and recent and ongoing regulatory developments across a number of the group’s operations, the group’s obligations and exposures in the event of a credit risk event differ from country to country and in some instances are not clearly defined. As a result, the group applied judgement in accounting for these cash balances held by banks and obligations to MoMo holders.
Where it was concluded that the group has exposure to MoMo holders in the event of a credit risk event, the cash balances have been recognised as restricted cash and the related liabilities to MoMo holders have been recognised in trade and other payables.
Cash and related MoMo balances that were recognised:
30 June2019
ReviewedRm
30 June2018
ReviewedRm
31 December2018
AuditedRm
Restricted cash 1 096 715 607
Trade and other payables 1 096 715 607
Alternatively, the related MoMo cash balances with banks and liabilities to MoMo customers have not been recognised on the MTN Group statement of financial position where it was concluded that the group has no exposure to MoMo holders in a credit risk event. In addition, no cash or liability balances were recognised where the group’s exposures and obligations were not yet clearly defined and uncertainty remains, and the balance of other factors considered did not indicate that the group carries the risks and rewards in relation to the cash.
Cash and related MoMo balances that were not recognised as MTN Group assets and liabilities:
30 June2019
ReviewedRm
30 June2018
ReviewedRm
31 December2018
AuditedRm
Momo subscribers cash held by banks 11 981 9 644 12 228
The group will continuously assess the impact of any new regulations as these evolve and evaluate the impact on the judgement applied and the conclusions reached in these markets.
MTN Group Limited Interim financial results for the six months ended 30 June 201944
6. HyperinflationThe financial statements (including comparative amounts) of the group entities whose functional currencies are the currencies of hyperinflationary economies are adjusted in terms of the measuring unit current at the end of the reporting period.
The economy of Sudan was assessed to be hyperinflationary effective 1 July 2018, and hyperinflation accounting was applied for the six months ended 31 December 2018. Upon first application of hyperinflation, net prior period gains of R625 million were recognised directly in equity. The uplift of the assets on initial adoption resulted in the net asset value of MTN Sudan Company Limited (MTN Sudan) exceeding its estimated recoverable amount. As a result of this, the initial adjustment was capped to the recoverable amount and the difference recorded directly to retained earnings. If the initial uplift had not been capped, the related increase in opening equity would have been R1,2 billion.
As at 31 December 20171 , the historical increase in the asset value as a result of hyperinflation accounting had been fully impaired. During the six-month period ended 30 June 2018, R306 million of the impairment was reversed. This amount represents the full impairment recognised during 2017, translated at a significantly weaker exchange rate.
The economy of South Sudan was assessed to be hyperinflationary, effective 1 January 2016, and hyperinflation accounting has been applied since.
In 2015, the Iranian economy was assessed to no longer be hyperinflationary and hyperinflation accounting was discontinued effective 1 July 2015. The group’s results from Irancell Telecommunications Company Services (PJSC) (MTN Iran) includes expenses resulting from the discontinuation of hyperinflation accounting mainly relating to the subsequent depreciation of assets that were historically written up under hyperinflation accounting. The additional income statement charge reduced equity-accounted earnings from Iran by R252 million for the six months ended 30 June 2019 (June 2018: R540 million) (December 2018: R873 million).
The economy of Syria was assessed to be hyperinflationary, effective 1 January 2014, and hyperinflation accounting has been applied since. The group’s proxy indicator for inflation in Syria remained stable during the year. Therefore, a hyperinflation adjustment factor of one was applied during the period.
1 Hyperinflationary accounting was applied previously in MTN Sudan, up until 30 June 2016.
Notes to the condensed consolidated interim financial statements continuedfor the six months ended 30 June 2019
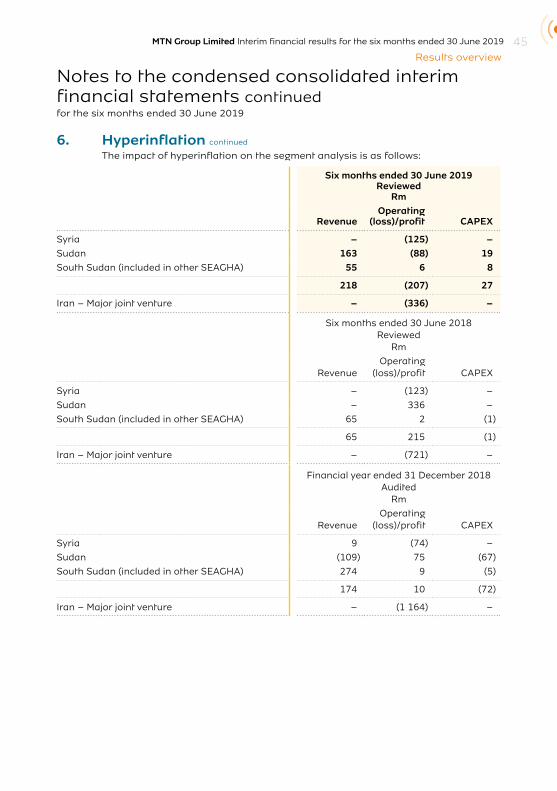
MTN Group Limited Interim financial results for the six months ended 30 June 2019 45Results overview
6. Hyperinflation continued
The impact of hyperinflation on the segment analysis is as follows:
Six months ended 30 June 2019Reviewed
Rm
RevenueOperating
(loss)/profit CAPEX
Syria – (125) –Sudan 163 (88) 19South Sudan (included in other SEAGHA) 55 6 8
218 (207) 27
Iran – Major joint venture – (336) –
Six months ended 30 June 2018Reviewed
Rm
RevenueOperating
(loss)/profit CAPEX
Syria – (123) –
Sudan – 336 –
South Sudan (included in other SEAGHA) 65 2 (1)
65 215 (1)
Iran – Major joint venture – (721) –
Financial year ended 31 December 2018Audited
Rm
RevenueOperating
(loss)/profit CAPEX
Syria 9 (74) –
Sudan (109) 75 (67)
South Sudan (included in other SEAGHA) 274 9 (5)
174 10 (72)
Iran – Major joint venture – (1 164) –
Notes to the condensed consolidated interim financial statements continuedfor the six months ended 30 June 2019
MTN Group Limited Interim financial results for the six months ended 30 June 201946
7. Segment analysisThe group has identified reportable segments that are used by the group executive committee (chief operating decision maker (CODM)) to make key operating decisions, allocate resources and assess performance. The reportable segments are largely grouped according to their geographic locations and reporting lines to the CODM.
The group’s underlying operations are clustered as follows:■■ South Africa.■■ Nigeria.■■ South and East Africa and Ghana (SEAGHA).■■ West and Central Africa (WECA).■■ Middle East and North Africa (MENA).
South Africa and Nigeria comprise the segment information for the South African and Nigerian based cellular network services providers respectively.
The SEAGHA, WECA and MENA clusters comprise segment information for operations in those regions which are also cellular network services providers in the group.
Operating results are reported and reviewed regularly by the CODM and include items directly attributable to a segment as well as those that are attributed on a reasonable basis, whether from external transactions or from transactions with other group segments.
A key performance measure of reporting profit for the group is CODM EBITDA. CODM EBITDA is defined as earnings before finance income and finance costs (which includes gains or losses on foreign exchange transactions), tax, depreciation and amortisation, and is also presented before recognising the following items:
■■ Impairment of joint venture and goodwill;■■ Net monetary gain resulting from the application of hyperinflation; ■■ Share of results of associates and joint ventures after tax;■■ Hyperinflation (note 6);■■ Tower sale profits;■■ Gain on disposal of subsidiary (note 21);■■ CBN resolution; and■■ Gain on dilution of investment in associate and joint venture.
Notes to the condensed consolidated interim financial statements continuedfor the six months ended 30 June 2019
MTN Group Limited Interim financial results for the six months ended 30 June 2019 47Results overview
Notes to the condensed consolidated interim financial statements continuedfor the six months ended 30 June 2019
7. Segment analysis continued
These exclusions have remained unchanged from the prior year, with the exception of an impairment on joint venture that did not occur in the prior year.
Iran proportionate results are included in the segment analysis as reviewed by the CODM and excluded from reported results for revenue, CODM EBITDA and capex due to equity accounting for joint ventures. The results of Iran in the segment analysis exclude the impact of hyperinflation accounting.
MTN SA revenue recognitionCell C Limited (Cell C) and Mobile Telephone Networks Proprietary Limited (MTN SA) entered into a network roaming agreement in 2018. Following delayed payments by Cell C during the first half of 2019, the group concluded that a change in facts and circumstances occurred as defined in terms of IFRS 15 Revenue from Contracts with Customers (IFRS 15), and the network roaming agreement with Cell C no longer met the definition of a contract for revenue recognition purposes in terms of IFRS 15. As a result, MTN SA did not recognise all revenue accrued on satisfied performance obligations. Revenue was only recognised on completed services based on the non-refundable consideration received and the group impaired the receivable balance recognised by R211 million. The group is evaluating a sustainable solution to the network roaming agreement with Cell C.

MTN Group Limited Interim financial results for the six months ended 30 June 201948
7. Segment analysis continued
Six months ended 30 JuneREVENUE
Network services1
Rm
Mobile devices
Rm
Interconnect and roaming1
Rm
Digital and Fintech1
RmOther1
Rm
Revenue from
contracts with
customersRm
Interest revenue
Rm
Total revenue
Rm
2019South Africa 13 528 4 333 2 519 1 053 752 22 185 209 22 394Nigeria 18 716 43 2 345 896 232 22 232 - 22 232SEAGHA 8 572 160 820 2 769 343 12 664 - 12 664Ghana 4 384 43 427 1 543 95 6 492 - 6 492Uganda 2 128 30 196 777 58 3 189 - 3 189Other SEAGHA 2 060 87 197 449 190 2 983 - 2 983WECA 7 893 79 1 177 1 143 290 10 582 - 10 582Ivory Coast 2 244 21 453 510 175 3 403 - 3 403Cameroon 2 061 25 259 241 26 2 612 - 2 612Other WECA 3 588 33 465 392 89 4 567 - 4 567MENA 3 408 18 484 161 33 4 104 - 4 104Syria 1 238 – 20 74 10 1 342 - 1 342Sudan 540 2 227 29 9 807 - 807Other MENA 1 630 16 237 58 14 1 955 - 1 955
Major joint venture - Iran 3 362 48 261 279 49 3 999 13 4 012Head office companies and eliminations 157 (4) (184) 33 309 311 - 311Hyperinflation impact 158 1 51 7 1 218 - 218Iran revenue exclusion (3 362) (48) (261) (279) (49) (3 999) (13) (4 012)Consolidated revenue 52 432 4 630 7 212 6 062 1 960 72 296 209 72 5052018South Africa 13 891 3 672 1 478 1 250 684 20 975 188 21 163 Nigeria 14 128 46 1 736 1 074 246 17 230 – 17 230 SEAGHA 6 856 120 818 2 265 283 10 342 – 10 342 Ghana 3 612 37 466 1 267 164 5 546 – 5 546 Uganda 1 548 20 163 679 30 2 440 – 2 440 Other SEAGHA 1 696 63 189 319 89 2 356 – 2 356 WECA 6 953 86 1 331 982 265 9 617 – 9 617 Ivory Coast 2 244 23 511 551 158 3 487 – 3 487 Cameroon 1 867 36 273 186 22 2 384 – 2 384 Other WECA 2 842 27 547 245 85 3 746 – 3 746 MENA 3 382 160 563 156 135 4 396 – 4 396 Syria 955 – 20 41 9 1 025 – 1 025 Sudan 546 3 226 42 12 829 – 829 Other MENA 1 881 157 317 73 114 2 542 – 2 542 Major joint venture - Iran 5 536 92 513 728 120 6 989 19 7 008Head office companies and eliminations (17) 2 (202) 2 179 (36) – (36)Hyperinflation impact 49 1 11 1 3 65 – 65Iran revenue exclusion (5 536) (92) (513) (728) (120) (6 989) (19) (7 008)Consolidated revenue 45 242 4 087 5 735 5 730 1 795 62 589 188 62 777 1 Subsequent to the publication of the December 2018 full year results, the group has reviewed and aligned its
revenue streams relating to its Consumer, Enterprise and Wholesale business units with its current operating structure. The redefined segmentation has resulted in the reallocation of certain revenue streams and comparative numbers have been restated accordingly. The most significant changes resulted from the reallocation of revenue from ICT internet services and bulk sms services, that previously formed part of other revenue, to network services.
Notes to the condensed consolidated interim financial statements continuedfor the six months ended 30 June 2019
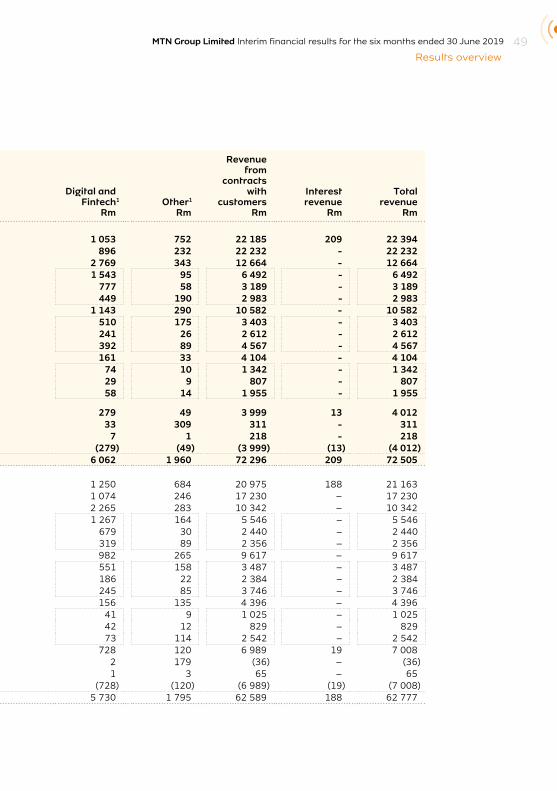
MTN Group Limited Interim financial results for the six months ended 30 June 2019 49Results overview
7. Segment analysis continued
Six months ended 30 JuneREVENUE
Network services1
Rm
Mobile devices
Rm
Interconnect and roaming1
Rm
Digital and Fintech1
RmOther1
Rm
Revenue from
contracts with
customersRm
Interest revenue
Rm
Total revenue
Rm
2019South Africa 13 528 4 333 2 519 1 053 752 22 185 209 22 394Nigeria 18 716 43 2 345 896 232 22 232 - 22 232SEAGHA 8 572 160 820 2 769 343 12 664 - 12 664Ghana 4 384 43 427 1 543 95 6 492 - 6 492Uganda 2 128 30 196 777 58 3 189 - 3 189Other SEAGHA 2 060 87 197 449 190 2 983 - 2 983WECA 7 893 79 1 177 1 143 290 10 582 - 10 582Ivory Coast 2 244 21 453 510 175 3 403 - 3 403Cameroon 2 061 25 259 241 26 2 612 - 2 612Other WECA 3 588 33 465 392 89 4 567 - 4 567MENA 3 408 18 484 161 33 4 104 - 4 104Syria 1 238 – 20 74 10 1 342 - 1 342Sudan 540 2 227 29 9 807 - 807Other MENA 1 630 16 237 58 14 1 955 - 1 955
Major joint venture - Iran 3 362 48 261 279 49 3 999 13 4 012Head office companies and eliminations 157 (4) (184) 33 309 311 - 311Hyperinflation impact 158 1 51 7 1 218 - 218Iran revenue exclusion (3 362) (48) (261) (279) (49) (3 999) (13) (4 012)Consolidated revenue 52 432 4 630 7 212 6 062 1 960 72 296 209 72 5052018South Africa 13 891 3 672 1 478 1 250 684 20 975 188 21 163 Nigeria 14 128 46 1 736 1 074 246 17 230 – 17 230 SEAGHA 6 856 120 818 2 265 283 10 342 – 10 342 Ghana 3 612 37 466 1 267 164 5 546 – 5 546 Uganda 1 548 20 163 679 30 2 440 – 2 440 Other SEAGHA 1 696 63 189 319 89 2 356 – 2 356 WECA 6 953 86 1 331 982 265 9 617 – 9 617 Ivory Coast 2 244 23 511 551 158 3 487 – 3 487 Cameroon 1 867 36 273 186 22 2 384 – 2 384 Other WECA 2 842 27 547 245 85 3 746 – 3 746 MENA 3 382 160 563 156 135 4 396 – 4 396 Syria 955 – 20 41 9 1 025 – 1 025 Sudan 546 3 226 42 12 829 – 829 Other MENA 1 881 157 317 73 114 2 542 – 2 542 Major joint venture - Iran 5 536 92 513 728 120 6 989 19 7 008Head office companies and eliminations (17) 2 (202) 2 179 (36) – (36)Hyperinflation impact 49 1 11 1 3 65 – 65Iran revenue exclusion (5 536) (92) (513) (728) (120) (6 989) (19) (7 008)Consolidated revenue 45 242 4 087 5 735 5 730 1 795 62 589 188 62 777 1 Subsequent to the publication of the December 2018 full year results, the group has reviewed and aligned its
revenue streams relating to its Consumer, Enterprise and Wholesale business units with its current operating structure. The redefined segmentation has resulted in the reallocation of certain revenue streams and comparative numbers have been restated accordingly. The most significant changes resulted from the reallocation of revenue from ICT internet services and bulk sms services, that previously formed part of other revenue, to network services.
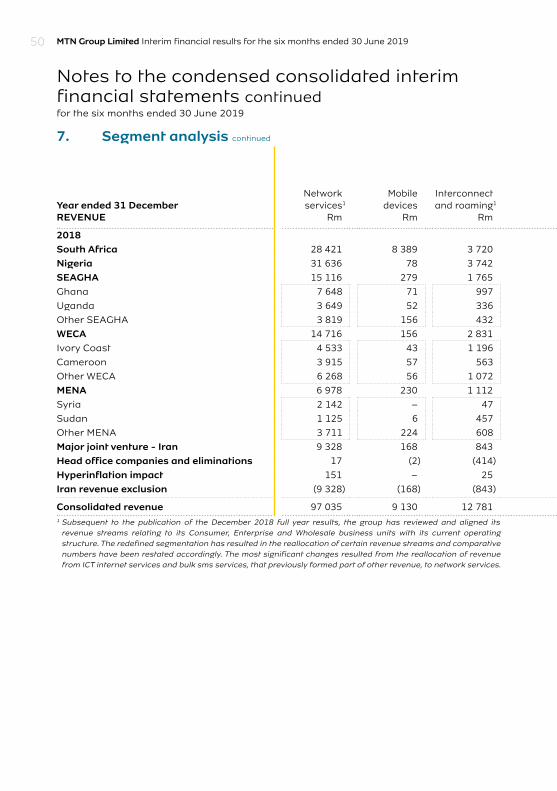
MTN Group Limited Interim financial results for the six months ended 30 June 201950
Notes to the condensed consolidated interim financial statements continuedfor the six months ended 30 June 2019
7. Segment analysis continued
Year ended 31 DecemberREVENUE
Network services1
Rm
Mobile devices
Rm
Interconnect and roaming1
Rm
Digital and Fintech1
RmOther1
Rm
Revenue from
contracts with
customersRm
Interestrevenue
Rm
Total revenue
Rm
2018South Africa 28 421 8 389 3 720 2 441 1 296 44 267 391 44 658
Nigeria 31 636 78 3 742 1 992 523 37 971 – 37 971
SEAGHA 15 116 279 1 765 5 048 405 22 613 – 22 613
Ghana 7 648 71 997 2 944 200 11 860 – 11 860
Uganda 3 649 52 336 1 329 57 5 423 – 5 423
Other SEAGHA 3 819 156 432 775 148 5 330 – 5 330
WECA 14 716 156 2 831 1 995 525 20 223 – 20 223
Ivory Coast 4 533 43 1 196 1 063 323 7 158 – 7 158
Cameroon 3 915 57 563 377 47 4 959 – 4 959
Other WECA 6 268 56 1 072 555 155 8 106 – 8 106
MENA 6 978 230 1 112 312 213 8 845 – 8 845
Syria 2 142 – 47 90 19 2 298 – 2 298
Sudan 1 125 6 457 89 21 1 698 – 1 698
Other MENA 3 711 224 608 133 173 4 849 – 4 849
Major joint venture - Iran 9 328 168 843 1 101 194 11 634 33 11 667
Head office companies and eliminations 17 (2) (414) 1 474 76 – 76
Hyperinflation impact 151 – 25 (16) 14 174 – 174
Iran revenue exclusion (9 328) (168) (843) (1 101) (194) (11 634) (33) (11 667)
Consolidated revenue 97 035 9 130 12 781 11 773 3 450 134 169 391 134 560 1 Subsequent to the publication of the December 2018 full year results, the group has reviewed and aligned its
revenue streams relating to its Consumer, Enterprise and Wholesale business units with its current operating structure. The redefined segmentation has resulted in the reallocation of certain revenue streams and comparative numbers have been restated accordingly. The most significant changes resulted from the reallocation of revenue from ICT internet services and bulk sms services, that previously formed part of other revenue, to network services.

MTN Group Limited Interim financial results for the six months ended 30 June 2019 51Results overview
7. Segment analysis continued
Year ended 31 DecemberREVENUE
Network services1
Rm
Mobile devices
Rm
Interconnect and roaming1
Rm
Digital and Fintech1
RmOther1
Rm
Revenue from
contracts with
customersRm
Interestrevenue
Rm
Total revenue
Rm
2018South Africa 28 421 8 389 3 720 2 441 1 296 44 267 391 44 658
Nigeria 31 636 78 3 742 1 992 523 37 971 – 37 971
SEAGHA 15 116 279 1 765 5 048 405 22 613 – 22 613
Ghana 7 648 71 997 2 944 200 11 860 – 11 860
Uganda 3 649 52 336 1 329 57 5 423 – 5 423
Other SEAGHA 3 819 156 432 775 148 5 330 – 5 330
WECA 14 716 156 2 831 1 995 525 20 223 – 20 223
Ivory Coast 4 533 43 1 196 1 063 323 7 158 – 7 158
Cameroon 3 915 57 563 377 47 4 959 – 4 959
Other WECA 6 268 56 1 072 555 155 8 106 – 8 106
MENA 6 978 230 1 112 312 213 8 845 – 8 845
Syria 2 142 – 47 90 19 2 298 – 2 298
Sudan 1 125 6 457 89 21 1 698 – 1 698
Other MENA 3 711 224 608 133 173 4 849 – 4 849
Major joint venture - Iran 9 328 168 843 1 101 194 11 634 33 11 667
Head office companies and eliminations 17 (2) (414) 1 474 76 – 76
Hyperinflation impact 151 – 25 (16) 14 174 – 174
Iran revenue exclusion (9 328) (168) (843) (1 101) (194) (11 634) (33) (11 667)
Consolidated revenue 97 035 9 130 12 781 11 773 3 450 134 169 391 134 560 1 Subsequent to the publication of the December 2018 full year results, the group has reviewed and aligned its
revenue streams relating to its Consumer, Enterprise and Wholesale business units with its current operating structure. The redefined segmentation has resulted in the reallocation of certain revenue streams and comparative numbers have been restated accordingly. The most significant changes resulted from the reallocation of revenue from ICT internet services and bulk sms services, that previously formed part of other revenue, to network services.
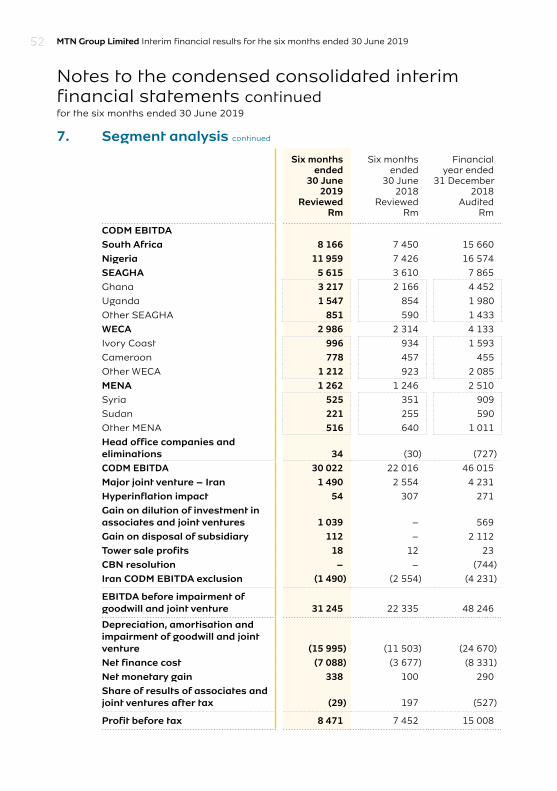
MTN Group Limited Interim financial results for the six months ended 30 June 201952
Notes to the condensed consolidated interim financial statements continuedfor the six months ended 30 June 2019
7. Segment analysis continued
Six months ended
30 June2019
ReviewedRm
Six months ended
30 June2018
ReviewedRm
Financialyear ended
31 December2018
AuditedRm
CODM EBITDASouth Africa 8 166 7 450 15 660
Nigeria 11 959 7 426 16 574
SEAGHA 5 615 3 610 7 865
Ghana 3 217 2 166 4 452
Uganda 1 547 854 1 980
Other SEAGHA 851 590 1 433
WECA 2 986 2 314 4 133
Ivory Coast 996 934 1 593
Cameroon 778 457 455
Other WECA 1 212 923 2 085
MENA 1 262 1 246 2 510
Syria 525 351 909
Sudan 221 255 590
Other MENA 516 640 1 011
Head office companies and eliminations 34 (30) (727)
CODM EBITDA 30 022 22 016 46 015
Major joint venture – Iran 1 490 2 554 4 231
Hyperinflation impact 54 307 271
Gain on dilution of investment in associates and joint ventures 1 039 – 569
Gain on disposal of subsidiary 112 – 2 112
Tower sale profits 18 12 23
CBN resolution – – (744)
Iran CODM EBITDA exclusion (1 490) (2 554) (4 231)
EBITDA before impairment of goodwill and joint venture 31 245 22 335 48 246
Depreciation, amortisation and impairment of goodwill and joint venture (15 995) (11 503) (24 670)
Net finance cost (7 088) (3 677) (8 331)
Net monetary gain 338 100 290
Share of results of associates and joint ventures after tax (29) 197 (527)
Profit before tax 8 471 7 452 15 008

MTN Group Limited Interim financial results for the six months ended 30 June 2019 53Results overview
Notes to the condensed consolidated interim financial statements continuedfor the six months ended 30 June 2019
7. Segment analysis continued
Six months ended
30 June2019
ReviewedRm
Six months ended
30 June2018
ReviewedRm
Financialyear ended
31 December2018
AuditedRm
CAPITAL EXPENDITUREINCURRED South Africa 5 773 3 907 9 448
Nigeria 4 050 2 320 6 888
SEAGHA 3 574 2 219 3 801
Ghana 2 080 1 260 2 015
Uganda 679 392 793
Other SEAGHA 815 567 993
WECA 1 218 2 351 3 281
Ivory Coast 257 562 1 364
Cameroon 415 101 694
Other WECA 546 1 688 1 223
MENA 646 572 2 215
Syria 332 102 935
Sudan 119 59 439
Other MENA 195 411 841
Major joint venture - Iran 861 1 622 3 716
Head office companies and eliminations 194 93 457
Hyperinflation impact 27 (1) (72)
Iran CAPEX exclusion (861) (1 622) (3 716)
15 482 11 461 26 018
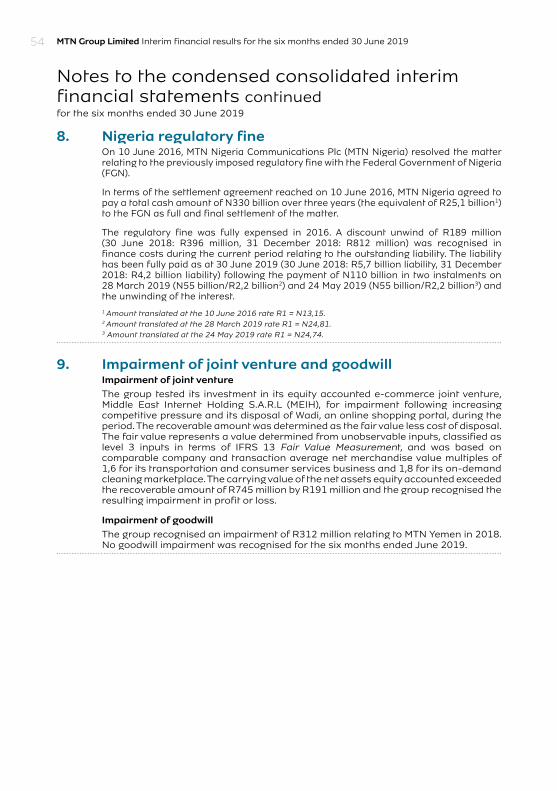
MTN Group Limited Interim financial results for the six months ended 30 June 201954
8. Nigeria regulatory fineOn 10 June 2016, MTN Nigeria Communications Plc (MTN Nigeria) resolved the matter relating to the previously imposed regulatory fine with the Federal Government of Nigeria (FGN).
In terms of the settlement agreement reached on 10 June 2016, MTN Nigeria agreed to pay a total cash amount of N330 billion over three years (the equivalent of R25,1 billion1) to the FGN as full and final settlement of the matter.
The regulatory fine was fully expensed in 2016. A discount unwind of R189 million (30 June 2018: R396 million, 31 December 2018: R812 million) was recognised in finance costs during the current period relating to the outstanding liability. The liability has been fully paid as at 30 June 2019 (30 June 2018: R5,7 billion liability, 31 December 2018: R4,2 billion liability) following the payment of N110 billion in two instalments on 28 March 2019 (N55 billion/R2,2 billion2) and 24 May 2019 (N55 billion/R2,2 billion3) and the unwinding of the interest.1 Amount translated at the 10 June 2016 rate R1 = N13,15.2 Amount translated at the 28 March 2019 rate R1 = N24,81.3 Amount translated at the 24 May 2019 rate R1 = N24,74.
9. Impairment of joint venture and goodwillImpairment of joint ventureThe group tested its investment in its equity accounted e-commerce joint venture, Middle East Internet Holding S.A.R.L (MEIH), for impairment following increasing competitive pressure and its disposal of Wadi, an online shopping portal, during the period. The recoverable amount was determined as the fair value less cost of disposal. The fair value represents a value determined from unobservable inputs, classified as level 3 inputs in terms of IFRS 13 Fair Value Measurement, and was based on comparable company and transaction average net merchandise value multiples of 1,6 for its transportation and consumer services business and 1,8 for its on-demand cleaning marketplace. The carrying value of the net assets equity accounted exceeded the recoverable amount of R745 million by R191 million and the group recognised the resulting impairment in profit or loss.
Impairment of goodwillThe group recognised an impairment of R312 million relating to MTN Yemen in 2018. No goodwill impairment was recognised for the six months ended June 2019.
Notes to the condensed consolidated interim financial statements continuedfor the six months ended 30 June 2019
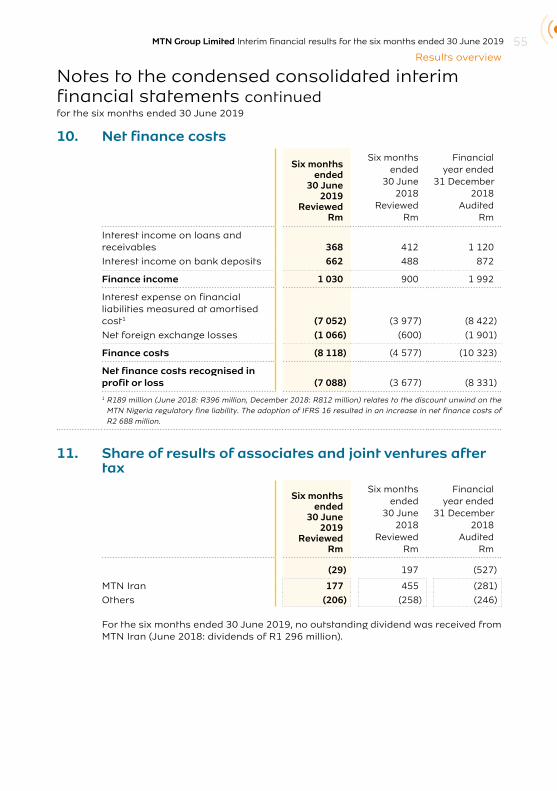
MTN Group Limited Interim financial results for the six months ended 30 June 2019 55Results overview
10. Net finance costs
Six months ended
30 June2019
ReviewedRm
Six months ended
30 June2018
ReviewedRm
Financialyear ended
31 December2018
AuditedRm
Interest income on loans and receivables 368 412 1 120
Interest income on bank deposits 662 488 872
Finance income 1 030 900 1 992
Interest expense on financial liabilities measured at amortised cost1 (7 052) (3 977) (8 422)
Net foreign exchange losses (1 066) (600) (1 901)
Finance costs (8 118) (4 577) (10 323)
Net finance costs recognised in profit or loss (7 088) (3 677) (8 331)1 R189 million (June 2018: R396 million, December 2018: R812 million) relates to the discount unwind on the
MTN Nigeria regulatory fine liability. The adoption of IFRS 16 resulted in an increase in net finance costs of R2 688 million.
11. Share of results of associates and joint ventures after tax
Six months ended
30 June2019
ReviewedRm
Six months ended
30 June2018
ReviewedRm
Financialyear ended
31 December2018
AuditedRm
(29) 197 (527)
MTN Iran 177 455 (281)
Others (206) (258) (246)
For the six months ended 30 June 2019, no outstanding dividend was received from MTN Iran (June 2018: dividends of R1 296 million).
Notes to the condensed consolidated interim financial statements continuedfor the six months ended 30 June 2019
MTN Group Limited Interim financial results for the six months ended 30 June 201956
11. Share of results of associates and joint ventures after tax continued
Jumia change in shareholding and subsequent measurementAfrica Internet Holding GmbH (AIH) changed its name to Jumia Technologies AG (Jumia) in January 2019.
At 31 December 2018, the group equity accounted its 29,69% interest in Jumia.
On 12 April 2019, Jumia listed on the New York Stock Exchange and MTN’s interest was diluted from 29,69% to 18,90% following the issue of shares by Jumia as part of the initial public offering (IPO). The shareholder agreement that gave the group the right to appoint a director and joint control over Jumia terminated on listing. The group applied judgement in concluding that it did not have significant influence over Jumia subsequent to the listing and consequently discontinued equity accounting on the date of listing and recognised the retained interest at its fair value.
The resulting difference between fair value and the carrying value, net of the foreign currency translation reserve transferred to the income statement, resulted in a gain of R1 039 million recognised in other income on the listing date.
The group made an irrevocable election to designate the investment in Jumia as held at fair value through other comprehensive income in terms of IFRS 9 Financial Instruments subsequent to the listing date. The group has recognised an amount of R2 538 million, representing the fair value movements since the date of listing up to 30 June 2019 directly in other comprehensive income. The fair value of Jumia at 30 June 2019 of R5 536 million is based on its listed share price on the New York Stock Exchange.
Disposal of TravelLab Global AB (Travelstart)The group sold its interest in Travelstart in June 2019. Refer to note 21 for details of the disposal.
Iran exchange rates and sanctionsIn August 2018, the Central Bank of Iran (CBI) clarified that all future dividends can be expected to be repatriated at the SANA rate (note 18). After the introduction of the SANA rate, the group equity accounts the results and translates any receivable from Iran at the SANA rate. However, the group continues to translate any receivables that have been approved by the Iranian government under the Foreign Investment Promotion and Protection Act (FIPPA) at the CBI rate based on confirmation from FIPPA that the CBI rate will continue to apply to the FIPPA-approved funds.
On 8 May 2018, the US announced its decision to withdraw from the Joint Comprehensive Plan of Action (JCPOA) agreement and to reimpose economic sanctions against Iran. The first round of these sanctions became effective on 7 August 2018 and a second phase of sanctions became effective on 5 November 2018. The sanctions may limit the ability of the group to repatriate cash from Iran, including future dividends.
As at 30 June 2019, Iranian rial-denominated receivables1 amounted to R1 295 million (December 2018: R1 031 million) and the Iranian rial-denominated loan2 amounted to R1 666 million (December: R1 730 million). Sanctions may place pressure on the Iranian rial exchange rate that is used to translate these receivables as well as the equity-accounted results of MTN Iran.1 Translated at SANA rate.2 Translated at CBI rate.
Notes to the condensed consolidated interim financial statements continuedfor the six months ended 30 June 2019
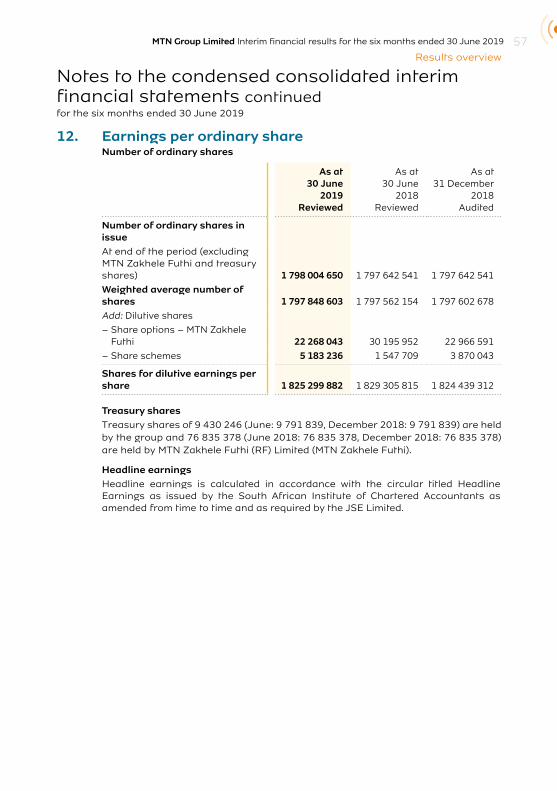
MTN Group Limited Interim financial results for the six months ended 30 June 2019 57Results overview
12. Earnings per ordinary shareNumber of ordinary shares
As at30 June
2019Reviewed
As at30 June
2018Reviewed
As at31 December
2018Audited
Number of ordinary shares in issueAt end of the period (excluding MTN Zakhele Futhi and treasury shares) 1 798 004 650 1 797 642 541 1 797 642 541
Weighted average number of shares 1 797 848 603 1 797 562 154 1 797 602 678
Add: Dilutive shares
– Share options – MTN Zakhele Futhi 22 268 043 30 195 952 22 966 591
– Share schemes 5 183 236 1 547 709 3 870 043
Shares for dilutive earnings per share 1 825 299 882 1 829 305 815 1 824 439 312
Treasury sharesTreasury shares of 9 430 246 (June: 9 791 839, December 2018: 9 791 839) are held by the group and 76 835 378 (June 2018: 76 835 378, December 2018: 76 835 378) are held by MTN Zakhele Futhi (RF) Limited (MTN Zakhele Futhi).
Headline earningsHeadline earnings is calculated in accordance with the circular titled Headline Earnings as issued by the South African Institute of Chartered Accountants as amended from time to time and as required by the JSE Limited.
Notes to the condensed consolidated interim financial statements continuedfor the six months ended 30 June 2019
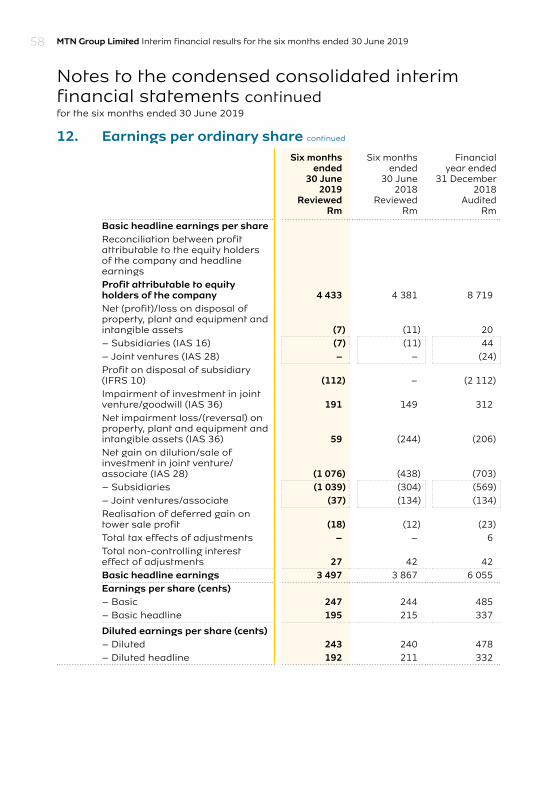
MTN Group Limited Interim financial results for the six months ended 30 June 201958
12. Earnings per ordinary share continued
Six monthsended
30 June2019
ReviewedRm
Six monthsended
30 June2018
ReviewedRm
Financialyear ended
31 December2018
AuditedRm
Basic headline earnings per shareReconciliation between profit attributable to the equity holders of the company and headline earningsProfit attributable to equity holders of the company 4 433 4 381 8 719Net (profit)/loss on disposal of property, plant and equipment and intangible assets (7) (11) 20– Subsidiaries (IAS 16) (7) (11) 44– Joint ventures (IAS 28) – – (24)Profit on disposal of subsidiary (IFRS 10) (112) – (2 112)Impairment of investment in joint venture/goodwill (IAS 36) 191 149 312Net impairment loss/(reversal) on property, plant and equipment and intangible assets (IAS 36) 59 (244) (206)Net gain on dilution/sale of investment in joint venture/associate (IAS 28) (1 076) (438) (703)– Subsidiaries (1 039) (304) (569)– Joint ventures/associate (37) (134) (134) Realisation of deferred gain on tower sale profit (18) (12) (23)Total tax effects of adjustments – – 6Total non-controlling interest effect of adjustments 27 42 42Basic headline earnings 3 497 3 867 6 055Earnings per share (cents)– Basic 247 244 485– Basic headline 195 215 337
Diluted earnings per share (cents)– Diluted 243 240 478– Diluted headline 192 211 332
Notes to the condensed consolidated interim financial statements continuedfor the six months ended 30 June 2019

MTN Group Limited Interim financial results for the six months ended 30 June 2019 59Results overview
13. Financial instrumentsFinancial instruments at amortised costThe group has not disclosed the fair values of financial instruments measured at amortised cost except for the borrowings set out below, as their carrying amounts closely approximate their fair values.
Listed long-term borrowingsThe group has listed long-term fixed interest rate senior unsecured notes in issue which were issued in prior years, with a carrying amount of R24 907 million at 30 June 2019 (30 June 2018: R24 186 million, 31 December 2018: R25 830 million) and a fair value of R25 592 million (30 June 2018: R23 255 million, 31 December 2018: R23 926 million). The fair values of these instruments are determined by reference to quoted prices on the Irish bond market. The market for these bonds is not considered to be liquid and consequently the fair value measurement is categorised within level 2 of the fair value hierarchy.
Financial instruments measured at fair valueThe fair values of financial instruments measured at fair value are determined as follows:
Treasury billsThe fair value of these investments is determined by reference to published price quotations in an active market. The group has classified treasury bills with a carrying amount of R167 million (30 June 2018: R370 million, 31 December 2018: R343 million) as at fair value through other comprehensive income and the group has classified treasury bills with a carrying amount of R393 million (30 June 2018: R717 million, 31 December 2018: R307 million) as at fair value through profit or loss. The fair value of these investments is categorised within level 1 of the fair value hierarchy.
Fair value measurement of investment in JumiaThe fair value of the investment is determined by reference to published price quotations on the New York Stock Exchange. The American Depository Share (ADS) price of Jumia was US$26,42 on the last trading day of the period. The group has classified the investment in Jumia with a carrying amount of R5 536 million as at fair value through other comprehensive income. The fair value of this investment is categorised within level 1 of the fair value hierarchy. On 6 August 2019, the Jumia ADS price was US$13,81, equating to a reduction in the fair value of R2 462 million subsequent to 30 June 2019.
Fair value measurement of investment in IHSIncluded in investments in the condensed consolidated statement of financial position is an equity investment in IHS Group at fair value of R23 088 million (June 2018: R24 544 million, December 2018: R23 353 million). At 30 June 2019, the absence of transactions between market participants resulted in the fair value being determined using models considered to be appropriate by management. The fair value was calculated using an earnings multiple technique and was based on unobservable market inputs including tower industry earnings multiples of between 10x to 14x (June 2018: 11x to 16x, December 2018: 10x to 15x) applied to MTN management’s estimates of earnings, less estimated net debt of R18 131 million (June 2018: R18 940 million, December 2018: R18 599 million). In addition, in June 2019, June 2018 and December 2018 the group has applied a 10% liquidity discount.
Notes to the condensed consolidated interim financial statements continuedfor the six months ended 30 June 2019
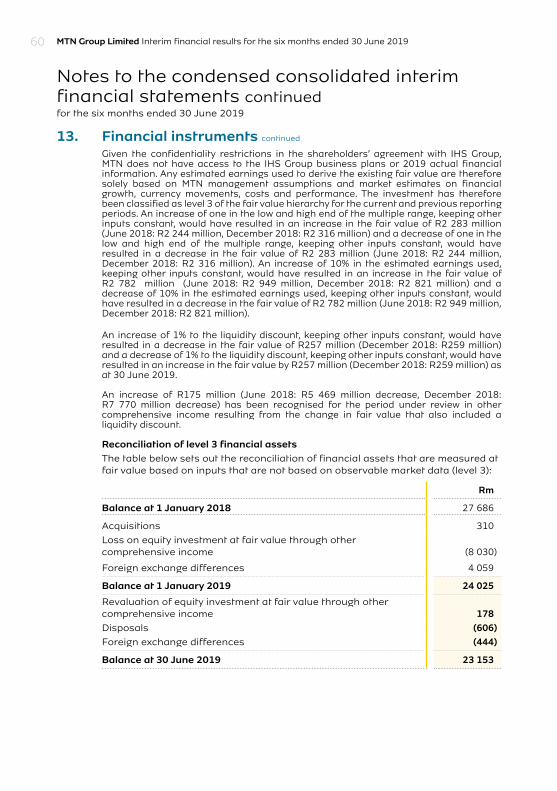
MTN Group Limited Interim financial results for the six months ended 30 June 201960
13. Financial instruments continued
Given the confidentiality restrictions in the shareholders’ agreement with IHS Group, MTN does not have access to the IHS Group business plans or 2019 actual financial information. Any estimated earnings used to derive the existing fair value are therefore solely based on MTN management assumptions and market estimates on financial growth, currency movements, costs and performance. The investment has therefore been classified as level 3 of the fair value hierarchy for the current and previous reporting periods. An increase of one in the low and high end of the multiple range, keeping other inputs constant, would have resulted in an increase in the fair value of R2 283 million (June 2018: R2 244 million, December 2018: R2 316 million) and a decrease of one in the low and high end of the multiple range, keeping other inputs constant, would have resulted in a decrease in the fair value of R2 283 million (June 2018: R2 244 million, December 2018: R2 316 million). An increase of 10% in the estimated earnings used, keeping other inputs constant, would have resulted in an increase in the fair value of R2 782 million (June 2018: R2 949 million, December 2018: R2 821 million) and a decrease of 10% in the estimated earnings used, keeping other inputs constant, would have resulted in a decrease in the fair value of R2 782 million (June 2018: R2 949 million, December 2018: R2 821 million).
An increase of 1% to the liquidity discount, keeping other inputs constant, would have resulted in a decrease in the fair value of R257 million (December 2018: R259 million) and a decrease of 1% to the liquidity discount, keeping other inputs constant, would have resulted in an increase in the fair value by R257 million (December 2018: R259 million) as at 30 June 2019.
An increase of R175 million (June 2018: R5 469 million decrease, December 2018: R7 770 million decrease) has been recognised for the period under review in other comprehensive income resulting from the change in fair value that also included a liquidity discount.
Reconciliation of level 3 financial assetsThe table below sets out the reconciliation of financial assets that are measured at fair value based on inputs that are not based on observable market data (level 3):
Rm
Balance at 1 January 2018 27 686
Acquisitions 310
Loss on equity investment at fair value through other comprehensive income (8 030)
Foreign exchange differences 4 059
Balance at 1 January 2019 24 025
Revaluation of equity investment at fair value through other comprehensive income 178Disposals (606)Foreign exchange differences (444)
Balance at 30 June 2019 23 153
Notes to the condensed consolidated interim financial statements continuedfor the six months ended 30 June 2019
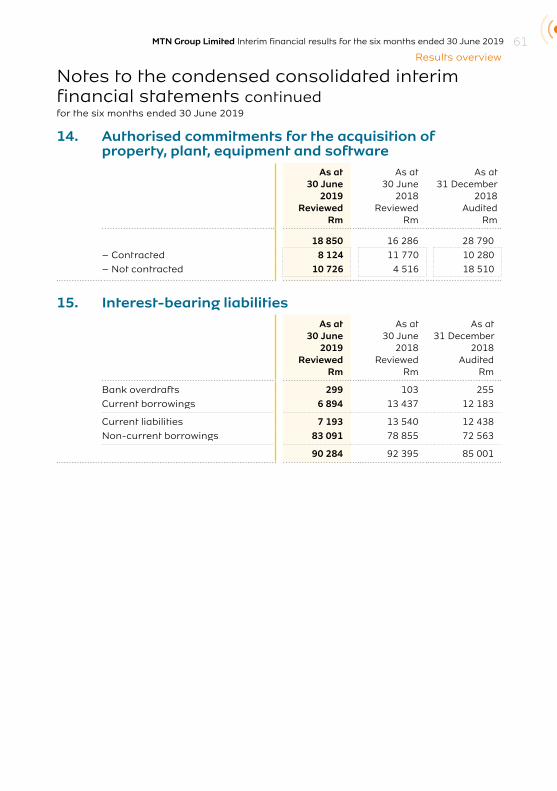
MTN Group Limited Interim financial results for the six months ended 30 June 2019 61Results overview
14. Authorised commitments for the acquisition of property, plant, equipment and software
As at30 June
2019Reviewed
Rm
As at30 June
2018Reviewed
Rm
As at31 December
2018Audited
Rm
18 850 16 286 28 790
– Contracted 8 124 11 770 10 280
– Not contracted 10 726 4 516 18 510
15. Interest-bearing liabilitiesAs at
30 June2019
ReviewedRm
As at30 June
2018Reviewed
Rm
As at31 December
2018Audited
Rm
Bank overdrafts 299 103 255
Current borrowings 6 894 13 437 12 183
Current liabilities 7 193 13 540 12 438
Non-current borrowings 83 091 78 855 72 563
90 284 92 395 85 001
Notes to the condensed consolidated interim financial statements continuedfor the six months ended 30 June 2019
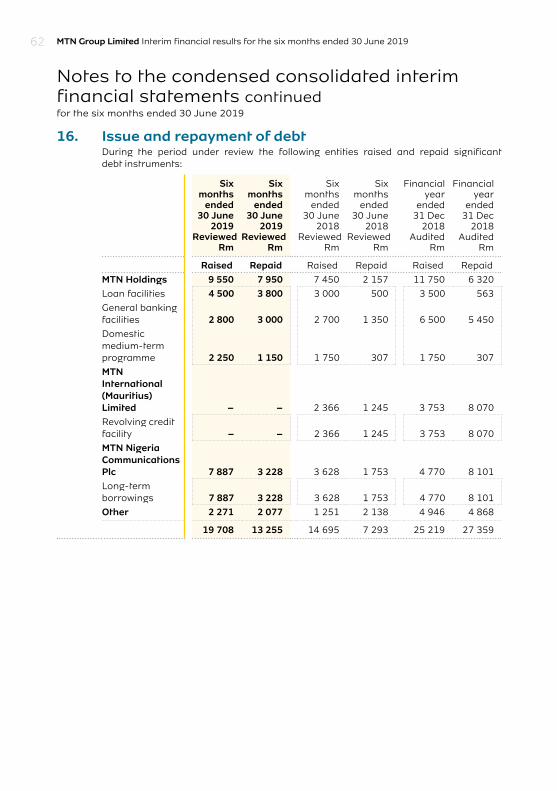
MTN Group Limited Interim financial results for the six months ended 30 June 201962
16. Issue and repayment of debtDuring the period under review the following entities raised and repaid significant debt instruments:
Sixmonths
ended30 June
2019Reviewed
Rm
Sixmonths
ended30 June
2019Reviewed
Rm
Sixmonths
ended30 June
2018Reviewed
Rm
Sixmonths
ended30 June
2018Reviewed
Rm
Financialyear
ended31 Dec
2018Audited
Rm
Financialyear
ended31 Dec
2018Audited
Rm
Raised Repaid Raised Repaid Raised Repaid
MTN Holdings 9 550 7 950 7 450 2 157 11 750 6 320
Loan facilities 4 500 3 800 3 000 500 3 500 563
General banking facilities 2 800 3 000 2 700 1 350 6 500 5 450
Domestic medium-term programme 2 250 1 150 1 750 307 1 750 307
MTN International (Mauritius) Limited – – 2 366 1 245 3 753 8 070
Revolving credit facility – – 2 366 1 245 3 753 8 070
MTN Nigeria Communi cations Plc 7 887 3 228 3 628 1 753 4 770 8 101
Long-term borrowings 7 887 3 228 3 628 1 753 4 770 8 101
Other 2 271 2 077 1 251 2 138 4 946 4 868
19 708 13 255 14 695 7 293 25 219 27 359
Notes to the condensed consolidated interim financial statements continuedfor the six months ended 30 June 2019
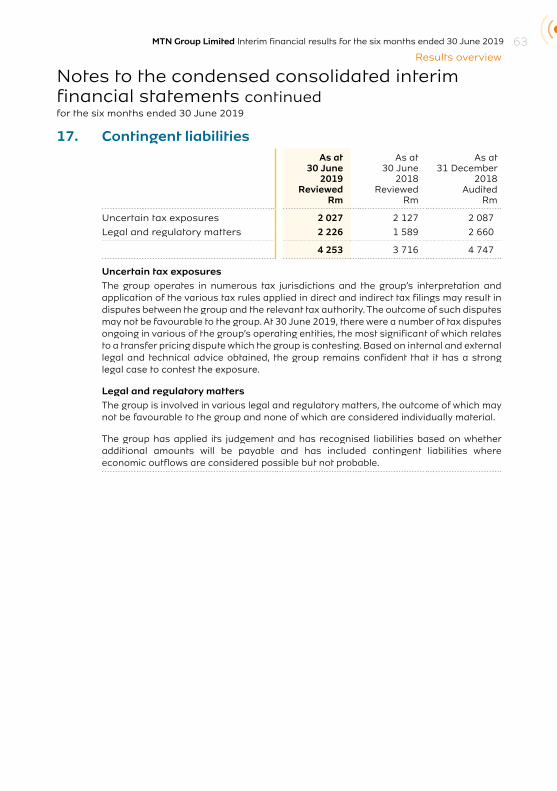
MTN Group Limited Interim financial results for the six months ended 30 June 2019 63Results overview
17. Contingent liabilities As at
30 June2019
ReviewedRm
As at30 June
2018Reviewed
Rm
As at31 December
2018Audited
Rm
Uncertain tax exposures 2 027 2 127 2 087
Legal and regulatory matters 2 226 1 589 2 660
4 253 3 716 4 747
Uncertain tax exposuresThe group operates in numerous tax jurisdictions and the group’s interpretation and application of the various tax rules applied in direct and indirect tax filings may result in disputes between the group and the relevant tax authority. The outcome of such disputes may not be favourable to the group. At 30 June 2019, there were a number of tax disputes ongoing in various of the group’s operating entities, the most significant of which relates to a transfer pricing dispute which the group is contesting. Based on internal and external legal and technical advice obtained, the group remains confident that it has a strong legal case to contest the exposure.
Legal and regulatory mattersThe group is involved in various legal and regulatory matters, the outcome of which may not be favourable to the group and none of which are considered individually material.
The group has applied its judgement and has recognised liabilities based on whether additional amounts will be payable and has included contingent liabilities where economic outflows are considered possible but not probable.
Notes to the condensed consolidated interim financial statements continuedfor the six months ended 30 June 2019
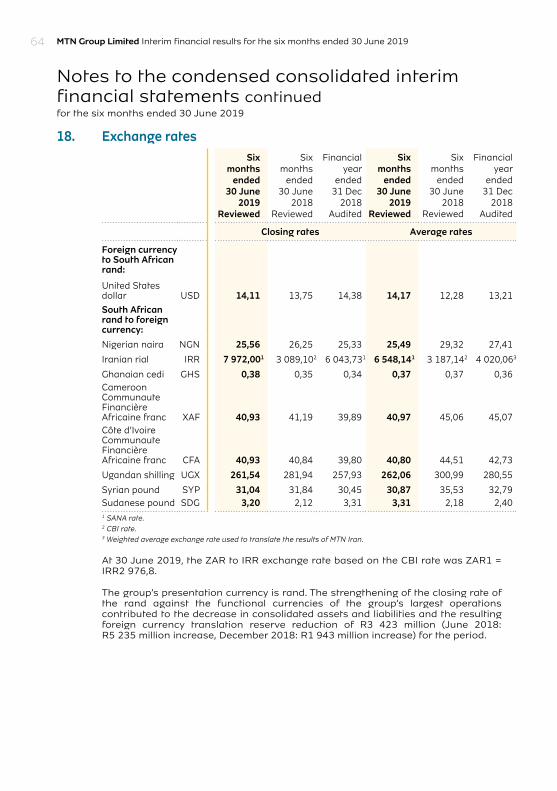
MTN Group Limited Interim financial results for the six months ended 30 June 201964
18. Exchange ratesSix
months ended
30 June 2019
Reviewed
Six months ended
30 June 2018
Reviewed
Financial year
ended31 Dec
2018Audited
Six months ended
30 June 2019
Reviewed
Six months ended
30 June 2018
Reviewed
Financial year
ended31 Dec
2018Audited
Closing rates Average rates
Foreign currency to South African rand:
United States dollar USD 14,11 13,75 14,38 14,17 12,28 13,21
South African rand to foreign currency:
Nigerian naira NGN 25,56 26,25 25,33 25,49 29,32 27,41
Iranian rial IRR 7 972,001 3 089,102 6 043,731 6 548,141 3 187,142 4 020,063
Ghanaian cedi GHS 0,38 0,35 0,34 0,37 0,37 0,36Cameroon Communaute Financière Africaine franc XAF 40,93 41,19 39,89 40,97 45,06 45,07Côte d’Ivoire Communaute Financière Africaine franc CFA 40,93 40,84 39,80 40,80 44,51 42,73
Ugandan shilling UGX 261,54 281,94 257,93 262,06 300,99 280,55
Syrian pound SYP 31,04 31,84 30,45 30,87 35,53 32,79Sudanese pound SDG 3,20 2,12 3,31 3,31 2,18 2,401 SANA rate.2 CBI rate.3 Weighted average exchange rate used to translate the results of MTN Iran.
At 30 June 2019, the ZAR to IRR exchange rate based on the CBI rate was ZAR1 = IRR2 976,8.
The group’s presentation currency is rand. The strengthening of the closing rate of the rand against the functional currencies of the group’s largest operations contributed to the decrease in consolidated assets and liabilities and the resulting foreign currency translation reserve reduction of R3 423 million (June 2018: R5 235 million increase, December 2018: R1 943 million increase) for the period.
Notes to the condensed consolidated interim financial statements continuedfor the six months ended 30 June 2019
MTN Group Limited Interim financial results for the six months ended 30 June 2019 65Results overview
18. Exchange rates continued
Net investment hedgesThe group hedges a designated portion of its dollar net assets in MTN (Dubai) Limited (MTN Dubai) for forex exposure arising between the USD and ZAR as part of the group’s risk management objectives. The group designated external borrowings (Eurobonds) denominated in USD held by MTN (Mauritius) Investments Limited with a value of R25 billion (June 2018: R23,3 billion, December 2018: R23,9 billion) and external borrowings denominated in USD held by MTN Nigeria with a value of R559 million (June 2018: R2,1 billion, December 2018: R1,3 billion) as hedging instruments. For the period of the hedge relationship, foreign exchange movements on these hedging instruments are recognised in other comprehensive income as part of the foreign currency translation reserve (FCTR), offsetting the exchange differences recognised in other comprehensive income, arising on translation of the designated dollar net assets of MTN Dubai to ZAR. The cumulative forex movement recognised in other comprehensive income will only be reclassified to profit or loss upon loss of control over MTN Dubai. There was no hedge ineffectiveness recognised in profit or loss during the current or prior period.
19. Related party transactionsTransactions between members of the groupScancom PLC (MTN Ghana) entered into lease agreements with Ghana Tower InterCo B.V in prior years. The lease liability recognised under IFRS 16 amounts to R3 179 million at 30 June 2019. The lease payments for the six-month period ended 30 June 2019 amounted to R402 million and the interest charge recognised under IFRS 16 for the period is R260 million. The operating lease commitments recognised under IAS 17 in the prior year amounted to R11 042 million at June 2018 and R9 468 million at December 2018. The IAS 17 expense recorded in the prior year amounted to R350 million for the six months ended in June 2018 and R1 016 million for the year ended December 2018. The rental amounts escalate every year by inflation and the initial term is 10 years, followed by four times five-year renewal periods.
MTN Uganda Limited entered into lease agreements with Uganda Tower InterCo B.V in prior years. The lease liability recognised under IFRS 16 amounts to R1 865 million at 30 June 2019. The lease payments for the six-month period ended 30 June 2019 amounted to R318 million and the interest charge recognised under IFRS 16 for the period is R145 million. The operating lease commitments recognised under IAS 17 in the prior year amounted to R1 581 million at 30 June 2018 and R1 988 million at 31 December 2018. The IAS 17 expense recorded in the prior year amounted to R207 million for the six months ended in June 2018 and R439 million for the year ended December 2018. The rental amounts escalate every year by inflation and the initial term is 10 years, followed by four times five-year renewal periods.
Notes to the condensed consolidated interim financial statements continuedfor the six months ended 30 June 2019
MTN Group Limited Interim financial results for the six months ended 30 June 201966
20. Non-current assets held for saleIn December 2018, the group received an unsolicited offer to sell its interest in Mascom Wireless Botswana Proprietary Limited (Mascom) and its holding companies for US$300 million. Accordingly, the investment in joint venture and related assets in holding companies have been presented as non-current assets held for sale. Any transactions will be subject to the execution of definitive transaction agreements and applicable governance and regulatory approvals. During 2019, Mascom declared a dividend of R115 million. In addition an amount of R566 million held by the holding companies as at 31 December 2018 was distributed to the shareholders in 2019. The sale is expected to be concluded in the second half of 2019.
As at 30 June 2019, the following assets and liabilities were included in the disposal group:
30 June 2019
ReviewedRm
Investment in joint venture 1 717Intangible and other non-current assets 312
Cash and cash equivalents1 164
2 1931 Cash and cash equivalents will be distributed to the group, prior to the conclusion of the sale.
21. Disposal of Amadeus and TravelstartDuring the current period the group sold its investment subsidiaries Amadeus IV Digital Prosperity LP and Amadeus TI LP (Amadeus). The companies held various unlisted equity investments and a 43,74% interest in the joint venture Travelstart. The disposal of the investments was concluded on 26 June 2019.
The group equity accounted the investment in Travelstart until the date of concluding the sale agreement on 23 May 2019. The investments were subsequently accounted for as non-current assets held for sale until the disposal date. The group held the other equity investments in Amadeus at fair value through other comprehensive income. There was no movement in the fair value of the other equity investments in the current year. The total cumulative fair value gains at derecognition date of R268 million have been reclassified to retained earnings at the date of disposal.
Notes to the condensed consolidated interim financial statements continuedfor the six months ended 30 June 2019
MTN Group Limited Interim financial results for the six months ended 30 June 2019 67Results overview
Notes to the condensed consolidated interim financial statements continuedfor the six months ended 30 June 2019
21. Disposal of Amadeus and Travelstart continued
The carrying amounts of assets and liabilities that have been reclassified to non-current assets held for sale and subsequently sold at 26 June 2019 were:
30 June2019
ReviewedRm
Investment in joint venture 452Investments 592Other current assets 4Cash and cash equivalents 54
Total assets 1 102
Current liabilities 8
Total liabilities 8
Carrying amount of net assets sold 1 094Total disposal consideration – cash 1 237Transaction costs (31)
Gain on disposal 112
Net cashCash received 1 237Less: Cash and cash equivalents in Amadeus (54)Less: Transaction costs paid (31)
Net cash received on sale 1 152
22. Redemption of Nigeria preference sharesOn 24 April 2019 the MTN Nigeria board approved the redemption of all the US dollar denominated preference shares previously issued by MTN Nigeria. The redemption of the preference shares is subject to the necessary regulatory processes. The group has recognised a liability of R1.2 billion representing the rand equivalent of the minority interest share of the preference shares of US$85.5 million in trade and other payables previously recognised in equity. The proceeds expected from the redemption amounts to US$314 million for the group’s 78,59% interest in MTN Nigeria’s preference shares.
23. Events after reporting periodDividends declared
Dividends declared at the board meeting held on 7 August 2019 amounted to 195 cents per share.
MTN Group Limited Interim financial results for the six months ended 30 June 201968
Administration
Registration number: 1994/009584/06ISIN: ZAE000042164Share code: MTN
Board of directorsPF Nhleko#
RA Shuter¹RT Mupita¹PB Hanratty²*AP Harper³*KP Kalyan*S Kheradpir⁴MH Jonas* (appointed 1 June 2018)NP Mageza*MLD Marole*AT Mikati5*SP Miller6*NL Sowazi*KC Ramon*BS Tshabalala* (appointed 1 June 2018)KDK Mokhele* (appointed 1 July 2018)J van Rooyen *SLA Sanusi7* (appointed 1 July 2019)VM Rague8* (appointed 1 July 2019)
¹ Executive ² Irish³ British ⁴ American5 Lebanese6 Belgian7 Nigerian8 Kenyan # Non-executive* Independent non-executive
Group secretaryPT Bonoyi Private Bag X9955, Cresta, 2118
Registered office216 – 14th Avenue, Fairland, 2195
American depository receipt (ADR) programmeCusip No. 62474M108 ADR to ordinary Share 1:1
DepositoryThe Bank of New York101 Barclay Street, New York NY, 10286, USA
MTN Group sharecare lineToll free: 0800 202 360 or +27 11 870 8206If phoning from outside South Africa
Transfer secretariesComputershare Investor Services Proprietary LimitedRegistration number 2004/003647/07Rosebank Towers, 15 Biermann Avenue, Rosebank, 2196PO Box 61051, Marshalltown, 2107
Joint auditorsPricewaterhouseCoopers Inc.4 Lisbon Lane, Waterfall City, Jukskei View, 2090
SizweNtsalubaGobodo Grant Thornton Inc.20 Morris Street EastWoodmead, 2191
Lead sponsor JP Morgan Equities (SA) Proprietary Limited1 Fricker Road, cnr Hurlingham Road, Illovo2196
Joint sponsorTamela Holdings Proprietary LimitedGround Floor, Golden Oak House, BallyoaksOffice Park35 Ballyclare Drive, Bryanston, 2021
AttorneysWebber Wentzel90 Rivonia Road, Sandton, 2196PO Box 61771, Marshalltown, 2107
Contact detailsTelephone: National 083 912 3000 and 083 869 3000 International +27 83 912 3000Facsimile: National 011 912 4093 International +27 11 912 4093
Email: [email protected]: http://www.mtn.com

www.mtn.com
Tel: +27 11 912 3000 Innovation Centre 216 14th Avenue Fairland, 2195South Africa