Embed Size (px)
Citation preview

MTH16_Lec-07a_sec_7-4.pptx1
Bruce Mayer, PE Mathematics-16: Applied Calculus II
Bruce Mayer, PELicensed Electrical & Mechanical Engineer
Mathematics 16
LinearRegressionTutori
al

MTH16_Lec-07a_sec_7-4.pptx2
Bruce Mayer, PE Mathematics-16: Applied Calculus II
A plotting Grid
Lets Make some SCATTER

MTH16_Lec-07a_sec_7-4.pptx3
Bruce Mayer, PE Mathematics-16: Applied Calculus II

MTH16_Lec-07a_sec_7-4.pptx4
Bruce Mayer, PE Mathematics-16: Applied Calculus II

MTH16_Lec-07a_sec_7-4.pptx5
Bruce Mayer, PE Mathematics-16: Applied Calculus II

MTH16_Lec-07a_sec_7-4.pptx6
Bruce Mayer, PE Mathematics-16: Applied Calculus II
x y
0 2
5 6
10 11
Example

MTH16_Lec-07a_sec_7-4.pptx7
Bruce Mayer, PE Mathematics-16: Applied Calculus II
Do On WhiteBoard
x y
0 2
5 6
10 11
Example

MTH16_Lec-07a_sec_7-4.pptx8
Bruce Mayer, PE Mathematics-16: Applied Calculus II
MTH16_Lec-07a_sec_7-4.pptx9
Bruce Mayer, PE Mathematics-16: Applied Calculus II

MTH16_Lec-07a_sec_7-4.pptx10
Bruce Mayer, PE Mathematics-16: Applied Calculus II
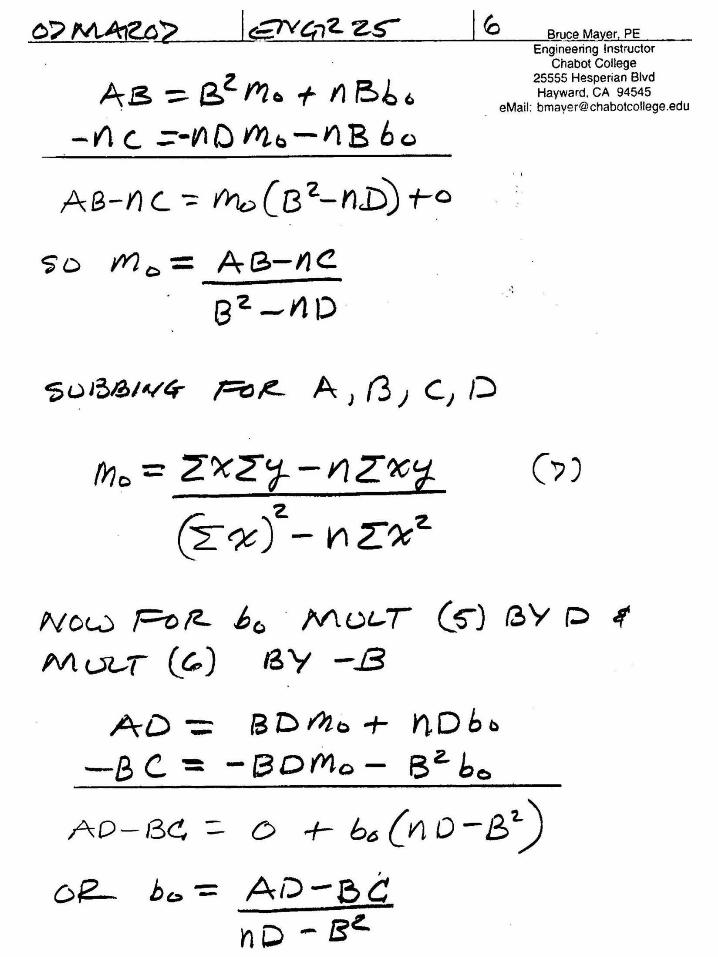
[eqn (7)]
MTH16_Lec-07a_sec_7-4.pptx11
Bruce Mayer, PE Mathematics-16: Applied Calculus II
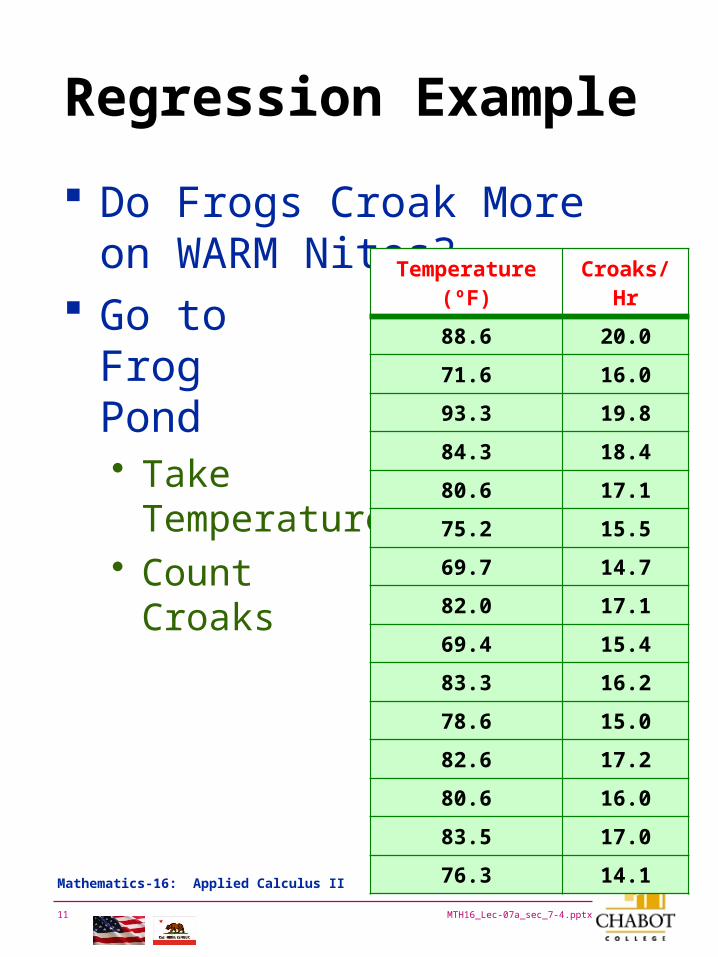
Regression Example
Do Frogs Croak More on WARM Nites?
Go to Frog Pond• Take
Temperature• Count
Croaks
Temperature (ºF) Croaks/Hr
88.6 20.0
71.6 16.0
93.3 19.8
84.3 18.4
80.6 17.1
75.2 15.5
69.7 14.7
82.0 17.1
69.4 15.4
83.3 16.2
78.6 15.0
82.6 17.2
80.6 16.0
83.5 17.0
76.3 14.1

MTH16_Lec-07a_sec_7-4.pptx12
Bruce Mayer, PE Mathematics-16: Applied Calculus II
The MATLAB code% B. Mayer 20Feb07 * MTH16% Linear Regression Tutorial% E25_Lin_Regress_Tutorial_0703.m% %clear%% Define Data Vectors for Croaking FrogsTf = [69.4, 69.7, 71.6, 75.2, 76.3, 78.6, 80.6, 80.6, 82, 82.6, 83.3, 83.5, 84.3, 88.6, 93.3];% T in °FCpH = [15.4, 14.7, 16, 15.5, 14.1, 15, 17.1, 16, 17.1, 17.2, 16.2, 17, 18.4, 20, 19.8];% CPH is "Croaks per Hour"%% Plot CpH(T)plot(Tf, CpH,'*'), xlabel('T °F'), ylabel('CpH (Croaks/Hr)'),... Title('Frog Croaking vs Temperature'), grid%disp('Diplaying Scatter Plot - Hit any key to continue ')pause%% Calc Linear Regression Coefficient terms using Absolute TempssumX = sum(Tf)sumY = sum(CpH)n = length(Tf)sumXY = sum(Tf.*CpH)sumXX = sum(Tf.*Tf)%% Calc optimum slope term m0disp('Slope Parameter, m0')m0 = (sumX*sumY - n*sumXY)/(sumX^2 - n*sumXX)%% Calc optimum intercept term b0disp('Intercept Parameter, b0')b0 = (sumY - m0*sumX)/n%

MTH16_Lec-07a_sec_7-4.pptx13
Bruce Mayer, PE Mathematics-16: Applied Calculus II
The MATLAB code% Plot Regression LineTfmax = max(Tf);Tfmin = min(Tf);Tfplot = linspace(Tfmax, Tfmin);% Calc CpH projected response using Regression ConstanstantsCpHplot = m0*Tfplot + b0;plot(Tf, CpH,'*', Tfplot, CpHplot), xlabel('T °F'), ylabel('CpH (Croaks/Hr)'),... Title('Frog Croaking vs Temperature'), grid%disp('Diplaying °F Regression Plot - Hit any key to continue ')pause%% Calc Goodness of Fit%% the Minimized J value, J0J0 = sum((m0*Tf+b0-CpH).^2)%% Calc Sum of Sqs about the MeanCpH_avg = mean(CpH)S = sum((CpH-CpH_avg).^2)%% Calc r-sqdr_sqd = 1-J0/S;%%disp('Coeff of Determination, r-sqd = ')disp(r_sqd)

MTH16_Lec-07a_sec_7-4.pptx14
Bruce Mayer, PE Mathematics-16: Applied Calculus II
The Regression Plot
65 70 75 80 85 90 9514
15
16
17
18
19
20
T °F
CpH
(Cro
aks/
Hr)
Frog Croaking vs Temperature
MTH16_Lec-07a_sec_7-4.pptx15
Bruce Mayer, PE Mathematics-16: Applied Calculus II
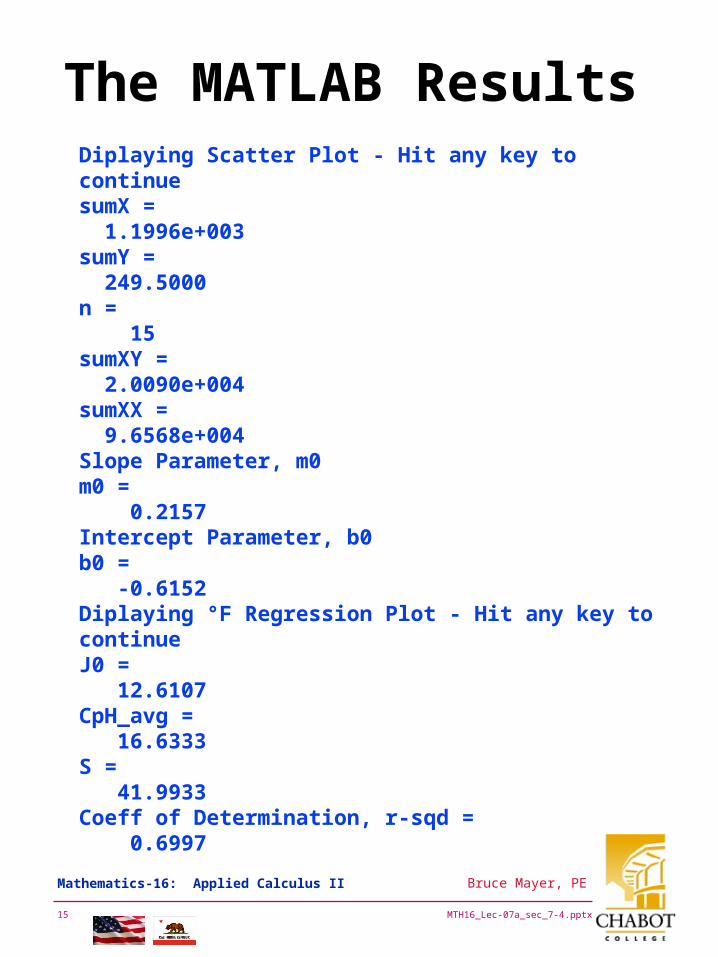
The MATLAB ResultsDiplaying Scatter Plot - Hit any key to continue sumX = 1.1996e+003sumY = 249.5000n = 15sumXY = 2.0090e+004sumXX = 9.6568e+004Slope Parameter, m0m0 = 0.2157Intercept Parameter, b0b0 = -0.6152Diplaying °F Regression Plot - Hit any key to continue J0 = 12.6107CpH_avg = 16.6333S = 41.9933Coeff of Determination, r-sqd = 0.6997

MTH16_Lec-07a_sec_7-4.pptx16
Bruce Mayer, PE Mathematics-16: Applied Calculus II
By Excel
Use to Check m0, b0, and r2
Frog Croaking
CpH = 0.2157•Tf - 0.6152
R2 = 0.6997
15
16
17
18
19
20
70 75 80 85 90 95
Temperature (°F)
Cro
ak F
req
ue
ncy
(C
roa
ks p
er H
ou
r)
E25_Lin_Regress_Tutorial_0703.xls