Embed Size (px)
Citation preview

MTC’s Local Street and Road
Sustainability Efforts
Theresa Romell
Sr. Planner/Analyst
Metropolitan Transportation Commission
August 29, 2012

San Francisco Metro Region
• Population = 7.3 Mil
• Nine Counties
• 109 Jurisdictions
• 42,500 Lane-Miles
• 1,500 Miles of Highway
• 23 Transit Agencies
• Seven Toll Bridges
• One MPO: MTC

MTC’s Regional Local Street &
Road Program
• 25 Years of Support for Local Streets & Roads
– StreetSaver® Pavement Management Software
– Training & Technical Support
– Pavement Management Grant Program
– Regional Analyses
– Funding & Policy Advocacy

What is Sustainability?
One Definition:
“Meet present needs without
compromising the ability of future
generations to meet their needs”
– United Nations, 1987
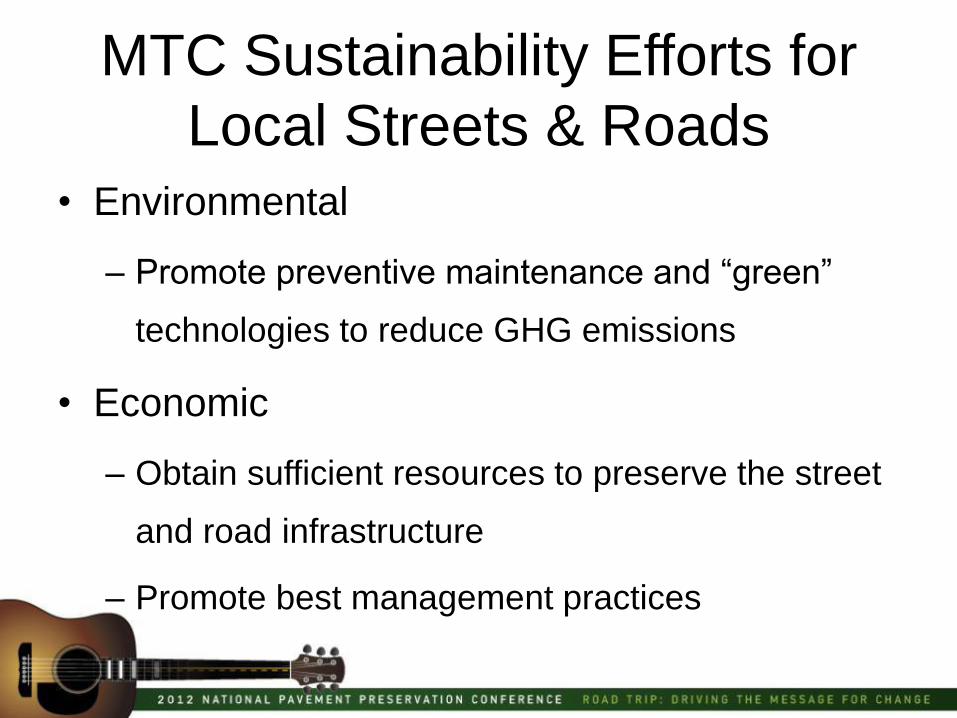
MTC Sustainability Efforts for
Local Streets & Roads
• Environmental
– Promote preventive maintenance and “green”
technologies to reduce GHG emissions
• Economic
– Obtain sufficient resources to preserve the street
and road infrastructure
– Promote best management practices

Environmental Sustainability
• Recent Emphasis on Environmental Sustainability
in Transportation
– California SB 375
– Sustainable Communities Strategies
– Climate Initiatives
• MTC’s RSRP Works to Demonstrate How Proper
Maintenance Aids Environmental Sustainability
– Pavement Preservation
– Technologies

Sustainable Maintenance
Practices
• Preservation Strategies Limit GHG Emissions
Associated with Rehab/Reconstruction
• Consistent Pavement Conditions Over Time
• Lower User Costs
• Preventive Maintenance has a 5:1 (minimum)
Benefit/Cost Ratio

Sustainable Maintenance
Practices Effect of Defferred Maintenance on Green House Gas
Emissions & Pavement Conditions
Reco
nstr
uct
20
100
80
70
60
45
0
50,000
100,000
150,000
200,000
250,000
0 5 10 15 20
Years
Lb
s.
CO
2 e
qu
ivale
nt
0
10
20
30
40
50
60
70
80
90
100
Pavem
en
t C
on
dit
ion
In
dex
GHG
PCI
Total Lifecycle GHG emissions/lane mile
= 212,100 lbs. of CO2e
Emissions Data Source: Jim Chehovits & Larry Galehouse; Energy
Usage and Greenhouse Gas Emissions of Pavement Preservat ion
Processes for Asphalt Concrete Pavement;, 2010

Sustainable Maintenance
Practices Effect of Preventive Maintenance on Green House Gas
Emissions & Pavement Conditions
Asp
halt
Overl
ay
Su
rface S
eal
Su
rface S
eal
Su
rface S
eal
100
80
100
80
100
80
100
75
0
2,000
4,000
6,000
8,000
10,000
12,000
14,000
16,000
18,000
0 5 10 15 20
Years
Lb
s.
CO
2 e
qu
ivale
nt
0
10
20
30
40
50
60
70
80
90
100
Pavem
en
t C
on
dit
ion
Ind
ex
GHG
PCI
Total Lifecycle GHG emissions /
lane mile = 30,100 lbs. of CO2e
Emissions Data Source: Jim Chehovits & Larry Galehouse;
Energy Usage and Greenhouse Gas Emissions of Pavement
Preservation Processes for Asphalt Concrete
Pavement;,2010

For a typical roadway, pavement
preservation strategies can save 182,000
lbs. of GHG emissions per lane mile, as
compared to reconstruction. This is
equivalent to taking 15 cars off the road for
one year.

Paving Can Be “Green”!

MTC’s Climate Initiative Program
•$2 Million Awarded to Cold in Place Recycling Demo
•Joint Napa/Sonoma County Project
•Estimated Cost Savings = 40%
•Estimated GHG Emissions Savings = 2,2 million lbs.
− Equivalent to 184 cars off the road for one year

Estimated GHG Savings / Lane Mile with CIR
GHG Emissions Savings:
GHG Savings
CO2e lbs. / ton
pavement
Tons pavement
/ Lane Mile
CO2e lbs. /
lane mile
pavement
CIR1 88
1,485
130,704
Passenger Car Equivalent2 10.8
1) Bilal, Julian; Chappat, Michael; Colas Group; Sustainable Development: The
Environmental Road of the Future; 2003
2) www.epa.gov/otaq/climate/420f05004.htm

On average, for every lane mile of
roadway that CIR is used instead of
traditional HMA, approximately 130,704
lbs of GHG emissions are saved, which
is equivalent to taking 11 cars off the
road for one year.

Mileage Suitable for CIR Based on PCI & Estimated GHG
Savings
Roadway
Condition
Range*
% of Total
BA LSR
Mileage
Lane
Mileage Depth Length Width
Tons
Asphalt
CO2e
Savings /
Ton**
Total CO2e
Savings
PCI: 60-69 12% 5042 0.167 5280 15 4,991,857 88 439,283,434
PCI: 50-59 10% 4202 0.250 5280 15 6,239,822 88 549,104,292
PCI: 25-49 8% 3362 0.333 5280 15 6,655,810 88 585,711,245
Total:
12,606 17,887,488 1,574,098,970
Annual Passenger Car
Reduction Equivalent: 129,819
*Source: MTC's 2009 Local Streets and Roads
Regional Condition Summary
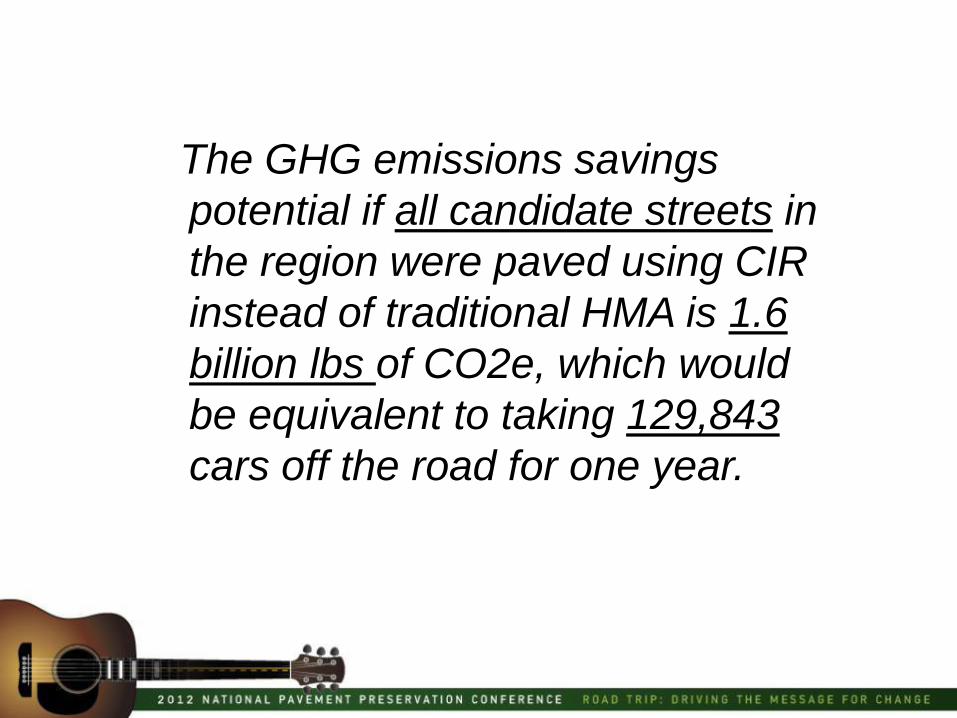
The GHG emissions savings
potential if all candidate streets in
the region were paved using CIR
instead of traditional HMA is 1.6
billion lbs of CO2e, which would
be equivalent to taking 129,843
cars off the road for one year.

The GHG emissions savings potential
over the next five years if available
funding was spent on treating
appropriate roadways with CIR instead
of HMA is 354 million lbs of CO2e, which
would be equivalent to taking 29,172
cars off the road for one year.

• MTC Actively Promotes Other “Green”
Paving Technologies:
– Full Depth Reclamation
– RAC
• Life Extension Value is Key
Sustainable Maintenance
Practices

Economic Sustainability Efforts
• Economic Analyses
• Maximize Resources
• Advocacy

Local Street and Road 28-Year
Maintenance Needs
• SF Bay Area’s Average PCI = 66
• Target = PCI of 75
• Corresponding Non-Pavement Target
• Total Needs = $44 B
• Available Revenue = $15 B
• Remaining Need = $30B

Economic Analyses
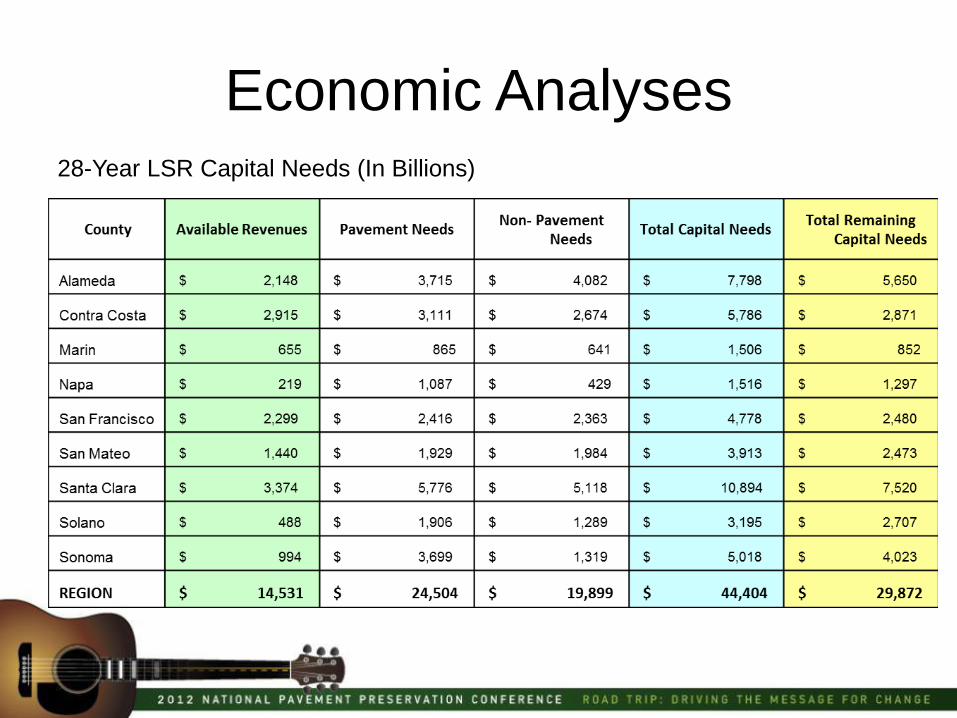
Economic Analyses 28-Year LSR Capital Needs (In Billions)


How Much Would We Need to Raise the Gas Tax?
Maintain Existing Conditions
Improve Conditions ($0.35)
$0.00
$0.18
$0.54
$0.76
$0.89
18.4 cents
35.3 cents
22 cents
13 cents
Existing Federal Excise
Existing State Excise

Economic Analyses

Impact of Analyses on Regional Funding Policy
Regional Investment in LSR Over Consecutive RTPs (Millions)
$143
$991
$7,500
$10,000
$0
$1,000
$2,000
$3,000
$4,000
$5,000
$6,000
$7,000
$8,000
$9,000
$10,000
2001 RTP $143
T2030 $991
T2035 $7,500
Plan Bay Area $10,000
LS&R Maintenance Shortfalls

Maximizing Resources
• LSR Funds Conditioned on Performance
– PMS Certification
– Projects Recommended by StreetSaver®
– Performance Based Allocation Formula
• Analysis of Financing Options
– To bond…or not to bond.

Financing Options
53
61
29
$-
$200
$400
$600
$800
$1,000
$1,200
$1,400
$1,600
$1,800
0
10
20
30
40
50
60
70
(Mill
ion
s)
Pav
em
en
t C
on
dit
ion
Ind
ex
Year
Pavement Condition & Deferred Maintenance w/without Sales Tax Measure

68
61
29
$-
$200
$400
$600
$800
$1,000
$1,200
$1,400
$1,600
$1,800
0
10
20
30
40
50
60
70
80
(Millio
ns)
Pav
em
en
t C
on
dit
ion
In
dex
Year
Pavement Condition & Deferred Maintenance Scenarios With/Without Sales Tax Measure
Financing Options
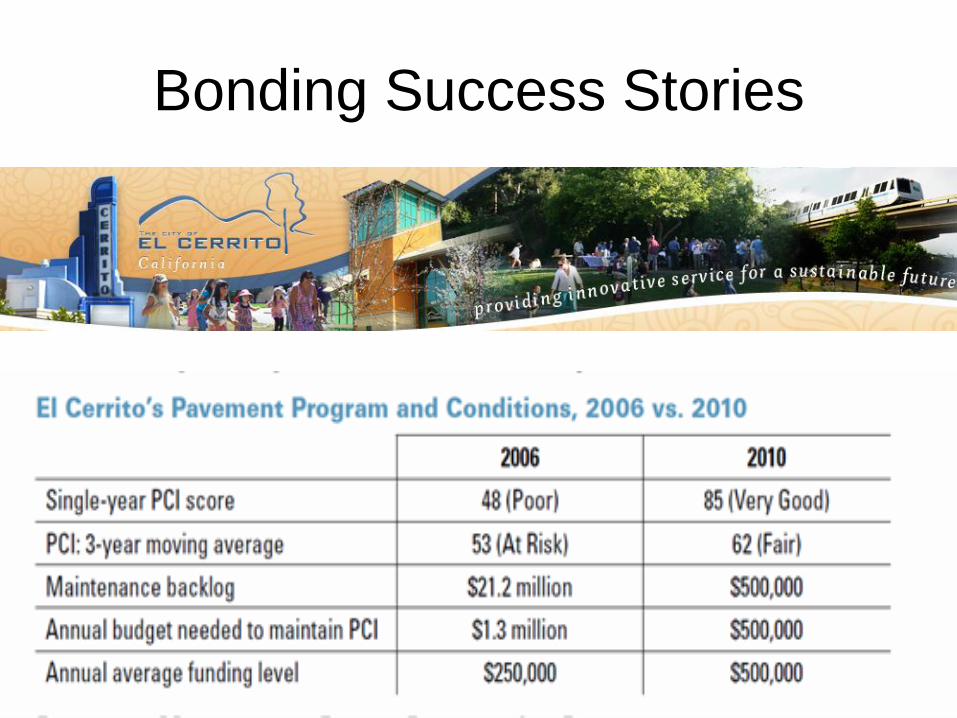
Bonding Success Stories

Advocacy –
Communicating the Need
• The 2010 Pothole
Report
• Annual Press Releases
• Statewide Needs
Assessment

Questions?
Contact Information:
Theresa Romell
Metropolitan Transportation Commission
101 8th St., Oakland, Ca. 94607
(510) 817-5772