Embed Size (px)
Citation preview
1
MTBE AND TBA REMEDIATION USING FLUIDIZED BED BIOREACTORS
Joseph E. O’Connell – Environmental Resolutions, Inc. Ellen E. Moyer – Greenvironment, LLC
Proceedings of the National Ground Water Association Petroleum Hydrocarbons
and Organic Chemicals in Ground Water Conference - Houston, Texas November 5-6, 2007
Abstract
Bioreactors are being used to treat methyl tertiary butyl ether (MTBE), tertiary butyl alcohol (TBA), and other fuel oxygenates at over 30 gasoline release sites. The bioreactors rely on naturally occurring bacteria to mineralize gasoline constituents to carbon dioxide and water. The bacteria are provided with oxygen and essential nutrients such as nitrogen, phosphorus, and potassium, and pH is maintained between 6.5 and 8.5 standard units. Incoming concentrations of TBA/MTBE have ranged from 5,000 to 1,000,000 micrograms per liter. The concentrations of fuel oxygenates in bioreactor effluent are generally non-detect for TBA and MTBE. Most bioreactors are followed by granular activated carbon canisters for final polishing in the event that gasoline constituents exit the bioreactor. Bioreactor operating principles and field operation experiences are discussed. The process and the equipment are described, and capital and operating costs are reviewed. Specialized equipment for removal of sticky bio-solids containing iron, manganese, and hardness precipitates is also discussed. Analytical performance data are presented for a number of California sites.
Bioreactors are also treating groundwater at several sites in the Northeast. The process has been in operation in New Hampshire for over two years where the biomass had to adapt to New England groundwater temperatures and high iron and manganese concentrations. The bioreactor has effectively treated groundwater at temperatures as cool as 49 oF, the lowest influent water temperature measured at this site. This bioreactor is treating MTBE, TBA, and petroleum hydrocarbons such as benzene, toluene, ethylbenzene, and xylenes (BTEX). The cleaned, aerated, seeded effluent is currently being re-injected into the subsurface in the source area to flush the smear zone and promote in situ bioremediation. Contaminant concentrations in source area wells have decreased significantly. Another bioreactor operating at a site in Maryland is effectively treating MTBE, TBA, and BTEX. Background
Environmental Resolutions, Inc. (ERI), in conjunction with Drs. Kate Scow, Edward Schroeder, and Daniel Chang at the University of California at Davis (UC Davis), has developed a biological treatment process for removing fuel oxygenates such as methyl tertiary butyl ether (MTBE) and tertiary butyl alcohol (TBA) from water. The original source of the biomass was a vapor-phase biofilter located at the Joint Water Pollution Control

2
Plant in Carson, California, used in 1997 to remove volatile organic compounds (VOCs) and odors in the off-gas from a sewage treatment plant. After about 370 days, the biomass adapted to consume MTBE. The culture was harvested in 1998 and further developed by UC Davis, who isolated the active microbes and named them Methylobium petroleophilum, or PM-1.
UC Davis then applied the culture to MTBE biodegradation in a bench-scale 4-inch-
diameter trickling bed filter. In 1999, ERI set up a pilot plant with eight 16-inch-diameter trickling bed filters at a service station site in Healdsburg, California, and began the development of a high surface area fluidized bed bioreactor in Orange County. ERI’s first prototype fluidized bed bioreactor began operating in 2000 at a site in Palo Alto, California. Since that time, ERI fluidized bed bioreactors have been put into operation at over 30 other sites in California, New Hampshire, and Maryland.
Although half of the states in the U.S. have banned MTBE in gasoline, and some have also banned TBA as well, past gasoline releases will continue to impair groundwater quality for years to come. Bioreactors offer a solution that permanently destroys these compounds, converting them to carbon dioxide and water, rather than merely transferring them to another medium such as air or granular activated carbon (GAC). ERI has submitted a proposal to the U.S. Environmental Protection Agency to team with UC Davis to demonstrate that bioreactors can be used to produce drinking water from MTBE/TBA-contaminated groundwater. Fluidized Bed Bioreactor Principles
This bioreactor is a two-phase system (solid - sand and liquid - water, no gas) with a recirculating water stream. The biomass is confined to the reaction vessel by its adherence to fine sand. The biomass is distributed within the bioreactor by fluidization provided by an upward flow of water maintained by a constant water recirculation rate throughout the system. The water passes upward through the sand where the biomass removes VOCs as the water passes by. The reaction on any given pass is limited by the amount of oxygen available in the water. Oxygen solubility in water is a function of the temperature and the partial pressure of oxygen as shown in Table 1. Experience to date indicates that the bioreactor operates best between 10 and 35oC (50 and 95oF) at a partial pressure of oxygen above 0.21 atmospheres.
Table 1 Dissolved Oxygen (mg/L) in Water vs. Temperature and Oxygen Partial Pressure
Temp oC(oF) 5(41) 10(50) 15(59) 20(68) 25(77) 30(86) 35(95) Partial Pressure 0.21 atmosphere
12.8
11.3
10.1
9.1
8.3
7.7
7.0
Partial Pressure 0.40 atmosphere
24.3
21.5
19.2
17.3
15.8
14.6
13.3

3
The bioreactor is capable of complete reaction in one pass through the fluidized bed (the hydraulic residence time being 15 minutes) as long as the dissolved oxygen (DO) is not consumed completely and sufficient nutrients such as nitrogen, phosphorus, and potassium (N, P, and K) are available. In addition, pH needs to be in the range of 6.5 to 8.5 standard units. The required oxygen loading is approximately three pounds of oxygen per pound of fuel oxygenates and petroleum hydrocarbons. Oxygen demands for relevant compounds are shown in Table 2.
Table 2 Oxygen Demand for Selected Fuel Constituents
Compound
TBA MTBE Benzene Toluene Xylene or Ethylbenzene
Saturated Hydrocarbons
Required mass of O2/ Mass fuel constituent
2.59
2.73
3.08
3.13
3.17
3.43
PM-1 is a naturally occurring bacterium, or consortium of bacteria, that has been identified at locations in California, New York, and Europe. It has been found at both contaminated and uncontaminated sites. A remarkable feature of PM-1 is its slow growth rate. Its doubling time is on the order of weeks rather than on the order of hours as is typical for many other common aerobic bacteria. This is advantageous in that excess biomass (sludge) requiring removal from the system is rarely generated. On the other hand, it means that a bioreactor should be started up with a large amount of biomass to avoid delays while waiting for the population to grow. Generally, a bioreactor is started up with half the biomass that will ultimately be needed so that within several weeks, the population will be sufficiently large. PM-1 consumes TBA, ethers, and petroleum hydrocarbons as food, breathing oxygen in the process (as we do). Photographs of PM-1 are included in Figure 1.
Figure 1 Photographs of PM-1

4
The bacterial consortia, while capable of consuming fuel oxygenates, actually prefer to dine on BTEX and other petroleum hydrocarbons. If high concentrations of petroleum hydrocarbons are present in the water being treated, petroleum hydrocarbon degraders that may be present will tend to outcompete the fuel oxygenates degraders, and the bioreactor may lose the ability to degrade MTBE and TBA. If the total concentration of BTEX and other petroleum hydrocarbons exceeds the total fuel oxygenates concentration, pretreatment using GAC or air stripping is generally recommended for removal of these more easily treated compounds. The fuel oxygenates will break through the GAC or air stripping unit and enter the bioreactor for treatment. This strategy keeps the bacteria focused on consuming the fuel oxygenates. Bioreactor Operation
The key to bioreactor sizing and operation is contaminant mass loading, which is the product of the flow rate of groundwater from the site recovery wells times the average total VOC concentration in the groundwater from the site recovery wells. As an example, bioreactor operation for a system to process 10 gallons per minute (gpm) containing 5,000 parts per billion (ppb) or micrograms per liter (ug/l) of MTBE and 5,000 ug/l of TBA (10,000 ug/l total) is shown schematically in Figure 2. The mass loading in this example is 10 gpm times 10,000 ug/l, or 100,000 gpm-ug/l. (This is the same as 1.3 pounds/day.) The constant recirculation rate for this bioreactor, needed to keep the sand media fluidized, is 50 gpm. Well water enters the feed tank where it is diluted with 40 gpm of clean treated water to achieve a diluted MTBE/TBA concentration of 2,008 ug/l and a DO of about 8 mg/L. Fifty gpm of the mixture of influent and treated water are pumped into the bottom of the fluidized bed. During a 15-minute residence time, the water makes its way up to the top of the bioreactor. Water exiting the top of the bioreactor has low DO and non-detectable MTBE/TBA (<10 ug/l). The treated water passes through an oxygenator, where it is replenished with DO. An exit flow of 10 gpm leaves 40 gpm to dilute the incoming 10 gpm stream and cycle through the fluidized bed.
Higher concentrations of MTBE/TBA can be handled by reducing the influent flow rate from the site recovery wells so the mass loading on the system is maintained at 100,000 gpm-ug/l. Another alternative would be to add an oxygen booster. With increased oxygenation from an oxygen booster, the mass loading can be raised to 240,000 gpm-ug/l (3 pounds per day).
Treated effluent is discharged back to groundwater, to surface water, or to a publicly owned treatment works (POTW). The concentrations of MTBE and TBA exiting the fluidized bed are typically below the detection limit of the laboratory method being used. For most regional Water Boards in California, a detection of 10 ug/l is satisfactory. However, some require a limit of less than 5 ug/l. For those, the laboratory modifies the procedure and finds the process will deliver ND <5 ug/l for TBA and MTBE.
Most bioreactors are followed by GAC contactors to adsorb VOCs in the event of an
upset or overloading of the bioreactor. Typically, the GAC is changed out very infrequently (e.g., every one or two years), if at all.

5
Figure 2 Schematic Flow Diagram
Solids Removal
When water is oxygenated, sticky solids can form from the interaction of the biomass with precipitates formed from dissolved iron, manganese, and hardness. A filter containing spherical polyethylene beads is used to remove solids from the system (see Figure 2). A separate recycle loop is passed through the filter in up-flow mode until enough solids accumulate on the filter beads to require a backwash. The filter is then isolated with a three-way valve and a motorized agitator is activated to knock the accumulated material off of the beads. When the agitation stops, the beads rise and the solids settle to the bottom of the filter chamber, where they are drawn off as a slurry. About 5 to 7 gallons of slurry are accumulated for each backwash. Backwashing frequency varies with the solids loading, but most systems require backwashing once per week. A few start-ups, with very heavy solids loading, required a three-day backwash frequency for the first several months. Bioreactor Size and Application
Two off-the-shelf ERI bioreactors can accommodate a wide range of mass loadings. For custom designs, sizing is changed by altering the footprint of the bioreactor vessel, leaving the height relatively constant. The recirculation flow rate is then adjusted to maintain bed fluidization and a hydraulic residence time of approximately 15 minutes.

6
The five-foot-diameter bioreactor fits on a 10-foot by 6-foot skid and stands about
11.5 feet tall. The empty weight is about 3,800 pounds. When loaded with sand and water, the total weight is about 15,000 pounds. This bioreactor is designed to metabolize about 1.3 pounds of VOCs per day (or 100,000 gpm-ug/l). The mass loading can be increased to 3 pounds per day with an oxygen booster.
The two-foot-diameter bioreactor fits on a 4-foot by 4-foot skid and stands about 10.5 feet tall. The empty weight is about 400 pounds. Sand and water bring the total weight to about 3,000 pounds. This bioreactor is designed to metabolize 0.2 pounds of VOCs per day (or 20,000 gpm-ug/l). The mass loading can be increased to 0.4 pounds per day with an oxygen booster.
Both of these bioreactors are commercially available and can be delivered and set up virtually anywhere. Clearly some precautions must be taken when the unit is to be operated in extremely cold or hot climates to keep the biomass in the optimal temperature range of 50 to 95oF (10 to 35oC). Once the biomass is established, it generally self regulates the pH at 7.5 + 0.5 by generating carbon dioxide, which produces a bicarbonate buffer. At several sites, this was not the case and the pH fell to below 6.5. An inexpensive automatic pH adjustment system was added and easily remedied the problem. Based on performance of the bioreactor in New Hampshire, iron and manganese do not appear to have any deleterious effect on the performance of the biomass, however, these metals exert an oxygen demand. Copper is a known biocide and should be avoided. Bioreactor Performance in the Field
ERI fluidized bed bioreactors have operated at gas station sites in California, New Hampshire, and Maryland. Some of these bioreactors are discussed below. Palo Alto, California
Data from the operation at Palo Alto, ERI’s first full-scale fluidized bed bioreactor, are shown in Table 3. At this site, MTBE in groundwater was originally being treated with GAC and was then discharged to a POTW via a sanitary sewer. Initially, there was no TBA restriction on the discharge, so TBA values were not routinely measured. BTEX concentrations were very low. The bioreactor was started up in early August 2000 as a side stream treating a portion of the 20 gpm being processed by the GAC system. The first effluent sample, collected on August 9, indicated complete reaction. The incomplete reaction of August 29 was due to a depletion of essential nutrients, which was corrected by supplementing with N, P, and K on a regular basis. Incomplete reaction of September 22, 2000 was due to overfeeding (164,000 gpm-ug/l, well above the 100,000 gpm-ug/l design mass loading). This was cured by adding an oxygen booster.
On November 9, with the oxygen booster in operation, the loading was 204,000 gpm-ug/l and reaction was complete for both MTBE and TBA. The oxygen booster was turned off in February 2001 as concentrations appeared to be dropping. Then on February 14, a surge in concentration required the booster be turned back on. The booster was restarted in

7
mid-February and ran until it was turned off in September 2001. With the exception of May 8, 2002, TBA was not detected. Carbon was not changed out in the last 1.5 years of operation.
The concentrations of oxygenates in site groundwater seemed to rise and fall until the tank tops and dispenser piping were exposed and repaired in January 2003. Vapor leaks were found and corrected. After those repairs, the concentrations of oxygenates dropped steadily until they reached target levels agreed to by the regulating authorities. The bioreactor was moved to another site in September of 2003. Bioreactor treatment was followed by a period of pump and treat with GAC only, and then a period of monitored natural attenuation (MNA), which is ongoing.
Table 3 Performance Data for Five-Foot Fluidized Bed Bioreactor – Palo Alto, CA
Date
Flow Rate
(gpm)
MTBE Influent
(ug/l)
MTBE Effluent
(ug/l)
TBA Influent
(ug/l)
TBA Effluent
(ug/l) 9-Aug-00 10 6,200 ND<2.5 NA NA 29-Aug-00 10 8,000 2,330 19-Sep-00 10 7,600 ND<2.5 22-Sep-00 12 13,700 30.6 26-Oct-00 17 9,670 6.1 980 ND<4 9-Nov-00 17 12,000 ND<0.5 300 ND<5 21-Nov-00 17 5,300 1.2 120 ND<5 20-Dec-00 19 3,600 0.7 260 ND<5 8-Feb-01 19 4,300 ND<2 14-Feb-01 19 7,600 300 22-Feb-01 19 4,700 ND<2 7-Sep-01 16 2,300 ND<2 1,000 ND<5 4-Oct-01 15 1,300 ND<2 740 ND<5 6-Nov-01 14 1,300 ND<2 530 ND<5 6-Dec-01 17 1,100 ND<2 1,100 ND<5 8-May-02 15 710 6 2,100 15 7-Aug-02 15 670 3.6 1,100 ND<20 4-Sep-02 15 3,600 1.1 1,500 ND<20 2-Oct-02 15 4,200 0.8 1,100 ND<5 6-Nov-02 15 900 1 2,000 ND<5 4-Mar-03 12 120 ND<0.5 1100 ND<5 8-May-03 10 49 ND<0.5 570 ND<5 6-Aug-03 11 23 ND<0.5 150 ND<5
NA=not analyzed.

8
Milpitas, California
Data for the bioreactor operating in Milpitas are summarized in Table 4. In this case, the bioreactor was considerably oversized for the loading produced from the recovery wells. The highest loading occurred on February 22, 2002 and was (2 gpm with 787 plus 194 ug/l), which is just under 2,000 gpm-ug/l for a 100,000 gpm-ug/l capacity bioreactor. The bioreactor had difficulty sustaining a biomass at 2% of design loading and supplemental feed was required. A small amount of MTBE was added to the nutrient feed drum to maintain a feed to the bioreactor of 100 ug/l. The bioreactor was employed to meet the 5 ug/l limit for discharge of TBA to the storm water system in Milpitas. The data show that these limits were met in the effluent from the bioreactor in all cases. This case points out the importance of carrying out a sufficiently long pumping test (e.g., at least 24 hours long in a sandy environment, and longer in a less permeable setting) to properly estimate the mass loading from the site, based on an approximate steady-state flow rate contaminant concentrations determined after a number of hours of pumping. The bioreactor has been moved to another location, and this site has been closed.
Table 4
Performance Data for Five-Foot Fluidized Bed Bioreactor – Milpitas, CA
Date
Flow Rate
(gpm)
MTBE Influent
(ug/l)
MTBE Effluent
(ug/l)
TBA Influent
(ug/l)
TBA Effluent
(ug/l) 19-Dec-01 2 420 300 NA NA 18-Jan-02 2 530 27 NA NA 15-Feb-02 2 797 0.8 65 ND<5 22-Feb-02 2 787 ND<0.5 194 ND<5 01-Mar-02 2 513 0.6 105 ND<5 08-Mar-02 2 613 0.7 11 ND<5 15-Mar-02 2 737 ND<0.5 24 ND<5 09-Sep-02 2 120 ND<0.5 6 ND<5 22-Oct-02 2 61 ND<0.5 6 ND<5 19-Nov-02 2 73 ND<0.5 16 ND<5 12-Dec-02 2 69 ND<0.5 ND<5 ND<5 16-Dec-02 2 73 ND<0.5 ND<5 ND<5
Stanton, California
At the Stanton site MTBE concentrations dropped from 200,000 ug/l in 1998 to 2,000 ug/l in 2002. However the concentration of TBA rose from 65,000 ug/l in 2000, when it was first measured, to 1,300,000 in 2003, just before bioreactor treatment began. Unfortunately TBA concentrations were not being measured in 1998, so a comparison with MTBE concentrations is not possible. A five-foot-diameter bioreactor with an oxygen booster was installed and started in June of 2003. Operating data from this bioreactor are summarized in Table 5.

9
Table 5 Performance Data for Five-Foot Fluidized Bed Bioreactor – Stanton, CA
Date
Flow Rate
(gpm)
MTBE Influent
(ug/l)
MTBE Effluent
(ug/l)
TBA Influent
(ug/l)
TBA Effluent
(ug/l) 12-June-03 0.25 160 5 35,000 ND<10 24-Jun-03 1.1 590 3 62,000 ND<10 23-Jul-03 1.3 1,100 1.6 53,000 ND<10 17-Sep-03 2.0 550 ND<1 25,000 ND<10 15-Oct-03 2.5 460 1.8 37,000 ND<10 13-Nov-03 2.7 320 ND<1 20,000 ND<10 18-Dec-03 2.7 220 ND<1 17,000 ND<10 22-Jan-04 2.7 170 ND<1 8,700 ND<10 18-Feb-04 2.7 190 ND<1 14,000 ND<10 26-Mar-04 2.7 250 ND<1 6,000 ND<10 16-Apr-04 2.0 99 ND<1 6,670 ND<10 19-May-04 3.4 84 ND<1 5,560 ND<10 09-Jun-04 3.3 99 ND<1 7,410 ND<10 13-Jul-04 2.0 9 ND<1 2,520 ND<10 04-Aug-04 1.8 81 ND<1 6,970 ND<10 08-Sep-04 3.2 63 ND<1 6,700 ND<10 13-Oct-04 1.1 72 ND<1 7,520 ND<10 02-Dec-04 1.3 36 ND<1 9,330 ND<10 25-Jan-05 2.0 72 ND<1 13,400 ND<10 25-Feb-05 4.0 100 ND<1 16,800 ND<10 11-Oct-05 4.0 100 ND<1 3,600 ND<10 19-Jan-06 4.0 90 ND<1 1,500 ND<10 05-May-06 2.2 50 ND<1 2,200 ND<10 17-Aug-06 1.8 55 1.6 700 ND<10 19-Jan-06 4.0 NA NA 3,000 ND<10 24-Mar-06 2.7 NA NA 1,800 ND<10 5-Apr-06 5.4 NA NA 3,500 ND<10 5-May-06 3.6 NA NA 4,600 ND<10 7-Jul-06 5.6 NA NA 2,000 ND<10 17-Aug-06 2.1 NA NA 710 ND<10 8-Sep-06 1.9 NA NA 1,700 ND<10 7-Oct-06 1.9 NA NA 1,100 ND<10 2-Nov-06 1.7 NA NA 970 ND<10 14-Mar-07 1.5 NA NA 560 ND<10 6-Jun-07 1.8 NA NA 820 ND<10 13-Jul-07 1.8 NA NA 490 ND<10 31-Aug-07 1.9 NA NA 480 ND<10

10
Extraction of water was limited during the start-up phase to the wells having concentrations lower than 60,000 ug/l. Once a significant biomass was established, after about three months of operation, the well having a TBA concentration of 1,300,000 ug/l was introduced into the system. Care was exercised to restrict flow from this well into the bioreactor so as not to deplete the available oxygen. A small amount of biomass had to be removed from the system periodically. About one 55-gallon drum of biomass was removed during the first 9 months of operation.
After decreasing steadily over the first year and a half, the TBA concentrations leveled off and then actually rose again with the intense rain in Southern California in early 2005. A new release was not indicated because the MTBE values remained very low. The bioreactor could handle 5 times the current flow rate of 3 gpm at the concentrations then encountered. Three additional wells were installed in 2005. One produced 2 gpm with 15,000 ug/l of TBA (the other two did not yield significant flow). TBA impact has now been reduced to 500 ug/l. Norwalk, California
The Norwalk site is primarily a TBA site, with some MTBE. BTEX once present in site groundwater has naturally attenuated over time. Seven recovery wells, three or four of which are operated at any given time, extract groundwater for bioreactor treatment. The effluent is discharged to a POTW with a discharge limit of 500 ug/l of total VOCs. Performance data are summarized in Table 6.
Table 6 Performance Data for Five-Foot Fluidized Bed Bioreactor – Norwalk, CA
Date
Flow Rate
(gpm)
MTBE Influent
(ug/l)
MTBE Effluent
(ug/l)
TBA Influent
(ug/l)
TBA Effluent
(ug/l) 17-Jan-07 0.4 14 41 5,500 14 9-Feb-07 0.7 220 ND<1 6,300 26 14-Mar-07 2.9 85 ND<1 1,700 ND<10 2-Apr-07 2.9 130 ND<1 990 ND<10 3-May-07 4.3 340 1.2 2,600 ND<10 13-Jun-07 2.1 69 1.2 3,000 ND<10 10-Jul-07 1.7 190 1.9 3,200 ND<10 3-Aug-07 8,2 200 ND<1 940 ND<10 6-Sep-07 7.5 180 1 1,300 ND<10

11
Bedford, New Hampshire
In late 2003, gasoline was released from an underground storage tank to the shallow bedrock aquifer at the site. Due to the high permeability of the bedrock, product in the bedrock aquifer quickly seeped into surface water in an adjacent small pond. Initial response actions included removing product from the pond and installing product recovery trenches and wells in the shallow bedrock. Product recovery pumps were utilized to recover available product (about 250 to 400 gallons) from site groundwater through October 2004. Product has not been observed since.
A temporary treatment system – consisting of a single extraction well, an air stripper, and two 600-pound GAC vessels – was utilized from May to November 2004. This system was insufficient to effectively capture the dissolved-phase contaminant plume. In addition, MTBE and TBA broke through the carbon in approximately 6 hours, even at a low pumping rate of 0.4 gpm. This required the on-site storage of treated groundwater, followed by transportation and disposal off-site.
An expanded treatment system was implemented in February 2005 that included 4 bedrock extraction wells, and an air stripper and a two-foot-diameter ERI bioreactor that are housed in a heated remediation building. Heating of the water during winter months the first year was provided via a spa heater. The heater was not used the second year, and bacteria performed well at cool temperatures as low as 49 oF, the lowest temperature measured at the site. A commercial ion exchange system was added in August 2005 for iron and manganese pretreatment to reduce operation and maintenance (O&M) costs for solids removal from the treatment equipment, primarily the air stripper.
Until June 2006, the air stripper was used to remove BTEX and other petroleum hydrocarbons such as naphthalene and trimethylbenzenes, tert amyl methyl ether (TAME), MTBE, and a portion of the TBA. A high air to water ratio (300 cubic feet per minute of air for up to 5 gpm of water) was used. The water was then passed through the bioreactor to destroy TBA that the air stripper is unable to remove. Also until recently, the water was polished through two 500-pound GAC units in series and then discharged to an on-site dry well.
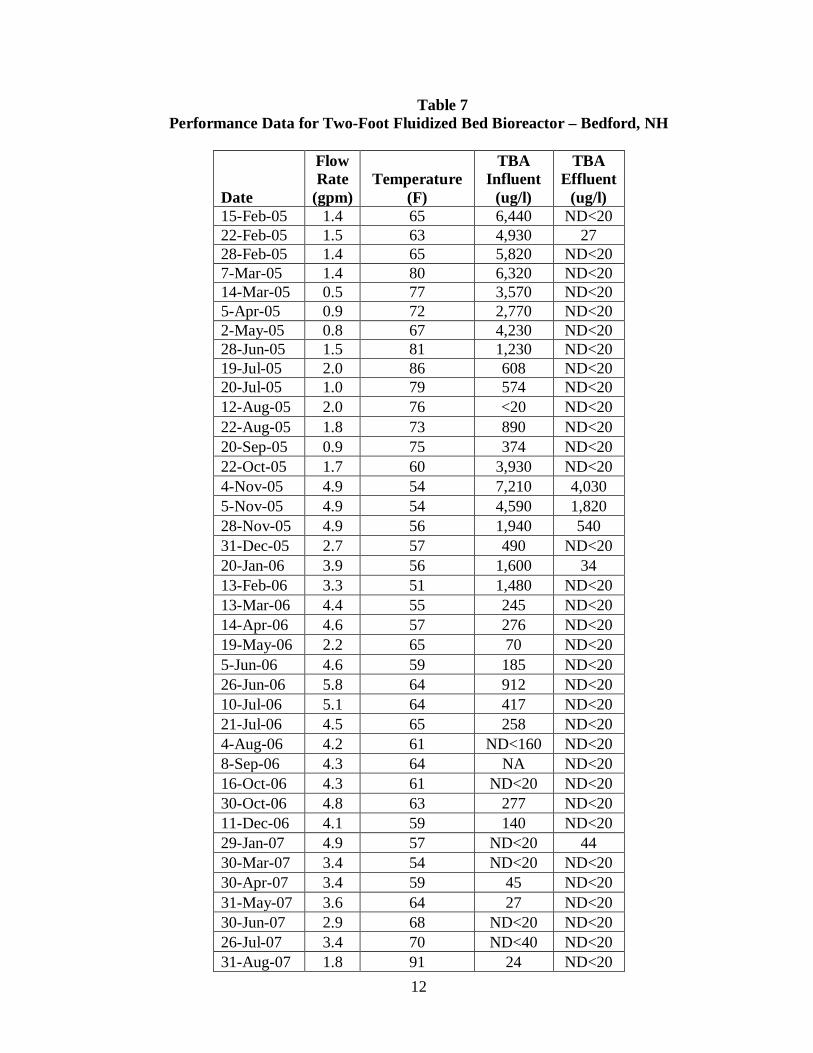
Flow rate, temperature, and TBA data before and after the bioreactor are summarized
in Table 7. From startup through October 2005, the bioreactor consistently reduced TBA to concentrations below the treatment goal of 40 ug/l. In early November 2005, there was a period of intense precipitation; in fact, the Bedford area in 2005 had one of the highest annual rainfall amounts in 150 years. As a result, contamination in the subsurface was mobilized, and an additional extraction well was brought on line to reduce off-site contaminant migration. The flow rate increased by a factor of three and the TBA concentration entering the reactor doubled. These factors coupled with an increase in iron and manganese concentrations and a decrease in temperature overwhelmed the biomass for approximately one month. The TBA mass loading to the bioreactor actually increased more than five-fold. The data in late December 2005 indicate that adequate removal of TBA in the bioreactor had resumed even though the spa heater was turned off.
12
Table 7 Performance Data for Two-Foot Fluidized Bed Bioreactor – Bedford, NH
Date
Flow Rate
(gpm) Temperature
(F)
TBA Influent
(ug/l)
TBA Effluent
(ug/l) 15-Feb-05 1.4 65 6,440 ND<20 22-Feb-05 1.5 63 4,930 27 28-Feb-05 1.4 65 5,820 ND<20 7-Mar-05 1.4 80 6,320 ND<20 14-Mar-05 0.5 77 3,570 ND<20 5-Apr-05 0.9 72 2,770 ND<20 2-May-05 0.8 67 4,230 ND<20 28-Jun-05 1.5 81 1,230 ND<20 19-Jul-05 2.0 86 608 ND<20 20-Jul-05 1.0 79 574 ND<20 12-Aug-05 2.0 76 <20 ND<20 22-Aug-05 1.8 73 890 ND<20 20-Sep-05 0.9 75 374 ND<20 22-Oct-05 1.7 60 3,930 ND<20 4-Nov-05 4.9 54 7,210 4,030 5-Nov-05 4.9 54 4,590 1,820 28-Nov-05 4.9 56 1,940 540 31-Dec-05 2.7 57 490 ND<20 20-Jan-06 3.9 56 1,600 34 13-Feb-06 3.3 51 1,480 ND<20 13-Mar-06 4.4 55 245 ND<20 14-Apr-06 4.6 57 276 ND<20 19-May-06 2.2 65 70 ND<20 5-Jun-06 4.6 59 185 ND<20 26-Jun-06 5.8 64 912 ND<20 10-Jul-06 5.1 64 417 ND<20 21-Jul-06 4.5 65 258 ND<20 4-Aug-06 4.2 61 ND<160 ND<20 8-Sep-06 4.3 64 NA ND<20 16-Oct-06 4.3 61 ND<20 ND<20 30-Oct-06 4.8 63 277 ND<20 11-Dec-06 4.1 59 140 ND<20 29-Jan-07 4.9 57 ND<20 44 30-Mar-07 3.4 54 ND<20 ND<20 30-Apr-07 3.4 59 45 ND<20 31-May-07 3.6 64 27 ND<20 30-Jun-07 2.9 68 ND<20 ND<20 26-Jul-07 3.4 70 ND<40 ND<20 31-Aug-07 1.8 91 24 ND<20
13
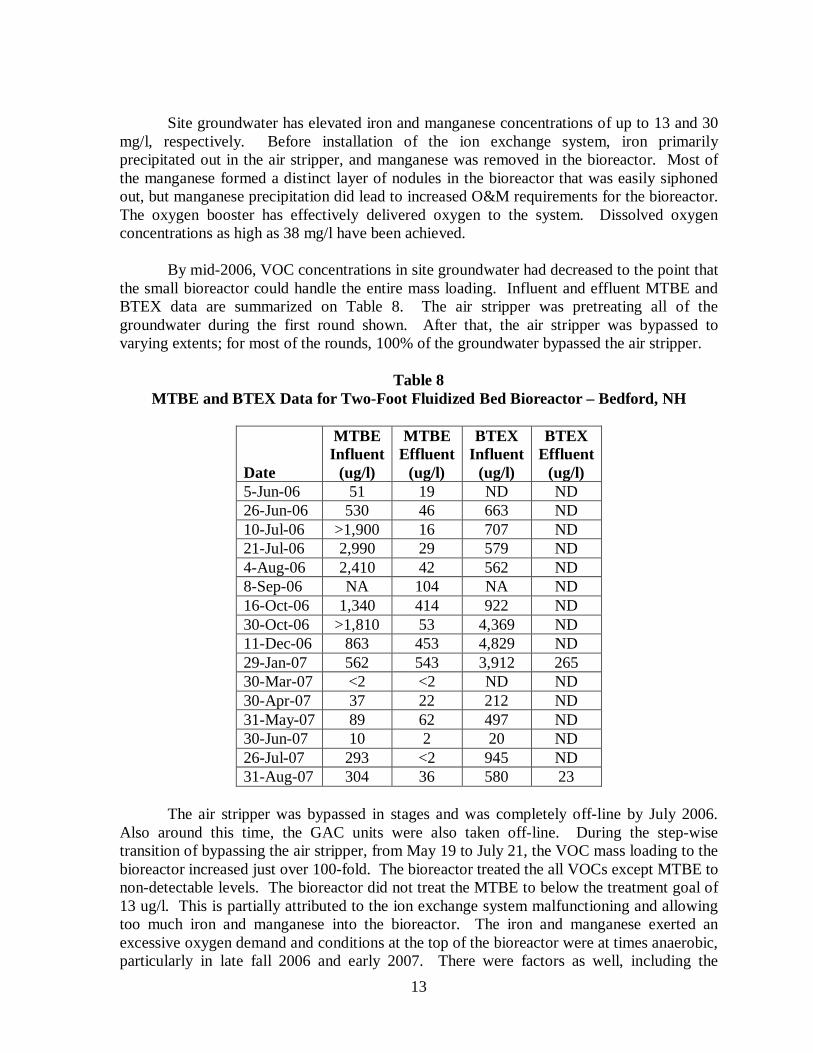
Site groundwater has elevated iron and manganese concentrations of up to 13 and 30
mg/l, respectively. Before installation of the ion exchange system, iron primarily precipitated out in the air stripper, and manganese was removed in the bioreactor. Most of the manganese formed a distinct layer of nodules in the bioreactor that was easily siphoned out, but manganese precipitation did lead to increased O&M requirements for the bioreactor. The oxygen booster has effectively delivered oxygen to the system. Dissolved oxygen concentrations as high as 38 mg/l have been achieved.
By mid-2006, VOC concentrations in site groundwater had decreased to the point that the small bioreactor could handle the entire mass loading. Influent and effluent MTBE and BTEX data are summarized on Table 8. The air stripper was pretreating all of the groundwater during the first round shown. After that, the air stripper was bypassed to varying extents; for most of the rounds, 100% of the groundwater bypassed the air stripper.
Table 8 MTBE and BTEX Data for Two-Foot Fluidized Bed Bioreactor – Bedford, NH
Date
MTBE Influent
(ug/l)
MTBE Effluent
(ug/l)
BTEX Influent
(ug/l)
BTEX Effluent
(ug/l) 5-Jun-06 51 19 ND ND 26-Jun-06 530 46 663 ND 10-Jul-06 >1,900 16 707 ND 21-Jul-06 2,990 29 579 ND 4-Aug-06 2,410 42 562 ND 8-Sep-06 NA 104 NA ND 16-Oct-06 1,340 414 922 ND 30-Oct-06 >1,810 53 4,369 ND 11-Dec-06 863 453 4,829 ND 29-Jan-07 562 543 3,912 265 30-Mar-07 <2 <2 ND ND 30-Apr-07 37 22 212 ND 31-May-07 89 62 497 ND 30-Jun-07 10 2 20 ND 26-Jul-07 293 <2 945 ND 31-Aug-07 304 36 580 23
The air stripper was bypassed in stages and was completely off-line by July 2006.
Also around this time, the GAC units were also taken off-line. During the step-wise transition of bypassing the air stripper, from May 19 to July 21, the VOC mass loading to the bioreactor increased just over 100-fold. The bioreactor treated the all VOCs except MTBE to non-detectable levels. The bioreactor did not treat the MTBE to below the treatment goal of 13 ug/l. This is partially attributed to the ion exchange system malfunctioning and allowing too much iron and manganese into the bioreactor. The iron and manganese exerted an excessive oxygen demand and conditions at the top of the bioreactor were at times anaerobic, particularly in late fall 2006 and early 2007. There were factors as well, including the

14
oxygen booster tripping off one time in late January 2007. Also, the BTEX to MTBE ratio was quite high in late fall 2006/early 2007. The ion exchange system has been problematic throughout the project, leading to numerous problems including the 91 oF temperature recorded in August 2007. After that incident, it was taken off-line permanently. The two recovery wells with the highest iron and manganese concentrations are no longer pumped, and the bioreactor is operating well. The bioreactor is the only equipment currently operating at the site. The air stripper, GAC units, and ion exchange system have all been turned off.
In fall 2006, a 30-foot-long 4-foot-deep infiltration trench was installed in the unsaturated zone in the source area. The treated, aerated, and bacterially seeded effluent bypassed the GAC units and began to be injected into the infiltration trench to flush contaminants from the smear zone and promote in situ bioremediation. There have been two rounds of monitoring well groundwater sampling since re-injection began in October 2006. Table 9 shows data for two wells near the source area, including the last round for each well prior to re-injection and the two rounds since re-injection began. (TBA data are not shown for these wells because TBA has not been present recently at these locations.) Concentration data for these wells and other wells farther downgradient, as well as groundwater flow patterns, indicate that that the concentration reductions cannot be fully explained by dilution of groundwater by the effluent, or by short-circuiting of effluent to the monitoring wells, or by the effluent flushing contaminated groundwater to locations farther downgradient. Significant in situ bioremediation is likely partially responsible for the significant reductions in concentrations. This is particularly the case for the latest sampling round which occurred after a very dry period, in which groundwater elevations were three to six feet below spring levels and groundwater recovery and re-injection flow rates were correspondingly low. There has been no evidence of clogging. It is interesting that as time goes on, MTBE and TBA are decreasing in concentration and BTEX predominates.
Table 9 Pre- and Post-Re-injection MTBE and BTEX Concentrations (ug/l and % Decrease from Pre-Re-injection Concentration)
MW-12S (~15’ from Source)
9/7/06 Before 4/9/07 After 9/4/07 After MTBE 1,560 19 (99%) 81 (95%) BTEX 29,931 2,059 (93%) 3,622 (88%)
MW-4 (~35’ from Source) 4/6/06 Before 4/9/07 After 9/4/07 After
MTBE 11,800 304 (97%) 313 (97%) BTEX 54,150 22,115 (59%) 26,699 (51%)
15
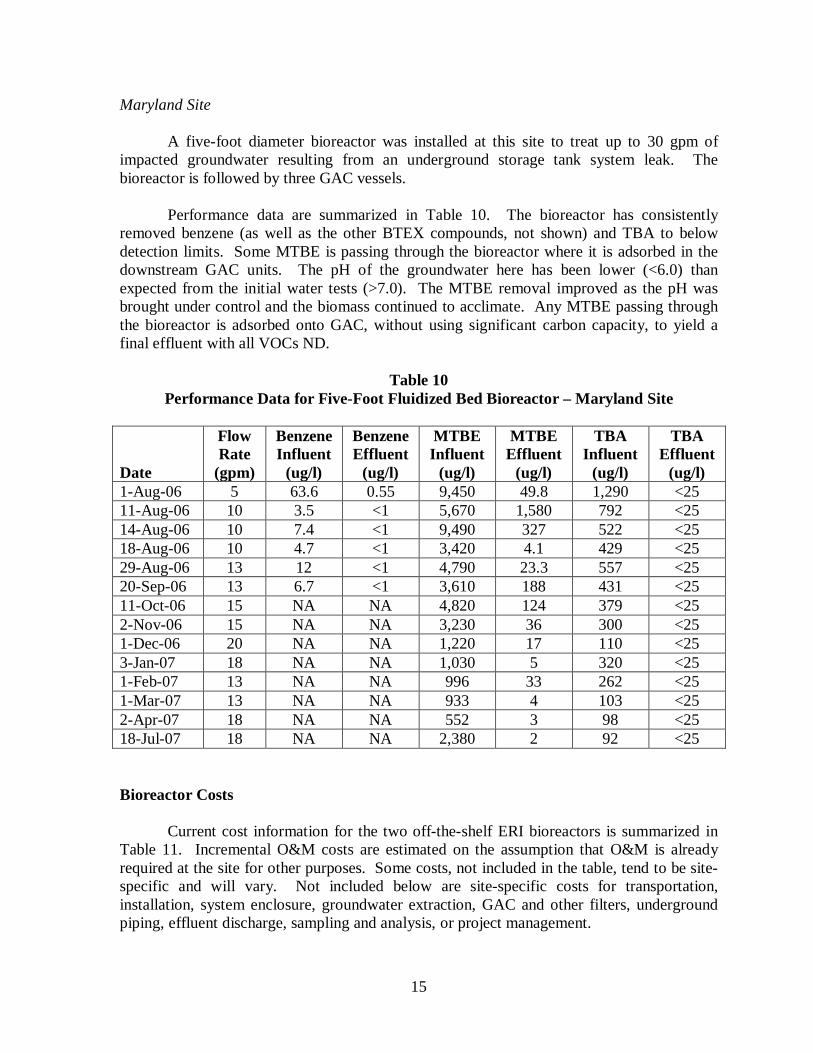
Maryland Site
A five-foot diameter bioreactor was installed at this site to treat up to 30 gpm of impacted groundwater resulting from an underground storage tank system leak. The bioreactor is followed by three GAC vessels.
Performance data are summarized in Table 10. The bioreactor has consistently removed benzene (as well as the other BTEX compounds, not shown) and TBA to below detection limits. Some MTBE is passing through the bioreactor where it is adsorbed in the downstream GAC units. The pH of the groundwater here has been lower (<6.0) than expected from the initial water tests (>7.0). The MTBE removal improved as the pH was brought under control and the biomass continued to acclimate. Any MTBE passing through the bioreactor is adsorbed onto GAC, without using significant carbon capacity, to yield a final effluent with all VOCs ND.
Table 10
Performance Data for Five-Foot Fluidized Bed Bioreactor – Maryland Site Date
Flow Rate
(gpm)
Benzene Influent
(ug/l)
Benzene Effluent
(ug/l)
MTBE Influent
(ug/l)
MTBE Effluent
(ug/l)
TBA Influent
(ug/l)
TBA Effluent
(ug/l) 1-Aug-06 5 63.6 0.55 9,450 49.8 1,290 <25 11-Aug-06 10 3.5 <1 5,670 1,580 792 <25 14-Aug-06 10 7.4 <1 9,490 327 522 <25 18-Aug-06 10 4.7 <1 3,420 4.1 429 <25 29-Aug-06 13 12 <1 4,790 23.3 557 <25 20-Sep-06 13 6.7 <1 3,610 188 431 <25 11-Oct-06 15 NA NA 4,820 124 379 <25 2-Nov-06 15 NA NA 3,230 36 300 <25 1-Dec-06 20 NA NA 1,220 17 110 <25 3-Jan-07 18 NA NA 1,030 5 320 <25 1-Feb-07 13 NA NA 996 33 262 <25 1-Mar-07 13 NA NA 933 4 103 <25 2-Apr-07 18 NA NA 552 3 98 <25 18-Jul-07 18 NA NA 2,380 2 92 <25 Bioreactor Costs
Current cost information for the two off-the-shelf ERI bioreactors is summarized in Table 11. Incremental O&M costs are estimated on the assumption that O&M is already required at the site for other purposes. Some costs, not included in the table, tend to be site-specific and will vary. Not included below are site-specific costs for transportation, installation, system enclosure, groundwater extraction, GAC and other filters, underground piping, effluent discharge, sampling and analysis, or project management.

16
Table 11 Bioreactor Cost Information
Cost Item 2-Foot Bioreactor 5-Foot Bioreactor Bioreactor, sand, and biomass $35,000 $65,000 Oxygen booster (optional) $3,500 $3,500 On-site O&M labor (hours/week) 1.5-2.5 2-3 Power for bioreactor (kilowatts) 0.9 1.5 Materials, chemicals, parts, solids disposal $100/month $200/month Conclusions
There are many benefits of using bioreactors to treat fuel oxygenates and petroleum hydrocarbons:
1. The process actually destroys fuel oxygenates and petroleum hydrocarbons, mineralizing them to carbon dioxide and water, rather than merely transferring them to another medium.
2. The bioreactor system has a partial recycle loop that provides operational flexibility and enables the bioreactor to operate at peak efficiency under varying conditions. In addition, the dilution provided makes it possible to treat extremely contaminated groundwater.
3. The bioreactors are minimally impacted by clogging and precipitates compared to other technologies. In particular, high manganese concentrations are well tolerated.
4. The bioreactors are compact, quiet, and odor-free. 5. When remediation is complete, the bioreactor may be reused at the next site. 6. The technology has been proven in full-scale operation at over 30 sites. 7. The process uses naturally occurring microorganisms. 8. The biomass is extremely resilient, adapting well to gradual changes in contaminant
concentrations, temperature, and other conditions. Because of its slow growth rate, excess biomass is rarely generated.
9. The biomass performs well at cool temperatures. 10. The process provides one of the very few treatment options for TBA. 11. Groundwater extraction and treatment can provide hydraulic control at the site and is
often a good strategy for dealing with soluble non-adsorptive contaminants such as MTBE and TBA.
12. The cleaned, aerated, bacterially seeded effluent can be re-injected to flush the smear zone and promote in situ bioremediation.
13. The bioreactors can be scaled to any mass loading. Two off-the-shelf sizes are available, and larger sizes can be custom manufactured.
17
Biographies Joseph E. O’Connell, Sc.D., P.E., is President of ERI. With approximately 33 years of professional experience, he has been the Principal Engineer for designing, permitting, installing and operating numerous remediation systems. Systems installed include air sparging, vacuum extraction, pump and treat, shoring and excavation, bioremediation and fixation. Contaminants range from chlorinated hydrocarbons to gasoline-range hydrocarbons to metals. He worked with researchers at UC Davis in California to develop bio-culture, adapt the fluidized bed bioreactor to handle the slow growing biomass, and develop the overall design and control features of the bioreactors. Joseph O’Connell, Sc.D., P.E. Environmental Resolutions, Inc. 20372 North Sea Circle Lake Forest, CA 92630 (949) 457-8950 [email protected] Ellen Moyer, Ph.D., P.E, Principal of Greenvironment, LLC, is a recognized expert in the assessment and remediation of fuel oxygenates contamination. She has an M.S. in Environmental Engineering, a Ph.D. in Civil Engineering, and over 20 years of professional experience. Dr. Moyer has managed all phases of assessment and remediation work, and her numerous projects have employed a wide range of in situ and ex situ remediation technologies at diverse sites with organic and inorganic contaminants. She was the lead editor of an MTBE Remediation Handbook, now in its second printing.
Ellen Moyer, Ph.D., P.E. Principal Greenvironment, LLC 258 Main Road Montgomery, MA 01085 (413) 862-3452 [email protected]

18
Bioreactor Operating in Stanton, California
Small Bioreactor Ready for Shipment