Embed Size (px)
Citation preview
offering memorandum.
www.maffiateam.com
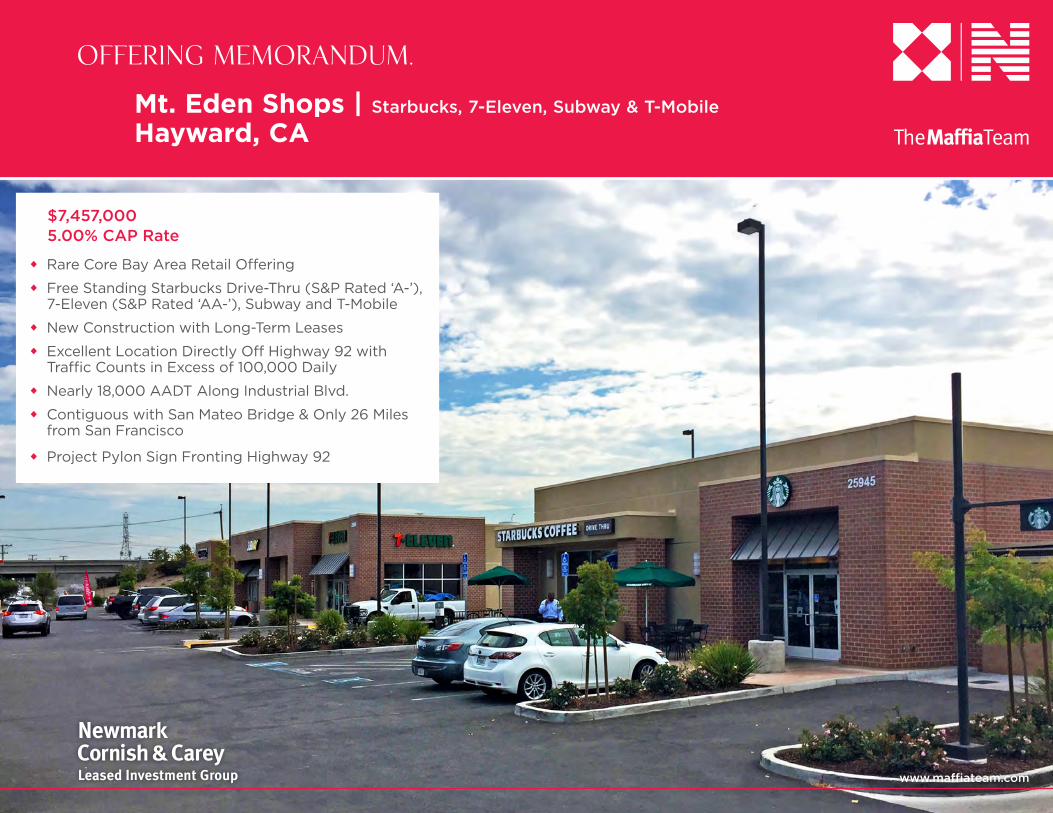
Mt. Eden Shops | Starbucks, 7-Eleven, Subway & T-Mobile
Hayward, CA
• Rare Core Bay Area Retail Offering
• Free Standing Starbucks Drive-Thru (S&P Rated ‘A-’), 7-Eleven (S&P Rated ‘AA-’), Subway and T-Mobile
• New Construction with Long-Term Leases
• Excellent Location Directly Off Highway 92 with Traffic Counts in Excess of 100,000 Daily
• Nearly 18,000 AADT Along Industrial Blvd.
• Contiguous with San Mateo Bridge & Only 26 Miles from San Francisco
• Project Pylon Sign Fronting Highway 92
$7,457,0005.00% CAP Rate
Newmark Cornish & Carey (“Broker”) has been retained on an exclusive basis to market the property described herein (“Property”). Broker has been authorized by the Seller of the Property (“Seller”) to prepare and distribute the enclosed information (“Material”) for the purpose of soliciting offers to purchase from interested parties. More detailed financial, title and tenant lease information may be made available upon request following the mutual execution of a letter of intent or contract to purchase between the Seller and a prospective purchaser. You are invited to review this opportunity and make an offer to purchase based upon your analysis. If your offer results in the Seller choosing to open negotiations with you, you will be asked to provide financial references. The eventual purchaser will be chosen based upon an assessment of price, terms, ability to close the transaction and such other matters as the Seller deems appropriate.
The Material is intended solely for the purpose of soliciting expressions of interest from qualified investors for the acquisition of the Property. The Material is not to be copied and/or used for any other purpose or made available to any other person without the express written consent of Broker or Seller. The Material does not purport to be all-inclusive or to contain all of the information that a prospective buyer may require. The information contained in the Material has been obtained from the Seller and other sources and has not been verified by the Seller or its affiliates. The pro forma is delivered only as an accommodation and neither the Seller, Broker, nor any of their respective affiliates, agents, representatives, employees, parents, subsidiaries, members, managers, partners, shareholders, directors, or officers, makes any representation or warranty regarding such pro forma. Purchaser must make its own investigation of the Property and any existing or available financing, and must independently confirm the accuracy of the projections contained in the pro forma.
Seller reserves the right, for any reason, to withdraw the Property from the market. Seller has no obligation, express or implied, to accept any offer. Further, Seller has no obligation to sell the Property unless and until the Seller executes and delivers a signed agreement of purchase and sale on terms acceptable to the Seller, in its sole discretion. By submitting an offer, a purchaser will be deemed to have acknowledged the foregoing and agreed to release Seller and Broker from any liability with respect thereto.
Property walk-throughs are to be conducted by appointment only. Contact Broker for additional information.
Disclaimer
Table of Contents
PROPERTY INFORMATION 1FINANCIAL ANALYSIS 2RENT ROLL 5TENANT INFORMATION 6SITE PLAN 7AERIALS 8ABOuT THE AREA 12DEMOgRAPHICS 14
Vincent AicaleVice President [email protected] RE License #01728696
Ryan ForsythVice President [email protected] RE License #01716551
11
Property Information
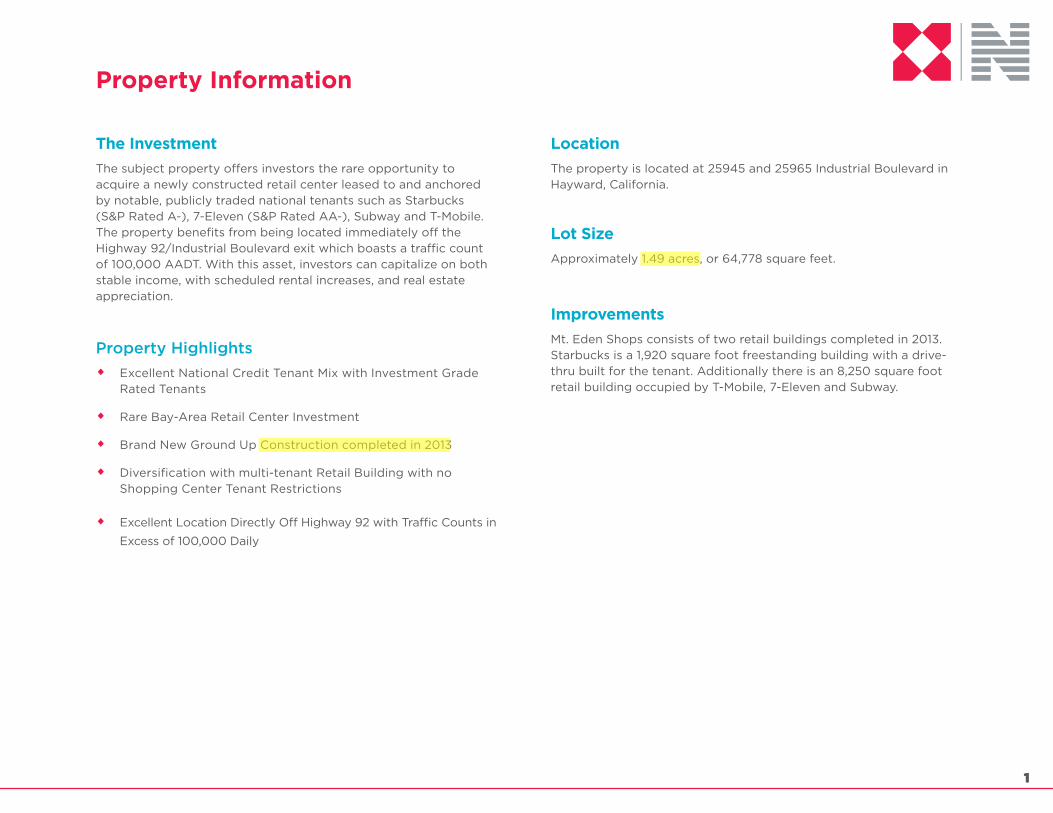
The InvestmentThe subject property offers investors the rare opportunity to acquire a newly constructed retail center leased to and anchored by notable, publicly traded national tenants such as Starbucks (S&P Rated A-), 7-Eleven (S&P Rated AA-), Subway and T-Mobile. The property benefits from being located immediately off the Highway 92/Industrial Boulevard exit which boasts a traffic count of 100,000 AADT. With this asset, investors can capitalize on both stable income, with scheduled rental increases, and real estate appreciation.
Property Highlights
• Excellent National Credit Tenant Mix with Investment grade Rated Tenants
• Rare Bay-Area Retail Center Investment
• Brand New ground up Construction completed in 2013
• Diversification with multi-tenant Retail Building with no Shopping Center Tenant Restrictions
• Excellent Location Directly Off Highway 92 with Traffic Counts in
Excess of 100,000 Daily
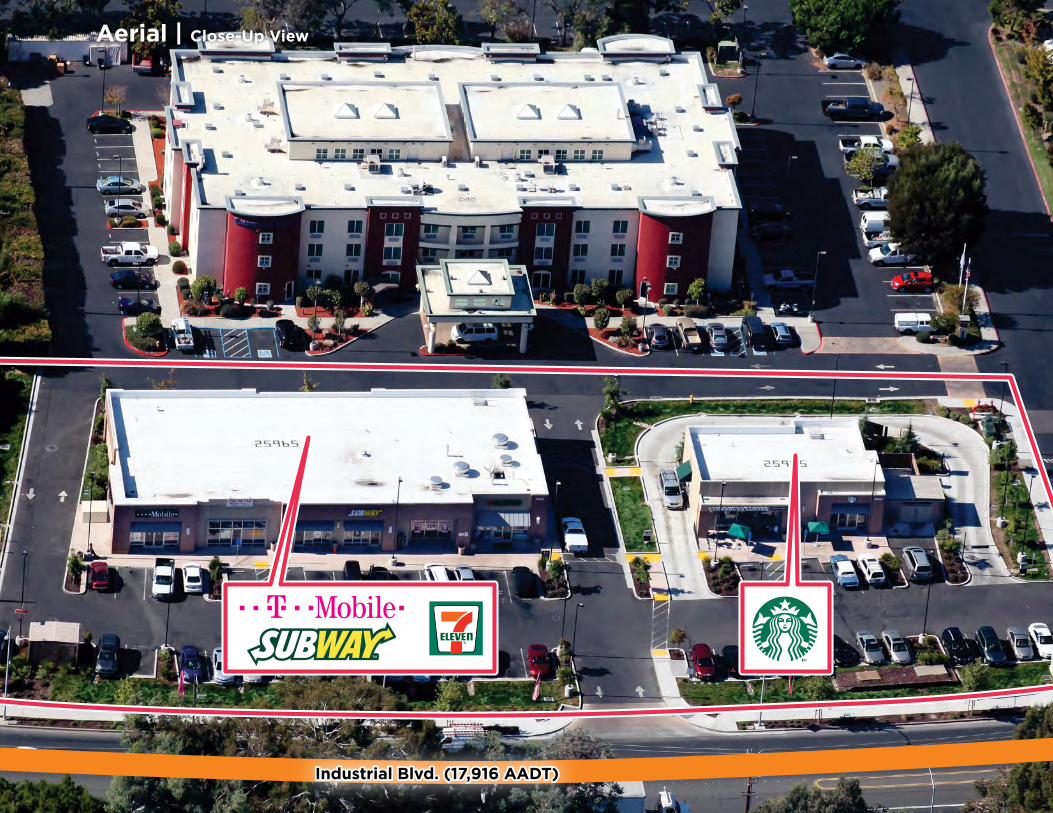
LocationThe property is located at 25945 and 25965 Industrial Boulevard in Hayward, California.
Lot SizeApproximately 1.49 acres, or 64,778 square feet.
ImprovementsMt. Eden Shops consists of two retail buildings completed in 2013. Starbucks is a 1,920 square foot freestanding building with a drive-thru built for the tenant. Additionally there is an 8,250 square foot retail building occupied by T-Mobile, 7-Eleven and Subway.
2
Financial Analysis | Pricing
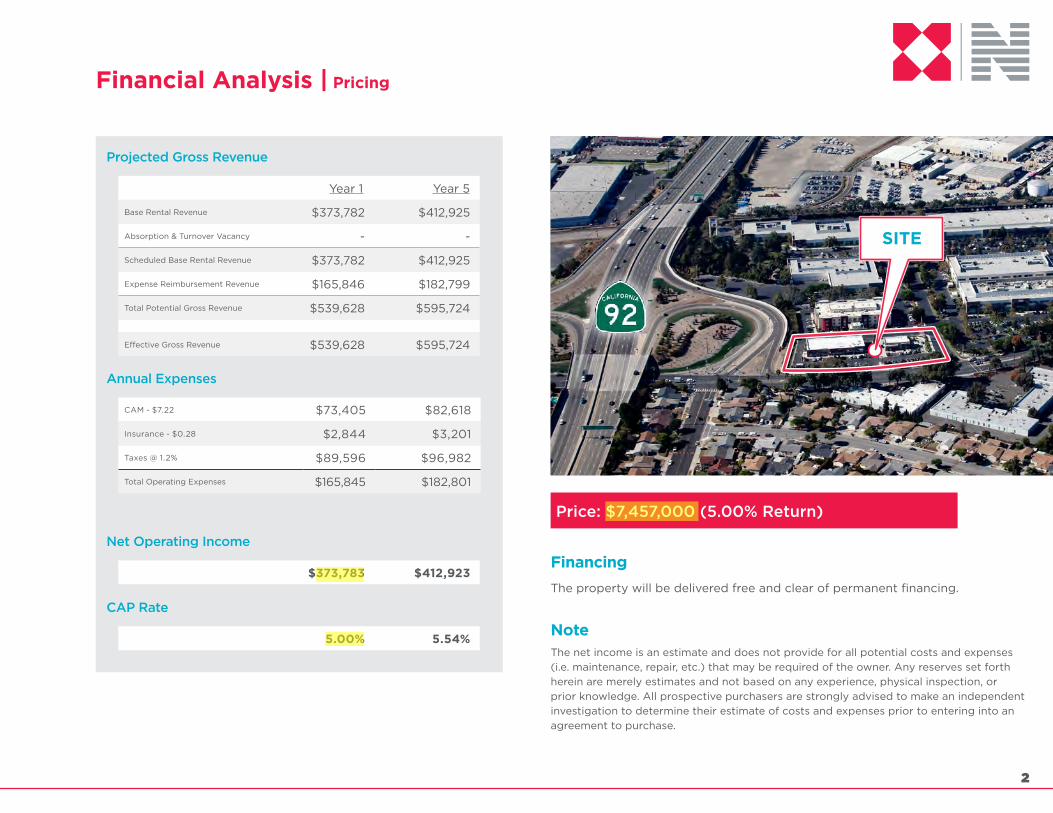
Projected Gross Revenue
Year 1 Year 5
Base Rental Revenue $373,782 $412,925
Absorption & Turnover Vacancy - -
Scheduled Base Rental Revenue $373,782 $412,925
Expense Reimbursement Revenue $165,846 $182,799
Total Potential gross Revenue $539,628 $595,724
Effective gross Revenue $539,628 $595,724
Annual Expenses
CAM - $7.22 $73,405 $82,618
Insurance - $0.28 $2,844 $3,201
Taxes @ 1.2% $89,596 $96,982
Total Operating Expenses $165,845 $182,801
Net Operating Income
$373,783 $412,923
CAP Rate
5.00% 5.54%
Price: $7,457,000 (5.00% Return)
FinancingThe property will be delivered free and clear of permanent financing.
NoteThe net income is an estimate and does not provide for all potential costs and expenses (i.e. maintenance, repair, etc.) that may be required of the owner. Any reserves set forth herein are merely estimates and not based on any experience, physical inspection, or prior knowledge. All prospective purchasers are strongly advised to make an independent investigation to determine their estimate of costs and expenses prior to entering into an agreement to purchase.
SITE
3
Financial Analysis | Assumptions
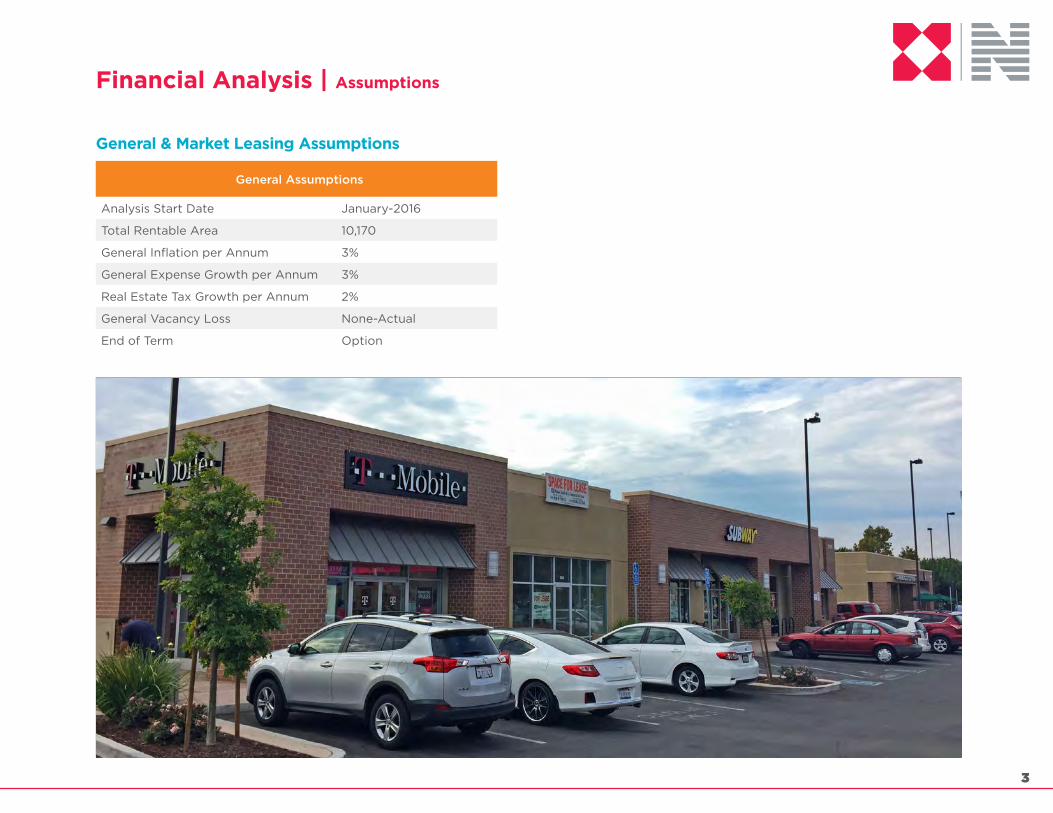
General & Market Leasing Assumptions
General Assumptions
Analysis Start Date January-2016
Total Rentable Area 10,170
general Inflation per Annum 3%
general Expense growth per Annum 3%
Real Estate Tax growth per Annum 2%
general Vacancy Loss None-Actual
End of Term Option
4
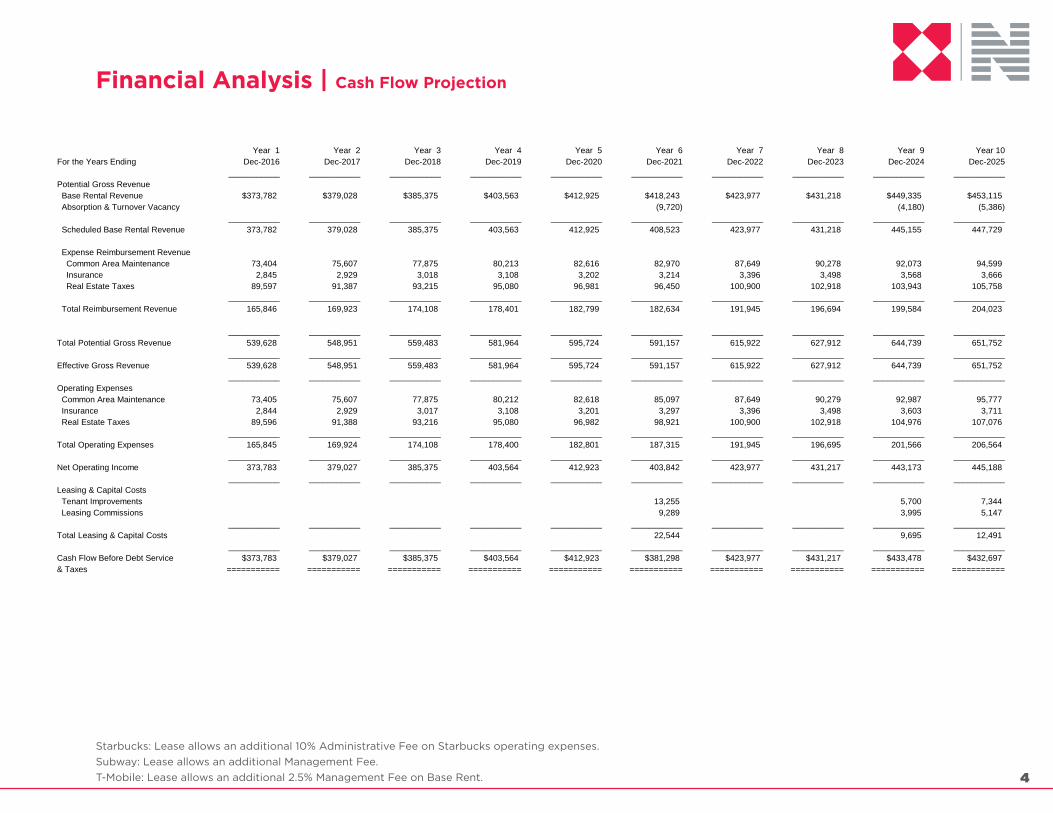
Financial Analysis | Cash Flow Projection
Software: ARGUS Ver. 15.0.1.26
File: Mt Edens Shops ARGUS - Revised 10-19
Property Type: Retail
Portfolio:
Date: 10/19/15
Time: 5:47 pm
Ref#: AFJ
Page: 1
Year 1 Year 2 Year 3 Year 4 Year 5 Year 6 Year 7 Year 8 Year 9 Year 10For the Years Ending Dec-2016 Dec-2017 Dec-2018 Dec-2019 Dec-2020 Dec-2021 Dec-2022 Dec-2023 Dec-2024 Dec-2025
___________ ___________ ___________ ___________ ___________ ___________ ___________ ___________ ___________ ___________Potential Gross Revenue Base Rental Revenue $373,782 $379,028 $385,375 $403,563 $412,925 $418,243 $423,977 $431,218 $449,335 $453,115 Absorption & Turnover Vacancy (9,720) (4,180) (5,386)
___________ ___________ ___________ ___________ ___________ ___________ ___________ ___________ ___________ ___________ Scheduled Base Rental Revenue 373,782 379,028 385,375 403,563 412,925 408,523 423,977 431,218 445,155 447,729
Expense Reimbursement Revenue Common Area Maintenance 73,404 75,607 77,875 80,213 82,616 82,970 87,649 90,278 92,073 94,599 Insurance 2,845 2,929 3,018 3,108 3,202 3,214 3,396 3,498 3,568 3,666 Real Estate Taxes 89,597 91,387 93,215 95,080 96,981 96,450 100,900 102,918 103,943 105,758
___________ ___________ ___________ ___________ ___________ ___________ ___________ ___________ ___________ ___________ Total Reimbursement Revenue 165,846 169,923 174,108 178,401 182,799 182,634 191,945 196,694 199,584 204,023
___________ ___________ ___________ ___________ ___________ ___________ ___________ ___________ ___________ ___________Total Potential Gross Revenue 539,628 548,951 559,483 581,964 595,724 591,157 615,922 627,912 644,739 651,752
___________ ___________ ___________ ___________ ___________ ___________ ___________ ___________ ___________ ___________Effective Gross Revenue 539,628 548,951 559,483 581,964 595,724 591,157 615,922 627,912 644,739 651,752
___________ ___________ ___________ ___________ ___________ ___________ ___________ ___________ ___________ ___________Operating Expenses Common Area Maintenance 73,405 75,607 77,875 80,212 82,618 85,097 87,649 90,279 92,987 95,777 Insurance 2,844 2,929 3,017 3,108 3,201 3,297 3,396 3,498 3,603 3,711 Real Estate Taxes 89,596 91,388 93,216 95,080 96,982 98,921 100,900 102,918 104,976 107,076
___________ ___________ ___________ ___________ ___________ ___________ ___________ ___________ ___________ ___________Total Operating Expenses 165,845 169,924 174,108 178,400 182,801 187,315 191,945 196,695 201,566 206,564
___________ ___________ ___________ ___________ ___________ ___________ ___________ ___________ ___________ ___________Net Operating Income 373,783 379,027 385,375 403,564 412,923 403,842 423,977 431,217 443,173 445,188
___________ ___________ ___________ ___________ ___________ ___________ ___________ ___________ ___________ ___________Leasing & Capital Costs Tenant Improvements 13,255 5,700 7,344 Leasing Commissions 9,289 3,995 5,147
___________ ___________ ___________ ___________ ___________ ___________ ___________ ___________ ___________ ___________Total Leasing & Capital Costs 22,544 9,695 12,491
___________ ___________ ___________ ___________ ___________ ___________ ___________ ___________ ___________ ___________Cash Flow Before Debt Service $373,783 $379,027 $385,375 $403,564 $412,923 $381,298 $423,977 $431,217 $433,478 $432,697& Taxes =========== =========== =========== =========== =========== =========== =========== =========== =========== ===========
Schedule Of Prospective Cash Flow
In Inflated Dollars for the Fiscal Year Beginning 1/1/2016
Mt Edens Shops
Starbucks: Lease allows an additional 10% Administrative Fee on Starbucks operating expenses.Subway: Lease allows an additional Management Fee.T-Mobile: Lease allows an additional 2.5% Management Fee on Base Rent.
5
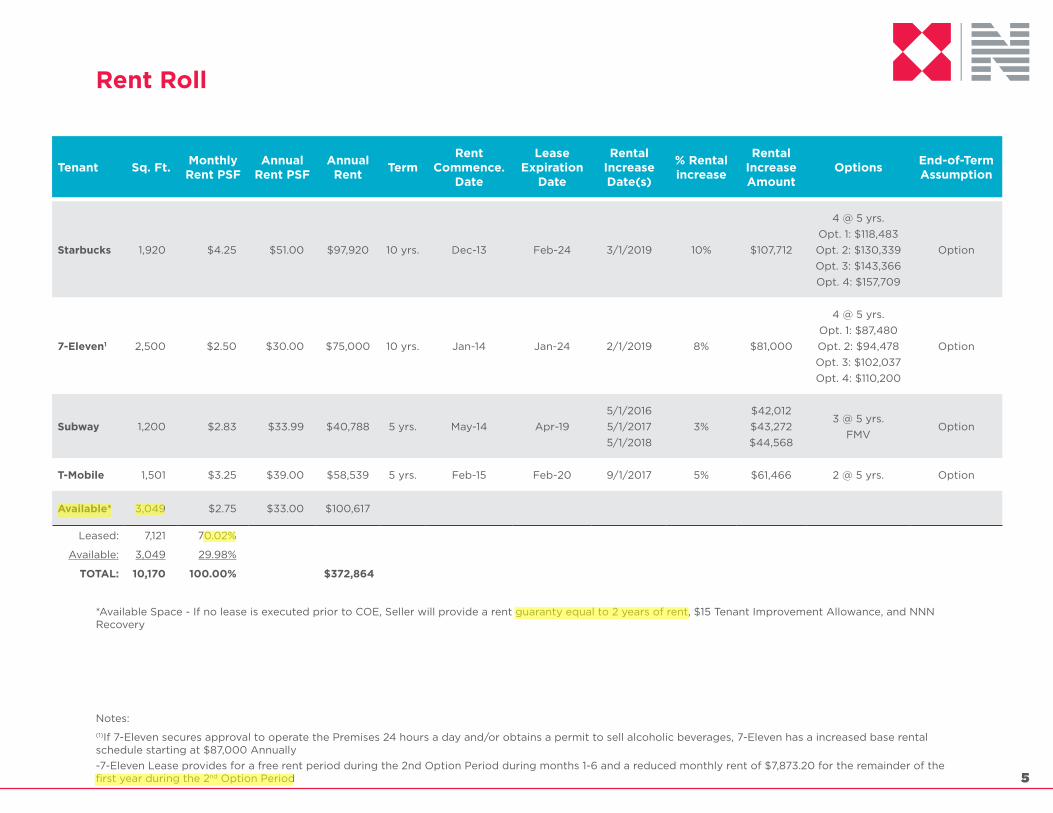
Rent Roll
*Available Space - If no lease is executed prior to COE, Seller will provide a rent guaranty equal to 2 years of rent, $15 Tenant Improvement Allowance, and NNN Recovery
Notes:(1)If 7-Eleven secures approval to operate the Premises 24 hours a day and/or obtains a permit to sell alcoholic beverages, 7-Eleven has a increased base rental schedule starting at $87,000 Annually-7-Eleven Lease provides for a free rent period during the 2nd Option Period during months 1-6 and a reduced monthly rent of $7,873.20 for the remainder of the first year during the 2nd Option Period
Tenant Sq. Ft. Monthly Rent PSF
Annual Rent PSF
Annual Rent Term
Rent Commence.
Date
LeaseExpiration
Date
RentalIncreaseDate(s)
% Rentalincrease
RentalIncreaseAmount
Options End-of-TermAssumption
Starbucks 1,920 $4.25 $51.00 $97,920 10 yrs. Dec-13 Feb-24 3/1/2019 10% $107,712
4 @ 5 yrs. Opt. 1: $118,483 Opt. 2: $130,339 Opt. 3: $143,366 Opt. 4: $157,709
Option
7-Eleven1 2,500 $2.50 $30.00 $75,000 10 yrs. Jan-14 Jan-24 2/1/2019 8% $81,000
4 @ 5 yrs. Opt. 1: $87,480 Opt. 2: $94,478 Opt. 3: $102,037 Opt. 4: $110,200
Option
Subway 1,200 $2.83 $33.99 $40,788 5 yrs. May-14 Apr-195/1/2016 5/1/2017 5/1/2018
3%$42,012 $43,272 $44,568
3 @ 5 yrs. FMV
Option
T-Mobile 1,501 $3.25 $39.00 $58,539 5 yrs. Feb-15 Feb-20 9/1/2017 5% $61,466 2 @ 5 yrs. Option
Available* 3,049 $2.75 $33.00 $100,617
Leased: 7,121 70.02%
Available: 3,049 29.98%
TOTAL: 10,170 100.00% $372,864
Tenant Information
6
Japanese retail conglomerate Seven & I Holdings, which is the holding company for Seven-Eleven Japan, Ito-Yokado, Denny’s restaurants and other businesses. globally, 7-Eleven operates, franchises, or licenses more than 35,900 stores worldwide, more than one-third of which are in Japan.
According to the National Federation, the world’s largest retail trade association, 7-Eleven is #35 on the list of the Nation’s Retail Power Players 2012, up from #40 the year before. 7-Eleven, Inc., is rated “AA-” by Standard & Poor’s.
SUBWAY, a franchise chain owned by Doctor’s Associates, Inc., is a restaurant chain that was founded in 1965 by Fred DeLuca and Dr. Peter Buck. The first restaurant opened in Bridgeport,
Connecticut, uSA on August 28 and was called Pete’s Super Submarines. The first franchised Subway unit opened in 1974 in Wallingford, Connecticut. There are more than 41,140 Subway franchises in 105 countries and territories worldwide. SuBWAY sells made-to-order hot and cold submarine sandwiches, wraps, and salads.
T-Mobile US is one of the largest providers of wireless voice and data communications services in the uS. The company’s 47 million T-Mobile and MetroPCS contract and prepaid consumer
customers use its networks domestically and are able to connect to the compatible network of Deutsche Telekom when in Europe for a total of approximately 230 million worldwide users. It also offers low-cost, nocontract mobile services through the goSmart brand. In addition, T-Mobile sells phones, tablets, PDAs, and accessories from such vendors as Apple, Nokia, and Samsung. It has about 8,000 T-Mobile and MetroPCS branded retail sites. In 2013 Deutsche Telekom acquired smaller rival MetroPCS via a reverse merger and combined it with T-Mobile.
Starbucks Corporation operates as a roaster, marketer, and retailer of specialty coffee worldwide. Its stores offer coffee and tea beverages, packaged roasted whole bean and ground coffees, single
serve products, and juices and bottles water. The company’s stores also provide fresh food offerings; ready-to-drink beverages; and various food products, including pastries, and breakfast sandwiches and lunch items, as well as beverage-making equipment and accessories. In addition, it licenses the rights to produce and distribute Starbucks branded products to The North American Coffee Partnership with the Pepsi-Cola Company, as well as licenses its trademarks through licensed stores, grocery, and national food service accounts. The company offers its products under the Starbucks, Teavana, Tazo, Seattle’s Best Coffee, Starbucks VIA, Starbucks Refreshers, Evolution Fresh, La Boulange, and Verismo brand names. Starbucks is the largest coffeehouse company in the world ahead of uK rival Costa Coffee, with 21,536 stores in 64 countries and territories, including 12,218 in the united States, 1,716 in China, 1,330 in Canada, 1,079 in Japan and 808 in the united Kingdom. Starbucks Corporation was founded in 1985 and is based in Seattle, Washington. Starbucks Corporation’s common stock trades on the NASDAQ global Select Market (“NASDAQ”) under the symbol “SBuX”.
For the quarter ended June 28, 2015, Starbucks Corporation reported revenue of $4.88 billion with net income of $626.6 million and total stockholder equity of $5.857 billion. As of June 10, 2015 market capitalization was $79 billion. Starbucks is rated “A-” by Standard & Poor’s.
7-Eleven, Inc., the major u.S. subsidiary of Seven-Eleven Japan Co., Ltd., is the world’s largest convenience retail chain. Based in Dallas, Texas, the company operates, franchises and licenses 7,600 stores in the
u.S. and Canada. Of the close to 6,500 stores the company operates and franchises in the united States, some 5,200 are franchised. 7-Eleven was taken private in late 2005 by its largest shareholder,
7
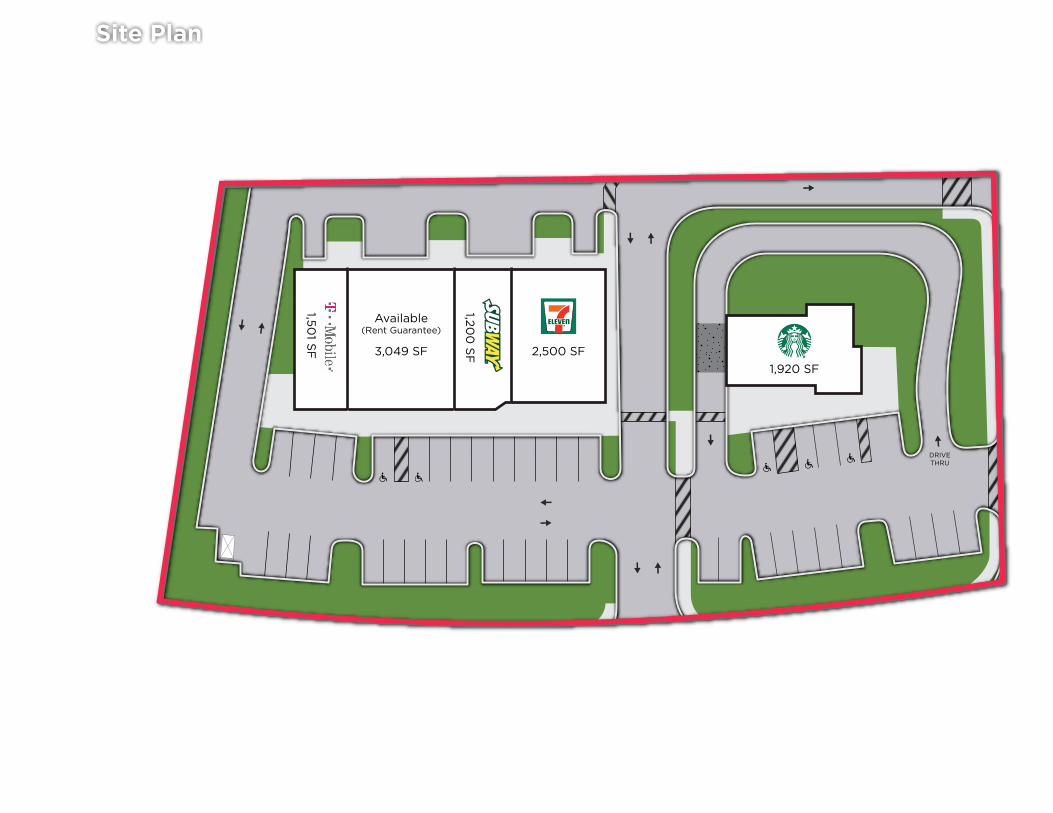
DRIVETHRU
INDUSTRIAL BOULEVARD
1,920 SF2,500 SF3,049 SF
Available(Rent Guarantee)
ONRAMPONRAMP
OFFRAMPOFFRAMP
Site Plan
Industrial Blvd. (17,916 AADT)
Aerial | Close-Up View
ChabotCollegeChabotCollege
SouthgatePark
SouthgatePark
TennysonHigh School
TennysonHigh School
SOUTHLAND MALL
Holy SepulchreCemetery
Hesperian Blvd. W. Tennyson Rd.
Depot Rd.
W. WintonAve.
Hig
hway 92
(100
,00
0 A
ADT)
Industrial Blvd. (17,916 AADT)
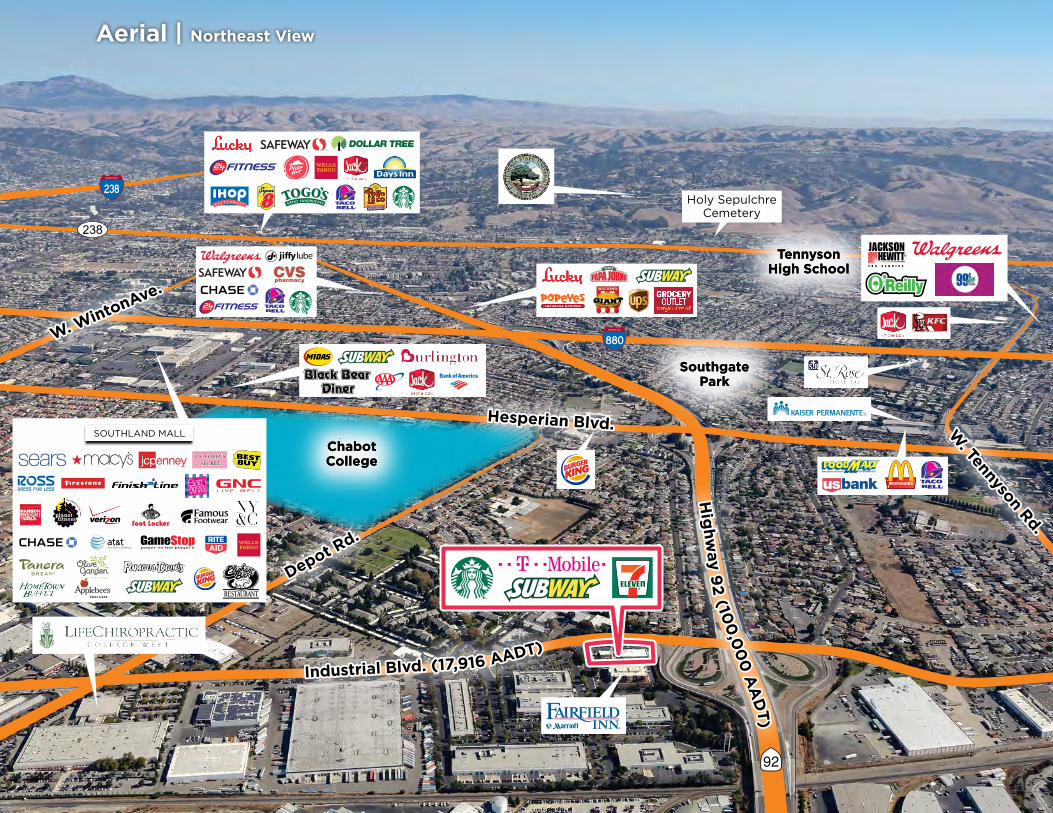
Aerial | Northeast View
SAN FRANCISCOSAN FRANCISCO
San Francisco Bay
OaklandInternational
Airport
OaklandInternational
Airport
San FranciscoInternational
Airport
San FranciscoInternational
Airport
Saint JavaCo�ee House
Hayward Executive AirportAir National Guard BaseWarehouse
Depot Rd.
Clawiter Rd.
Highway 92 (100,000 AADT)
Indu
stria
l Blvd. (1
7,916 AADT)
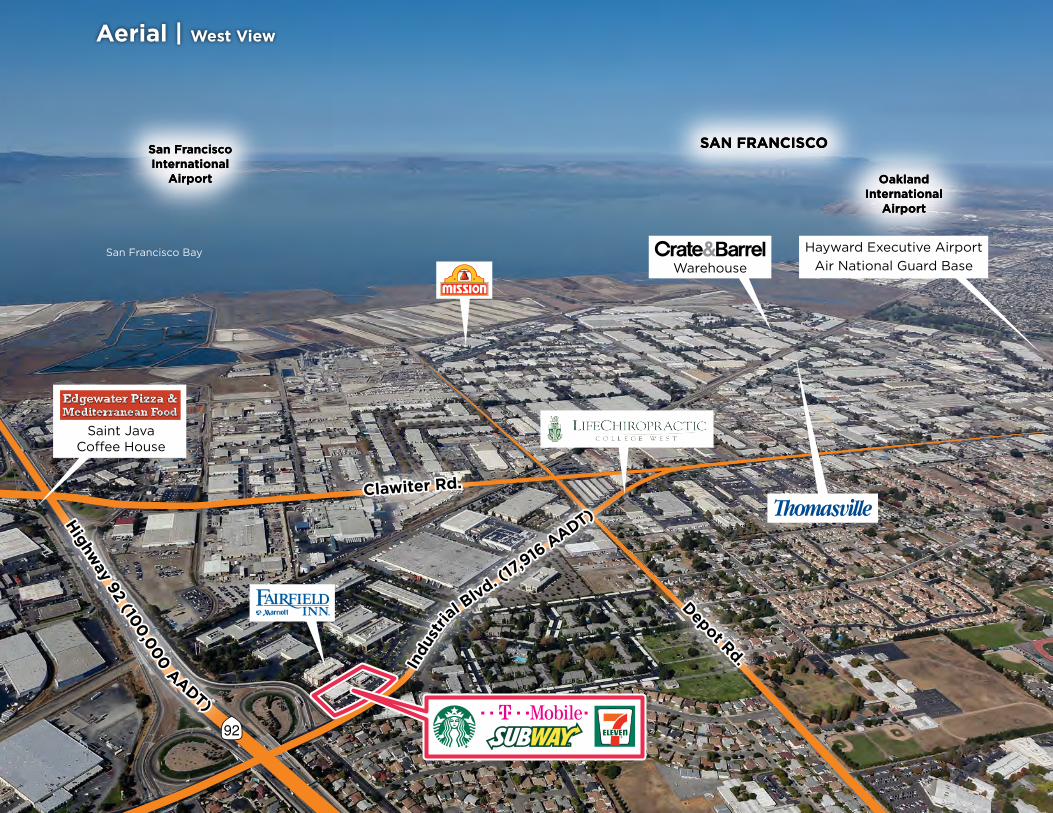
Aerial | West View
ChabotCollegeChabotCollege
UNION CITYUNION CITY
Eden GardensElementary
School
Eden GardensElementary
School
TennysonHigh School
TennysonHigh School
Moreau CatholicHigh School
Moreau CatholicHigh School
Mt. EdenHigh School
Mt. EdenHigh School
Mt. EdenPark
Mt. EdenPark
SouthgatePark
SouthgatePark
Hesperian Blvd.
W. Tennyson Rd.
Depot R
d.
Highway 92 (100,000 AADT)
Indu
stria
l Blvd
. (17,916 A
AD
T)
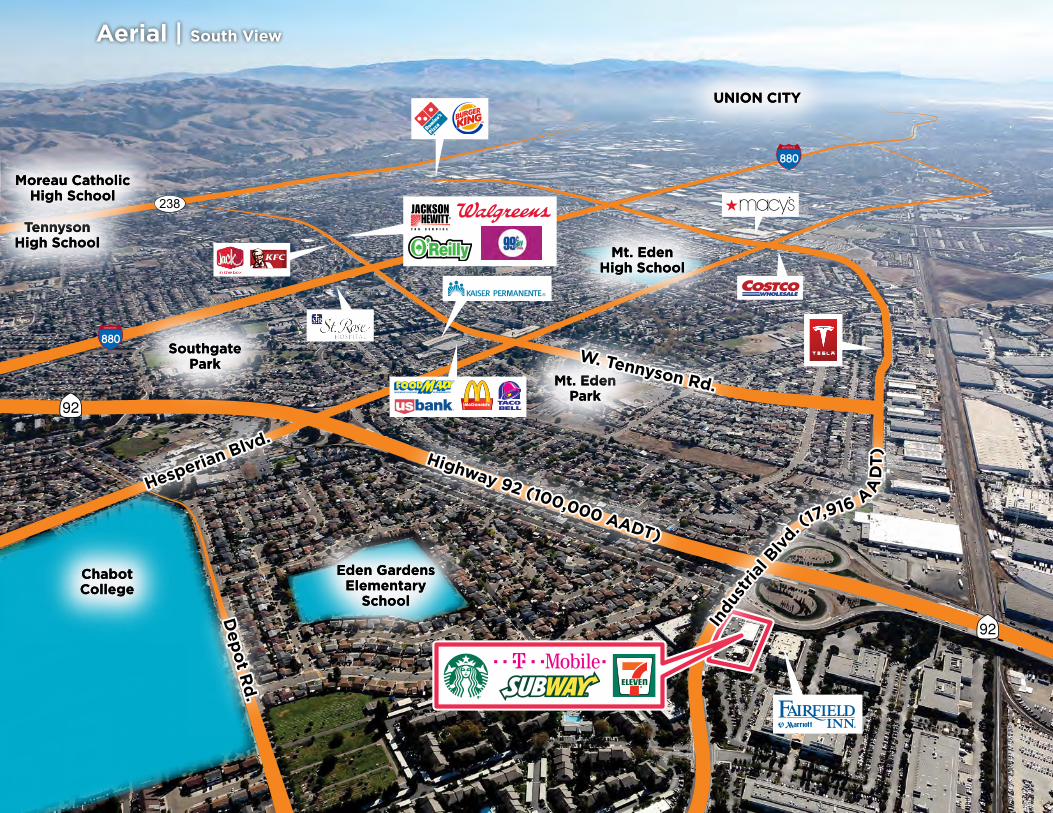
Aerial | South View
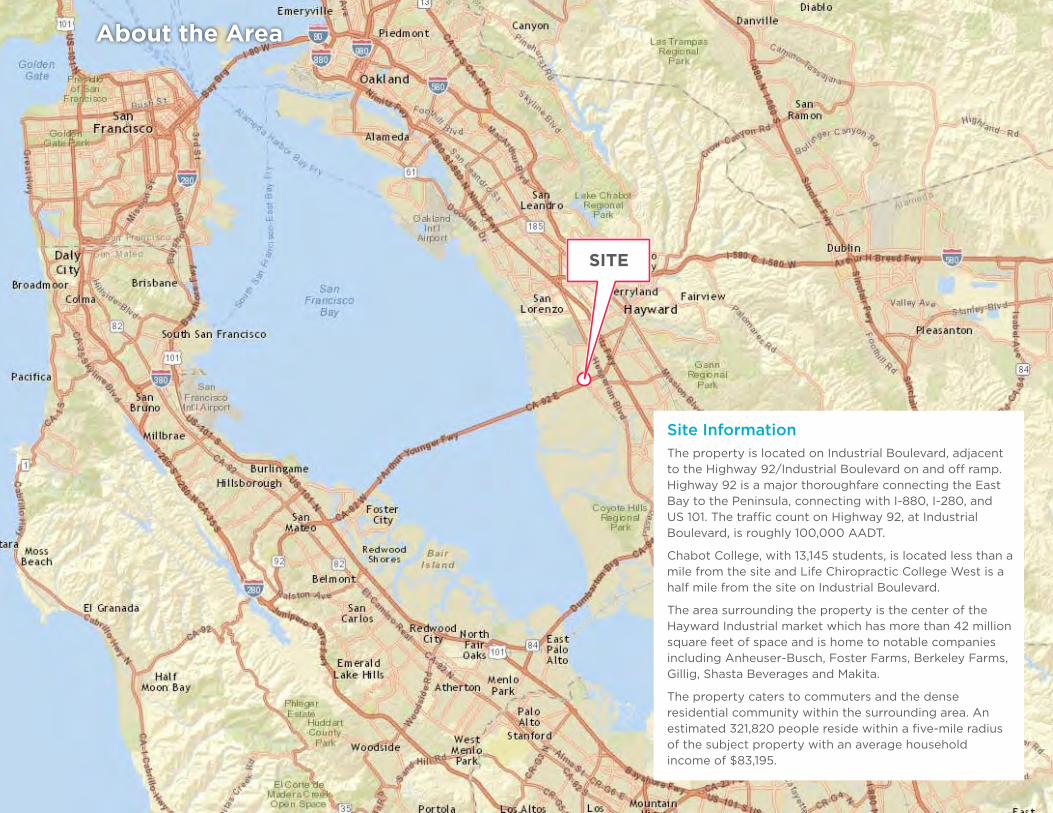
Site InformationThe property is located on Industrial Boulevard, adjacent to the Highway 92/Industrial Boulevard on and off ramp. Highway 92 is a major thoroughfare connecting the East Bay to the Peninsula, connecting with I-880, I-280, and uS 101. The traffic count on Highway 92, at Industrial Boulevard, is roughly 100,000 AADT.
Chabot College, with 13,145 students, is located less than a mile from the site and Life Chiropractic College West is a half mile from the site on Industrial Boulevard.
The area surrounding the property is the center of the Hayward Industrial market which has more than 42 million square feet of space and is home to notable companies including Anheuser-Busch, Foster Farms, Berkeley Farms, gillig, Shasta Beverages and Makita.
The property caters to commuters and the dense residential community within the surrounding area. An estimated 321,820 people reside within a five-mile radius of the subject property with an average household income of $83,195.
About the Area
SITE
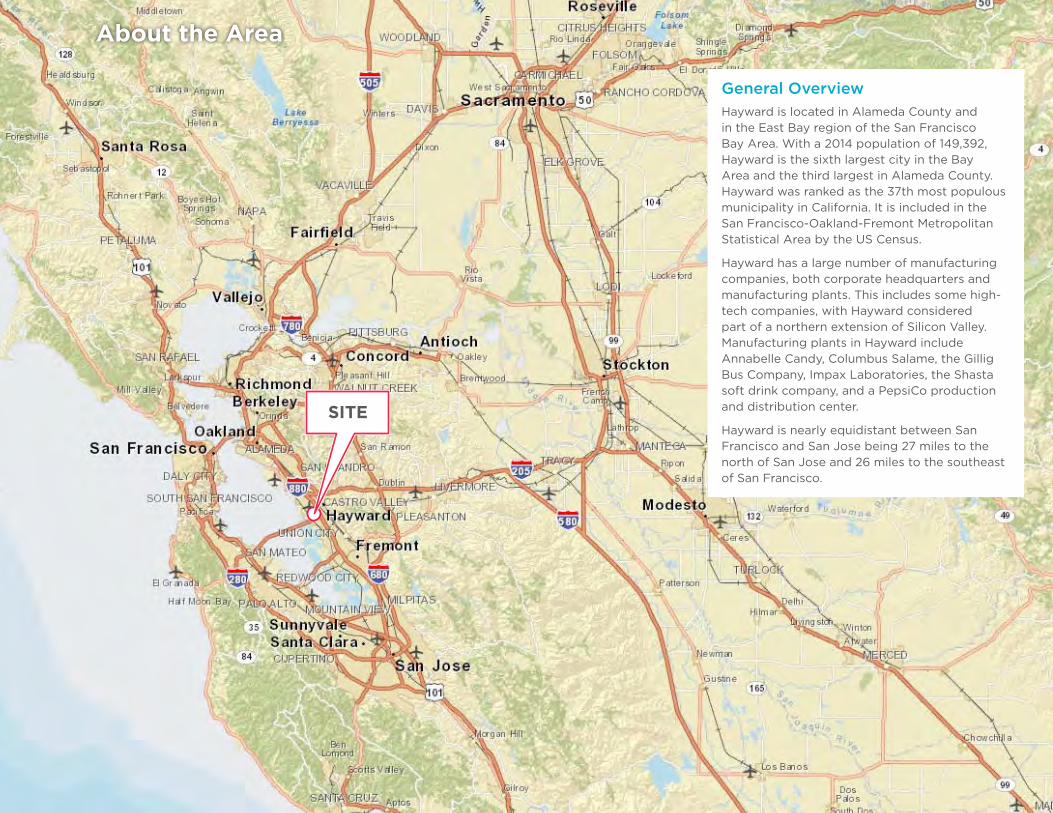
General OverviewHayward is located in Alameda County and in the East Bay region of the San Francisco Bay Area. With a 2014 population of 149,392, Hayward is the sixth largest city in the Bay Area and the third largest in Alameda County. Hayward was ranked as the 37th most populous municipality in California. It is included in the San Francisco-Oakland-Fremont Metropolitan Statistical Area by the uS Census.
Hayward has a large number of manufacturing companies, both corporate headquarters and manufacturing plants. This includes some high-tech companies, with Hayward considered part of a northern extension of Silicon Valley. Manufacturing plants in Hayward include Annabelle Candy, Columbus Salame, the gillig Bus Company, Impax Laboratories, the Shasta soft drink company, and a PepsiCo production and distribution center.
Hayward is nearly equidistant between San Francisco and San Jose being 27 miles to the north of San Jose and 26 miles to the southeast of San Francisco.
About the Area
SITE
14
Demographics
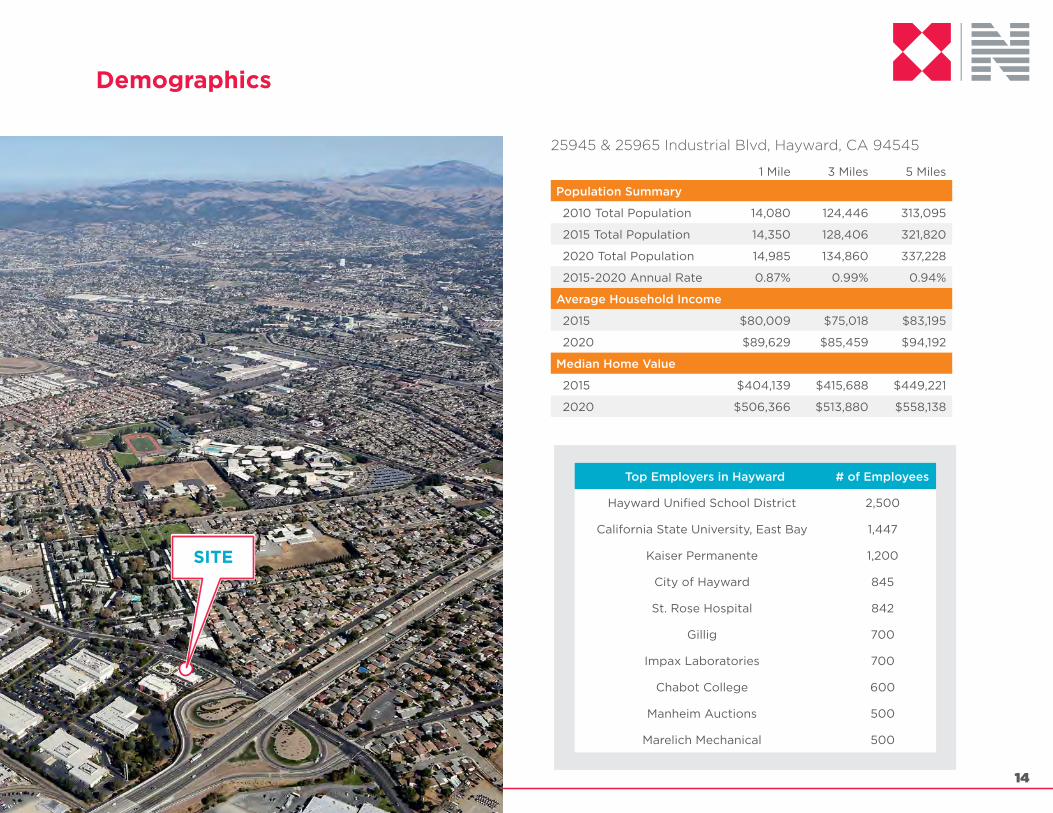
25945 & 25965 Industrial Blvd, Hayward, CA 94545
1 Mile 3 Miles 5 Miles
Population Summary
2010 Total Population 14,080 124,446 313,095
2015 Total Population 14,350 128,406 321,820
2020 Total Population 14,985 134,860 337,228
2015-2020 Annual Rate 0.87% 0.99% 0.94%
Average Household Income
2015 $80,009 $75,018 $83,195
2020 $89,629 $85,459 $94,192
Median Home Value
2015 $404,139 $415,688 $449,221
2020 $506,366 $513,880 $558,138
SITE
Top Employers in Hayward # of Employees
Hayward unified School District 2,500
California State university, East Bay 1,447
Kaiser Permanente 1,200
City of Hayward 845
St. Rose Hospital 842
gillig 700
Impax Laboratories 700
Chabot College 600
Manheim Auctions 500
Marelich Mechanical 500
Vincent AicaleVice President [email protected] RE License #01728696
901 Mariners Island Boulevard, Suite 120San Mateo, CA 94404www.maffiateam.com
Ryan ForsythVice President [email protected] RE License #01716551