Embed Size (px)
Citation preview

ExistingandProjectedConditionsMT 1—ANACONDA TO GEORGETOWN LAKE C P S
August 2011
EXISTING AND PROJECTED CONDITIONS
AUGUST 2011
i
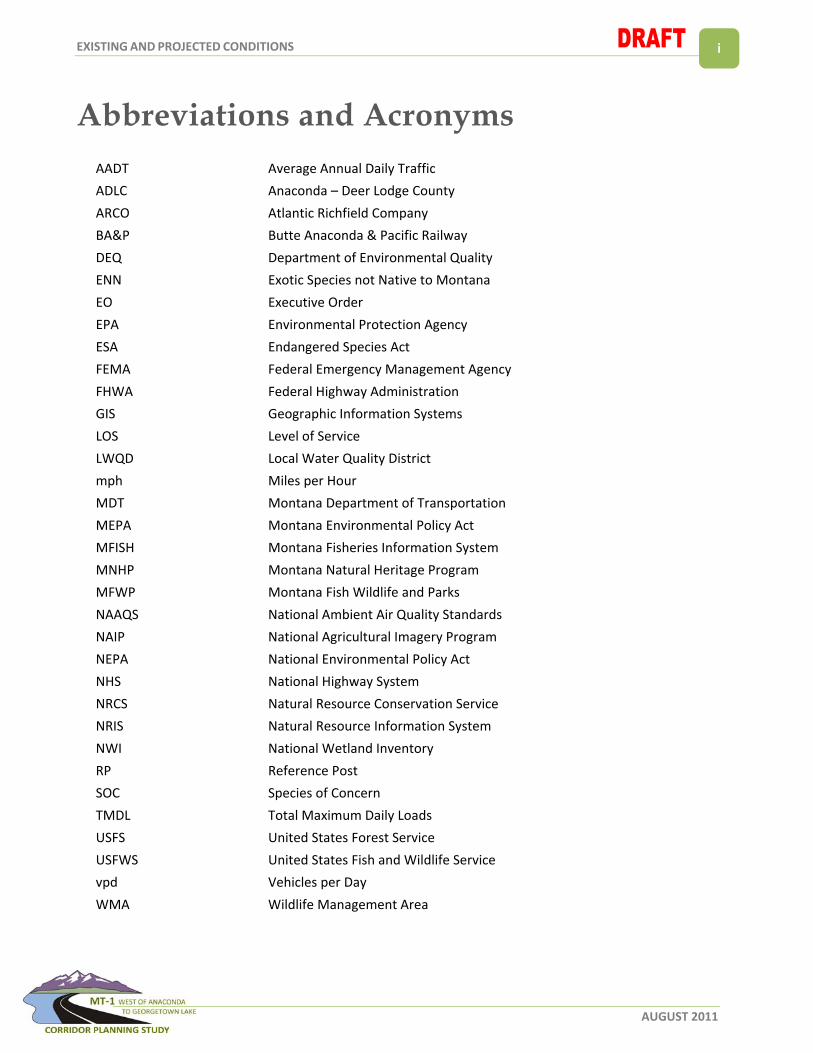
Abbreviations and Acronyms AADT Average Annual Daily Traffic
ADLC Anaconda – Deer Lodge County
ARCO Atlantic Richfield Company
BA&P Butte Anaconda & Pacific Railway
DEQ Department of Environmental Quality
ENN Exotic Species not Native to Montana
EO Executive Order
EPA Environmental Protection Agency
ESA Endangered Species Act
FEMA Federal Emergency Management Agency
FHWA Federal Highway Administration
GIS Geographic Information Systems
LOS Level of Service
LWQD Local Water Quality District
mph Miles per Hour
MDT Montana Department of Transportation
MEPA Montana Environmental Policy Act
MFISH Montana Fisheries Information System
MNHP Montana Natural Heritage Program
MFWP Montana Fish Wildlife and Parks
NAAQS National Ambient Air Quality Standards
NAIP National Agricultural Imagery Program
NEPA National Environmental Policy Act
NHS National Highway System
NRCS Natural Resource Conservation Service
NRIS Natural Resource Information System
NWI National Wetland Inventory
RP Reference Post
SOC Species of Concern
TMDL Total Maximum Daily Loads
USFS United States Forest Service
USFWS United States Fish and Wildlife Service
vpd Vehicles per Day
WMA Wildlife Management Area

EXISTING AND PROJECTED CONDITIONS
AUGUST 2011
ii
Table of Contents
AbbreviationsandAcronyms................................................................................................................................i
TableofContents......................................................................................................................................................ii
ListofTables..............................................................................................................................................................iii
ListofFigures............................................................................................................................................................iv
1.0ExistingandProjectedConditions.............................................................................................................1
1.1 INTRODUCTION ........................................................................................................................................ 1
1.2 AREA DESCRIPTION AND DEMOGRAPHICS ...................................................................................................... 2
1.3 PHYSICAL CHARACTERISTICS ........................................................................................................................ 3
1.4 ROADWAY USERS AND TRAFFIC VOLUMES ..................................................................................................... 5
1.4.1 Traffic Data ................................................................................................................................. 5 1.4.2 Future Traffic Projections ........................................................................................................... 6 1.4.3 Speed Data Collection ................................................................................................................ 6 1.4.4 Level of Service ........................................................................................................................... 7
1.5 RIGHT‐OF‐WAY ........................................................................................................................................ 8
1.6 DESIGN STANDARDS .................................................................................................................................. 9
1.7 ROADWAY GEOMETRICS .......................................................................................................................... 11
1.7.1 Horizontal Alignment ............................................................................................................... 11 1.7.2 Vertical Alignment .................................................................................................................... 12 1.7.3 Roadside Clear Zones ............................................................................................................... 14
1.8 SURFACING ............................................................................................................................................ 15
1.9 ACCESS POINTS ...................................................................................................................................... 15
1.10 TURN LANES ........................................................................................................................................ 16
1.11 HYDRAULICS ........................................................................................................................................ 16
1.11.1 Drainages ................................................................................................................................ 16 1.11.2 Structures ............................................................................................................................... 16 1.11.3 Bridge Crossings ..................................................................................................................... 17
1.12 CRASH ANALYSIS .................................................................................................................................. 19
1.13 TRANSPORTATION SERVICES .................................................................................................................... 20
1.14 UTILITIES ............................................................................................................................................. 21
2.0LocalPlanning..................................................................................................................................................22
2.1 GROWTH POLICY .................................................................................................................................... 22
2.2 TRAILS MASTER PLAN .............................................................................................................................. 22
2.3 WATER / WASTEWATER SYSTEM ............................................................................................................... 23
3.0EnvironmentalScan.......................................................................................................................................24
3.1 GEOGRAPHIC SETTING ............................................................................................................................. 24
3.2 LAND OWNERSHIP .................................................................................................................................. 24
EXISTING AND PROJECTED CONDITIONS
AUGUST 2011
iii
3.2.1 Montana Fish, Wildlife & Parks Wildlife Management Areas .................................................. 24 3.2.2 Montana Fish, Wildlife & Parks Fishing Access Sites (FASs) ..................................................... 25
3.3 CULTURAL AND ARCHAEOLOGICAL RESOURCES ............................................................................................. 25
3.4 SOIL RESOURCES AND PRIME FARMLAND .................................................................................................... 25
3.5 VEGETATION .......................................................................................................................................... 26
3.6 WILDLIFE .............................................................................................................................................. 26
3.7 AMPHIBIANS AND REPTILES ...................................................................................................................... 27
3.8 BIRDS ................................................................................................................................................... 27
3.9 AQUATIC RESOURCES .............................................................................................................................. 27
3.9.1 Fisheries ................................................................................................................................... 27
3.10 THREATENED AND ENDANGERED SPECIES .................................................................................................. 28
3.11 SPECIES OF CONCERN ............................................................................................................................ 28
3.12 WILDLIFE AND TRAFFIC CONFLICTS ........................................................................................................... 30
3.13 WATER RESOURCES AND FISHERIES .......................................................................................................... 30
3.14 WATER QUALITY .................................................................................................................................. 31
3.15 GROUNDWATER AND IRRIGATION ............................................................................................................ 31
3.16 WETLANDS .......................................................................................................................................... 31
3.17 FLOOD PLAINS AND FLOODWAYS ............................................................................................................. 32
3.18 AIR QUALITY ........................................................................................................................................ 32
3.19 TRAFFIC NOISE ..................................................................................................................................... 32
3.20 HAZARDOUS SUBSTANCES ...................................................................................................................... 33
4.0AreasofConcernSummary........................................................................................................................34
4.1 GEOMETRICS ......................................................................................................................................... 34
4.2 SPEEDS ................................................................................................................................................. 35
4.3 ACCESS DENSITY ..................................................................................................................................... 36
4.4 WILDLIFE CONNECTIVITY AND WILDLIFE‐VEHICLE COLLISIONS ......................................................................... 36
4.5 ALTERNATIVE USE FACILITIES .................................................................................................................... 36
4.6 LOCAL INFRASTRUCTURE EXPANSION .......................................................................................................... 37
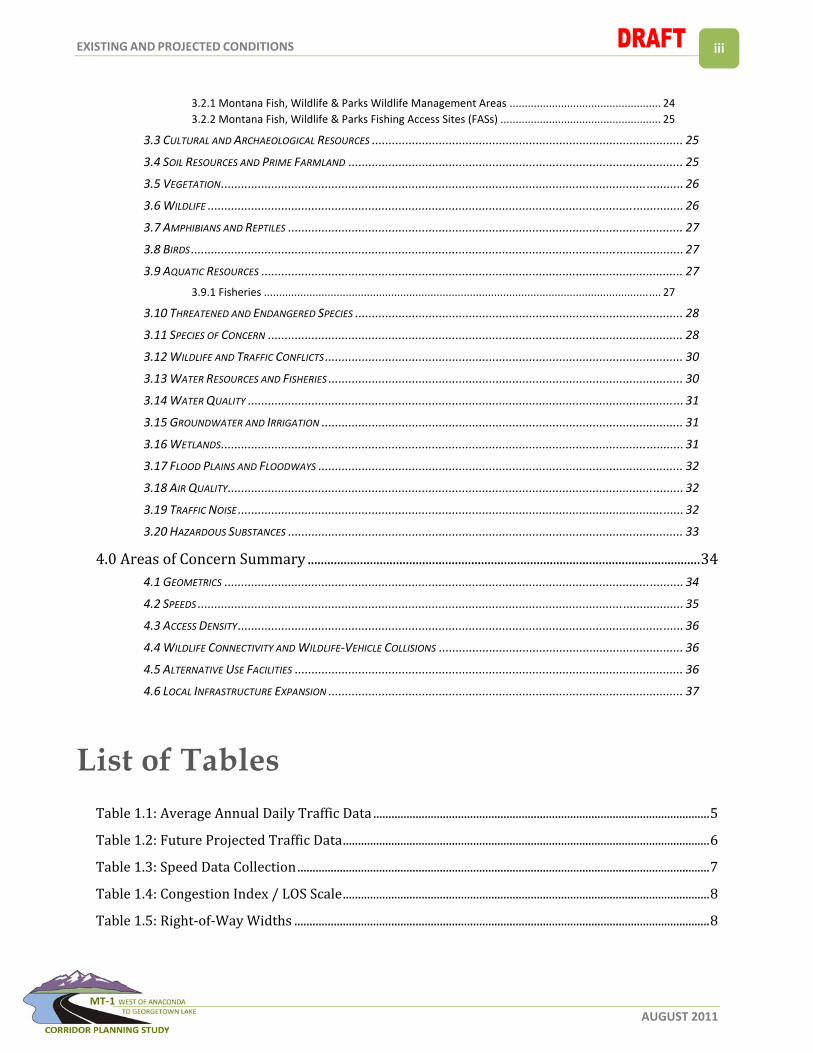
List of Tables Table1.1:AverageAnnualDailyTrafficData...............................................................................................................5
Table1.2:FutureProjectedTrafficData.........................................................................................................................6
Table1.3:SpeedDataCollection........................................................................................................................................7
Table1.4:CongestionIndex/LOSScale.........................................................................................................................8
Table1.5:Right‐of‐WayWidths.........................................................................................................................................8

EXISTING AND PROJECTED CONDITIONS
AUGUST 2011
iv
Table1.6:GeometricDesignCriteria............................................................................................................................10
Table1.7:HorizontalCurves............................................................................................................................................11
Table1.8:VerticalCurves..................................................................................................................................................12
Table1.9:RoadsideClearZones......................................................................................................................................14
Table1.10:ExistingRoadwaySurfacing......................................................................................................................15
Table1.11:AccessPoints...................................................................................................................................................16
Table1.12:ExistingHydraulicStructures...................................................................................................................17
Table1.13:BridgeSufficiencyRating(SR).................................................................................................................19
Table3.1:ThreatenedandEndangeredSpecies.......................................................................................................28
Table3.2:SpeciesofSpecialConcern...........................................................................................................................29
Table4.1:AreasofConcern...............................................................................................................................................34
Table4.2:SpeedData...........................................................................................................................................................35
List of Figures Figure1.1:StudyAreaBoundary.......................................................................................................................................2
Figure1.2:PostedSpeedLimits.........................................................................................................................................4
Figure4.1:GeometricAreasofConcern......................................................................................................................37

E X I S T I NG AND P RO J E C T ED COND I T I ON S
AUGUST 2011
1
1.0 Existing and Projected Conditions
1.1 INTRODUCTION
This report documents the existing and projected roadway conditions and environmental factors for
Montana Highway 1 (MT‐1) between Anaconda and Georgetown Lake in Deer Lodge County. The
purpose of this report is to portray the existing and projected conditions throughout the corridor
utilizing technical and environmental factors such that known issues and/or areas of concern may be
identified via a high‐level of planning analysis.
MT‐1 is functionally classified as a Rural Minor Arterial on the Primary Highway System and is designated
as Primary Route 19 (P‐19). MT‐1 serves as an east‐west corridor between Anaconda and the eastern
shore of Georgetown Lake.
The study area consists of 17.29 miles along MT‐1 beginning at the Linden Street / North Cable Road
intersection (Reference Post (RP) 10.06) and ending at the intersection with Georgetown Lake Road (RP
27.35). The study area boundary includes a one mile buffer on each side of MT‐1 from RP 10.06 to RP
14.50 and a 0.5 mile buffer on each side from RP 14.50 to RP 27.35. The study area boundary is shown
in Figure 1.
The information provided herein is the product of a high‐level baseline scan. This general information
may be used to guide future “project level” analysis if projects are forwarded from this study.

E X I S T I NG AND P RO J E C T ED COND I T I ON S
AUGUST 2011
2
Figure 1.1: Study Area Boundary
1.2 AREA DESCRIPTION AND DEMOGRAPHICS
Anaconda – Deer Lodge County (ADLC) is one of two consolidated City‐County local governments in
Montana. The core of Deer Lodge County’s population is located in the original town site of Anaconda,
established in 1883 by one of the famous Montana copper barons, Marcus Daly.1 Deer Lodge County is
located in the southwest part of the state and shares borders with Powell, Jefferson, Butte‐Silver Bow,
Beaverhead, Granite and Ravalli Counties. Deer Lodge County encompasses 741 square miles. At 5,280
feet, Anaconda, the county seat, is one of the nations “Mile‐High” cities. The Beaverhead – Deer Lodge
National Forest and the Anaconda – Pintler Wilderness Area encompass a large portion of the county
area. Georgetown Lake, Silver Lake, the Big Hole River and Warm Springs Creek are major water
features in the County. The city of Butte is the nearest urban center and is located about 27 miles
south‐east of Anaconda.
1 Anaconda Deer Lodge County Growth Policy – Public Hearing Draft – 2010, Local Services Section
E X I S T I NG AND P RO J E C T ED COND I T I ON S
AUGUST 2011
3
The major transportation route in the county is Interstate 90 (I‐90), which runs along the county’s
eastern boundary. I‐90 is a major east‐west travel corridor through the state, but in Deer Lodge County,
it is aligned in a north‐south direction. MT‐1, which runs east‐west through Anaconda, is another major
travel corridor in the area. MT‐1 was designated as the Pintler Veterans’ Memorial Scenic Highway by
the 2011 Montana Legislature.
Deer Lodge County is the smallest county in land area and ranks 22nd in population out of the 56
counties in Montana. The total population of the county was estimated in 2010 at 9,2982, which is a
1.3% drop in population from the 2000 Census total population of 9,415 people. The county has an
average of 12.6 persons per square mile compared to the State average of 6.8 persons per square mile.
Most of the population is concentrated in the Anaconda urban area. Population in the county has
historically been linked to the level of operation of the copper smelter run by the Anaconda Mining
Company. The county population peak occurred in 1960 at 18,640 people and since the smelter closed
in 1980, the county has seen a steady decline in population. From 1970 to 2010 the county population
has declined over 40%. According to the 2010 census, population in the county is concentrated around
Anaconda and smaller pockets of population occur at Galen, Warm Springs, Georgetown Lake and the
West Valley area.3
The County population is projected to continue to decline through the year 2025. Population
projections estimate approximately 7,860 people for the year 20304. Future population projections are
generally based on existing and historic trends. Changes in trends due to economic development,
changes in the economy, or other factors can result in a change in population trends.
The median household income in 2009 for the county was $32,173 compared to the state median
household income of $42,222 and the nation’s median household income of $50,221.
1.3 PHYSICAL CHARACTERISTICS
MT‐1 runs east/west between I‐90 and Philipsburg. MT‐1 then runs north/south to connect back with I‐
90 at Drummond. I‐15 runs north/south and connects to I‐90 approximately 10 miles east of the MT‐1 /
I‐90 junction. MT‐1 provides users of these interstates access to Anaconda and the surrounding area.
At the east end of the corridor (RP 10.06), MT‐1 transitions from the four‐lane roadway that traverses
through Anaconda, to a two‐lane roadway section that travels the length of the study area. The
roadway expands to three lanes between RP 19 and RP 20.2 to provide a passing lane for westbound
traffic. The corridor passes through the West Valley area, through areas of Beaverhead‐Deer Lodge
National Forest and past Silver Lake where the corridor curves slightly north and travels along
Georgetown Lake. The study area ends at the intersection with Georgetown Lake Road (RP 27.35).
2 US Census Bureau http://quickfacts.census.gov/qfd/states/30/30023.html 3 Anaconda Deer Lodge County Growth Policy – Public Hearing Draft – 2010, Population Economy Section 4 Montana Census and Economic Information Center, Dept. of Commerce & NPA Data Services
E X I S T I NG AND P RO J E C T ED COND I T I ON S
AUGUST 2011
4
Sections of the roadway were constructed or improved at various times, as early as 1934 and as recently
as 1995. Pavement preservation projects have been completed as recently as 2008.
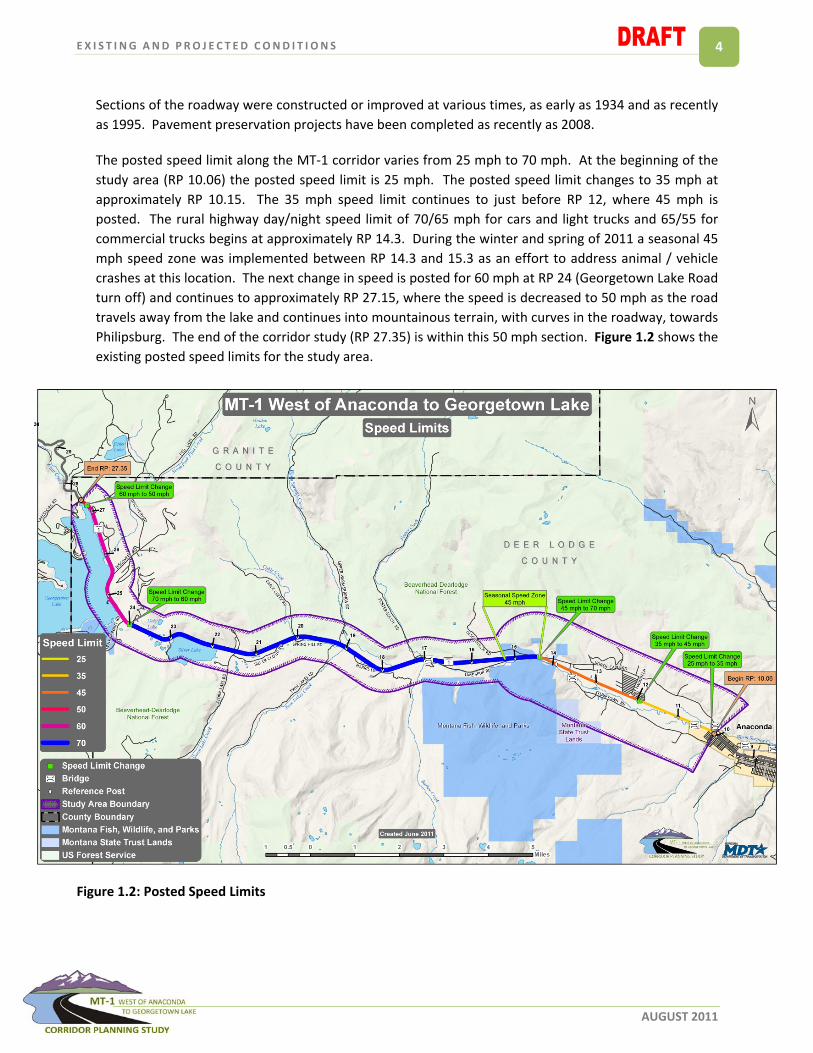
The posted speed limit along the MT‐1 corridor varies from 25 mph to 70 mph. At the beginning of the
study area (RP 10.06) the posted speed limit is 25 mph. The posted speed limit changes to 35 mph at
approximately RP 10.15. The 35 mph speed limit continues to just before RP 12, where 45 mph is
posted. The rural highway day/night speed limit of 70/65 mph for cars and light trucks and 65/55 for
commercial trucks begins at approximately RP 14.3. During the winter and spring of 2011 a seasonal 45
mph speed zone was implemented between RP 14.3 and 15.3 as an effort to address animal / vehicle
crashes at this location. The next change in speed is posted for 60 mph at RP 24 (Georgetown Lake Road
turn off) and continues to approximately RP 27.15, where the speed is decreased to 50 mph as the road
travels away from the lake and continues into mountainous terrain, with curves in the roadway, towards
Philipsburg. The end of the corridor study (RP 27.35) is within this 50 mph section. Figure 1.2 shows the
existing posted speed limits for the study area.
Figure 1.2: Posted Speed Limits
E X I S T I NG AND P RO J E C T ED COND I T I ON S
AUGUST 2011
5
1.4 ROADWAY USERS AND TRAFFIC VOLUMES
Primary users of the roadway consist of local residents from the community of Anaconda at the eastern
end of the corridor and commercial users. The road is used by local land owners for access to their
property throughout the corridor and for recreational users accessing United States Forest Service
(USFS) lands, other recreational opportunities along the corridor, and Georgetown Lake.
1.4.1 Traffic Data
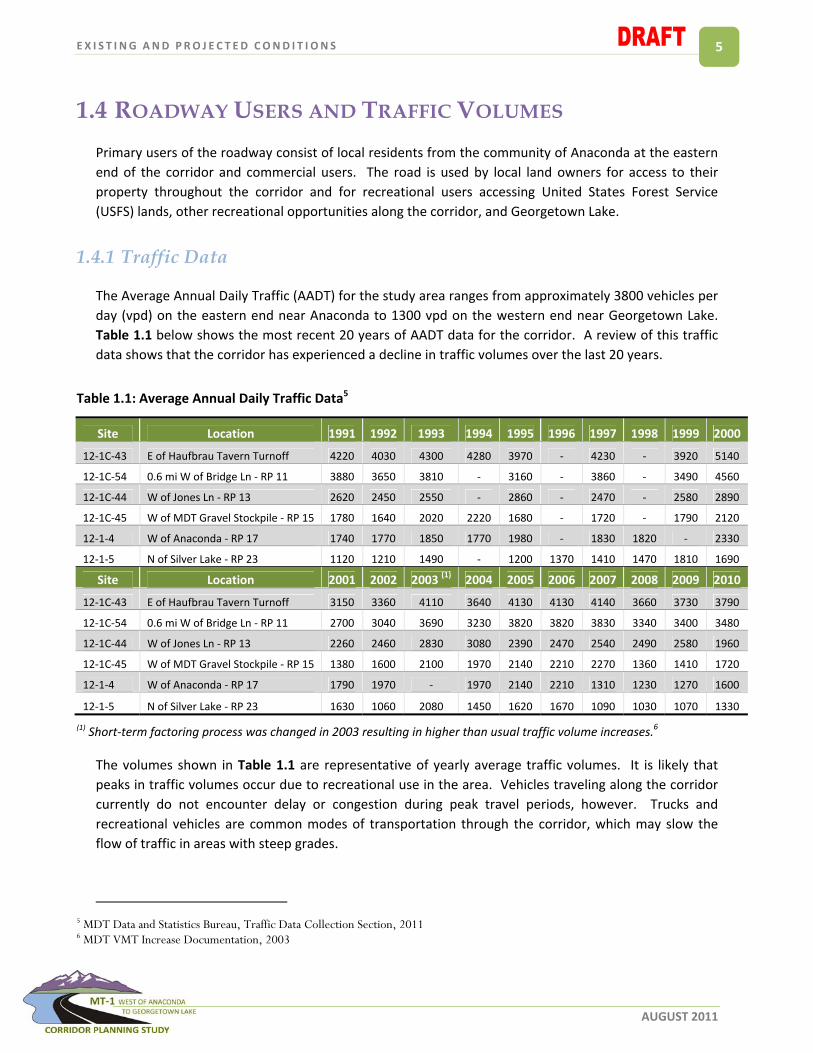
The Average Annual Daily Traffic (AADT) for the study area ranges from approximately 3800 vehicles per
day (vpd) on the eastern end near Anaconda to 1300 vpd on the western end near Georgetown Lake.
Table 1.1 below shows the most recent 20 years of AADT data for the corridor. A review of this traffic
data shows that the corridor has experienced a decline in traffic volumes over the last 20 years.
Table 1.1: Average Annual Daily Traffic Data5
Site Location 1991 1992 1993 1994 1995 1996 1997 1998 1999 2000
12‐1C‐43 E of Haufbrau Tavern Turnoff 4220 4030 4300 4280 3970 ‐ 4230 ‐ 3920 5140
12‐1C‐54 0.6 mi W of Bridge Ln ‐ RP 11 3880 3650 3810 ‐ 3160 ‐ 3860 ‐ 3490 4560
12‐1C‐44 W of Jones Ln ‐ RP 13 2620 2450 2550 ‐ 2860 ‐ 2470 ‐ 2580 2890
12‐1C‐45 W of MDT Gravel Stockpile ‐ RP 15 1780 1640 2020 2220 1680 ‐ 1720 ‐ 1790 2120
12‐1‐4 W of Anaconda ‐ RP 17 1740 1770 1850 1770 1980 ‐ 1830 1820 ‐ 2330
12‐1‐5 N of Silver Lake ‐ RP 23 1120 1210 1490 ‐ 1200 1370 1410 1470 1810 1690
Site Location 2001 2002 2003 (1) 2004 2005 2006 2007 2008 2009 2010
12‐1C‐43 E of Haufbrau Tavern Turnoff 3150 3360 4110 3640 4130 4130 4140 3660 3730 3790
12‐1C‐54 0.6 mi W of Bridge Ln ‐ RP 11 2700 3040 3690 3230 3820 3820 3830 3340 3400 3480
12‐1C‐44 W of Jones Ln ‐ RP 13 2260 2460 2830 3080 2390 2470 2540 2490 2580 1960
12‐1C‐45 W of MDT Gravel Stockpile ‐ RP 15 1380 1600 2100 1970 2140 2210 2270 1360 1410 1720
12‐1‐4 W of Anaconda ‐ RP 17 1790 1970 ‐ 1970 2140 2210 1310 1230 1270 1600
12‐1‐5 N of Silver Lake ‐ RP 23 1630 1060 2080 1450 1620 1670 1090 1030 1070 1330
(1) Short‐term factoring process was changed in 2003 resulting in higher than usual traffic volume increases.6
The volumes shown in Table 1.1 are representative of yearly average traffic volumes. It is likely that
peaks in traffic volumes occur due to recreational use in the area. Vehicles traveling along the corridor
currently do not encounter delay or congestion during peak travel periods, however. Trucks and
recreational vehicles are common modes of transportation through the corridor, which may slow the
flow of traffic in areas with steep grades.
5 MDT Data and Statistics Bureau, Traffic Data Collection Section, 2011 6 MDT VMT Increase Documentation, 2003

E X I S T I NG AND P RO J E C T ED COND I T I ON S
AUGUST 2011
6
1.4.2 Future Traffic Projections
It is difficult to estimate future growth based on historical traffic counts due to recent economic
conditions and other influences in Deer Lodge County. Historic traffic data shows a general increase in
volumes between 1991 and 2000; however, a sharp decline occurred between 2000 and 2005. Based on
the historical traffic data, and on expected conditions in the county, an assumed traffic growth rate of
1.0% for the corridor was utilized for planning purposes. Table 1.2 shows future projected traffic values
based on the assumed growth rate.
Table 1.2: Future Projected Traffic Data
Site Location 2010 2030 (1)
12‐1C‐43 E of Haufbrau Tavern Turnoff 3790 4625
12‐1C‐54 0.6 mi W of Bridge Ln ‐ RP 11 3480 4246
12‐1C‐44 W of Jones Ln ‐ RP 13 1960 2392
12‐1C‐45 W of MDT Gravel Stockpile ‐ RP 15 1720 2099
12‐1‐4 W of Anaconda ‐ RP 17 1600 1952
12‐1‐5 N of Silver Lake ‐ RP 23 1330 1623
(1) Projection was based on an annual growth rate of 1.0%.
1.4.3 Speed Data Collection
Speed data was collected at four locations along MT‐1 in June 2011. The speed data was collected to
help determine the effectiveness of existing posted speed limits. Posted speed limits are based on a
number of factors including speed data, Montana Code, roadside development, functional classification,
crash experience, road surfacing, and context. The effort completed as part of this Corridor Planning
Study only addresses the speed data factor.
Table 1.3 shows the results from the speed data collection. The primary speed data factor for
determining the validity of the posted speed limit is the 85th percentile speed. The 85th percentile speed
is the speed at which 85 percent of vehicles travel at or below. For example, if the 85th percentile speed
is 45 mph, it means 85 percent of vehicles are traveling at or below 45 mph. It is generally
recommended that the posted speed limit be within 5 mph of the 85th percentile speed.
E X I S T I NG AND P RO J E C T ED COND I T I ON S
AUGUST 2011
7
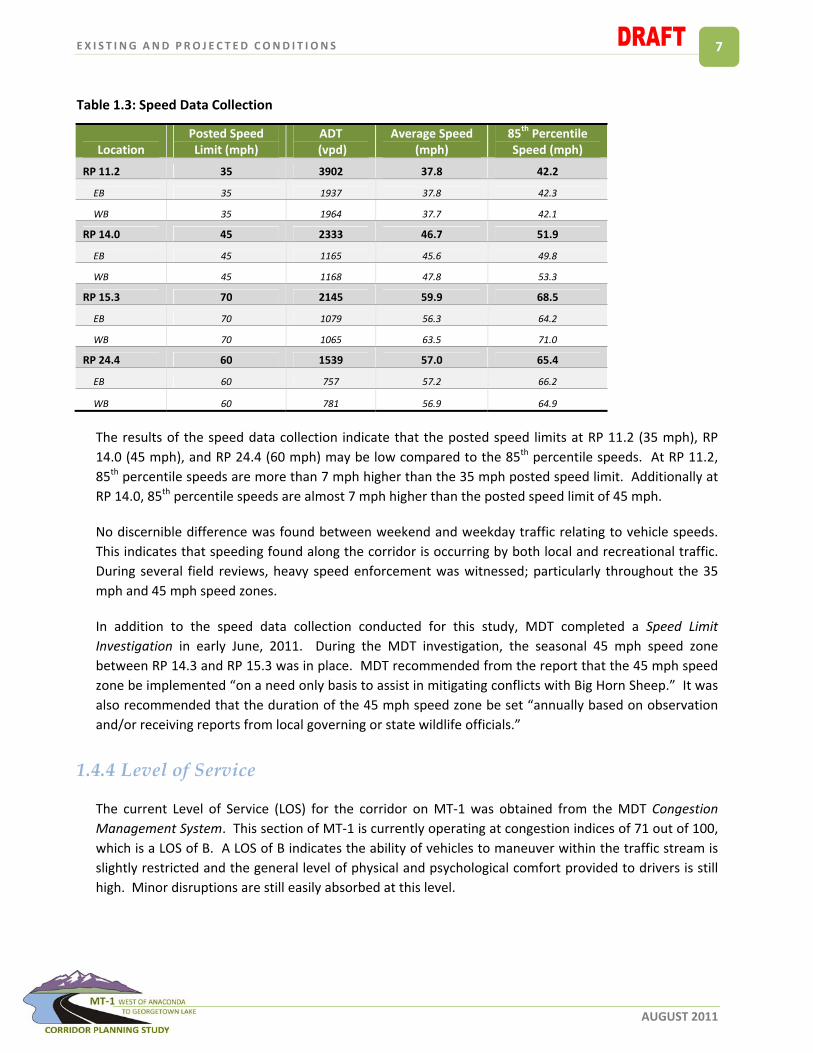
Table 1.3: Speed Data Collection
Location Posted Speed Limit (mph)
ADT (vpd)
Average Speed(mph)
85th Percentile Speed (mph)
RP 11.2 35 3902 37.8 42.2
EB 35 1937 37.8 42.3
WB 35 1964 37.7 42.1
RP 14.0 45 2333 46.7 51.9
EB 45 1165 45.6 49.8
WB 45 1168 47.8 53.3
RP 15.3 70 2145 59.9 68.5
EB 70 1079 56.3 64.2
WB 70 1065 63.5 71.0
RP 24.4 60 1539 57.0 65.4
EB 60 757 57.2 66.2
WB 60 781 56.9 64.9
The results of the speed data collection indicate that the posted speed limits at RP 11.2 (35 mph), RP
14.0 (45 mph), and RP 24.4 (60 mph) may be low compared to the 85th percentile speeds. At RP 11.2,
85th percentile speeds are more than 7 mph higher than the 35 mph posted speed limit. Additionally at
RP 14.0, 85th percentile speeds are almost 7 mph higher than the posted speed limit of 45 mph.
No discernible difference was found between weekend and weekday traffic relating to vehicle speeds.
This indicates that speeding found along the corridor is occurring by both local and recreational traffic.
During several field reviews, heavy speed enforcement was witnessed; particularly throughout the 35
mph and 45 mph speed zones.
In addition to the speed data collection conducted for this study, MDT completed a Speed Limit
Investigation in early June, 2011. During the MDT investigation, the seasonal 45 mph speed zone
between RP 14.3 and RP 15.3 was in place. MDT recommended from the report that the 45 mph speed
zone be implemented “on a need only basis to assist in mitigating conflicts with Big Horn Sheep.” It was
also recommended that the duration of the 45 mph speed zone be set “annually based on observation
and/or receiving reports from local governing or state wildlife officials.”
1.4.4 Level of Service
The current Level of Service (LOS) for the corridor on MT‐1 was obtained from the MDT Congestion
Management System. This section of MT‐1 is currently operating at congestion indices of 71 out of 100,
which is a LOS of B. A LOS of B indicates the ability of vehicles to maneuver within the traffic stream is
slightly restricted and the general level of physical and psychological comfort provided to drivers is still
high. Minor disruptions are still easily absorbed at this level.

E X I S T I NG AND P RO J E C T ED COND I T I ON S
AUGUST 2011
8
A LOS of B indicates that the corridor does not currently experience delays or congestion during peak
travel periods. However, the LOS is forecasted to degrade to a C in five years and remain there for the
projected 20 years if improvements are not implemented in the corridor. Table 1.4 shows the various
congestion indices and their corresponding LOS.
Table 1.4: Congestion Index / LOS Scale
Congestion Index Range LOS
85 ‐ 100 A
70 ‐ 84 B
55 ‐ 69 C
40 ‐ 54 D
25 ‐ 39 E
0 ‐ 24 F
1.5 RIGHT-OF-WAY
The existing road is located adjacent to a mixture of private and public lands, including land belonging to
the USFS and also to Montana Fish Wildlife and Parks (MFWP). Right‐of‐way widths vary along the
corridor from 275 feet to as little as 80 feet. Table 1.5 gives the right‐of‐way widths for the study area
along with the adjacent land ownership information.
Table 1.5: Right‐of‐Way Widths
Begin RP End RP R/W Width (approx.) Adjacent Ownership
10.06 14.51 200' Private
14.51 16.42 160' Private and Public
16.42 17.06 180' Private
17.06 19.23 160' Private
19.23 21.16 180' Public
21.16 24.94 160' TO 275' Private and Public
24.94 27.35 80' TO 240' Public
MDT has recently acquired approximately four miles of railroad right‐of‐way property, which runs
parallel to MT‐1 from just west of North Cable Road (RP 10.06) to the Quarry (approximately RP 14.0).
The acquisition of this additional right‐of‐way increases the potential improvement options, and may
increase opportunities to improve safety through access control. The values shown in Table 1.5 include
the recently acquired right‐of‐way.

E X I S T I NG AND P RO J E C T ED COND I T I ON S
AUGUST 2011
9
1.6 DESIGN STANDARDS
The MDT Road Design Manual specifies general design principles and controls which determine the
overall operational characteristics of the roadway and enhance the aesthetic appearance of the
roadway. The geometric design criteria for the MT‐1 Corridor Planning Study are based on the current
MDT design criteria for a Non‐National Highway System (NHS) Rural Minor Arterial. A Rural Minor
Arterial road system links communities and provides service to corridors with trip lengths and travel
density greater than those predominantly served by rural collector or local systems. Table 1.6 lists the
current design standards for Rural Minor Arterials according to MDT design criteria.
The design speed for a Rural Minor Arterial roadway ranges between 45 mph and 60 mph depending on
terrain. MDT’s Road Design Manual contains the following definitions for each terrain type:
Level Terrain – The available stopping sight distances are generally long or can be made to be
so without construction difficulty or major expense.
Rolling Terrain – The natural slopes consistently fall below and rise above the roadway and
occasional steep slopes offer some restriction to horizontal and vertical alignment.
Mountainous Terrain – Longitudinal and traverse changes in elevation are abrupt and extensive
grading is frequently needed to obtain acceptable alignments.
Based on these definitions, the majority of the study area appears to be level terrain (60 mph design
speed) with some areas of rolling terrain (55 mph design speed).
E X I S T I NG AND P RO J E C T ED COND I T I ON S
AUGUST 2011
10
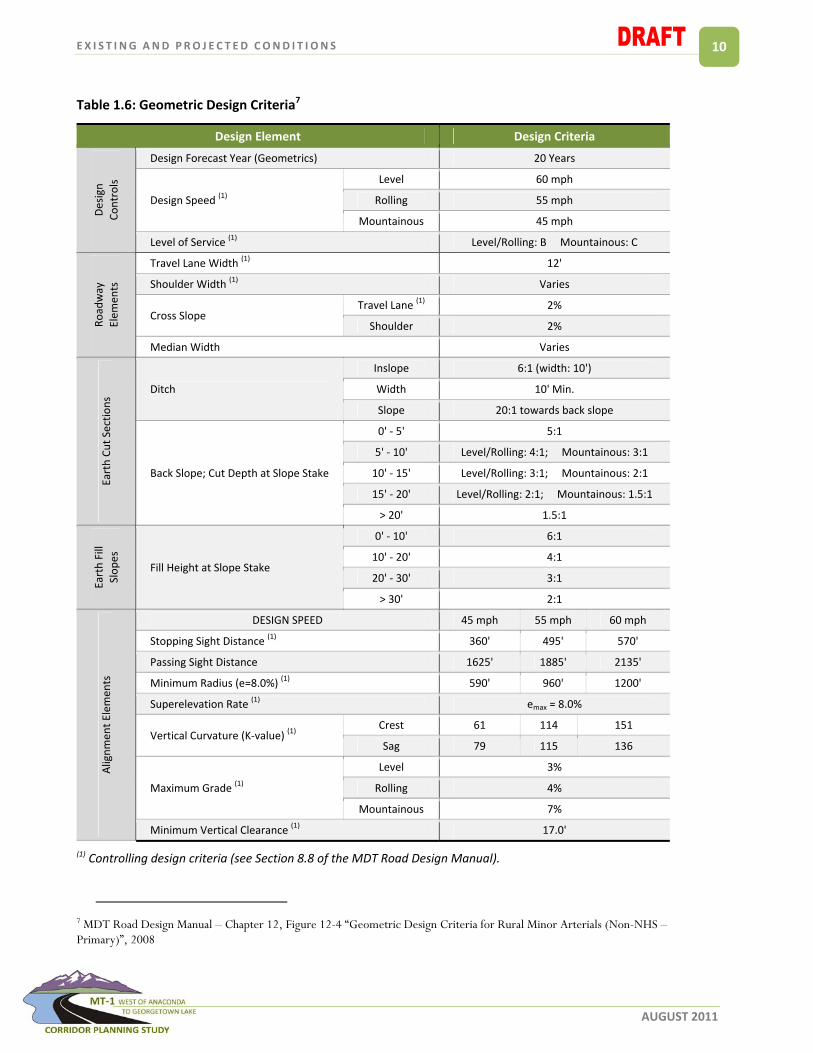
Table 1.6: Geometric Design Criteria7
Design Element Design Criteria
Des
ign
Co
ntr
ols
Design Forecast Year (Geometrics) 20 Years
Design Speed (1)
Level 60 mph
Rolling 55 mph
Mountainous 45 mph
Level of Service (1) Level/Rolling: B Mountainous: C
Ro
adw
ay
Elem
ents
Travel Lane Width (1) 12'
Shoulder Width (1) Varies
Cross Slope Travel Lane (1) 2%
Shoulder 2%
Median Width Varies
Eart
h C
ut
Sect
ion
s
Ditch
Inslope 6:1 (width: 10')
Width 10' Min.
Slope 20:1 towards back slope
Back Slope; Cut Depth at Slope Stake
0' ‐ 5' 5:1
5' ‐ 10' Level/Rolling: 4:1; Mountainous: 3:1
10' ‐ 15' Level/Rolling: 3:1; Mountainous: 2:1
15' ‐ 20' Level/Rolling: 2:1; Mountainous: 1.5:1
> 20' 1.5:1
Eart
h F
ill
Slo
pes
Fill Height at Slope Stake
0' ‐ 10' 6:1
10' ‐ 20' 4:1
20' ‐ 30' 3:1
> 30' 2:1
Alig
nm
en
t El
emen
ts
DESIGN SPEED 45 mph 55 mph 60 mph
Stopping Sight Distance (1) 360' 495' 570'
Passing Sight Distance 1625' 1885' 2135'
Minimum Radius (e=8.0%) (1) 590' 960' 1200'
Superelevation Rate (1) emax = 8.0%
Vertical Curvature (K‐value) (1) Crest 61 114 151
Sag 79 115 136
Maximum Grade (1)
Level 3%
Rolling 4%
Mountainous 7%
Minimum Vertical Clearance (1) 17.0'
(1) Controlling design criteria (see Section 8.8 of the MDT Road Design Manual).
7 MDT Road Design Manual – Chapter 12, Figure 12-4 “Geometric Design Criteria for Rural Minor Arterials (Non-NHS – Primary)”, 2008
E X I S T I NG AND P RO J E C T ED COND I T I ON S
AUGUST 2011
11
1.7 ROADWAY GEOMETRICS
Existing roadway geometrics were evaluated for MT‐1 within the study area to identify areas of concern
that do not meet current MDT standards. This analysis was conducted based on information from as‐
built construction drawings and confirmed through field review. The findings of this analysis are
discussed in the following sections.
1.7.1 Horizontal Alignment
Elements comprising horizontal alignment include curvature, superelevation, and sight distance which
have an influence on traffic operation and safety. These parameters define horizontal alignment and
are directly related to the design speed of the corridor.
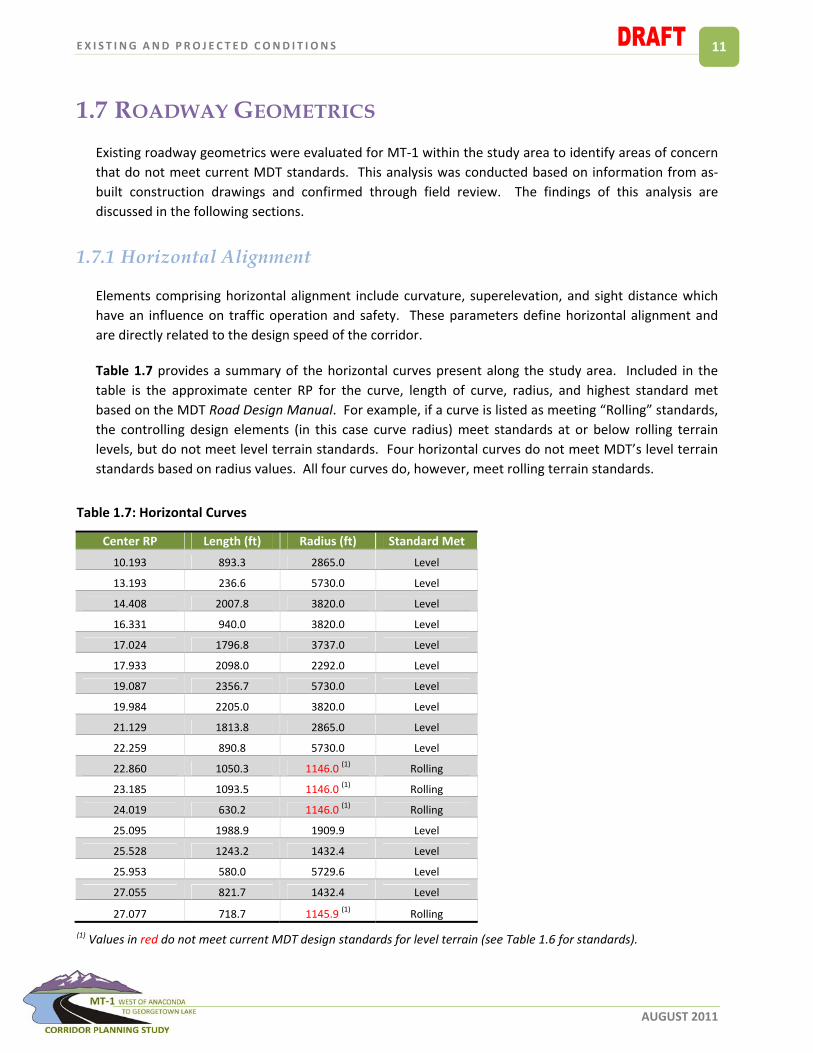
Table 1.7 provides a summary of the horizontal curves present along the study area. Included in the
table is the approximate center RP for the curve, length of curve, radius, and highest standard met
based on the MDT Road Design Manual. For example, if a curve is listed as meeting “Rolling” standards,
the controlling design elements (in this case curve radius) meet standards at or below rolling terrain
levels, but do not meet level terrain standards. Four horizontal curves do not meet MDT’s level terrain
standards based on radius values. All four curves do, however, meet rolling terrain standards.
Table 1.7: Horizontal Curves
Center RP Length (ft) Radius (ft) Standard Met
10.193 893.3 2865.0 Level
13.193 236.6 5730.0 Level
14.408 2007.8 3820.0 Level
16.331 940.0 3820.0 Level
17.024 1796.8 3737.0 Level
17.933 2098.0 2292.0 Level
19.087 2356.7 5730.0 Level
19.984 2205.0 3820.0 Level
21.129 1813.8 2865.0 Level
22.259 890.8 5730.0 Level
22.860 1050.3 1146.0 (1) Rolling
23.185 1093.5 1146.0 (1) Rolling
24.019 630.2 1146.0 (1) Rolling
25.095 1988.9 1909.9 Level
25.528 1243.2 1432.4 Level
25.953 580.0 5729.6 Level
27.055 821.7 1432.4 Level
27.077 718.7 1145.9 (1) Rolling
(1) Values in red do not meet current MDT design standards for level terrain (see Table 1.6 for standards).

E X I S T I NG AND P RO J E C T ED COND I T I ON S
AUGUST 2011
12
1.7.2 Vertical Alignment
Vertical alignment is a measure of elevation change of a roadway. The length and steepness of grades
directly affects the operational characteristics of the roadway. The MDT Road Design Manual lists
recommendations for maximum grades along with minimum values for vertical curvature (K‐value) for
Rural Minor Arterials according to the type of terrain in the area. According to the Road Design Manual,
the maximum allowable grade for level terrain is 3%, for rolling terrain is 4%, and for mountainous
terrain is 7%.
The grades throughout the corridor are generally less than 3% and therefore meet level terrain
standards. There are, however, twelve vertical curves that have grades greater than 3%, ten of which
have grades exceeding rolling terrain standards (4%). This information is shown in Table 1.8.
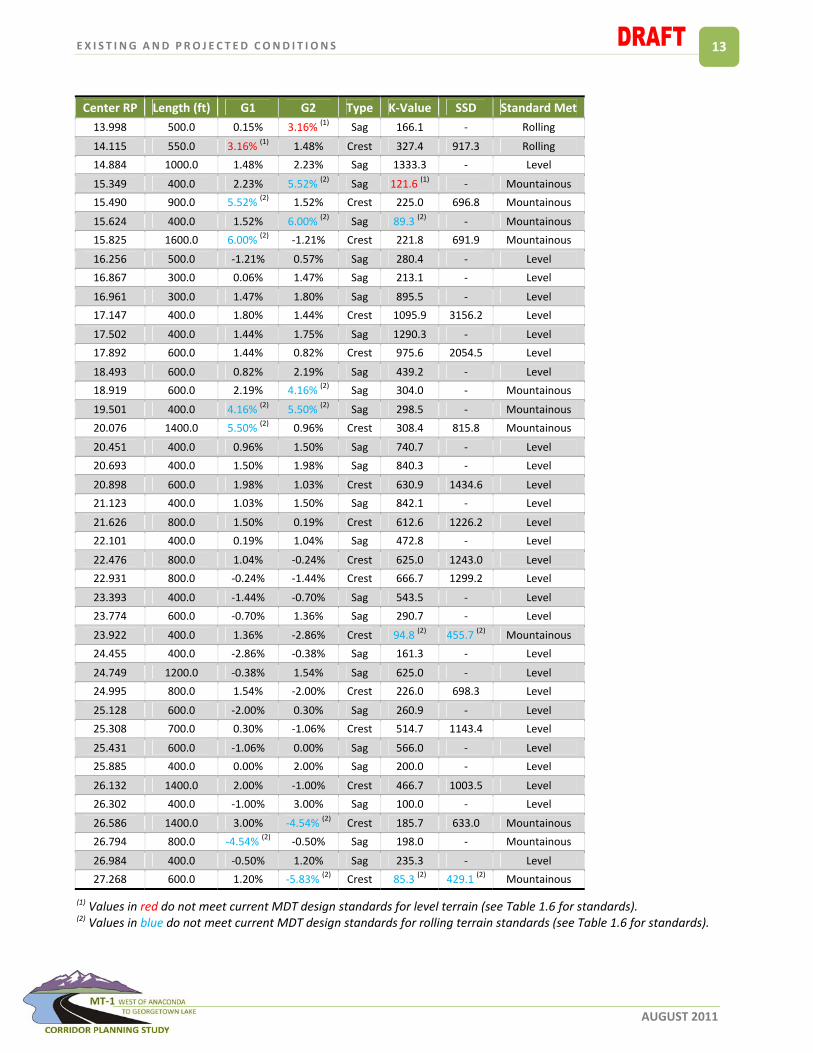
In addition to roadway grades, Table 1.8 shows curve information for all the vertical curves along the
study area. The controlling design factors for vertical curves are the rate of vertical curvature, or K‐
value, and stopping sight distance. K‐values are a function of the length of the curve compared to the
algebraic change in grade which comprises either a sag or a crest vertical curve. This controlling design
criterion is directly dependent on the design speed of the study area. Within the study area, there are
five vertical curves that do not meet K‐value standards for level terrain, three of which do not meet
current standards for rolling terrain. In addition, two vertical curves do not meet standards for rolling
terrain based on stopping sight distance, but do meet mountainous terrain standards.
Table 1.8: Vertical Curves
Center RP Length (ft) G1 G2 Type K‐Value SSD Standard Met
10.762 200.0 1.01% 1.57% Sag 355.2 ‐ Level
10.929 100.0 1.57% 0.83% Crest 134.6 (1) 1502.2 Rolling
11.024 200.0 0.83% 1.02% Sag 1041.7 ‐ Level
11.104 100.0 1.02% 1.73% Sag 140.6 ‐ Level
11.254 200.0 1.73% 1.36% Crest 536.2 2992.8 Level
11.369 200.0 1.36% 1.22% Crest 1428.6 7807.1 Level
11.484 400.0 1.22% 1.60% Sag 1052.6 ‐ Level
11.677 200.0 1.60% 1.10% Crest 400.0 2258.0 Level
11.964 200.0 1.10% 1.44% Sag 588.2 ‐ Level
12.070 300.0 1.44% 0.75% Crest 434.8 1713.8 Level
12.251 800.0 0.75% 1.35% Sag 1333.3 ‐ Level
12.808 200.0 1.45% 0.51% Crest 212.8 1247.9 Level
12.884 300.0 0.51% 2.12% Sag 186.3 ‐ Level
13.000 200.0 2.12% 1.38% Crest 270.3 1558.1 Level
13.077 200.0 1.38% 2.70% Sag 151.5 ‐ Level
13.174 400.0 2.70% 1.05% Crest 242.4 853.9 Level
13.519 100.0 1.25% 1.71% Sag 217.4 ‐ Level
13.596 200.0 1.71% 1.34% Crest 540.5 3016.2 Level
13.884 300.0 1.34% 0.15% Crest 252.1 1056.7 Level
(1) Values in red do not meet current MDT design standards for level terrain (see Table 1.6 for standards). (2) Values in blue do not meet current MDT design standards for rolling terrain standards (see Table 1.6 for standards).
E X I S T I NG AND P RO J E C T ED COND I T I ON S
AUGUST 2011
13
Center RP Length (ft) G1 G2 Type K‐Value SSD Standard Met
13.998 500.0 0.15% 3.16% (1) Sag 166.1 ‐ Rolling
14.115 550.0 3.16% (1) 1.48% Crest 327.4 917.3 Rolling
14.884 1000.0 1.48% 2.23% Sag 1333.3 ‐ Level
15.349 400.0 2.23% 5.52% (2) Sag 121.6 (1) ‐ Mountainous
15.490 900.0 5.52% (2) 1.52% Crest 225.0 696.8 Mountainous
15.624 400.0 1.52% 6.00% (2) Sag 89.3 (2) ‐ Mountainous
15.825 1600.0 6.00% (2) ‐1.21% Crest 221.8 691.9 Mountainous
16.256 500.0 ‐1.21% 0.57% Sag 280.4 ‐ Level
16.867 300.0 0.06% 1.47% Sag 213.1 ‐ Level
16.961 300.0 1.47% 1.80% Sag 895.5 ‐ Level
17.147 400.0 1.80% 1.44% Crest 1095.9 3156.2 Level
17.502 400.0 1.44% 1.75% Sag 1290.3 ‐ Level
17.892 600.0 1.44% 0.82% Crest 975.6 2054.5 Level
18.493 600.0 0.82% 2.19% Sag 439.2 ‐ Level
18.919 600.0 2.19% 4.16% (2) Sag 304.0 ‐ Mountainous
19.501 400.0 4.16% (2) 5.50% (2) Sag 298.5 ‐ Mountainous
20.076 1400.0 5.50% (2) 0.96% Crest 308.4 815.8 Mountainous
20.451 400.0 0.96% 1.50% Sag 740.7 ‐ Level
20.693 400.0 1.50% 1.98% Sag 840.3 ‐ Level
20.898 600.0 1.98% 1.03% Crest 630.9 1434.6 Level
21.123 400.0 1.03% 1.50% Sag 842.1 ‐ Level
21.626 800.0 1.50% 0.19% Crest 612.6 1226.2 Level
22.101 400.0 0.19% 1.04% Sag 472.8 ‐ Level
22.476 800.0 1.04% ‐0.24% Crest 625.0 1243.0 Level
22.931 800.0 ‐0.24% ‐1.44% Crest 666.7 1299.2 Level
23.393 400.0 ‐1.44% ‐0.70% Sag 543.5 ‐ Level
23.774 600.0 ‐0.70% 1.36% Sag 290.7 ‐ Level
23.922 400.0 1.36% ‐2.86% Crest 94.8 (2) 455.7 (2) Mountainous
24.455 400.0 ‐2.86% ‐0.38% Sag 161.3 ‐ Level
24.749 1200.0 ‐0.38% 1.54% Sag 625.0 ‐ Level
24.995 800.0 1.54% ‐2.00% Crest 226.0 698.3 Level
25.128 600.0 ‐2.00% 0.30% Sag 260.9 ‐ Level
25.308 700.0 0.30% ‐1.06% Crest 514.7 1143.4 Level
25.431 600.0 ‐1.06% 0.00% Sag 566.0 ‐ Level
25.885 400.0 0.00% 2.00% Sag 200.0 ‐ Level
26.132 1400.0 2.00% ‐1.00% Crest 466.7 1003.5 Level
26.302 400.0 ‐1.00% 3.00% Sag 100.0 ‐ Level
26.586 1400.0 3.00% ‐4.54% (2) Crest 185.7 633.0 Mountainous
26.794 800.0 ‐4.54% (2) ‐0.50% Sag 198.0 ‐ Mountainous
26.984 400.0 ‐0.50% 1.20% Sag 235.3 ‐ Level
27.268 600.0 1.20% ‐5.83% (2) Crest 85.3 (2) 429.1 (2) Mountainous
(1) Values in red do not meet current MDT design standards for level terrain (see Table 1.6 for standards). (2) Values in blue do not meet current MDT design standards for rolling terrain standards (see Table 1.6 for standards).

E X I S T I NG AND P RO J E C T ED COND I T I ON S
AUGUST 2011
14
1.7.3 Roadside Clear Zones
The roadside clear zone, starting at the edge of the traveled way, is the total roadside border area
available for safe use by errant vehicles. This area may consist of a shoulder, a recoverable slope, a non‐
recoverable slope, and/or recovery area. The desired clear zone width varies depending on traffic
volumes, speeds, and roadside geometry. Clear zones are evaluated individually based on the roadside
cross section. According to MDT, clear zone should be attained by removing or shielding obstacles if
costs are reasonable.
In certain instances along the study area it may be impractical to protect or remove certain obstacles
within the clear zone. As improvement options develop, roadside clear zones should be designated, to a
practical extent, to meet current MDT design standards.
A list of roadside clear zone areas of concern was developed based on information obtained during field
reviews. Features looked at during the field reviews were sight distances, side slopes, and roadside
hazards. A table of roadside clear zone observations is presented in Table 1.9.
Table 1.9: Roadside Clear Zones
Approximate Location (RP) Feature Description Comments
12.4 ‐ 13.4 Clear Zone Cut slope with fallen rock South side
13.9 ‐ 14.2 Clear Zone Heavy vegetation Area with high rate of animal crashes
16.4 Slope Steep fill slope Noted fatality at this location
16.5 ‐ 16.8 Slope Steep fill slope
21.1 ‐ 21.4 Slope Cut slope with fallen rock North Side
21.7 ‐ 21.8 Slope Cut slope with fallen rock North Side
22.1 ‐ 22.6 Slope Cut slope with fallen rock North Side
22.9 ‐ 23.1 Slope Cut slope with fallen rock North Side
24.2 Horizontal Curve Poor sight distance Steep cut slope at Georgetown Lake Rd intersection
24.8 Slope Steep fill slope Culvert location
25.0 Slope Sharp drop‐off into water Signed "no parking" area by lake
25.0 ‐ 25.3 Horizontal Curve Poor sight distance Due to cut slope on north side
25.4 ‐ 25.6 Slope Shoulder and side slope to water
25.5 Slope / Intersection Steep slope into water at intersection Noted fatality at this location
25.9 Bridge ends Blunt concrete bridge ends
26.1 Slope Steep fill slope Culvert location
26.2 ‐ 26.8 Slope Steep fill slope South side
E X I S T I NG AND P RO J E C T ED COND I T I ON S
AUGUST 2011
15
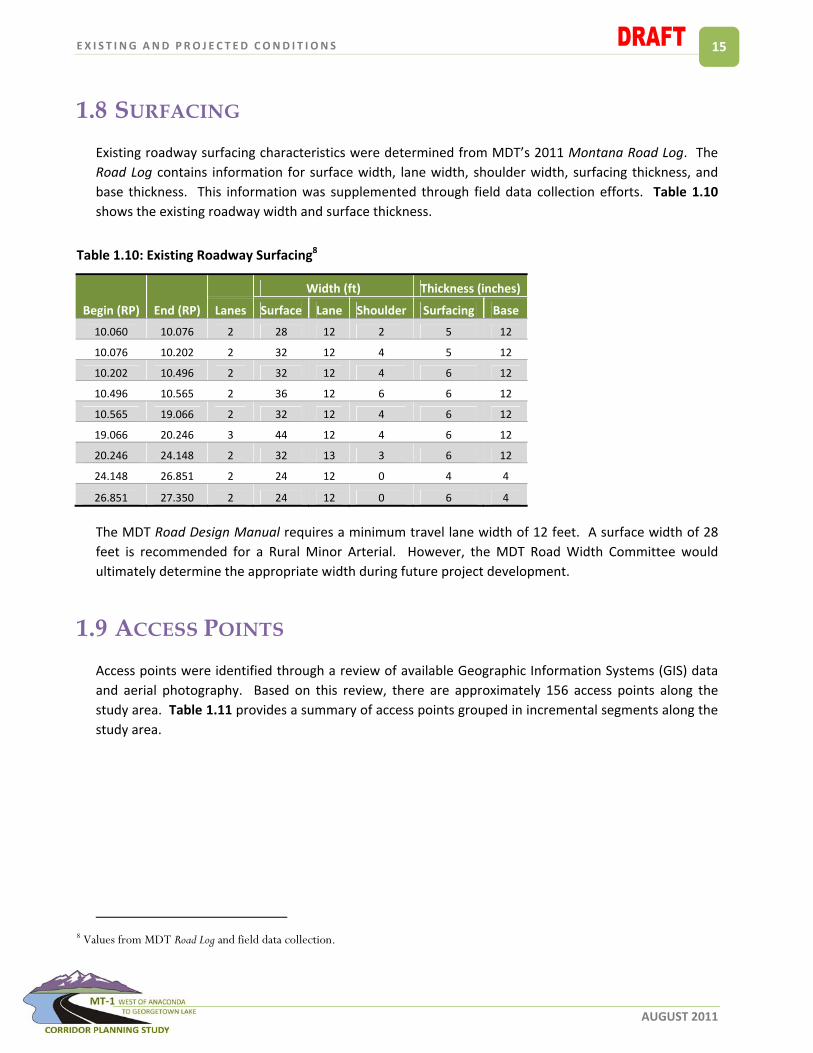
1.8 SURFACING
Existing roadway surfacing characteristics were determined from MDT’s 2011 Montana Road Log. The
Road Log contains information for surface width, lane width, shoulder width, surfacing thickness, and
base thickness. This information was supplemented through field data collection efforts. Table 1.10
shows the existing roadway width and surface thickness.
Table 1.10: Existing Roadway Surfacing8
Begin (RP) End (RP)
Width (ft) Thickness (inches)
Lanes Surface Lane Shoulder Surfacing Base
10.060 10.076 2 28 12 2 5 12
10.076 10.202 2 32 12 4 5 12
10.202 10.496 2 32 12 4 6 12
10.496 10.565 2 36 12 6 6 12
10.565 19.066 2 32 12 4 6 12
19.066 20.246 3 44 12 4 6 12
20.246 24.148 2 32 13 3 6 12
24.148 26.851 2 24 12 0 4 4
26.851 27.350 2 24 12 0 6 4
The MDT Road Design Manual requires a minimum travel lane width of 12 feet. A surface width of 28
feet is recommended for a Rural Minor Arterial. However, the MDT Road Width Committee would
ultimately determine the appropriate width during future project development.
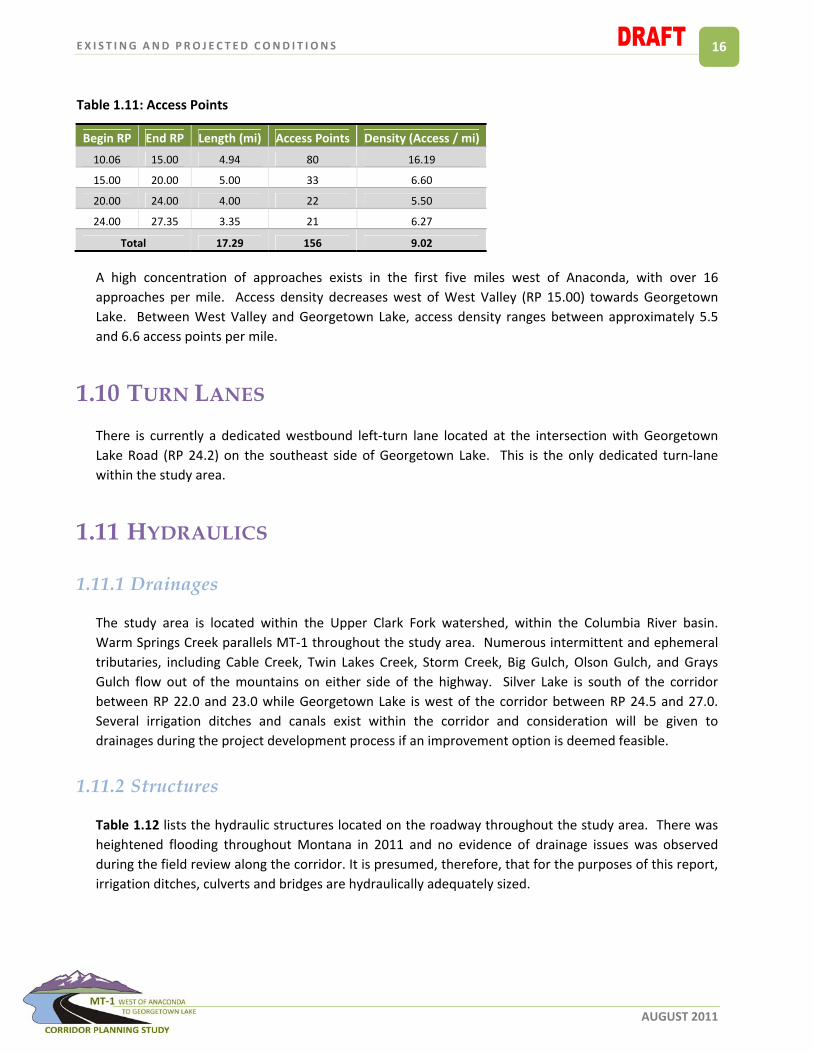
1.9 ACCESS POINTS
Access points were identified through a review of available Geographic Information Systems (GIS) data
and aerial photography. Based on this review, there are approximately 156 access points along the
study area. Table 1.11 provides a summary of access points grouped in incremental segments along the
study area.
8 Values from MDT Road Log and field data collection.
E X I S T I NG AND P RO J E C T ED COND I T I ON S
AUGUST 2011
16
Table 1.11: Access Points
Begin RP End RP Length (mi) Access Points Density (Access / mi)
10.06 15.00 4.94 80 16.19
15.00 20.00 5.00 33 6.60
20.00 24.00 4.00 22 5.50
24.00 27.35 3.35 21 6.27
Total 17.29 156 9.02
A high concentration of approaches exists in the first five miles west of Anaconda, with over 16
approaches per mile. Access density decreases west of West Valley (RP 15.00) towards Georgetown
Lake. Between West Valley and Georgetown Lake, access density ranges between approximately 5.5
and 6.6 access points per mile.
1.10 TURN LANES
There is currently a dedicated westbound left‐turn lane located at the intersection with Georgetown
Lake Road (RP 24.2) on the southeast side of Georgetown Lake. This is the only dedicated turn‐lane
within the study area.
1.11 HYDRAULICS
1.11.1 Drainages
The study area is located within the Upper Clark Fork watershed, within the Columbia River basin.
Warm Springs Creek parallels MT‐1 throughout the study area. Numerous intermittent and ephemeral
tributaries, including Cable Creek, Twin Lakes Creek, Storm Creek, Big Gulch, Olson Gulch, and Grays
Gulch flow out of the mountains on either side of the highway. Silver Lake is south of the corridor
between RP 22.0 and 23.0 while Georgetown Lake is west of the corridor between RP 24.5 and 27.0.
Several irrigation ditches and canals exist within the corridor and consideration will be given to
drainages during the project development process if an improvement option is deemed feasible.
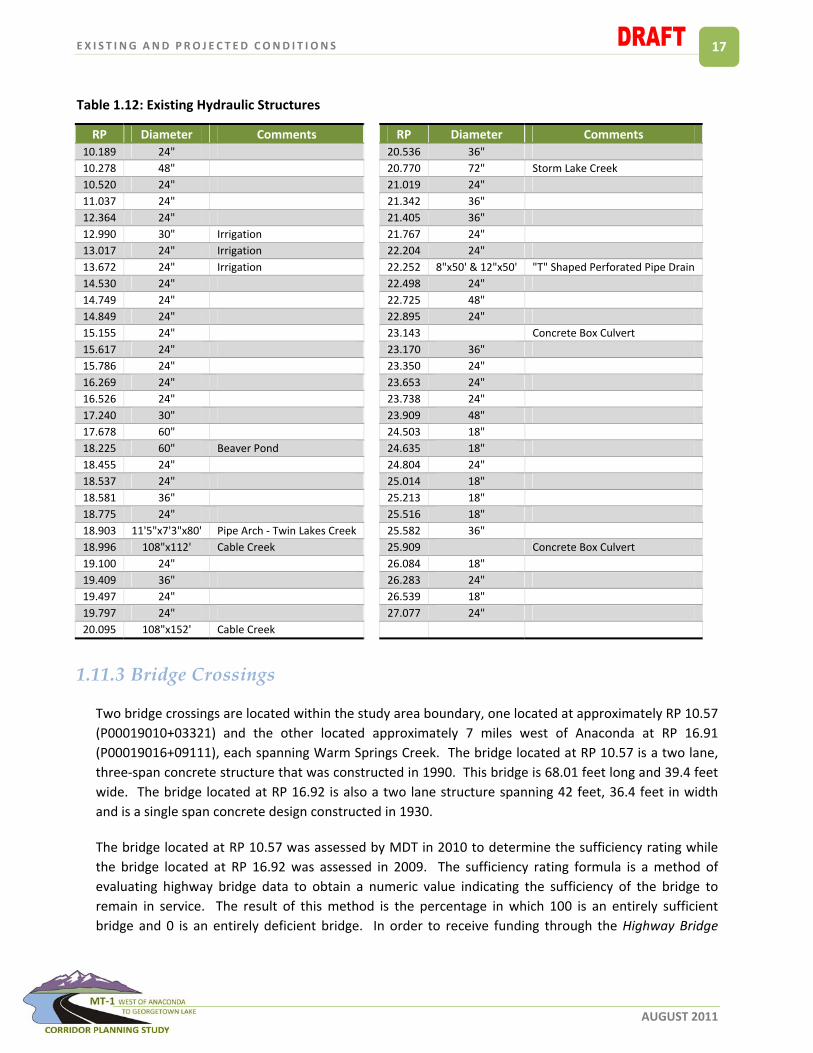
1.11.2 Structures
Table 1.12 lists the hydraulic structures located on the roadway throughout the study area. There was
heightened flooding throughout Montana in 2011 and no evidence of drainage issues was observed
during the field review along the corridor. It is presumed, therefore, that for the purposes of this report,
irrigation ditches, culverts and bridges are hydraulically adequately sized.
E X I S T I NG AND P RO J E C T ED COND I T I ON S
AUGUST 2011
17
Table 1.12: Existing Hydraulic Structures
RP Diameter Comments RP Diameter Comments
10.189 24" 20.536 36"
10.278 48" 20.770 72" Storm Lake Creek
10.520 24" 21.019 24"
11.037 24" 21.342 36"
12.364 24" 21.405 36"
12.990 30" Irrigation 21.767 24"
13.017 24" Irrigation 22.204 24"
13.672 24" Irrigation 22.252 8"x50' & 12"x50' "T" Shaped Perforated Pipe Drain
14.530 24" 22.498 24"
14.749 24" 22.725 48"
14.849 24" 22.895 24"
15.155 24" 23.143 Concrete Box Culvert
15.617 24" 23.170 36"
15.786 24" 23.350 24"
16.269 24" 23.653 24"
16.526 24" 23.738 24"
17.240 30" 23.909 48"
17.678 60" 24.503 18"
18.225 60" Beaver Pond 24.635 18"
18.455 24" 24.804 24"
18.537 24" 25.014 18"
18.581 36" 25.213 18"
18.775 24" 25.516 18"
18.903 11'5"x7'3"x80' Pipe Arch ‐ Twin Lakes Creek 25.582 36"
18.996 108"x112' Cable Creek 25.909 Concrete Box Culvert
19.100 24" 26.084 18"
19.409 36" 26.283 24"
19.497 24" 26.539 18"
19.797 24" 27.077 24"
20.095 108"x152' Cable Creek
1.11.3 Bridge Crossings
Two bridge crossings are located within the study area boundary, one located at approximately RP 10.57
(P00019010+03321) and the other located approximately 7 miles west of Anaconda at RP 16.91
(P00019016+09111), each spanning Warm Springs Creek. The bridge located at RP 10.57 is a two lane,
three‐span concrete structure that was constructed in 1990. This bridge is 68.01 feet long and 39.4 feet
wide. The bridge located at RP 16.92 is also a two lane structure spanning 42 feet, 36.4 feet in width
and is a single span concrete design constructed in 1930.
The bridge located at RP 10.57 was assessed by MDT in 2010 to determine the sufficiency rating while
the bridge located at RP 16.92 was assessed in 2009. The sufficiency rating formula is a method of
evaluating highway bridge data to obtain a numeric value indicating the sufficiency of the bridge to
remain in service. The result of this method is the percentage in which 100 is an entirely sufficient
bridge and 0 is an entirely deficient bridge. In order to receive funding through the Highway Bridge
E X I S T I NG AND P RO J E C T ED COND I T I ON S
AUGUST 2011
18
Replacement and Rehabilitation Program, structures must be “Structurally Deficient” or “Functionally
Obsolete” and have a sufficiency rating of 80 or below. Structures with a sufficiency rating of 0 to 49.9
are eligible for replacement, and structures at 50 to 80 are eligible for rehabilitation unless otherwise
approved by the Federal Highway Administration (FHWA).
The following criteria determine whether or not a structure is structurally deficient or functionally
obsolete:
Structurally Deficient
A condition of 4 or less for any of the following:
Deck Rating
Superstructure Rating
Substructure Rating
Or, an appraisal of 2 or less for the following:
Structure Rating
Waterway Adequacy
Functionally Obsolete
An appraisal of 3 or less for the following:
Deck Geometry
Under Clearance
Approach Roadway Alignment
Or, an appraisal of 3 for the following:
Structure Rating
Waterway Adequacy
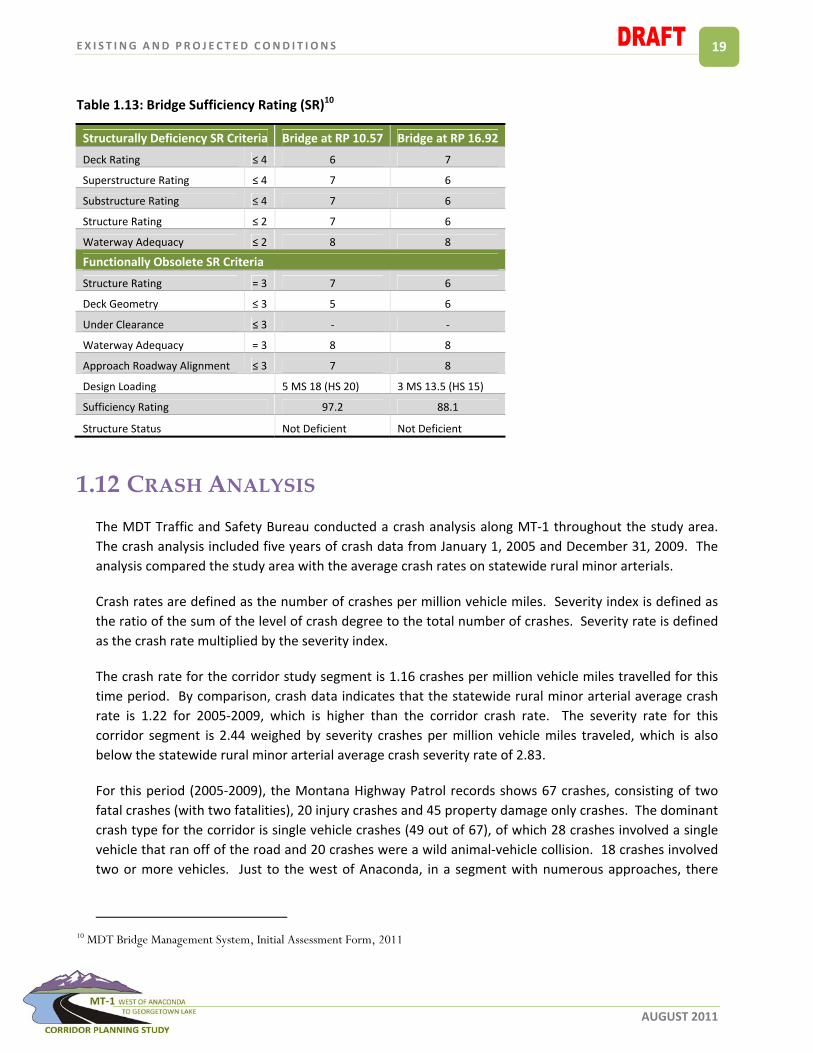
Both bridge structures are determined to be not structurally deficient and not functionally obsolete at
the present time. The design loadings meet current MDT standards which require a minimum design
loading of MS 13.5 (metric) / HS 15 (English) for bridges to remain in place.9 Table 1.13 shows the
sufficiency ratings of the two bridge crossings.
9 MDT Bridge Design Standards
E X I S T I NG AND P RO J E C T ED COND I T I ON S
AUGUST 2011
19
Table 1.13: Bridge Sufficiency Rating (SR)10
Structurally Deficiency SR Criteria Bridge at RP 10.57 Bridge at RP 16.92
Deck Rating ≤ 4 6 7
Superstructure Rating ≤ 4 7 6
Substructure Rating ≤ 4 7 6
Structure Rating ≤ 2 7 6
Waterway Adequacy ≤ 2 8 8
Functionally Obsolete SR Criteria
Structure Rating = 3 7 6
Deck Geometry ≤ 3 5 6
Under Clearance ≤ 3 ‐ ‐
Waterway Adequacy = 3 8 8
Approach Roadway Alignment ≤ 3 7 8
Design Loading 5 MS 18 (HS 20) 3 MS 13.5 (HS 15)
Sufficiency Rating 97.2 88.1
Structure Status Not Deficient Not Deficient
1.12 CRASH ANALYSIS
The MDT Traffic and Safety Bureau conducted a crash analysis along MT‐1 throughout the study area.
The crash analysis included five years of crash data from January 1, 2005 and December 31, 2009. The
analysis compared the study area with the average crash rates on statewide rural minor arterials.
Crash rates are defined as the number of crashes per million vehicle miles. Severity index is defined as
the ratio of the sum of the level of crash degree to the total number of crashes. Severity rate is defined
as the crash rate multiplied by the severity index.
The crash rate for the corridor study segment is 1.16 crashes per million vehicle miles travelled for this
time period. By comparison, crash data indicates that the statewide rural minor arterial average crash
rate is 1.22 for 2005‐2009, which is higher than the corridor crash rate. The severity rate for this
corridor segment is 2.44 weighed by severity crashes per million vehicle miles traveled, which is also
below the statewide rural minor arterial average crash severity rate of 2.83.
For this period (2005‐2009), the Montana Highway Patrol records shows 67 crashes, consisting of two
fatal crashes (with two fatalities), 20 injury crashes and 45 property damage only crashes. The dominant
crash type for the corridor is single vehicle crashes (49 out of 67), of which 28 crashes involved a single
vehicle that ran off of the road and 20 crashes were a wild animal‐vehicle collision. 18 crashes involved
two or more vehicles. Just to the west of Anaconda, in a segment with numerous approaches, there
10 MDT Bridge Management System, Initial Assessment Form, 2011
E X I S T I NG AND P RO J E C T ED COND I T I ON S
AUGUST 2011
20
were seven multi‐vehicle collisions; however, these crashes were not concentrated in one location.
Lane departure crashes were spread over the entire length of the corridor. There is a concentration of
wild animal‐vehicle collisions, 9 reported, between RP 14.7 and 15.7. The run‐off‐the‐road crashes were
spread over the corridor. Based on the crash data reviewed for the study area, crash clusters were
identified at the following locations:
RP 13.2‐13.6
RP 16.8‐17.1
RP 21.4‐21.8
RP 22.8‐23.3
The 20 reported incidences that included collisions with wild animals mostly included single animal
collisions; however, one crash involved eight bighorn sheep that were killed at RP 14.4. Carcass data for
the corridor indicates 87 total carcasses recovered along the corridor in the time period from 2006‐
2010. The 87 carcasses does not indicate 87 crashes, as four crashes killed two animals each, and one
crash included the eight bighorn sheep as discussed previously. According to the carcass data, 71 wild
animal‐vehicle collisions occurred along the corridor.
A cluster of wild animal‐vehicle collisions has been identified between reference points 11.2 and 17, as
almost 50% of the wild animal‐vehicle collisions occurring in this corridor have occurred through this 5.8
mile stretch, according to the carcass data. In the fall of 2010, eight bighorn sheep, including two trophy
rams, were killed in a single incident on MT‐1, approximately a half‐mile after westbound travelers leave
the 45 mph zone and enter the 70 mph zone (approximately RP 14.5). Other clusters have been
identified between reference points 17.8 and 19.8, with 12 collisions (17%), and also reference points 21
to 22.1, with 9 crashes (13%).
1.13 TRANSPORTATION SERVICES
Railroad – Butte, Anaconda & Pacific Railway (BA&P), formerly referred to as the Rarus Railway,
connects Butte and Anaconda, intersecting the Union Pacific line at Silver Bow. The short‐line railroad
currently is owned by Patriot Rail Corp. While an excursion train also operates on the line between June
and September, the principal commodities hauled on the line include copper concentrate and mine
tailings.11 Between Butte and Garrison, BNSF operates 51.1 miles of track with stations in Silver Bow,
Warm Springs, and Deer Lodge. The Port of Montana, a 55‐acre facility located in Silver Bow, provides a
strategic gateway to rail and highway connections.
Bus – Commercial interstate bus service is available in Butte, located 27 miles east of Anaconda. This
service is provided by Rimrock Stages, the bus service provider that picked up former Greyhound routes
11 MDT Montana State Rail Plan, 2010

E X I S T I NG AND P RO J E C T ED COND I T I ON S
AUGUST 2011
21
between Billings and Missoula on June 21, 2011. Local bus carriers are Karst Stage and Tucker
Transportation.
Motor Freight – Numerous trucking firms serve Anaconda and Deer Lodge County, including, but not
limited to, Andy's Motor Freight, Yellow Freight System Inc., Ravalli Motor Freight, Montana Express
Inc., Molerway Freight Lines, Boka Freight Line, Watkins Shepard and Ambrose Distributing Company.
These firms may change over time, however statewide it is estimated that over 1,000 motor freight
carriers serve Montana and have access to the Anaconda area.
Air Service – A non‐commercial airport is located three miles northeast of Anaconda. This is a basic
utility airport, able to accommodate 95% of all general aviation equipment (larger twin engine and small
corporate jets).
Commercial Airport – Bert Mooney Airport is a public airport located in Butte (27 miles). SkyWest
Airlines, a subsidiary of Delta, is the only air carrier serving the Bert Mooney Airport.
1.14 UTILITIES
Public utilities available in Deer Lodge County12 and particularly the Anaconda area include electrical
service from Northwestern Energy and Vigilante Electric Co‐op (serving some rural areas). Northwestern
Energy supplies natural gas to the county through 12 inch supply lines.
Garbage removal services are through the Anaconda‐Deer Lodge Solid Waste District contracts with
Butte‐Silver Bow for Class II solid waste disposal at a landfill located in Butte‐Silver Bow (Rocker).
Anaconda Disposal provides garbage collection service for Anaconda‐Deer Lodge County. A Class III
landfill is located in Deer Lodge County (east of Anaconda).
The primary water source for drinking water for the city of Anaconda is operated by the local
government. Six, twelve‐inch wells with a four million gallon storage tank serve approximately 6,224
users. Average consumption is 3.7 million gallons per day. Maximum capacity is 4 million gallons per
day. Water temperature ranges from 49 ‐ 54 degrees with moderate hardness. Hearst Lake and Fifer
Creek Reservoir are secondary, developable sources with a combined storage capacity of 315 million
gallons. Areas outside of the city limits are served by individual wells, with the exception of Warm
Springs and Galen which are managed by the State of Montana.
Industrial Water – Silver Lake has the capacity of more than 2 million gallons per day.
Waste Water – The City of Anaconda is served by a tertiary treatment, public wastewater system
operated by the City and County governments. Outside the city limits, domestic and commercial
wastewater is treated by onsite disposal (septic tank/drain field system).
12 http://www. anacondamt.org/utilities.htm

E X I S T I NG AND P RO J E C T ED COND I T I ON S
AUGUST 2011
22
2.0 Local Planning
2.1 GROWTH POLICY
The Anaconda – Deer Lodge County Growth Policy, 2010 was developed as a guiding document for
growth and development within ADLC. The Growth Policy is a decision making tool to help achieve the
vision of ADLC citizens and to provide guidance to developers and investors in ADLC. The vision of the
Growth Policy is as follows:
“Anaconda – Deer Lodge County will, as a community, preserve our rich heritage and
common values while retaining and enhancing our turn‐of‐the century image. With long‐
range planning to direct growth and development, our community will continue to be a safe
place where individuals and families can work, play, and learn based on a strong education,
and mutual respect. The preservation and development of our resources will be for the
betterment of all citizens, now and in the future.”13
There are three goals related to transportation identified in the Growth Policy:
1. Provide a modern, efficient transportation system to support the County’s economic
development efforts and to meet the needs of present and future residents.
2. Integrate transportation considerations into the various land use and economic development
planning processes.
3. Through integrated community planning, non‐motorized system planning and transportation
system enhancements provide the widest possible range of transportation choices for ADLC
residents.
2.2 TRAILS MASTER PLAN
Trails are an integral part of the transportation system in Anaconda and Deer Lodge County. A Trails
Master Plan was recently developed for ADLC to provide safe alternative mode of travel opportunities
and connectivity between communities. There is a desire to extend trail facilities west of Anaconda to
the West Valley area and beyond. The primary goals of the Trails Master Plan are:
1. Design and construction of a new trailhead park at the existing Beaver Dam School site in
Opportunity.
13 Anaconda – Deer Lodge County Growth Policy, 2010, http://www.anacondadeerlodge.mt.gov/departments/planning.aspx#growth_policy
E X I S T I NG AND P RO J E C T ED COND I T I ON S
AUGUST 2011
23
2. Design and construction of a multi‐use trail system that will connect the communities of
Anaconda, Opportunity, and Fairmont.
3. Provide a connection for the new trailhead park and interconnecting multi‐use trail system to
the proposed Greenway Trail System.
4. Provide for maintenance of the existing and proposed park and trail system components.
2.3 WATER / WASTEWATER SYSTEM
A wastewater system Preliminary Engineering Report was developed to address the needs of the
wastewater system in Anaconda and the surrounding areas. Residents in the West Valley area have
private water wells, but there is concern about potential contamination from area septic systems. The
West Valley Water and Sewer Feasibility Study, 2000 suggests that Anaconda’s water and wastewater
facilities could be expanded to serve the West Valley Area. Other potential additions, relative to the
water system on the west end of the city, include the Sunnyside Road area, the North Cable Road
properties, and the Stump Town Road area.
The Growth Policy recommends that a central wastewater system for West Valley be constructed to
provide long‐term protection of the Anaconda Municipal well field. According to the Growth Policy, the
system could connect to the existing Anaconda treatment facility.
E X I S T I NG AND P RO J E C T ED COND I T I ON S
AUGUST 2011
24
3.0 Environmental Scan
3.1 GEOGRAPHIC SETTING
The general topography of Deer Lodge County is mountainous in the extreme, the valleys being little
more than depressions between mountain ranges. The average elevation is 6,000 feet, rising to over
10,500 feet on the mountain peaks. The land use within the corridor is predominantly for recreational
and residential purposes. The majority of the land within the identified corridor is uninhabited. A high‐
level Environmental Scan was completed in January 2011 and covers the study area from west of
Anaconda – RP 10.06 to Georgetown Lake RP 27.35. This section provides a summary of the scan.
3.2 LAND OWNERSHIP
Land ownership within the study area was determined by reviewing GIS based information to assess the
amount of area that is public versus privately owned. The land within the study area is predominately
privately owned land (approximately 64%). There are no 6(f) resources in the study area. There are 4(f)
resources present, however, and are noted below:
Pumping Station (historic site)
BA&P Spur (railroad)
Malvey Cabin (historic site)
Anaconda‐Philipsburg Power Line (historic site)
Silver Lake Water System (historic site)
Garrity Mountain WMA (wildlife management area)
Blue Eyed Nellie WMA (wildlife management area)
Stuart Mill Bay FAS (fishing access site)
3.2.1 Montana Fish, Wildlife & Parks Wildlife Management Areas
The Garrity Mountain Wildlife Management Area (WMA) covers 9,475 acres and is located near the mid‐
point and south of the study area. This public land is managed by MFWP. Just south of the highway,
Garrity Mountain rises over 8,000 feet in elevation. The mountain’s, open grassy area provide critical
winter foraging for elk, deer, and bighorn sheep, while pockets of timber offer shelter and thermal
cover. North of the highway in the same vicinity is the Blue Eyed Nellie WMA. The management goal of
this 164 acre area is to provide winter range for Bighorn Sheep and opportunities for wildlife
observation.
E X I S T I NG AND P RO J E C T ED COND I T I ON S
AUGUST 2011
25
3.2.2 Montana Fish, Wildlife & Parks Fishing Access Sites (FASs)
MFWP owns the Stuart Mill Bay Fishing Access Site (FAS). This FAS has a portion of its land within the
corridor study area (roughly 20 percent of its total area). The FAS is not accessed directly from MT‐1,
rather is accessed off Georgetown Lake Road just north of RP 24.0.
3.3 CULTURAL AND ARCHAEOLOGICAL RESOURCES
The corridor contains many cultural resources, including the Anaconda to Phillipsburg Power Line
(24DL0496), a pumping station (24DL0425), the Silver Lake Water System (24DL0691), the National
Register of Historic Places – listed Butte, Anaconda and Pacific Railroad Historic District (24DL0211), a
railroad spur line (24DL0425), and the Malvey Cabin (24DL0427). Cultural resources may be a significant
issue and is an important consideration as planning progresses on this study. Any further reconstruction
of the highway infrastructure in this corridor would require a cultural resource survey of the “Area of
Potential Effect” for this project as specified in Section 106 of the National Historic Preservation Act (36
CFR 800).
3.4 SOIL RESOURCES AND PRIME FARMLAND
Soil resource information was gathered through available soil surveys, while information regarding areas
of prime farmland in the corridor area was compiled from the US Department of Agriculture, Natural
Resource Conservation Service (NRCS). The agricultural soils of Deer Lodge County are confined chiefly
to the terraces in the vicinity of Galen in the northern part of the county and to the benches north of the
Big Hole River in the southwest part of the county.
The Farmland Protection Policy Act of 1981, which has as its purpose “to minimize the extent to which
federal programs contribute to the unnecessary and irreversible conversion of farmland to
nonagricultural uses, and to assure that federal programs are administered in a manner that, to the
extent practicable, will be compatible with State, unit of local government, and private programs and
policies to protect farmland”. Farmland is defined by the act in Section 420 as including prime farmland,
unique farmland, and farmland, other than prime or unique, this is of statewide or local importance.
Soil map units found within the study area have been classified as prime and important farmland.
Project activities associated with any proposed construction of the MT‐1 Anaconda to Georgetown Lake
corridor will likely create impacts to the soil map units with prime and important farmland status, thus it
is likely required that a CPA‐106 Farmland Conversion Impact Rating Form for Linear Projects would be
completed.
E X I S T I NG AND P RO J E C T ED COND I T I ON S
AUGUST 2011
26
3.5 VEGETATION
According to the Montana Natural Heritage Program (MNHP) report, seventy‐five percent of the
vegetative land cover in Deer Lodge County is comprised of a combination of Rocky Mountain Lodgepole
Pine Forest (23%), Rocky Mountain Lower Montane, Foothill, and Valley Grassland (14%), Montane
Sagebrush Steppe (12%), Rocky Mountain Montane Douglas‐fir Forest and Woodland (9%), Rocky
Mountain Subalpine‐Upper Montane Grassland (7%), Rocky Mountain Subalpine Dry‐Mesic Spruce‐Fir
Forest and Woodland (6%), and Northern Rock Mountain Lower Montane Riparian Woodland and
Shrubland (4%). In the vicinity of the study area, a combination of lodge pole pine forest and grasslands
dominate the hillsides and foothills. Riparian woodland and shrub land line the major drainage
corridors, especially Warm Springs Creek. There are patches of previously harvested forest‐tree, forest‐
shrub, and forest‐grassland regeneration along the slopes within the higher mountain elevations.
Adjacent to the highway, low intensity development has occurred.
Noxious weeds are present within Deer Lodge County. The Invaders Database System lists 60 exotic
plant species and 18 noxious weed species documented in the County. ADLC has additional species that
they consider to be noxious. The additional species considered noxious by ADLC were defined by ADLC
Council Resolution 10‐24, and include the following: Babysbreath, Common Mullein, Curley Dock,
Kochia, Musk Thistle, and Sowthistle.
3.6 WILDLIFE
Wildlife species inhabiting or traversing the study area are typical of those in mixed forests and
intermountain valley grasslands of south central Montana. Of the 108 mammal species known to occur
in the state, 65 are known or suspected to occur in Deer Lodge County. Common mammals occupying
habitats in, traversing, or having a distribution range that overlaps the study area are white‐tail deer,
mule deer, moose, red fox, black bear, elk, mountain lion, and coyote.
There is a large herd of bighorn sheep occupying habitat in the Flint, Anaconda, and Pintler mountains
which are frequently observed on or adjacent to MT‐1 in the study area, especially in the winter season.
Bighorn sheep inhabit both sides of MT‐1 throughout the corridor study area, but especially near the
Wildlife Management Area at Garrity Mountain. The bighorn sheep are attracted to the salt in de‐icing
material used on the highway in the winter season. The use of de‐icing material may cause bighorn
sheep to concentrate on and adjacent to the roadway, increasing the incidents of vehicle collisions with
bighorn sheep. Bighorn frequently graze alongside the roadway in this area and lick the salt from the
roadway during the winter months. The herd has also experienced fatal pneumonia outbreaks, which
MFWP has managed with some culling of the herd to prevent spread of the disease. It is estimated by
MFWP that of the 300 animals currently inhabiting the area, only about 1/3 of the herd may survive the
winter.
Other species present in the study area are noted in the Environmental Scan.

E X I S T I NG AND P RO J E C T ED COND I T I ON S
AUGUST 2011
27
3.7 AMPHIBIANS AND REPTILES
The species expected to occur in the corridor study area were extrapolated from “known” areas studied
in the MNHP – Natural Heritage Tracker (2010) database. The species potentially occurring in the study
area may include but are not limited to the Columbia spotted frog, Rocky Mountain tailed Frog, the
long‐toed salamander, and the Boreal (Western) Toad. Over a dozen invertebrate species, some listed
as State Species of Concern (SOC) also have been observed in the project study area.
3.8 BIRDS
According to the MNHP – Natural Heritage Tracker (2009) database of documented observations of
species, there are a few hundred different species of birds documented in Deer Lodge County, with the
potential to occur and nest in the project area. These species include representative songbirds, birds of
prey, waterfowl, owls, and shorebirds, including several State SOC. Most avian observations occur in the
riparian draws and hillsides associated with the numerous drainages along the study area and
surrounding lakes. Migratory birds and Golden and Bald Eagles are protected under the Migratory Bird
Treaty Act and the protection of these species and compliance with the Act would need to be carefully
considered with any planned project resulting from this study.
MFWP manage a wildlife area adjacent to both sides of the highway in the vicinity of Garrity Mountain.
3.9 AQUATIC RESOURCES
3.9.1 Fisheries
Warm Springs Creek parallels and is crossed by the highway in the study area. Multiple tributaries to
Warm Springs Creek converge in the proximity of the study area, including Cable Creek, Twin Lakes
Creek, and Storm Creek. The Stumptown Pond and the AMC Pond are near the highway just west of
Anaconda in the study area while Silver Lake and Georgetown Lake are adjacent to the highway near the
northern terminus in the study area. According to the MFWP Montana Fisheries Information System
(MFISH) database (2010), fish species occurring in Warm Springs Creek within the study area are brown
trout (ENN ‐Exotic Species – not native to Montana), longnose sucker, mottled sculpin, rainbow trout
slimy sculpin, brook trout (ENN), bull trout (SOC), mountain whitefish, and westslope cutthroat (SOC).
The stream stretch between river miles 2.6 and 32.6 is considered bull trout core area, but not node
area. River miles from 24.2 to 32.6 are considered MFWP protected areas for big wintering/spring
usage.
The tributaries and other drainages within the study area have the potential to support all or some of
the fish species listed above. Fish passage and/or barrier opportunities must be considered at all
affected drainages if a project is forwarded from this corridor study.

E X I S T I NG AND P RO J E C T ED COND I T I ON S
AUGUST 2011
28
Warm Springs Creek is rated as an outstanding fisheries resource value by MFWP and receives
recreational angler use year round. Ponds and lakes within the study area are also recreation
destinations. Silver Lake and Georgetown Lake are managed as a recreational fisher resource by MFWP.
There are several access roads from the highway into adjacent public lands as well.
3.10 THREATENED AND ENDANGERED SPECIES
The federal list of endangered and threatened species is maintained by the United States Federal
Wildlife Service (USFWS). Species on the list receive protection under the Endangered Species Act (ESA).
An ‘endangered’ species is one that is in danger of extinction throughout all or a significant portion of its
range. A ‘threatened’ species is one that is likely to become endangered in the foreseeable future. The
USFWS also keeps a list of species that are candidates or proposed for possible addition to the federal
list. Table 3.1 lists the threatened, endangered or candidate species occurring in the study area
according to the USFWA.
Table 3.1: Threatened and Endangered Species14
Common Name Scientific Name ESA Status
Bull Trout Salvelinus confluentus LT/CH/PCH
Wolverine Gulo gulo C
LT – Listed Threatened
CH – Critical Habitat
PCH – Potential Critical Habitat
C – Candidate
Warm Springs Creek is designated Bull Trout critical habitat. If a project is developed from the corridor
study, an evaluation of potential effects to bull trout and wolverine will need to be completed during
the project development process.
3.11 SPECIES OF CONCERN
Montana SOC are native animals breeding in the state that are considered be “at risk” due to declining
population trends, threats to their habitats, and/or restricted distribution. Designation of a species as a
Montana SOC is not a statutory or regulatory classification. Instead, these designations provide a basis
for resource managers and decision‐makers to direct limited resources to priority data collection needs
and address conservation needs proactively.
14 US Fish and Wildlife Service
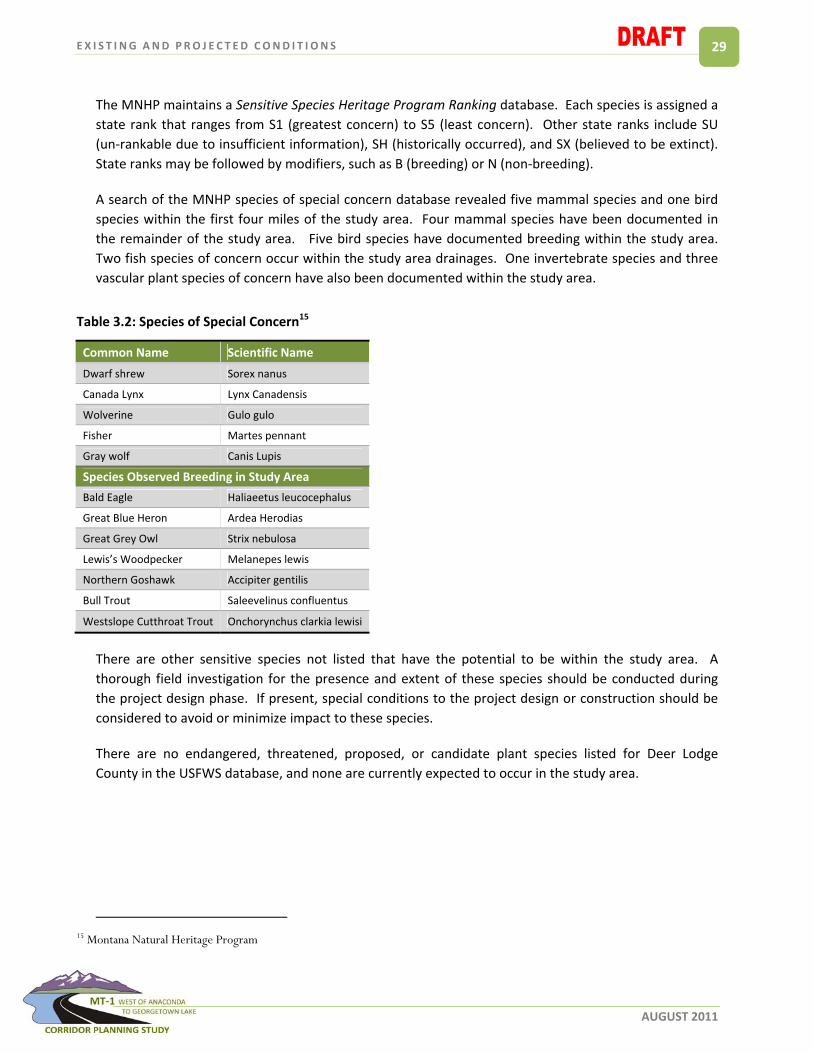
E X I S T I NG AND P RO J E C T ED COND I T I ON S
AUGUST 2011
29
The MNHP maintains a Sensitive Species Heritage Program Ranking database. Each species is assigned a
state rank that ranges from S1 (greatest concern) to S5 (least concern). Other state ranks include SU
(un‐rankable due to insufficient information), SH (historically occurred), and SX (believed to be extinct).
State ranks may be followed by modifiers, such as B (breeding) or N (non‐breeding).
A search of the MNHP species of special concern database revealed five mammal species and one bird
species within the first four miles of the study area. Four mammal species have been documented in
the remainder of the study area. Five bird species have documented breeding within the study area.
Two fish species of concern occur within the study area drainages. One invertebrate species and three
vascular plant species of concern have also been documented within the study area.
Table 3.2: Species of Special Concern15
Common Name Scientific Name
Dwarf shrew Sorex nanus
Canada Lynx Lynx Canadensis
Wolverine Gulo gulo
Fisher Martes pennant
Gray wolf Canis Lupis
Species Observed Breeding in Study Area
Bald Eagle Haliaeetus leucocephalus
Great Blue Heron Ardea Herodias
Great Grey Owl Strix nebulosa
Lewis’s Woodpecker Melanepes lewis
Northern Goshawk Accipiter gentilis
Bull Trout Saleevelinus confluentus
Westslope Cutthroat Trout Onchorynchus clarkia lewisi
There are other sensitive species not listed that have the potential to be within the study area. A
thorough field investigation for the presence and extent of these species should be conducted during
the project design phase. If present, special conditions to the project design or construction should be
considered to avoid or minimize impact to these species.
There are no endangered, threatened, proposed, or candidate plant species listed for Deer Lodge
County in the USFWS database, and none are currently expected to occur in the study area.
15 Montana Natural Heritage Program
E X I S T I NG AND P RO J E C T ED COND I T I ON S
AUGUST 2011
30
3.12 WILDLIFE AND TRAFFIC CONFLICTS
A high number of animal / vehicle conflicts exist in the study area. As noted in section 1.12, there is a
concentration of wild animal‐vehicle collisions between RP 14.7 and 15.7. Reported incidences that
included collisions with wild animals mostly included single animal collisions; however, one crash
involved eight bighorn sheep that were killed at RP 14.4. Carcass data for the corridor indicates 87 total
carcasses recovered along the corridor in the time period from 2006‐2010. The 87 carcasses does not
indicate 87 crashes, as four crashes killed two animals each, and one crash included the eight bighorn
sheep as discussed previously. According to the carcass data, 71 wild animal‐vehicle collisions occurred
along the corridor.
A cluster of wild animal‐vehicle collisions has been identified between reference points 11.2 and 17, as
almost 50% of the wild animal‐vehicle collisions occurring in this corridor have occurred through this 5.8
mile stretch, according to the carcass data. In the fall of 2010, eight bighorn sheep, including two trophy
rams, were killed in a single incident on MT‐1, approximately a half‐mile after westbound travelers leave
the 45 mph zone and enter the 70 mph zone (approximately RP 14.5). Other clusters have been
identified between reference points 17.8 and 19.8, with 12 collisions (17%), and also reference points 21
to 22.1, with 9 crashes (13%).
3.13 WATER RESOURCES AND FISHERIES
The Montana Department of Environmental Quality (DEQ), Clean Water Act Information Center website
provides information for the study area. The study area is within the Upper Clark Fork watershed, in the
Columbia basin. Warm Springs Creek parallels MT‐1 throughout the study area. Numerous intermittent
and ephemeral tributaries, including Cable Creek, Twin Lakes Creek, Storm Creek, Big Gulch, Olson
Gulch, and Grays Gulch flow out of the mountains on either side of the highway. Warm Springs Creek is
considered to be in water quality category 4C. Total Maximum Daily Loads (TMDL) are not required as
no pollutant‐related impairment is identified. Warm Spring Creek fully supports beneficial uses
including agriculture, industrial and primary contact recreation. The creek partially supports aquatic life
and cold water fishery. Twin Lakes Creek also supports aquatic life and is an important cold water
fishery.
Warm Springs Creek crosses the highway at approximately RP 10.5, near the beginning of the study
area, and again at RP 17.0. The North Fork of Flint Creek crosses the highway at RP 25.9, joining Flint
Creek in the vicinity of Georgetown Lake. Storm Lake Creek crosses the highway near RP 20.8 and joins
Cable Creek just above its highway crossing at RP 20.1. Storm Lake Creek parallels the highway and joins
Warm Springs Creek near RP 19.0. Foster Creek and Barker Creek join Warm Springs Creek near RP 17.0.
Numerous intermittent and ephemeral drainages as well as irrigation ditches flow out of the mountains
on either side of the highway within the study area. Georgetown Lake is immediately west of the
highway between RP 22.0 and 23.0.

E X I S T I NG AND P RO J E C T ED COND I T I ON S
AUGUST 2011
31
3.14 WATER QUALITY
The Environmental Scan contains details regarding the water quality report available through the
Montana DEQ on the Upper Clark Fork River tributaries. The Upper Clark Fork watershed is listed in the
2010 Integrated 303(d)/305(b) Water Quality Report for Montana by the MDEQ. The water bodies
within this watershed that are located in the study area are designated as Category 5 and Category 4C.
Category 5 water bodies are waters where one or more applicable beneficial use has been assessed as
being impaired or threatened, and a TMDL of the pollutant is required to address the factors causing the
impairment or threat. Warm Springs Creek (MT76G002_012) has probable cause of impairment from
arsenic to aquatic life, cold water fishery, and drinking water and probable cause of impairment from
cadmium, copper, lead zinc, and iron to aquatic life and cold water fishery.
Category 4C water bodies are waters where TDMLs are not required as no pollutant‐related use
impairment is identified. TMDLs have not yet been written for water bodies in this watershed.
3.15 GROUNDWATER AND IRRIGATION
Deer Lodge County does not currently have a Local Water Quality District (LWQD) which is a tool local
governments can use to protect, preserve and improve the quality of surface water and groundwater
within the district. If a LWQD is developed for the county, water quality protection measures may have
to be addressed with any project that may develop from the corridor study.
Very little irrigated farm land exists in Deer Lodge County adjacent to the study area. Any impact to
lateral and longitudinal irrigation facilities that may exist in the study area would need to be studied and
mitigated for by MDT during project development; this could include such measures as relocation of
canals and ditches in consultation with land owners and consideration of the impact to farming
operations.
3.16 WETLANDS
The majority of the wetlands are within the riparian bottom lands associated with the major drainages
in the study area, especially Warm Springs Creek, its tributaries, and the major draws coming out of the
mountains. A notable amount of potential wetland area occurs in the valley adjacent to the current
highway alignment. Any project forwarded from this corridor study has the potential to impact wetland
areas, riparian areas, and streams. Formal wetland delineations would be necessary for any proposed
highway‐related actions in the corridor, as required by Section 404 of the Clean Water Act and Executive
Order 11990, Protection of wetlands. Evaluation of stream impacts would need to be completed
according to USACOE May, 2010 Stream Mitigation Procedure.
E X I S T I NG AND P RO J E C T ED COND I T I ON S
AUGUST 2011
32
Mapping data for the study area was provided by the National Wetland Inventory (NWI). West Valley,
Silver Lake, and Georgetown Lake area identified areas within the confines of the study. West Valley
and Silver Lake mapping was completed from 2006 National Agricultural Imagery Program (NAIP)
imagery and available from NWI or from the Montana Wetlands Map. The NWI maps are typically
generated based on aerial and satellite imagery, and are not accurate or detailed enough for MDT
project wetland determination and/or delineation.
3.17 FLOOD PLAINS AND FLOODWAYS
Executive Order (EO) 11988, Floodplain Management, required federal agencies to avoid direct or
indirect support of floodplain development whenever a practicable alternative exists. EO 11988 and 23
CFT 650 Part A requires an evaluation of project alternatives to determine the extent of any
encroachment into the base floodplain. The base flood (100‐year flood) is the regulatory standard used
by federal agencies and most states to administer floodplain management programs. A “floodplain” is
defined as lowland and relatively flat areas adjoining inland and coastal waters, including flood‐prone
areas of offshore islands, with a one percent or greater chance of flooding in a given year. As described
in FHWA’s floodplain regulation (23 CFR 650 Part A), floodplains provide natural beneficial values serving
as areas for fish, wildlife, plants, open space, natural flood moderation, water quality maintenance, and
groundwater recharge.
Within most of the study area, there are 100‐year floodplains delineated by the Federal Emergency
Management Agency (FEMA). There are FEMA issued flood maps for the east end of the study area
within Deer Lodge County, however no maps are available for the west end in the Georgetown Lake
vicinity where the map index notes that it is in a Zone D – undetermined flood hazard. If a project is
forwarded from the corridor study, coordination with Deer Lodge County should be conducted during
the project development process to obtain necessary floodplain permits.
3.18 AIR QUALITY
The MT‐1 Anaconda to Georgetown Lake study area is not a designated “non‐attainment” area which is
defined as an area that does not meet the National Ambient Air Quality Standards (NAAQS) for PM 2.5,
PM 10, or carbon monoxide (CO), nor is it near any area so designated as non‐attainment.
3.19 TRAFFIC NOISE
Traffic noise may need to be evaluated for any planned improvements to the MT‐1 Anaconda to
Georgetown Lake corridor if a project is developed that involves a substantial shift in the horizontal or
vertical alignments of the roadway, increasing the number of thru‐lanes, or increasing the traffic speed
and volume. If such improvements are planned then the project would be considered a Type I project.
Type I projects require a detailed noise analysis, including measuring ambient noise levels at selected
E X I S T I NG AND P RO J E C T ED COND I T I ON S
AUGUST 2011
33
receivers and modeling design year noise levels using projected traffic volumes. Noise abatement
measures would be considered for any project if noise levels approach or substantially exceed the noise
abatement criteria. If traffic noise impacts are shown to exist on a project, possible abatement
measures may be considered, but are not limited to:
Altering the horizontal or vertical alignment;
Constructing noise barriers such as sound walls or earthen berms; and/or
Decreasing traffic speed limits.
3.20 HAZARDOUS SUBSTANCES
The Montana Natural Resource Information System (NRIS) database was searched for underground
storage tank sites, leaking underground storage tank sites, abandoned mine sites, remediation response
sites, landfills, National Priority sites, hazardous waste, crude oil pipelines, and toxic release inventory
sites in the vicinity of the study area. The following sites within the corridor study area boundary were
initially identified with potential contamination impacts:
Several underground storage tank locations
Four leaking underground storage tank locations
Several abandoned and inactive mines sites and;
One Federal Superfund program site (Georgetown Railroad)
Given the lack of location precision in the NRIS database, ground review along the corridor would be
necessary to determine if any of these sites are in close proximity to the road and/or any proposed
alignments. Further evaluation may be needed at specific sites to determine if contamination will be
encountered during construction.

E X I S T I NG AND P RO J E C T ED COND I T I ON S
AUGUST 2011
34
4.0 Areas of Concern Summary This section provides a summary of the areas of concern within the study area. These areas were
identified through as‐built drawings, field review, and other available data. A summary of the identified
areas of concern are shown in Table 4.1. More discussion has been provided in the previous sections,
and is reiterated here as appropriate. The order the areas of concern are listed do not imply importance
or priority of one over the other.
4.1 GEOMETRICS
Geometric areas of concern include roadside safety (including cut and fill slopes), sub‐standard
horizontal and vertical curvature (including k‐values and grades), and sight distance. The geometric
areas of concern have been previously described and are summarized in tabular format in Table 4.1 by
reference post. They are also shown graphically in Figure 4.1.
Table 4.1: Areas of Concern
Location (RP) Feature Cause Description
10.9 Vertical Curve K‐Value 134.6 K‐value is below standards for level terrain
12.4 ‐ 13.4 Roadside Safety Clear Zone Cut slope with fallen rock
13.9 ‐ 14.2 Roadside Safety Clear Zone Heavy vegetation
14.0 ‐ 14.1 Grade Grade 3.16% Grade is greater than standards for level terrain
15.3 ‐ 15.5 Grade Grade 5.52% Grade is greater than standards for rolling terrain
15.3 Vertical Curve K‐Value 121.6 K‐value is below standards for level terrain
15.6 ‐ 15.8 Grade Grade 6.00% Grade is greater than standards for rolling terrain
15.6 Vertical Curve K‐Value 89.3 K‐value is below standards for rolling terrain
16.4 Roadside Safety Slope Steep fill slope
16.5 ‐ 16.8 Roadside Safety Slope Steep fill slope
18.9 ‐ 19.5 Grade Grade 4.16% Grade is greater than standards for rolling terrain
19.5 ‐ 20.1 Grade Grade 5.50% Grade is greater than standards for rolling terrain
21.1 ‐ 21.4 Roadside Safety Slope Cut slope with fallen rock
21.7 ‐ 21.8 Roadside Safety Slope Cut slope with fallen rock
22.1 ‐ 22.6 Roadside Safety Slope Cut slope with fallen rock
22.9 ‐ 23.1 Roadside Safety Slope Cut slope with fallen rock
22.9 Horizontal Curve Radius 1146' Curve radius is below standards for level terrain
23.2 Horizontal Curve Radius 1146' Curve radius is below standards for level terrain
23.9 Vertical Curve K‐Value 94.8 K‐value is below standards for rolling terrain
23.9 Vertical Curve SSD 455.7' Stopping sight distance is below standards for rolling terrain
24.0 Horizontal Curve Radius 1146' Curve radius is below standards for level terrain
24.2 Roadside Safety Horizontal Curve Poor sight distance
24.8 Roadside Safety Slope Steep fill slope
25.0 ‐ 25.3 Roadside Safety Horizontal Curve Poor sight distance

E X I S T I NG AND P RO J E C T ED COND I T I ON S
AUGUST 2011
35
25.0 Roadside Safety Slope Sharp drop‐off into water
25.4 ‐ 25.6 Roadside Safety Slope Shoulder and side slope to water
25.5 Roadside Safety Slope / Intersection Steep slope into water at intersection
25.9 Roadside Safety Bridge ends Concrete bridge ends
26.1 Roadside Safety Slope Steep fill slope
26.2 ‐ 26.8 Roadside Safety Slope Steep fill slope
26.6 ‐ 26.8 Grade Grade 4.54% Grade is greater than standards for rolling terrain
27.1 Horizontal Curve Radius 1146' Curve radius is below standards for level terrain
27.3 ‐ 27.4 Grade Grade 5.83% Grade is greater than standards for rolling terrain
27.3 Vertical Curve K‐Value 85.3 K‐value is below standards for rolling terrain
27.3 Vertical Curve SSD 429.1' Stopping sight distance is below standards for rolling terrain
4.2 SPEEDS
Vehicle speed data was collected at 4 locations along the corridor. As shown in Table 4.2, the results of
the speed data collection indicate that the posted speed limits at RP 11.2 (35 mph), RP 14.0 (45 mph),
and RP 24.4 (60 mph) may be low compared to the 85th percentile speeds. At RP 11.2, 85th percentile
speeds are more than 7 mph higher than the 35 mph posted speed limit. Additionally at RP 14.0, 85th
percentile speeds are almost 7 mph higher than the posted speed limit of 45 mph. The 85th percentile is
an engineering parameter used by traffic engineers in determining roadway speeds. It is the speed at
which 85 percent of vehicles travel at or below. For example, if the 85th percentile speed is 45 mph, it
means 85 percent of vehicles are traveling at or below 45 mph. It is generally recommended that the
posted speed limit be within 5 mph of the 85th percentile speed.
Table 4.2: Speed Data
Location (RP) Posted Speed Limit
(mph) ADT (vpd)
85th Percentile Speed(mph)
11.2 35 3902 42.2
14.0 45 2333 51.9
15.3 70 2145 68.5
24.4 60 1539 65.4
E X I S T I NG AND P RO J E C T ED COND I T I ON S
AUGUST 2011
36
4.3 ACCESS DENSITY
A high concentration of approaches exists in the first five miles west of Anaconda, with over 16
approaches per mile. The most dense concentration of approaches exists along the one segment
between RP 10.8 and 11.8 with 34 approaches. Access density decreases west of West Valley towards
Georgetown Lake. Between West Valley and Georgetown Lake, access density ranges between
approximately 5.5 and 6.6 access points per mile. The high density of accesses within the first five miles
is a concern due to a variety of factors. The area is in a speed transition area from 25 mph to 45 mph.
The acceleration and deceleration of vehicles turning into and out of the accesses cause operational
concerns on the mainline of MT‐1. As roadway width is limited in this area, there is no “widened”
shoulder available to exit the traffic stream.
4.4 WILDLIFE CONNECTIVITY AND WILDLIFE-VEHICLE
COLLISIONS
A large bighorn sheep herd exists in this corridor study area. Bighorn sheep inhabit both sides of MT‐1
throughout the corridor study area, but especially near the Wildlife Management Area at Garrity
Mountain. Wildlife connectivity is a concern along the corridor as the bighorn sheep herd has been
characterized as vulnerable by MFWP staff due to pneumonia outbreaks, vehicle collisions, subdivision
encroachment, and natural attrition. The bighorn sheep are attracted to the salt in de‐icing material
used on the highway in the winter season. The use of de‐icing material may cause bighorn sheep to
concentrate on and adjacent to the roadway, increasing the incidents of vehicle collisions with bighorn
sheep.
The entire corridor experiences animal‐vehicle collisions as evidenced by crash reports and carcass
removal data. Of particular concern is the occurrence of moose fatalities occurring in the last third of
the corridor near Georgetown Lake. There is also the prevalence of deer collisions throughout the
entire corridor.
Fish passage through culverts and bridges, and entrainment in irrigation canals, is also of concern
throughout the corridor.
4.5 ALTERNATIVE USE FACILITIES
Local planning objectives include the future extension of trails infrastructure west of Anaconda to the
West Valley area in the near future. Long term objectives include the provision of trails the entire length
of the corridor to Georgetown Lake to complement the scenic highway.

E X I S T I NG AND P RO J E C T ED COND I T I ON S
AUGUST 2011
37
4.6 LOCAL INFRASTRUCTURE EXPANSION
Local planning efforts have included the future extension of wastewater system infrastructure west of
Anaconda to the West Valley area in the near future. The locating of this future infrastructure in the
corridor is important to optimize service to areas residents and ensure that maintenance and access to
the infrastructure is allowed.
Figure 4.1: Geometric Areas of Concern