Embed Size (px)
Citation preview

Denver Public SchoolsThe Impact of School-BasedPerformance Management on Student Achievement

Denver Public Schools / Michael & Susan Dell Foundation 2
Performance management gives educators insight into what is working
to improve student performance and what is not, including relevant,
timely information at the district, school, classroom, and student levels.
A school-based performance management culture is created by first having strong leadership dedicated to positively affecting student achievement. Schools must then put timely, relevant, and actionable data and useful tools and reports into the hands of well-trained teachers and principals for use in a regular, structured process of data analysis, goal setting, planning differentiated instruction and interventions, and follow-up with students. But performance management is about more than just data and information. It’s about the students—and helping them graduate from high school and get to and through college and ready for life’s many challenges.
For the past three years, the educators of Denver Public Schools (DPS) have worked diligently to build a performance management culture on their 152 campuses. The tools and processes DPS has used provide any school that is pursuing a data-driven culture with valuable insight. The definition of performance management helps schools understand what must be done to create a performance-driven culture. Denver Public Schools’ efforts show us how it can be done.
David Suppes, Chief Operating Officer of Denver Public Schools, says that moving forward, DPS will emphasize the work that is having the most impact on the district’s ability to outpace the state in student achievement. “We will focus on the classroom and what happens in class. There will continue to be an instructional focus. How do we achieve excellence and consistency in the classroom? What tools need to be available? What processes need to be in place to use those tools?"
"We have some excellent schools and every school has some excellent classrooms, but it’s not consistent. We’ve got to use the data we have to understand what excellent teachers do, and then give them the tools and information they need and train them on how to improve,” he said.
“At the highest level, the challenge in public education is moving away from a monopoly—away from being internally focused, resistant to change, and a sense of entitlement to what you have instead of proving your worth. This approach doesn’t mean people in these environments don’t work hard or don’t care. But there’s just no accountability in a culture like that.”
David Suppes COO, Denver Public Schools

Denver Public Schools / Michael & Susan Dell Foundation 3
“There’s a measurement process in place, and we’ll continue to improve it. But now we must continue to implement performance management in the classroom to provide the appropriate tools, data and evaluation processes. We strive to understand where we are failing, diagnose the issue, fix it and measure the effectiveness of our work.”
In this report, we will define school-based performance management, outline the environmental factors that enable a data-driven culture, and highlight the efforts of Denver Public Schools (DPS) to demonstrate school-based performance management’s four major components.
DEFINING SCHOOL-BASED PERFORMANCE MANAGEMENT
Performance management–as defined in a school-based environment–is a culture of data-driven decision making that is linked to strategic objectives and permeates all levels of an organization.
School-based performance management includes four major components:
• Timely, relevant, and actionable data and metrics linked to improving student performance;
• A regular process, dedicated time, and set of protocols wherein data is analyzed, action and intervention plans are developed, and follow-up occurs;
• Useful tools and reports to organize and deliver the data and metrics to educators or other stakeholders; and
• Training and support so that users understand how to analyze and take action on what the data tells them.
Denver Public Schools / Michael & Susan Dell Foundation 4
When a school district commits to implementing performance management and using data-driven instruction, they take a major step toward building a culture of responsibility and driving their students and faculty toward excellence.
Goals, strategies and strong leadership are critical cornerstones in a performance management culture. Using a new approach to utilize data in the district and the classroom, performance management allows educators to put action plans in place to influence student achievement and graduation rates before the child fails the grade level or the district fails to serve the needs of the child. But performance management can’t be considered just another initiative. The success of the performance management implementation begins and largely depends on the strength of the schools’ leaders and the expectations they build for data-driven decision making culture. Everyone—from the school board to the custodians—must share the same mission and focus on changing behaviors for the betterment of the students. If the performance management goals relate to student-centered work, they create a common thread among all employees.
In Denver Public Schools, the performance management rollout included:
• �The�School�Performance�Framework�(SPF) is an accountability tool that allows for the measurement of achievement growth, instead of merely status, with principals receiving extra compensation for the first time for outstanding student performance as tracked by the SPF. For the lowest-performing schools on the SPF, interventions were targeted.
• �An�online�portal (with all data refreshed at least nightly and some data updated even in real time) that allows single sign-on access to district data (a portal called Digital Doors) for administrators (principals, data coaches, and instructional superintendents) and for teachers instead of using spreadsheets, a ruler, and a highlighter.
• �A�request�for�proposal�(RFP)�process for a comprehensive instructional management system that links data analysis and reporting to assessments, curriculum, and district portals.
• �Metrics�for�eight�operational�departments in the central office, where previous metrics were incomplete and the focus was on volume rather than efficiency and cycle time.
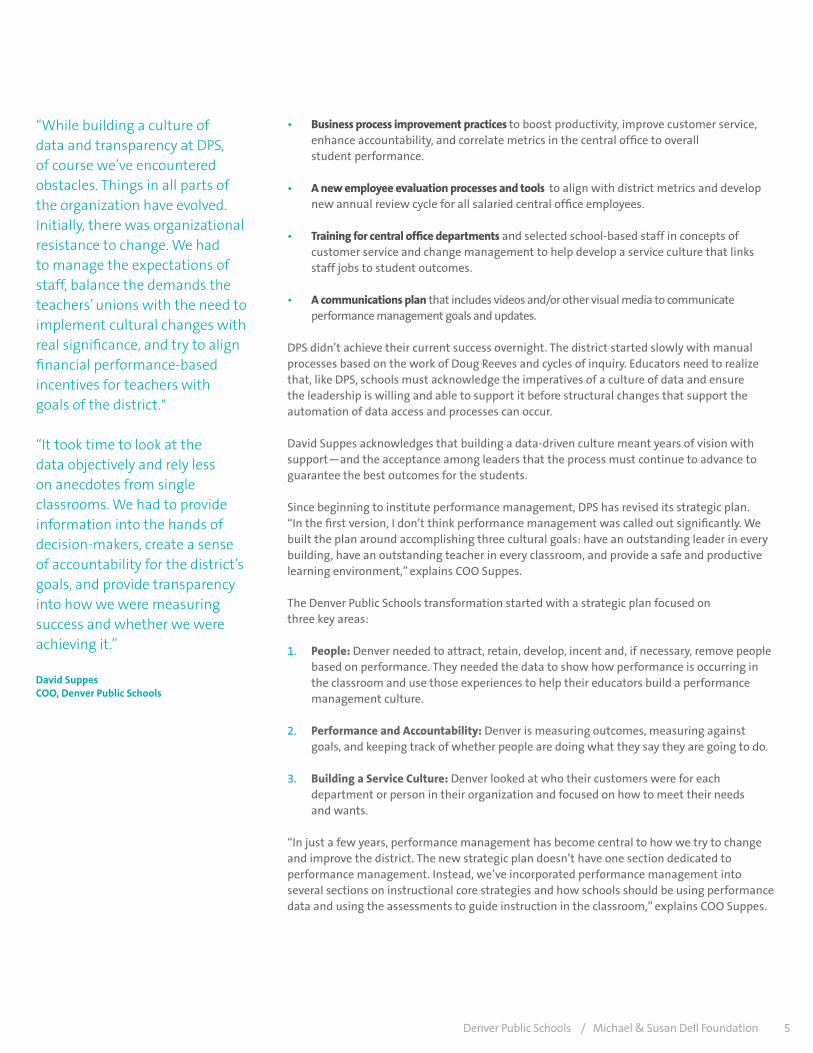
BUILDING AN ENVIRONMENT FOR PERFORMANCE MANAGEMENT
PeRFoRMAnceMAnAgeMenT
AcademicProjects
SchoolPerformanceFramework
Data SchoolImprovement
Administrators
Parent/Student/Staff Surveys
Administrator/Teacher Portal
Employee PerformanceManagement
Process
Service andPerformanceManagement
Training
Data Governance
PrincipalSurvey
Central OfficeMetrics
OperationsProjects
Communications
Denver Public Schools / Michael & Susan Dell Foundation 5
• Business�process�improvement�practices�to boost productivity, improve customer service, enhance accountability, and correlate metrics in the central office to overall student performance.
• �A�new�employee�evaluation�processes�and�tools��to align with district metrics and develop new annual review cycle for all salaried central office employees.
• Training�for�central�office�departments and selected school-based staff in concepts of customer service and change management to help develop a service culture that links staff jobs to student outcomes.
• �A�communications�plan�that includes videos and/or other visual media to communicate performance management goals and updates.
DPS didn’t achieve their current success overnight. The district started slowly with manual processes based on the work of Doug Reeves and cycles of inquiry. Educators need to realize that, like DPS, schools must acknowledge the imperatives of a culture of data and ensure the leadership is willing and able to support it before structural changes that support the automation of data access and processes can occur.
David Suppes acknowledges that building a data-driven culture meant years of vision with support—and the acceptance among leaders that the process must continue to advance to guarantee the best outcomes for the students.
Since beginning to institute performance management, DPS has revised its strategic plan. “In the first version, I don’t think performance management was called out significantly. We built the plan around accomplishing three cultural goals: have an outstanding leader in every building, have an outstanding teacher in every classroom, and provide a safe and productive learning environment,” explains COO Suppes.
The Denver Public Schools transformation started with a strategic plan focused on three key areas:
1. �People: Denver needed to attract, retain, develop, incent and, if necessary, remove people based on performance. They needed the data to show how performance is occurring in the classroom and use those experiences to help their educators build a performance management culture.
2. Performance�and�Accountability: Denver is measuring outcomes, measuring against goals, and keeping track of whether people are doing what they say they are going to do.
3. �Building�a�Service�culture: Denver looked at who their customers were for each department or person in their organization and focused on how to meet their needs and wants.
“In just a few years, performance management has become central to how we try to change and improve the district. The new strategic plan doesn’t have one section dedicated to performance management. Instead, we’ve incorporated performance management into several sections on instructional core strategies and how schools should be using performance data and using the assessments to guide instruction in the classroom,” explains COO Suppes.
“While building a culture of data and transparency at DPS, of course we’ve encountered obstacles. Things in all parts of the organization have evolved. Initially, there was organizational resistance to change. We had to manage the expectations of staff, balance the demands the teachers’ unions with the need to implement cultural changes with real significance, and try to align financial performance-based incentives for teachers with goals of the district."
“It took time to look at the data objectively and rely less on anecdotes from single classrooms. We had to provide information into the hands of decision-makers, create a sense of accountability for the district’s goals, and provide transparency into how we were measuring success and whether we were achieving it.”
David Suppes COO, Denver Public Schools

Denver Public Schools / Michael & Susan Dell Foundation 6
BUILDING COMMITMENT THROUGH CULTURE AND LEADERSHIP
As a culture and standard of measurement, performance management does more than provide reams of data to teachers and administrators. It simplifies the data and makes the information actionable. It gives the data and information purpose. It answers key questions that change behaviors. It empowers districts with information that helps predict and manage performance, rather than just track it.
It is one thing to generate excitement among teachers, but it is another challenge to empower faculty across the complete education spectrum. As tools and technology are implemented to deliver the data and information to teachers, school leaders should expect many questions to be asked and opponents to emerge. It will be necessary for leaders to remain focused on their vision, while having access to comprehensive data and welcoming feedback from their peers. They will be effective if they concentrate on developing and monitoring the performance management implementation and continually seek to improve the data and the processes that make it actionable.
Denver Public Schools Director of Strategy Jason Martinez remembers fondly the way he and his colleagues in Denver approached the task of building support and enthusiasm for performance management.
“Getting the word out was actually fun. Within any large organization an informal communication network exists – it’s called a gossip system. Ours is highly robust. Within that gossip system there are some individuals who are very influential. Our strategy was to share with them the initial concept of performance management and ask their opinion about it. One, they value that they’ve been asked. And two, they value the fact that they’re getting information and then they share that information with others.”
“Even before people had access to the Administrator Portal, there was a tremendous amount of buzz among the principals who were ultimately the end users. They were all eager and wanting to use the tool. That was extremely helpful. Then we went around and did demonstrations. If they had a task to do, we showed them how they could do that task inside the portal. It was a very effective way to get early buy-in.”
Denver Public Schools / Michael & Susan Dell Foundation 7
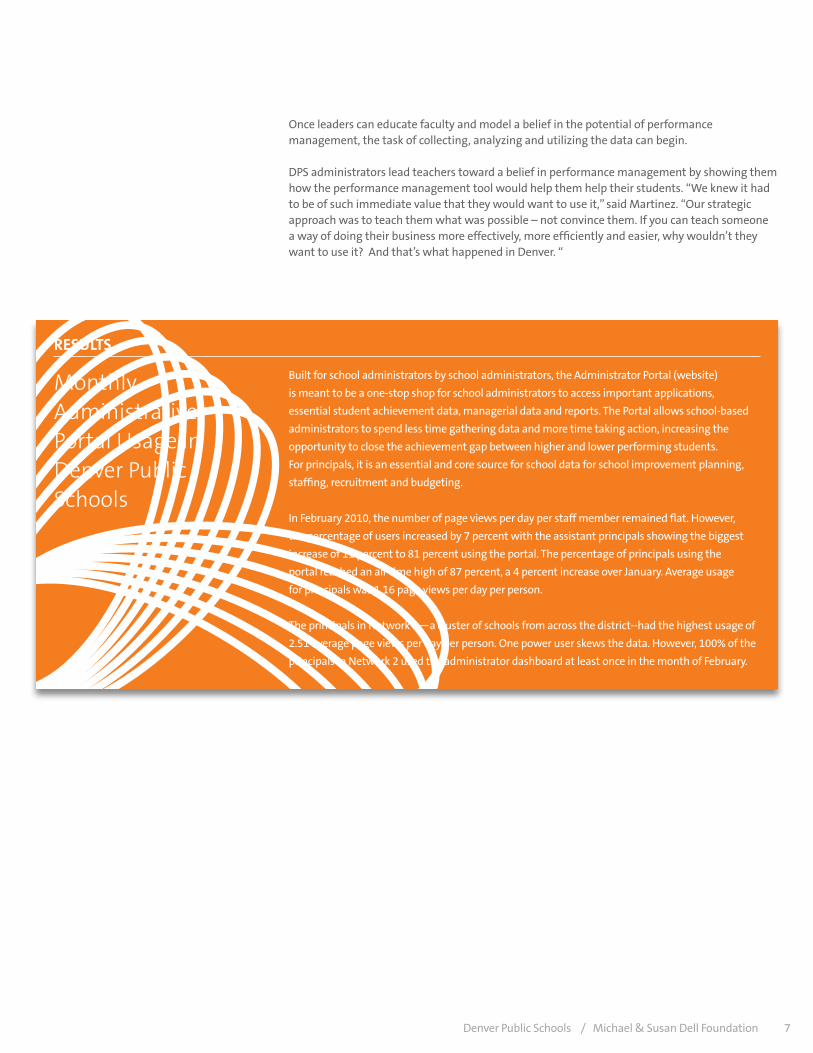
ReSUlTS
Monthly Administrative Portal Usage in Denver Public Schools
Built for school administrators by school administrators, the Administrator Portal (website)
is meant to be a one-stop shop for school administrators to access important applications,
essential student achievement data, managerial data and reports. The Portal allows school-based
administrators to spend less time gathering data and more time taking action, increasing the
opportunity to close the achievement gap between higher and lower performing students.
For principals, it is an essential and core source for school data for school improvement planning,
staffing, recruitment and budgeting.
In February 2010, the number of page views per day per staff member remained flat. However,
the percentage of users increased by 7 percent with the assistant principals showing the biggest
increase of 11 percent to 81 percent using the portal. The percentage of principals using the
portal reached an all-time high of 87 percent, a 4 percent increase over January. Average usage
for principals was 1.16 page views per day per person.
The principals in Network 2—a cluster of schools from across the district--had the highest usage of
2.51 average page views per day per person. One power user skews the data. However, 100% of the
principals in Network 2 used the administrator dashboard at least once in the month of February.
Once leaders can educate faculty and model a belief in the potential of performance management, the task of collecting, analyzing and utilizing the data can begin.
DPS administrators lead teachers toward a belief in performance management by showing them how the performance management tool would help them help their students. “We knew it had to be of such immediate value that they would want to use it,” said Martinez. “Our strategic approach was to teach them what was possible – not convince them. If you can teach someone a way of doing their business more effectively, more efficiently and easier, why wouldn’t they want to use it? And that’s what happened in Denver. “
Denver Public Schools / Michael & Susan Dell Foundation 8
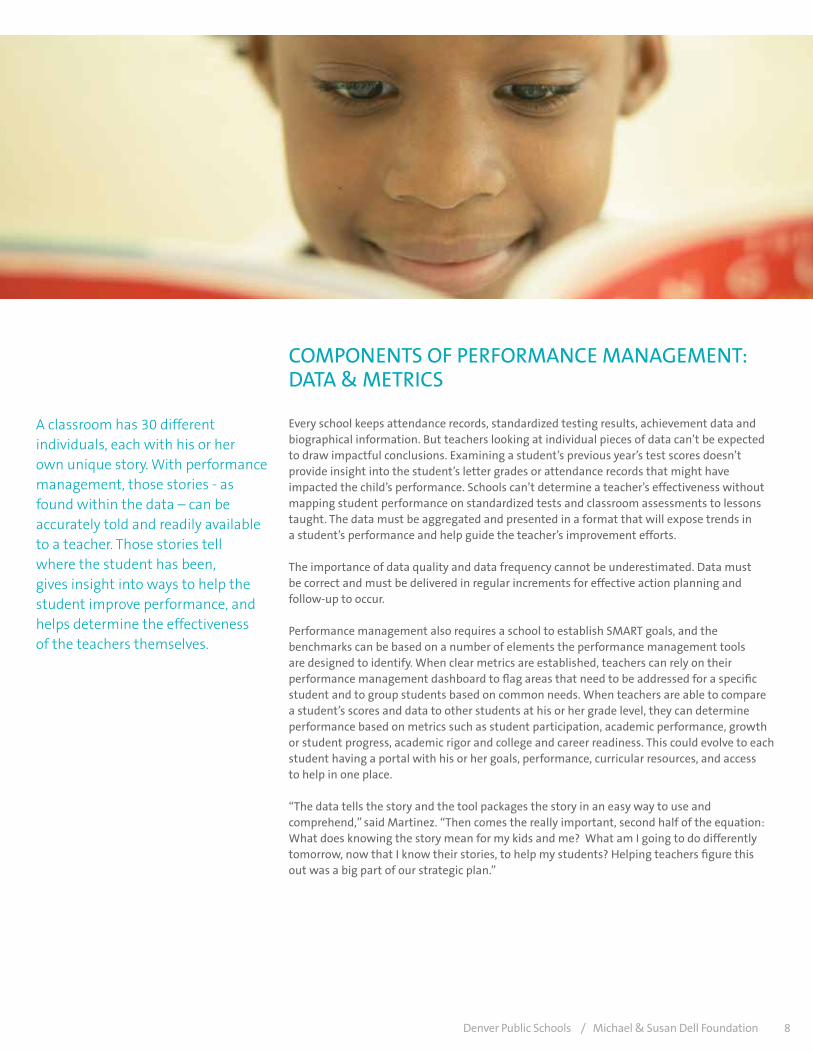
COMPONENTS OF PERFORMANCE MANAGEMENT: DATA & METRICS
A classroom has 30 different individuals, each with his or her own unique story. With performance management, those stories - as found within the data – can be accurately told and readily available to a teacher. Those stories tell where the student has been, gives insight into ways to help the student improve performance, and helps determine the effectiveness of the teachers themselves.
Every school keeps attendance records, standardized testing results, achievement data and biographical information. But teachers looking at individual pieces of data can’t be expected to draw impactful conclusions. Examining a student’s previous year’s test scores doesn’t provide insight into the student’s letter grades or attendance records that might have impacted the child’s performance. Schools can’t determine a teacher’s effectiveness without mapping student performance on standardized tests and classroom assessments to lessons taught. The data must be aggregated and presented in a format that will expose trends in a student’s performance and help guide the teacher’s improvement efforts.
The importance of data quality and data frequency cannot be underestimated. Data must be correct and must be delivered in regular increments for effective action planning and follow-up to occur.
Performance management also requires a school to establish SMART goals, and the benchmarks can be based on a number of elements the performance management tools are designed to identify. When clear metrics are established, teachers can rely on their performance management dashboard to flag areas that need to be addressed for a specific student and to group students based on common needs. When teachers are able to compare a student’s scores and data to other students at his or her grade level, they can determine performance based on metrics such as student participation, academic performance, growth or student progress, academic rigor and college and career readiness. This could evolve to each student having a portal with his or her goals, performance, curricular resources, and access to help in one place.
“The data tells the story and the tool packages the story in an easy way to use and comprehend,” said Martinez. “Then comes the really important, second half of the equation: What does knowing the story mean for my kids and me? What am I going to do differently tomorrow, now that I know their stories, to help my students? Helping teachers figure this out was a big part of our strategic plan.”
Denver Public Schools / Michael & Susan Dell Foundation 9
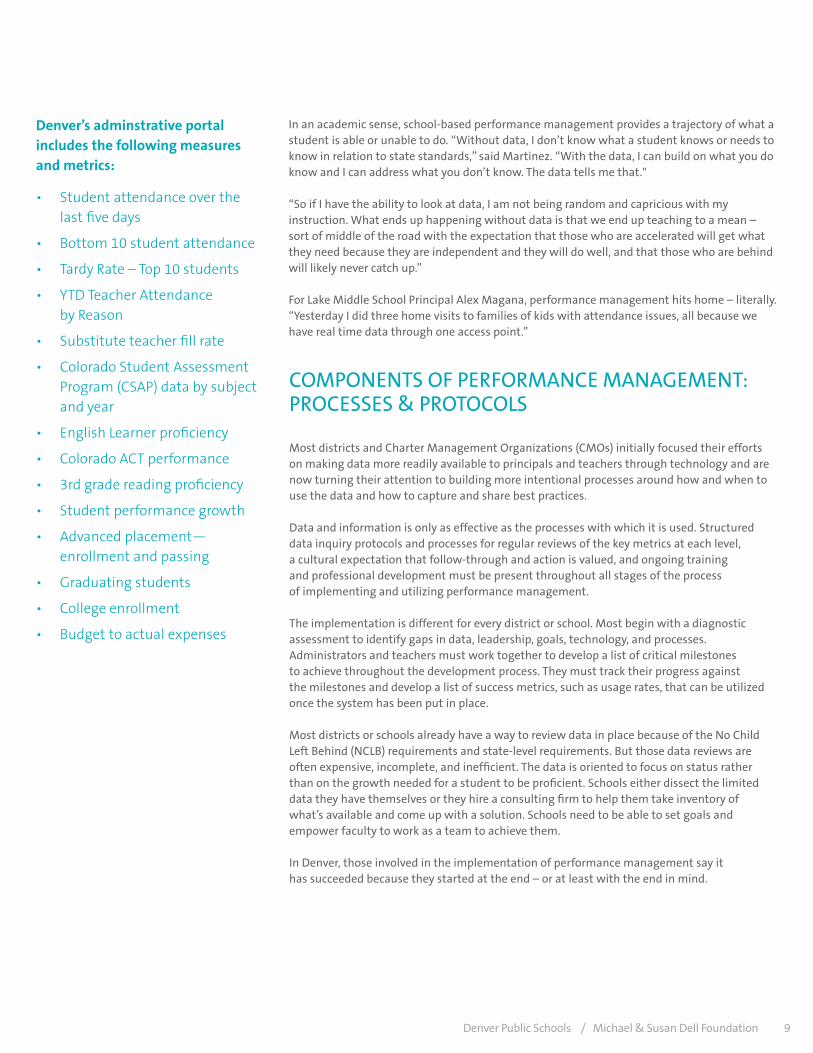
In an academic sense, school-based performance management provides a trajectory of what a student is able or unable to do. “Without data, I don’t know what a student knows or needs to know in relation to state standards,” said Martinez. “With the data, I can build on what you do know and I can address what you don’t know. The data tells me that."
“So if I have the ability to look at data, I am not being random and capricious with my instruction. What ends up happening without data is that we end up teaching to a mean – sort of middle of the road with the expectation that those who are accelerated will get what they need because they are independent and they will do well, and that those who are behind will likely never catch up.”
For Lake Middle School Principal Alex Magana, performance management hits home – literally. “Yesterday I did three home visits to families of kids with attendance issues, all because we have real time data through one access point.”
Denver’s adminstrative portal includes the following measures and metrics:
• Student attendance over the last five days
• Bottom 10 student attendance
• Tardy Rate – Top 10 students
• YTD Teacher Attendance by Reason
• Substitute teacher fill rate
• Colorado Student Assessment Program (CSAP) data by subject and year
• English Learner proficiency
• Colorado ACT performance
• 3rd grade reading proficiency
• Student performance growth
• Advanced placement— enrollment and passing
• Graduating students
• College enrollment
• Budget to actual expenses
COMPONENTS OF PERFORMANCE MANAGEMENT: PROCESSES & PROTOCOLS
Most districts and Charter Management Organizations (CMOs) initially focused their efforts on making data more readily available to principals and teachers through technology and are now turning their attention to building more intentional processes around how and when to use the data and how to capture and share best practices.
Data and information is only as effective as the processes with which it is used. Structured data inquiry protocols and processes for regular reviews of the key metrics at each level, a cultural expectation that follow-through and action is valued, and ongoing training and professional development must be present throughout all stages of the process of implementing and utilizing performance management.
The implementation is different for every district or school. Most begin with a diagnostic assessment to identify gaps in data, leadership, goals, technology, and processes. Administrators and teachers must work together to develop a list of critical milestones to achieve throughout the development process. They must track their progress against the milestones and develop a list of success metrics, such as usage rates, that can be utilized once the system has been put in place.
Most districts or schools already have a way to review data in place because of the No Child Left Behind (NCLB) requirements and state-level requirements. But those data reviews are often expensive, incomplete, and inefficient. The data is oriented to focus on status rather than on the growth needed for a student to be proficient. Schools either dissect the limited data they have themselves or they hire a consulting firm to help them take inventory of what’s available and come up with a solution. Schools need to be able to set goals and empower faculty to work as a team to achieve them.
In Denver, those involved in the implementation of performance management say it has succeeded because they started at the end – or at least with the end in mind.
Denver Public Schools / Michael & Susan Dell Foundation 10
“The first steps we took were to set the vision of what was possible,” said Jason Martinez. “As we discussed our goals and strategy, we really started with the end in mind. We asked ourselves, when all is said and done what do we want to have happen and what do we hope will happen because of our efforts.”
DPS officials used the “Backward Design” planning process, in which the standards and goals are established then the best ways of reaching those goals are determined. Denver North High School Assistant Principal Nancy Werkmeister called Backward Design, “a great way to implement a plan of action.”
Principal Magana noted that this approach is standard practice in the corporate world.
“Just like a business would, we identified specific goals--in our casea things the kids need to learn. Most educators call those standards, but that is too broad, so we call them learning goals.”
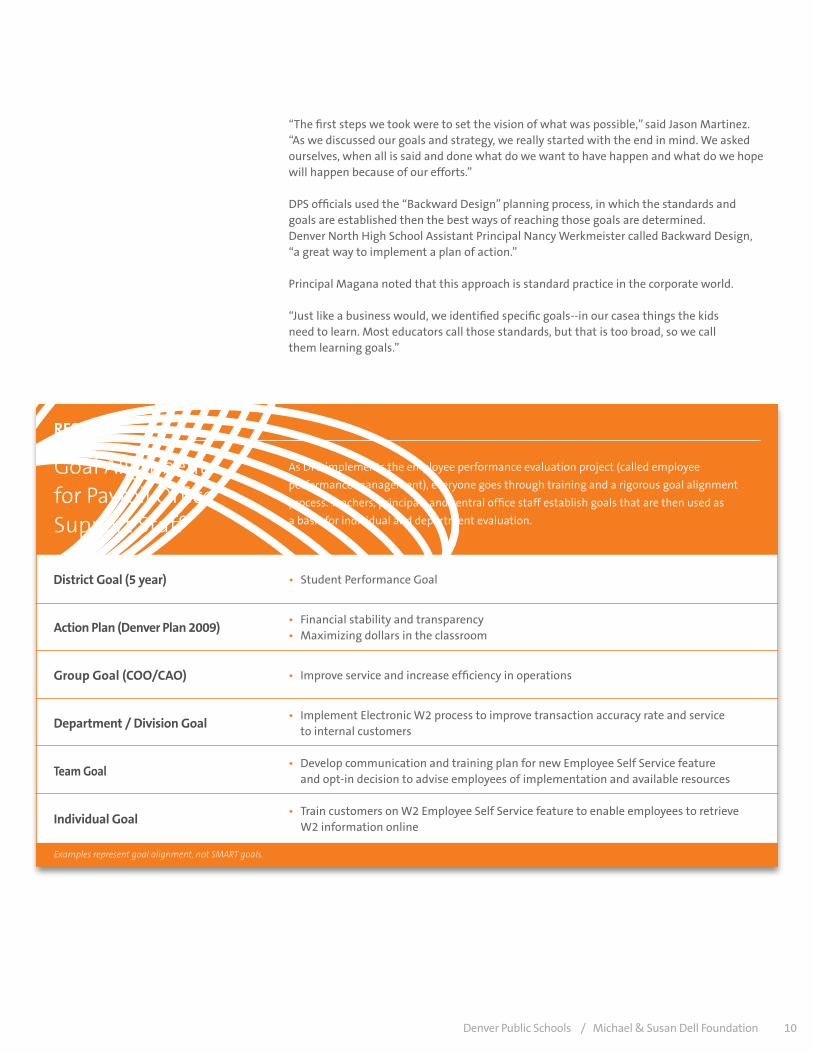
District Goal (5 year) • Student Performance Goal
Group Goal (COO/CAO) • Improve service and increase efficiency in operations
Department / Division Goal• Implement Electronic W2 process to improve transaction accuracy rate and service
to internal customers
Individual Goal• Train customers on W2 Employee Self Service feature to enable employees to retrieve
W2 information online
Team Goal• Develop communication and training plan for new Employee Self Service feature
and opt-in decision to advise employees of implementation and available resources
• Financial stability and transparency • Maximizing dollars in the classroom
Action Plan (Denver Plan 2009)
Examples represent goal alignment, not SMART goals.
ReSUlTS
Goal Alignment for Payroll Office Support Staff
As DPS implements the employee performance evaluation project (called employee
performance management), everyone goes through training and a rigorous goal alignment
process. Teachers, principals and central office staff establish goals that are then used as
a basis for individual and department evaluation.
Denver Public Schools / Michael & Susan Dell Foundation 11
In Denver, there is a customer service element to performance management processes that has become important to teachers and extremely helpful to parents. “Teachers understand that performance management helps them at parent-teacher conference time,” said Martinez. “They understand that ultimately if they can’t address a parent’s question about their child in a positive way, we are going to have a group of dissatisfied parents. And that is not good because we need their support to educate their children.”
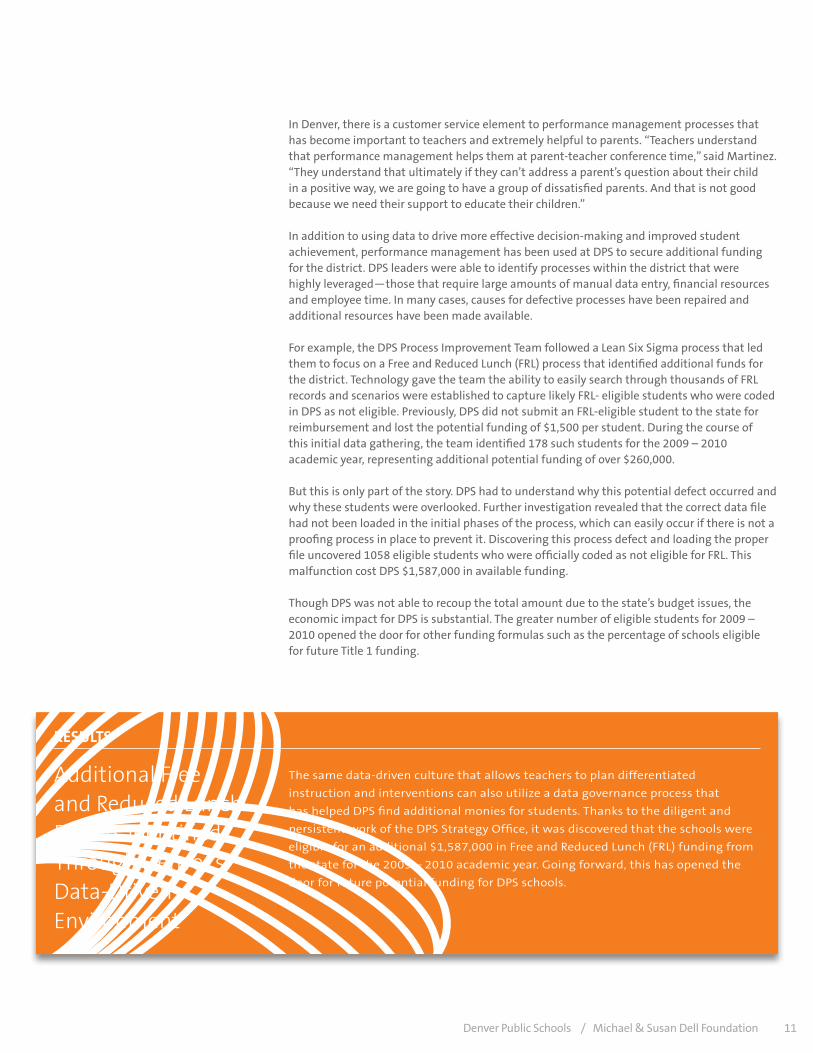
In addition to using data to drive more effective decision-making and improved student achievement, performance management has been used at DPS to secure additional funding for the district. DPS leaders were able to identify processes within the district that were highly leveraged—those that require large amounts of manual data entry, financial resources and employee time. In many cases, causes for defective processes have been repaired and additional resources have been made available.
For example, the DPS Process Improvement Team followed a Lean Six Sigma process that led them to focus on a Free and Reduced Lunch (FRL) process that identified additional funds for the district. Technology gave the team the ability to easily search through thousands of FRL records and scenarios were established to capture likely FRL- eligible students who were coded in DPS as not eligible. Previously, DPS did not submit an FRL-eligible student to the state for reimbursement and lost the potential funding of $1,500 per student. During the course of this initial data gathering, the team identified 178 such students for the 2009 – 2010 academic year, representing additional potential funding of over $260,000.
But this is only part of the story. DPS had to understand why this potential defect occurred and why these students were overlooked. Further investigation revealed that the correct data file had not been loaded in the initial phases of the process, which can easily occur if there is not a proofing process in place to prevent it. Discovering this process defect and loading the proper file uncovered 1058 eligible students who were officially coded as not eligible for FRL. This malfunction cost DPS $1,587,000 in available funding.
Though DPS was not able to recoup the total amount due to the state’s budget issues, the economic impact for DPS is substantial. The greater number of eligible students for 2009 – 2010 opened the door for other funding formulas such as the percentage of schools eligible for future Title 1 funding.
ReSUlTS
Additional Free and Reduced Lunch Dollars Identified Through Denver’s Data-Driven Environment
The same data-driven culture that allows teachers to plan differentiated
instruction and interventions can also utilize a data governance process that
has helped DPS find additional monies for students. Thanks to the diligent and
persistent work of the DPS Strategy Office, it was discovered that the schools were
eligible for an additional $1,587,000 in Free and Reduced Lunch (FRL) funding from
the state for the 2009 – 2010 academic year. Going forward, this has opened the
door for future potential funding for DPS schools.
Denver Public Schools / Michael & Susan Dell Foundation 12
COMPONENTS OF PERFORMANCE MANAGEMENT: TOOLS & REPORTS
Smart use of technology enables performance management. The amount of data and information that must be processed at each campus and district to understand student needs, academic achievement, and operational demands is astoundingPerformance management technology allows the data to be digested quickly, and easily understood and encourages collaboration among educators to improve academic outcomes for their students.
DPS used technology to build performance management “Digital Doors”. Within the Digital Doors were two products: the Administrator Portal and the Teacher Portal. “We were trying to understand how to leverage technology and help people do their day-to-day work in a much more meaningful and important way,” said Martinez.
“We know teachers don’t teach from behind computers, so performance management isn’t about the technology. For us in Denver, it was really about what the tool was going to do for the educators and how it was going to improve student achievement. That’s the brass ring. If you can answer that question, you’re really on to something.”
Principal Magana is a strong believer in the power of data to help his students learn. “Before we had the tool, I had to compile spreadsheets on top of spreadsheets. Then I had to manipulate them all to make the data usable. I knew this would make my job easier, and it did; but it also enabled me to quickly give our teachers a big picture view of what was happening in their classrooms.”
“Of course, the tool also tells us what classrooms we need to visit more frequently, which kids we need to talk to, and when we may need to bring in the social worker to help. We can ask a student to stay after school for extra work when needed. We now have scorecards of what all that looks like.”
The students are aware of the power of performance management as well. “Every student in the class knows how many learning goals they are achieving. And this is not only monitored once. It’s monitored throughout the year, which gives accountability to the students and that is really important.”
Assistant Principal Nancy Werkmeister uses the performance management portal to deal with attendance issues at North H.S. “Everybody has issues with attendance, but before the portals, we would have to call a student’s middle school and asked what had happened there. With this tool, we can track a student for years, see patterns, and get good information. It really helps us to narrow our focus: These are the students we need to help and why. And unlike the old paper and pencil system, this tool is immediate and a huge timesaver.”
With the help of these tools and processes, student achievement is on the rise in Denver and the Board of Education was able to use the tool to define five-year targets for academic achievement where none existed previously.
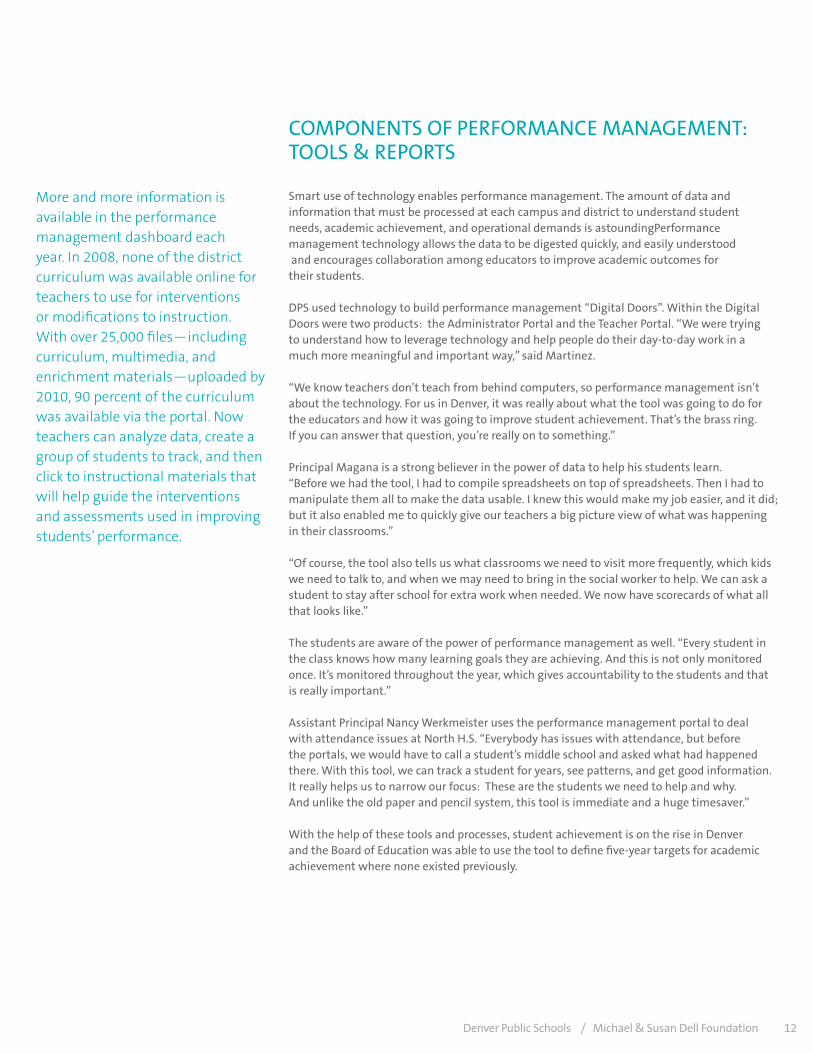
More and more information is available in the performance management dashboard each year. In 2008, none of the district curriculum was available online for teachers to use for interventions or modifications to instruction. With over 25,000 files—including curriculum, multimedia, and enrichment materials—uploaded by 2010, 90 percent of the curriculum was available via the portal. Now teachers can analyze data, create a group of students to track, and then click to instructional materials that will help guide the interventions and assessments used in improving students’ performance.
Denver Public Schools / Michael & Susan Dell Foundation 13
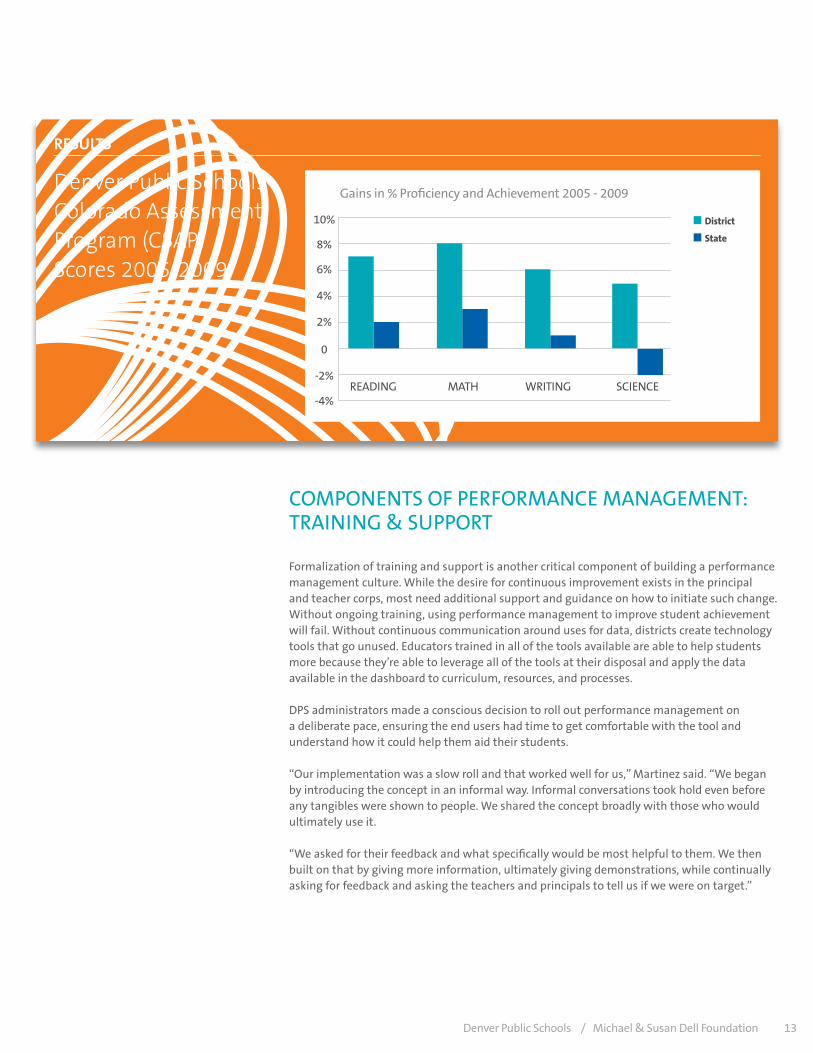
ReSUlTS
Denver Public Schools Colorado Assessment Program (CSAP) Scores 2005-2009
District
State
10%
8%
6%
4%
2%
0
-2%
-4%
Gains in % Proficiency and Achievement 2005 - 2009
READING MATH WRITING SCIENCE
Formalization of training and support is another critical component of building a performance management culture. While the desire for continuous improvement exists in the principal and teacher corps, most need additional support and guidance on how to initiate such change. Without ongoing training, using performance management to improve student achievement will fail. Without continuous communication around uses for data, districts create technology tools that go unused. Educators trained in all of the tools available are able to help students more because they’re able to leverage all of the tools at their disposal and apply the data available in the dashboard to curriculum, resources, and processes. DPS administrators made a conscious decision to roll out performance management on a deliberate pace, ensuring the end users had time to get comfortable with the tool and understand how it could help them aid their students.
“Our implementation was a slow roll and that worked well for us,” Martinez said. “We began by introducing the concept in an informal way. Informal conversations took hold even before any tangibles were shown to people. We shared the concept broadly with those who would ultimately use it.
“We asked for their feedback and what specifically would be most helpful to them. We then built on that by giving more information, ultimately giving demonstrations, while continually asking for feedback and asking the teachers and principals to tell us if we were on target.”
COMPONENTS OF PERFORMANCE MANAGEMENT: TRAINING & SUPPORT
Denver Public Schools / Michael & Susan Dell Foundation 14
Assistant Principal Werkmeister was among the end users who had the chance to provide useful feedback. “The performance management tool was set up in a pilot and presented at a Principal Institute,” she explains. “There were strong people involved in the Administrator Portal pilot who represented the users’ point of view across the board, from elementary through high school. Everybody has different needs and we were able to put ideas up on the wall – and rate them – to give the team putting this together focus regarding what we wanted this program to do.”
As performance management was being slowly implemented across DPS, of course there were some tech savvy teachers who were eager to dive in deeper. Those who were less comfortable with technology were nurtured through the process in a hands-on manner – with help on websites, with assistance from the central office a phone call away, with videos they could access when they were ready to learn more, and with drop-in “office hours” where they could learn from experts and peers on ways to use the tools. “We understood that some teachers would be uncomfortable at first,” said Werkmeister. “We helped them get to a comfort zone and expand from there.”
Werkmeister found virtually no resistance from her teachers at North H.S. “The biggest selling point is that you can log on and pull all of the information we use from one place. All the data is instantly accessible and really saves time, which is why it is so helpful to teachers.”
She agrees that the informal rollout was the right approach, but suggests one way the early training could be improved. “It would have been nice to be able to manipulate data and reports in the portal during the training. We weren’t at computers during the early instruction. The casual intro was good, but some time on a live computer would have been beneficial.”
And Werkmeister also suggests follow-up training to check in with users to answer any questions and help them take their use of the performance management tools to the most advanced level possible.
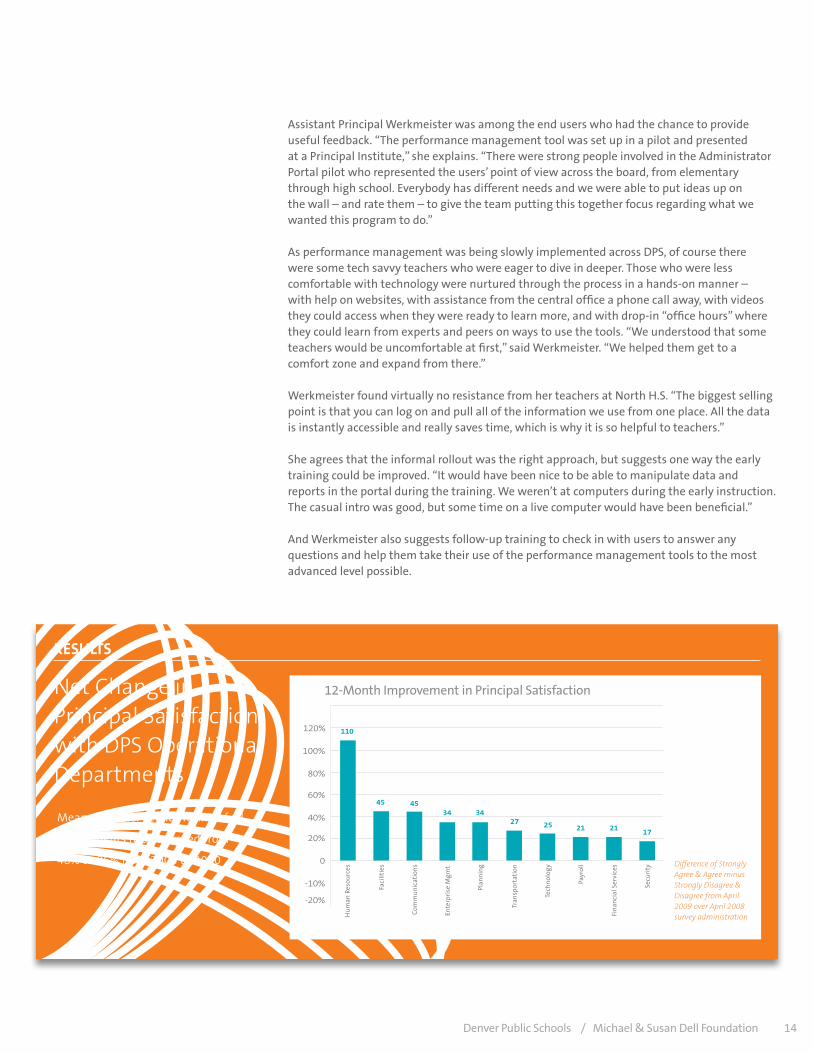
ReSUlTS
Net Change in Principal Satisfaction with DPS Operational Departments
Mean customer service rating of all
departments has improved from
48% to 86% from 2008 to 2010
Median�satisfaction�has�risen�from��48%�in�April�2008�to�55%�in�April�2009
12-Month Improvement in Principal Satisfaction
120%
100%
80%
60%
40%
20%
0
-10%
-20%
110
45 4534 34
27 25 21 21 17
Difference of Strongly Agree & Agree minus Strongly Disagree & Disagree from April 2009 over April 2008 survey administrationH
um
an R
esou
rces
Faci
litie
s
Com
mu
nic
atio
ns
Ente
rpri
se M
gmt.
Fin
anci
al S
ervi
ces
Secu
rity
Plan
nin
g
Tran
spor
tati
on
Tech
nol
ogy
Payr
oll
Denver Public Schools / Michael & Susan Dell Foundation 15
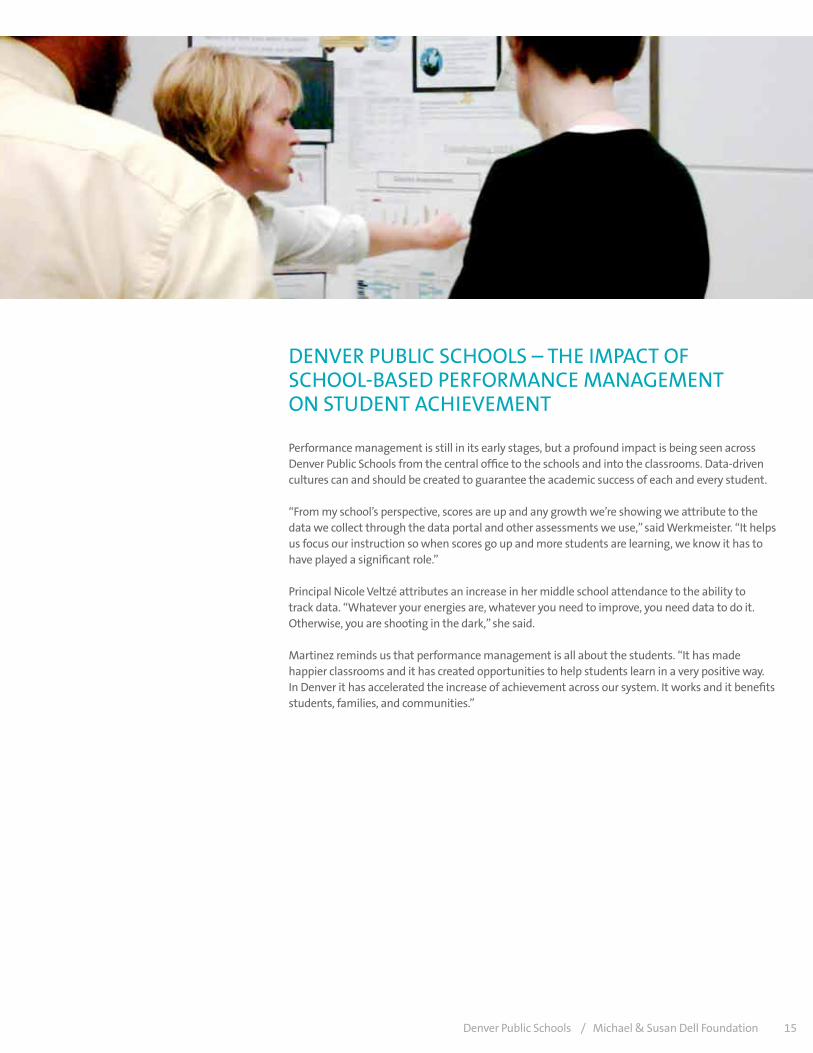
DENVER PUBLIC SCHOOLS – THE IMPACT OF SCHOOL-BASED PERFORMANCE MANAGEMENT ON STUDENT ACHIEVEMENT
Performance management is still in its early stages, but a profound impact is being seen across Denver Public Schools from the central office to the schools and into the classrooms. Data-driven cultures can and should be created to guarantee the academic success of each and every student.
“From my school’s perspective, scores are up and any growth we’re showing we attribute to the data we collect through the data portal and other assessments we use,” said Werkmeister. “It helps us focus our instruction so when scores go up and more students are learning, we know it has to have played a significant role.”
Principal Nicole Veltzé attributes an increase in her middle school attendance to the ability to track data. “Whatever your energies are, whatever you need to improve, you need data to do it. Otherwise, you are shooting in the dark,” she said.
Martinez reminds us that performance management is all about the students. “It has made happier classrooms and it has created opportunities to help students learn in a very positive way. In Denver it has accelerated the increase of achievement across our system. It works and it benefits students, families, and communities.”
© 2010 Michael & Susan Dell Foundation
Michael & Susan Dell FoundationP.O. Box 163867Austin, Texas 78716
www.msdf.org
Special thanks to Connie Casson and all of the educators at Denver Public Schools.