Embed Size (px)
Citation preview
Intelligent site selection forbricks-and-mortar stores
Dongdong GeResearch Institute for Interdisciplinary Sciences and
Shanghai Institute of International Finance and Economics,Shanghai University of Finance and Economics, Shanghai, China
Luhui HuYonghui Superstores Co. Ltd, Shanghai, China
Bo JiangResearch Institute for Interdisciplinary Sciences,
Shanghai University of Finance and Economics, Shanghai, ChinaGuangjun Su
Cardinal Operations, Shanghai, China andDepartment of Management Science and Engineering, Stanford University,
Stanford, California, USA, andXiaole Wu
School of Management, Fudan University, Shanghai, China
AbstractPurpose – The purpose of this paper is to achieve intelligent superstore site selection. Yonghui Superstorespartnered with Cardinal Operations to incorporate a tremendous amount of site-related information(e.g. points of interest, population density and features, distribution of competitors, transportation,commercial ecosystem, existing own-store network) into its store site optimization.Design/methodology/approach – This paper showcases the integration of regression, optimization andmachine learning approaches in site selection, which has proven practical and effective.Findings – The result was the development of the “Yonghui Intelligent Site Selection System” that includesthree modules: business district scoring, intelligent site engine and precision sales forecasting. Theapplication of this system helps to significantly reduce the labor force required to visit and investigate allpotential sites, circumvent the pitfalls associated with possibly biased experience or intuition-based decisionmaking and achieve the same population coverage as competitors while needing only half the number ofstores as its competitors.Originality/value – To our knowledge, this project is among the first to integrate regression, optimizationand machine learning approaches in site selection. There is innovation in optimization techniques.Keywords Optimization, Site selection, Convenience store, Data-driven intelligent decisionPaper type Case study
1. IntroductionYonghui Superstores Co., Ltd, founded in 1998, is characterized by its expertise inmanaging fresh food. Currently, it operates three types of stores: Yonghui Bravo, YonghuiSuper Species and Yonghui Life. Yonghui Bravo is akin to a traditional supermarket,while the other two store types follow the so-called new retailing style and consumers can
Modern Supply Chain Researchand ApplicationsVol. 1 No. 1, 2019pp. 88-102Emerald Publishing Limited2631-3871DOI 10.1108/MSCRA-03-2019-0010
Received 11 March 2019Revised 10 April 2019Accepted 25 April 2019
The current issue and full text archive of this journal is available on Emerald Insight at:www.emeraldinsight.com/2631-3871.htm
© Dongdong Ge, Luhui Hu, Bo Jiang, Guangjun Su and Xiaole Wu. Published inModern Supply ChainResearch and Applications. Published by Emerald Publishing Limited. This article is published underthe Creative Commons Attribution (CC BY 4.0) licence. Anyone may reproduce, distribute, translateand create derivative works of this article (for both commercial and non-commercial purposes), subjectto full attribution to the original publication and authors. The full terms of this licence may be seen athttp://creativecommons.org/licences/by/4.0/legalcode
88
MSCRA1,1

purchase both online and offline. Yonghui Life is a convenience store that sells freshproduce, and is much smaller in size than Bravo. A Yonghui Super Species store combinesthe features of a Yonghui Life store and a restaurant that mainly provides fresh food.Yonghui’s goal is to design the network of all types of Yonghui stores in a city to offerconvenience for most residents. To this end, opening a number of Yonghui Life storeswould be the most economical and efficient. When the project began, Yonghui owned 101Yonghui Life stores in Shanghai and was planning to open more to cover a largerpopulation. Site selection is among the most important decisions that determine theprofitability of a store. Traditional site selection in the industry is heavily reliant on atremendous amount of work from the site selection team to collect all potential regions’relevant information. However, overall, such information might be fragmented.Furthermore, site decisions can be highly dependent on the team’s subjective judgment.This is referred to as manual site selection, which is inefficient, and the performance of aselected location is difficult to forecast. As information technology has advanced,substantial amounts of location-related information have been digitalized, and some isavailable from third-party information providers. Data-based site selection is the secondapproach to the location decision and involves how to best combine the external macroand location-related data with a firm’s internal data to select an ideal location. It may alsouse competitors’ information and integrate certain business logic to improve the decision.Albeit much more efficient, data-based site decision still relies much on human judgmentduring the selection process. The second approach can be further upgraded by applyingcutting-edge optimization and machine learning techniques, and empowering machineswith decision-making capability. This will result in the third approach to site selection,which we refer to as intelligent site selection. In its collaboration with Cardinal Operations,Yonghui seeks to develop an intelligent site selection system.
In the retail industry, easily implementable models such as gravity models (e.g. Buckner,1998) and multiple regression models (e.g. Breheny, 1988) are widely employed in siteselection. Interested readers are referred to Rogers (2007) and Ladle et al. (2009) for surveysof more practical methods of site selection. In terms of general principles, Buckner (1998)identified three major trends and the advanced statistical techniques used in retail siteselection and Rogers (2007) proposed some key elements of retail site selection, includingcompetition, transportation convenience, economic development and popularity.
Some researchers (e.g. Berman and Krass, 2002) studied the optimal location problem asa covering problem if maximizing the population to be served is the only objective. A morerelated problem is the so-called facility location problem (FLP), where the demand of eachclient must be served by one or more open facilities and the total cost of opening facilitiesand for serving demand is minimized. FLP is a well-known NP-hard problem incombinatorial optimization. Therefore, the existing literature mainly focused on designingefficient approximation algorithms (e.g. Shmoys et al., 1997; Zhang et al., 2005; Aggarwalet al., 2010; Li, 2013). In particular, an algorithm is said to be a (polynomial) ρ-approximationalgorithm for a minimization problem if the algorithm runs in polynomial time and outputs asolution that has a cost at most ρW1 times the minimal cost for any instance of the problem,where ρ is called the approximation ratio of the algorithm. The currently known bestapproximation ratio for unconstrained FLP is 1.488 (Li, 2013) and Sviridenko (2002) provedthat the ratio cannot be better than 1.463 unless P¼NP. For capacitated FLP, the bestknown ratios are three with uniform capacity (Aggarwal et al., 2010) and 5.83+ε withnonuniform capacity (Zhang et al., 2005).
Recently, Karamshuk et al. (2013), Wu et al. (1991) and Xu et al. (2016) used data out ofinformation technology to help select the store locations. For examples, Roig-Tierno et al.(2013) and Karamshuk et al. (2013) used geographic information system (GIS) andconsumption information to solve the problem of retail store placement. Wang et al. (2016)
89
Intelligentsite selection
took advantage of user-generated reviews to construct predictive features for assessing theattractiveness of candidate locations. Wu et al. (1991), Xu et al. (2016) and Rohani and Chua(2018) showed that mining map query data are also helpful in site selection. Moreover,Yilmaz et al. (2017) proposed an optimal location predictor which accepts partial informationabout customer locations and returns a location for the new facility.
Building upon existing work, Yonghui and Cardinal Operations aim to select potentialsites for hundreds of Yonghui Life stores in Shanghai by integrating methodologies fromstatistics, optimization and machine learning. There are two major challenges in thisproject. The first is limited existing store data. In Shanghai, there are only data from101 Yonghui stores available for prediction and most Yonghui consumers purchaseoffline, which makes it difficult to characterize their purchasing behavior. Therefore, thedata-driven approaches in the recent literature are usually infeasible. The secondchallenge is to take a network perspective on the problem. Note that one of our objectivesis to maximize the total population covered by all Yonghui stores. The site candidates arescattered throughout the city. The procedure of ranking all candidates and then selectinga few best ones is not applicable because it is very likely that some population will becovered by several stores in this procedure. As a result, we need to conduct a networkoptimization given all site candidates, which results in a challenging large scale mixedinteger programming. In this paper, we detail how we address these challenges anddevelop an intelligent site selection system.
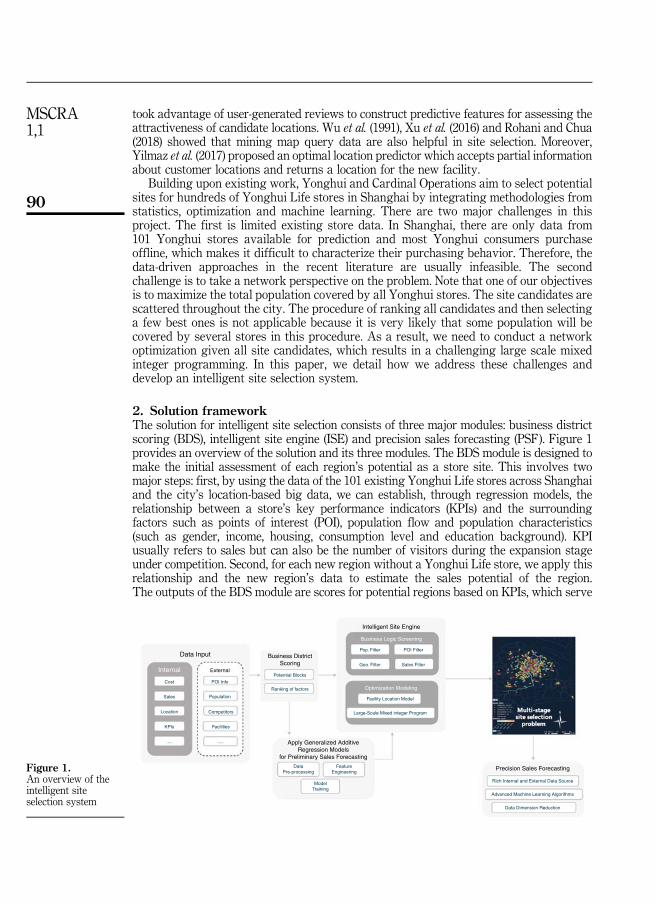
2. Solution frameworkThe solution for intelligent site selection consists of three major modules: business districtscoring (BDS), intelligent site engine (ISE) and precision sales forecasting (PSF). Figure 1provides an overview of the solution and its three modules. The BDS module is designed tomake the initial assessment of each region’s potential as a store site. This involves twomajor steps: first, by using the data of the 101 existing Yonghui Life stores across Shanghaiand the city’s location-based big data, we can establish, through regression models, therelationship between a store’s key performance indicators (KPIs) and the surroundingfactors such as points of interest (POI), population flow and population characteristics(such as gender, income, housing, consumption level and education background). KPIusually refers to sales but can also be the number of visitors during the expansion stageunder competition. Second, for each new region without a Yonghui Life store, we apply thisrelationship and the new region’s data to estimate the sales potential of the region.The outputs of the BDS module are scores for potential regions based on KPIs, which serve
Internal
Optimization Modeling
Business Logic Screening
Cost POI Info
Potential Blocks
Ranking of factors
DataPre-processing
ModelTraining
FeatureEngineering
Large-Scale Mixed integer Program
Facility Location Model
Geo. Filter
Pop. Filter
Sales Filter
POI Filter
Competitors
Facilities
External
Data Input Business DistrictScoring
Apply Generalized AdditiveRegression Models
for Preliminary Sales Forecasting
Intelligent Site Engine
Rich Internal and External Data Source
Advanced Machine Learning Algorithms
Data Dimension Reduction
Precision Sales Forecasting
0 3 757.5 15 22.5
N
30
PopulationSales
Location
KPIs
..... .....
Figure 1.An overview of theintelligent siteselection system
90
MSCRA1,1
as inputs of the ISE. In addition, the ISE, a semi-autonomous optimization model, needs anexplicit relationship between the KPIs and surrounding factors. Therefore, in the BDS, wecannot apply some advanced machine learning algorithms, like random forest and neuralnetwork, for preliminary sales forecasting, because such approaches cannot deliver anexplicit relationship on how the surrounding factors affect the KPIs. Thus, we build a simpleparametric regression model to predict the sales performance based on some basic andsignificant features.
Population coverage and sales are two major measures used in site selection. These twomeasures are not always consistent, especially during the expansion stage. In that case,should we cluster stores in regions with high sales or spread them to achieve widerpopulation coverage? By applying multi-objective integer programming, the ISE modulederives an optimal set of regions that balance the two objectives. There are alsocertain constraints considered in the ISE module. For example, the distance between twostores should not be shorter than 500 meters. As the offline stores support both theonline and offline systems, the store network design is crucial for Yonghui’s ecosystem.Given limited resources and budget, the ISE module also prioritizes the regions to expandthe store network.
The regions suggested by the ISE module need to be checked by the retail propertydevelopment team. The retail developers visit each suggested region and identify potentialsites within the region to locate a store. The PSF, as an additional tool to help with thedevelopers and managers, mainly focuses on the prediction accuracy rather than an explicitcharacterization of the effects of factors on sales. The sales forecast conducted in the PSFmodule includes greater detail than the assessment of each region’s potential in the BDSmodule. Using a specific address, the PSF module can take into account more detailedinformation such as the distance to major streets, store size and the surrounding businessenvironment. All of the factors considered amount to over 100 dimensions of data. Inaddition, we can also use more sophisticated machine learning algorithms, such as neuralnetwork and random forest, in order to pursue higher prediction accuracy.
3. Three modules3.1 Business district scoringData quality and dimensions directly influence the accuracy of model predictions. The firststep of the BDS module is to establish a city database that includes five data streams:transportation convenience, consumption profile, commercial ecosystem, population flowand competitor profile. The details of these five streams are shown in Table I. We choosethese five data streams after extensive trial analysis and back-and-forth discussions withYonghui’s team of developers. In addition to these five data streams, there are some otherdimensions we thought might influence the sales of a store, but they turn out to beinessential after the analysis, such as average housing price or number of primary schoolswithin a region. On the other hand, data availability is a constraint. For example, populationflow at the entrance of a store should be an important dimension, but such data is notavailable at third-party data providers.
Data stream Key dimensions
Transportation convenience Subways, Bus stations, Entrance/exit of highwayConsumption profile Surrounding housing prices, rents and ageCommercial ecosystem Commercial complex/facilities, per capita commercial areaPopulation flow Daytime/nighttime population flow, population profileCompetitors profile Nearby convenience stores, supermarkets, fresh markets
Table I.Key dimensions ofeach data stream
91
Intelligentsite selection
For site selection, we first need to define a basic unit of area for evaluation. ConsiderShanghai as an example. The city is divided into more than 100,000 blocks that are250× 250 meters. A block is the smallest unit for site selection and is assigned the associatedcity data including the five data streams. Among these over 100,000 blocks, the BDS modulesuggests the blocks with the greatest potential for store sites.
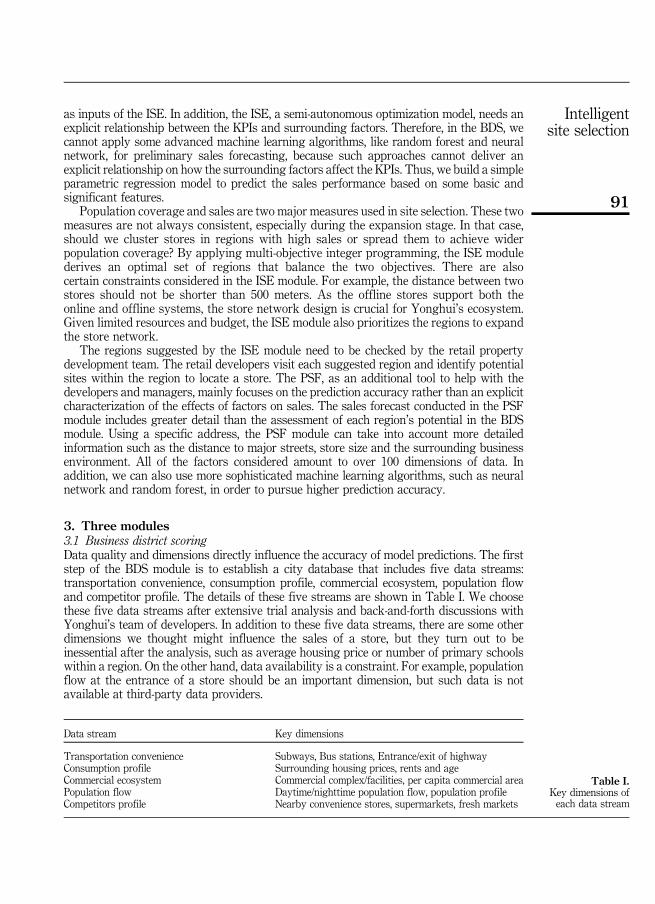
The main task for the BDS module is preliminary sales forecasting. There were 101Yonghui Life stores in the city when the project began. Each store is located in a single blockas defined above. Based on these 101 blocks’ associated data of the five streams and thecorresponding stores’ historical sales, we use a generalized additive regression model tolearn how each environmental factor influences a block’s sales. The relationship is thenapplied to forecast the potential sales of the blocks without a Yonghui store based on thoseblocks’ associated data. In the Yonghui Intelligent Site Selection System, each block’spreliminary forecasted sales is referred to as each block’s business district score. Figure 2illustrates the logic of the preliminary sales forecasting.
To analyze the impact of environmental factors on sales, we first considered linearregression models, but their predictive power was not satisfactory. Therefore, we turned to ageneralized additive model. There are two challenges: First, we have 101 existing stores, sothe sample size is not large; second, there are over one hundred potential regressors. Sincesome variables are counted based on the distance to a store, say 200, 300 or 500 meters,these variables may be highly collinear. In such instances, we use a stepwise approach toselect the most relevant potential regressors.
After specifying the regressors, the generalized additive model results in a function f thatdescribes how each factor influences potential sales. This function will be used in the secondmodule, the ISE, which accounts not only for sales but also population coverage. In addition,the BDS module also results in a ranking of all blocks in terms of potential sales. Based onthis ranking, the second module can select a pool of candidate blocks in its optimization byapplying certain rules, such as the blocks with sales exceeding a certain level.
3.2 Intelligent site engineThe ISE returns a set of blocks for site selection by solving an optimization problem. Itsexecution relies on the BDS module in two aspects. First, the BDS module helps to eliminateblocks with small populations, including the most remote areas where Yonghui stores couldnot survive, from our decision set. Second, as mentioned above, the BDS module providesthe ISE module with a mapping f describing the relationship between the potential sales andselected environmental factors of a block, which is used in the optimization problem (P)
Information and sales for the101 blocks with a Yonghui Store
Information for blockswithout a Yonghui Store
Daily Sales13,450
Yuan/Day
Daily Sales?
Yuan/Day
• Applying Regression Model• Using information from existing stores• Establishing the relationship between store KPIs and the surrounding factors• Applying the relationship to estimate the sales for new blocks
Figure 2.Logic of preliminarysales forecasting
92
MSCRA1,1

below as the first part of the objective to represent the sales of all Yonghui stores. Thespecific form of f could affect the complexity of solving the resulting optimization problem.
Given the data and the outputs of the BDS module, we model the site selection problemas a 0–1 integer programming (P), where the objective entails two parts: the profit earned byall the Yonghui stores and the total population served by Yonghui stores. γ1 and γ2 inthe objective function are the weights of the two objectives, respectively, imposed by thedecision maker. The relative importance of the two objectives depends on the developmentstage and the firm’s strategic preference or various practical considerations. To determinethe weight for each objective, we have gone through an iterative process with thedevelopment team. We try different combinations of weights, and for each combinationwe solve the optimization problem and output a set of blocks for site selection; thedevelopment team reviews the set of blocks to judge whether the optimization outcomemakes sense; if not they propose a new combination of weights and we solve theoptimization problem again. The process terminates until we find a pair of weights that leadto most reasonable optimization outcome:
maxxj ;yri
g1XjA J
fXiA I rj
Qp;iyri
24
35rAR
; Qc;j;Qo;j;Qt;j;Qe;j
0B@
1CA�cj
0B@
1CAxjþg2
XiA I
Qp;i
XrAR
yri
s:t:XjA J
xjpK; (1)
Pð Þ yri pXjA J ri
xj 8iA I rAR; (2)
XrAR
yri p1 8iA I ; (3)
xjA 0; 1f g 8jA J ; (4)
yri A 0; 1f g 8iA I 8rAR: (5)
The model parameters are defined as follows:
• I: set of blocks to be served by Yonghui stores;
• J: set of candidate blocks for site selection;
• K: number of Yonghui stores to open;
• Qp,i: population of block i;
• Qc,j: competitors profile at candidate block j;
• Qo,j: consumption profile at candidate block j;
• Qt,j: transportation convenience at candidate block j;
• Qe,j: commercial ecosystem at candidate block j;
• cj: operational cost of running a store at candidate block j;
• dij: distance between served block i and candidate block j;
93
Intelligentsite selection

• R ¼ 1; 2; . . .; rf g: index set of circles around a block;
• ½� � � �rAR : a vector with each component having index r and r ∈ R;
• I rj ¼ fiA I9 r�1ð Þdpdijprdg: set of served blocks at rth circle around candidateblock j; and
• J ri ¼ ½jA J9 r�1ð Þdpdijprd�: set of candidate blocks at rth circle around servedblock i.
The decision variable xj¼ 1 indicates that candidate block j is selected as the siteof a Yonghui store; yri ¼ 1 means that block i is served by a Yonghui store at the rthcircle around it. R represents the index set of circles around a block and the circlesare indexed according to the radius in an increasing order. Constraint (3) indicates thatblock i is served by at most one Yonghui store at some circle r, while constraint (2) meansthat block i is not served by any Yonghui store at the rth circle if there is no store openat this circle.
Problem (P) is a huge 0–1 programming problem given a city such as Shanghai, which isquite challenging even for the most powerful commercial optimization solver, Gurobi. Recallthat the BDS module can eliminate blocks with small populations, which will significantlyreduce the number of decision variables in our problem. To further reduce the problem scale,we exclude some invalid blocks such as those in a park or river from the candidate set.In our modeling, we do not introduce the binary variable for every block i and candidateblock j. Instead, all are aggregated into one variable yri if every candidate block j is in the rthcircle around block i. After implementing these techniques, the problem size is reducedsignificantly but is nevertheless excessively large to solve efficiently. Therefore, we furtherapply some decomposition techniques to the reduced problem and solve a few medium-sizedproblems. In particular, we divide the decision variables into several blocks of variablesaccording to their geometric features. Then we cyclically solve a block variable problemwhile fixing the others until the improvement becomes marginal.
Finally, note that a block suggested by the ISE is a square of 250 × 250 meters, which istoo large for site selection. Therefore, the exact location to open a store has to be furtherexplored and identified by the PSF module.
3.3 Precision sales forecastingGiven the potential blocks suggested by the ISE module, a team of developers is assigned tosearch for a list of candidate spots for new store sites around the suggested blocks. Thissearch process is guided primarily by a handbook compiled by the retail propertydevelopment committee in which they classify criteria into a “must” list and a “want” listthat include, for example, high traffic volume, maximum street frontage, accessibility andproximity to other draws such as restaurants and grocery stores. Most of these criteria canbe quantified, but how can they be integrated into a scientific and systematic store siteselection process?
Sales forecasting plays a critical role in the success of store site selection, as suchpredictions are the main reference for the committee that makes the final accept/rejectdecision. Now the key questions reduce to the following: What are the key site selectioncriteria and how are they related to the sales forecasting? When the project began, thecommittee had developed a basic scoring and ranking method, which gauged new retailstores’ sales performance into several levels. However, this method suffered from poorpredictive accuracy, so much of the site selection decision was still made based on thecommittee’s instincts and past experience. Our aim here is to revolutionize the scoring andranking methodology with cutting-edge artificial intelligence methods to improvepredictive power.
94
MSCRA1,1
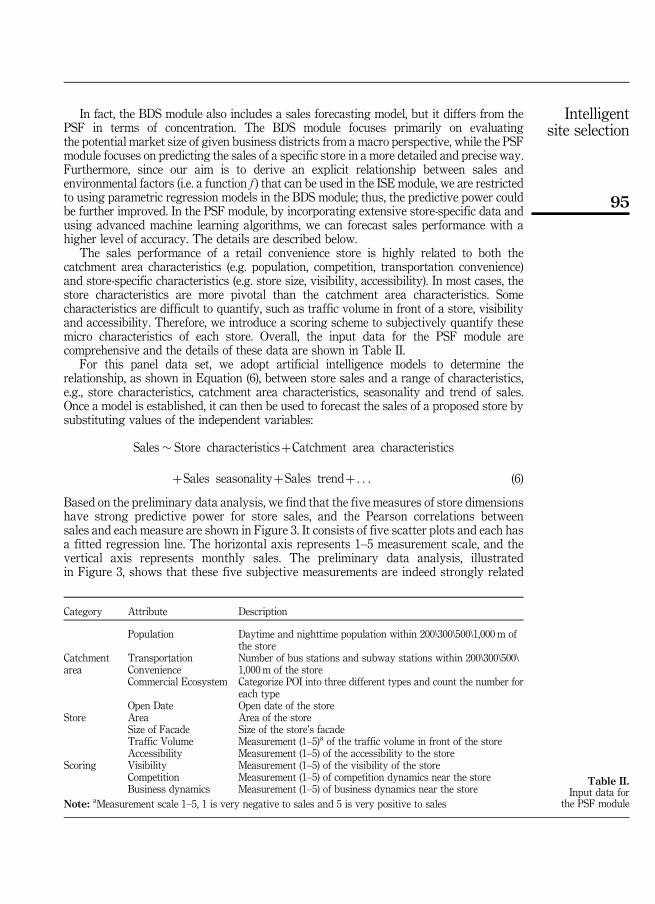
In fact, the BDS module also includes a sales forecasting model, but it differs from thePSF in terms of concentration. The BDS module focuses primarily on evaluatingthe potential market size of given business districts from a macro perspective, while the PSFmodule focuses on predicting the sales of a specific store in a more detailed and precise way.Furthermore, since our aim is to derive an explicit relationship between sales andenvironmental factors (i.e. a function f ) that can be used in the ISE module, we are restrictedto using parametric regression models in the BDS module; thus, the predictive power couldbe further improved. In the PSF module, by incorporating extensive store-specific data andusing advanced machine learning algorithms, we can forecast sales performance with ahigher level of accuracy. The details are described below.
The sales performance of a retail convenience store is highly related to both thecatchment area characteristics (e.g. population, competition, transportation convenience)and store-specific characteristics (e.g. store size, visibility, accessibility). In most cases, thestore characteristics are more pivotal than the catchment area characteristics. Somecharacteristics are difficult to quantify, such as traffic volume in front of a store, visibilityand accessibility. Therefore, we introduce a scoring scheme to subjectively quantify thesemicro characteristics of each store. Overall, the input data for the PSF module arecomprehensive and the details of these data are shown in Table II.
For this panel data set, we adopt artificial intelligence models to determine therelationship, as shown in Equation (6), between store sales and a range of characteristics,e.g., store characteristics, catchment area characteristics, seasonality and trend of sales.Once a model is established, it can then be used to forecast the sales of a proposed store bysubstituting values of the independent variables:
Sales� Store characteristicsþCatchment area characteristics
þSales seasonalityþSales trendþ . . . (6)
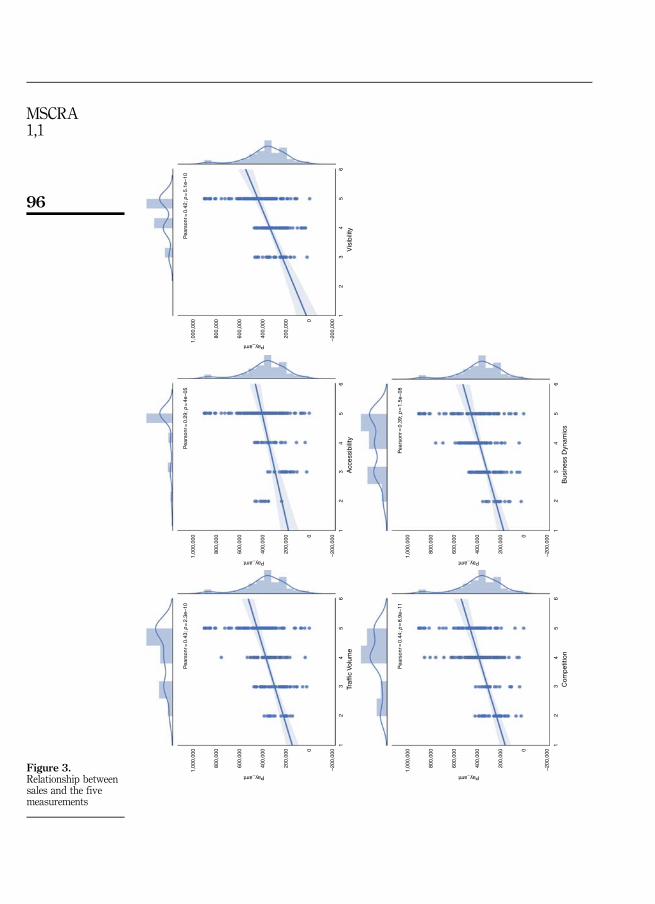
Based on the preliminary data analysis, we find that the five measures of store dimensionshave strong predictive power for store sales, and the Pearson correlations betweensales and each measure are shown in Figure 3. It consists of five scatter plots and each hasa fitted regression line. The horizontal axis represents 1–5 measurement scale, and thevertical axis represents monthly sales. The preliminary data analysis, illustratedin Figure 3, shows that these five subjective measurements are indeed strongly related
Category Attribute Description
Population Daytime and nighttime population within 200\300\500\1,000 m ofthe store
Catchmentarea
TransportationConvenience
Number of bus stations and subway stations within 200\300\500\1,000 m of the store
Commercial Ecosystem Categorize POI into three different types and count the number foreach type
Open Date Open date of the storeStore Area Area of the store
Size of Facade Size of the store’s facadeTraffic Volume Measurement (1–5)a of the traffic volume in front of the storeAccessibility Measurement (1–5) of the accessibility to the store
Scoring Visibility Measurement (1–5) of the visibility of the storeCompetition Measurement (1–5) of competition dynamics near the storeBusiness dynamics Measurement (1–5) of business dynamics near the store
Note: aMeasurement scale 1–5, 1 is very negative to sales and 5 is very positive to sales
Table II.Input data for
the PSF module
95
Intelligentsite selection
1,00
0,00
0
800,
000
600,
000
400,
000
200,
000
–200
,000
12
3 Traf
fic V
olum
eA
cces
sibi
lity
Pea
rson
r=0.
43; p
=2.
3e–1
0P
ears
onr=
0.29
; p=
4e–0
5
Pea
rson
r=0.
44; p
=8.
9e–1
1P
ears
onr=
0.39
; p=
1.5e
–08
Pea
rson
r=0.
42; p
=5.
1e–1
0
45
61
23
45
6
12
3 Com
petit
ion
Bus
ines
s D
ynam
ics
45
61
23
45
6
Vis
ibili
ty1
23
45
6
0
1,00
0,00
0
800,
000
600,
000
400,
000
200,
000
–200
,0000
Pay_amt
Pay_amt
1,00
0,00
0
800,
000
600,
000
400,
000
200,
000
–200
,0000
1,00
0,00
0
800,
000
600,
000
400,
000
200,
000
–200
,0000
Pay_amt
Pay_amt
1,00
0,00
0
800,
000
600,
000
400,
000
200,
000
–200
,0000
Pay_amt
Figure 3.Relationship betweensales and the fivemeasurements
96
MSCRA1,1
to the sales performance. Therefore, incorporating such subjective micro characteristics isnecessary in the PSF module.
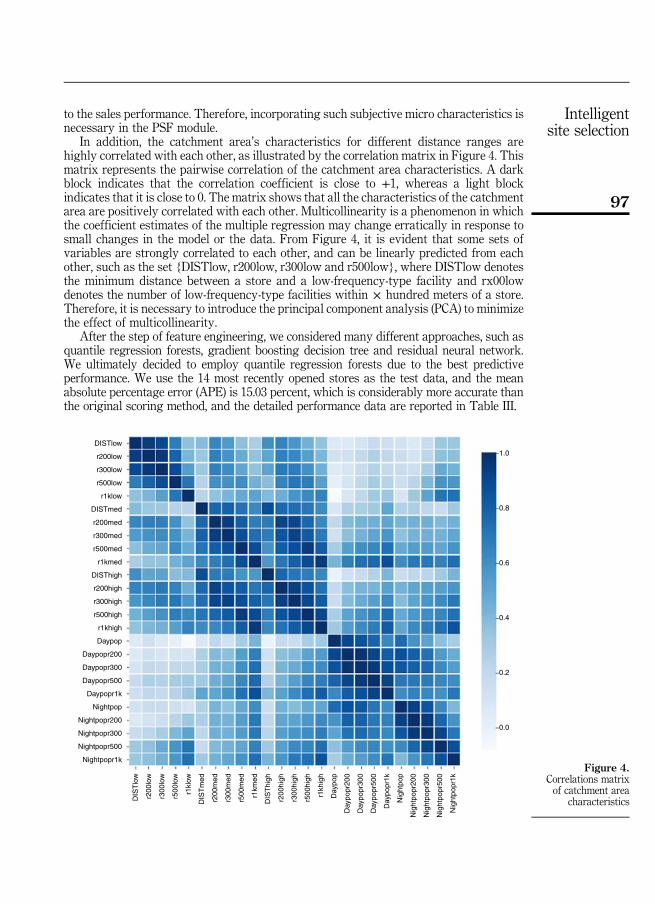
In addition, the catchment area’s characteristics for different distance ranges arehighly correlated with each other, as illustrated by the correlation matrix in Figure 4. Thismatrix represents the pairwise correlation of the catchment area characteristics. A darkblock indicates that the correlation coefficient is close to +1, whereas a light blockindicates that it is close to 0. The matrix shows that all the characteristics of the catchmentarea are positively correlated with each other. Multicollinearity is a phenomenon in whichthe coefficient estimates of the multiple regression may change erratically in response tosmall changes in the model or the data. From Figure 4, it is evident that some sets ofvariables are strongly correlated to each other, and can be linearly predicted from eachother, such as the set {DISTlow, r200low, r300low and r500low}, where DISTlow denotesthe minimum distance between a store and a low-frequency-type facility and rx00lowdenotes the number of low-frequency-type facilities within × hundred meters of a store.Therefore, it is necessary to introduce the principal component analysis (PCA) to minimizethe effect of multicollinearity.
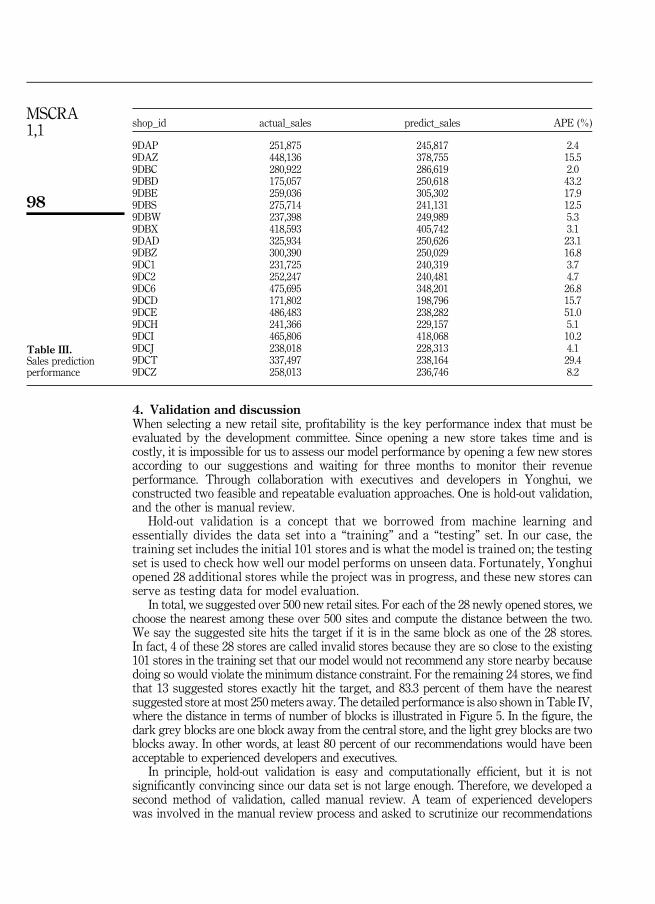
After the step of feature engineering, we considered many different approaches, such asquantile regression forests, gradient boosting decision tree and residual neural network.We ultimately decided to employ quantile regression forests due to the best predictiveperformance. We use the 14 most recently opened stores as the test data, and the meanabsolute percentage error (APE) is 15.03 percent, which is considerably more accurate thanthe original scoring method, and the detailed performance data are reported in Table III.
DISTlow–1.0
–0.8
–0.6
–0.4
–0.2
–0.0
DISTmed
DISThigh
r200high
r300high
r500high
r1khigh
Daypop
Daypopr200
Daypopr300
Daypopr500
Daypopr1k
Nightpop
Nightpopr1k
Nightpopr500
Nightpopr300
Nightpopr200
r200low
r1kmed
r500med
r300med
r200med
r1klow
r500low
r300low
DIS
Tlo
w
DIS
Tm
ed
DIS
Thi
gh
r200
high
r300
high
r500
high
r1kh
igh
Day
pop
Day
popr
200
Day
popr
300
Day
popr
500
Day
popr
1k
Nig
htpo
p
Nig
htpo
pr1k
Nig
htpo
pr50
0
Nig
htpo
pr30
0
Nig
htpo
pr20
0
r200
low
r1km
ed
r500
med
r300
med
r200
med
r1kl
ow
r500
low
r300
low
Figure 4.Correlations matrixof catchment area
characteristics
97
Intelligentsite selection
4. Validation and discussionWhen selecting a new retail site, profitability is the key performance index that must beevaluated by the development committee. Since opening a new store takes time and iscostly, it is impossible for us to assess our model performance by opening a few new storesaccording to our suggestions and waiting for three months to monitor their revenueperformance. Through collaboration with executives and developers in Yonghui, weconstructed two feasible and repeatable evaluation approaches. One is hold-out validation,and the other is manual review.
Hold-out validation is a concept that we borrowed from machine learning andessentially divides the data set into a “training” and a “testing” set. In our case, thetraining set includes the initial 101 stores and is what the model is trained on; the testingset is used to check how well our model performs on unseen data. Fortunately, Yonghuiopened 28 additional stores while the project was in progress, and these new stores canserve as testing data for model evaluation.
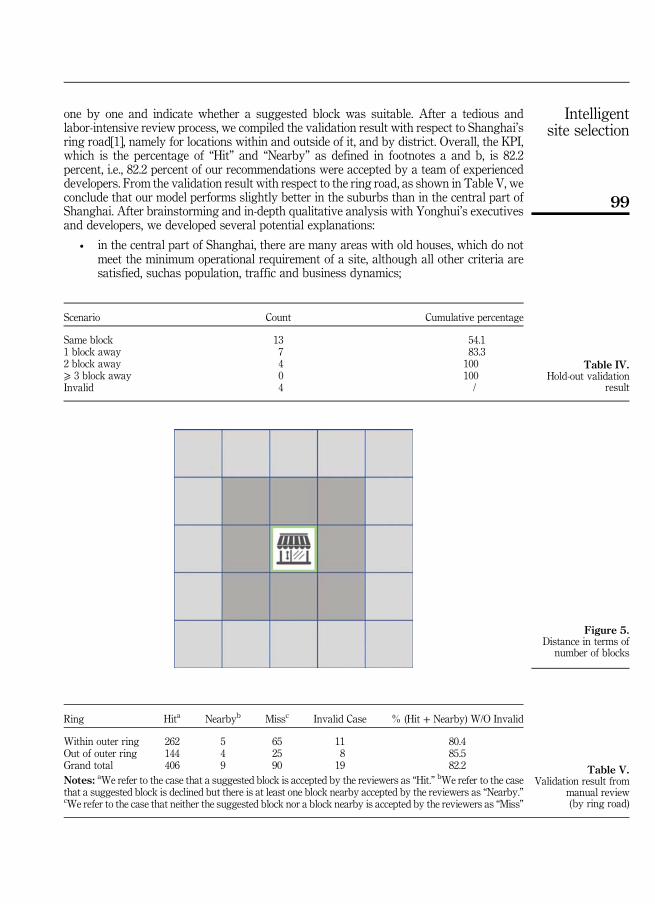
In total, we suggested over 500 new retail sites. For each of the 28 newly opened stores, wechoose the nearest among these over 500 sites and compute the distance between the two.We say the suggested site hits the target if it is in the same block as one of the 28 stores.In fact, 4 of these 28 stores are called invalid stores because they are so close to the existing101 stores in the training set that our model would not recommend any store nearby becausedoing so would violate the minimum distance constraint. For the remaining 24 stores, we findthat 13 suggested stores exactly hit the target, and 83.3 percent of them have the nearestsuggested store at most 250meters away. The detailed performance is also shown in Table IV,where the distance in terms of number of blocks is illustrated in Figure 5. In the figure, thedark grey blocks are one block away from the central store, and the light grey blocks are twoblocks away. In other words, at least 80 percent of our recommendations would have beenacceptable to experienced developers and executives.
In principle, hold-out validation is easy and computationally efficient, but it is notsignificantly convincing since our data set is not large enough. Therefore, we developed asecond method of validation, called manual review. A team of experienced developerswas involved in the manual review process and asked to scrutinize our recommendations
shop_id actual_sales predict_sales APE (%)
9DAP 251,875 245,817 2.49DAZ 448,136 378,755 15.59DBC 280,922 286,619 2.09DBD 175,057 250,618 43.29DBE 259,036 305,302 17.99DBS 275,714 241,131 12.59DBW 237,398 249,989 5.39DBX 418,593 405,742 3.19DAD 325,934 250,626 23.19DBZ 300,390 250,029 16.89DC1 231,725 240,319 3.79DC2 252,247 240,481 4.79DC6 475,695 348,201 26.89DCD 171,802 198,796 15.79DCE 486,483 238,282 51.09DCH 241,366 229,157 5.19DCI 465,806 418,068 10.29DCJ 238,018 228,313 4.19DCT 337,497 238,164 29.49DCZ 258,013 236,746 8.2
Table III.Sales predictionperformance
98
MSCRA1,1
one by one and indicate whether a suggested block was suitable. After a tedious andlabor-intensive review process, we compiled the validation result with respect to Shanghai’sring road[1], namely for locations within and outside of it, and by district. Overall, the KPI,which is the percentage of “Hit” and “Nearby” as defined in footnotes a and b, is 82.2percent, i.e., 82.2 percent of our recommendations were accepted by a team of experienceddevelopers. From the validation result with respect to the ring road, as shown in Table V, weconclude that our model performs slightly better in the suburbs than in the central part ofShanghai. After brainstorming and in-depth qualitative analysis with Yonghui’s executivesand developers, we developed several potential explanations:
• in the central part of Shanghai, there are many areas with old houses, which do notmeet the minimum operational requirement of a site, although all other criteria aresatisfied, suchas population, traffic and business dynamics;
Scenario Count Cumulative percentage
Same block 13 54.11 block away 7 83.32 block away 4 100⩾ 3 block away 0 100Invalid 4 /
Table IV.Hold-out validation
result
Figure 5.Distance in terms of
number of blocks
Ring Hita Nearbyb Missc Invalid Case % (Hit + Nearby) W/O Invalid
Within outer ring 262 5 65 11 80.4Out of outer ring 144 4 25 8 85.5Grand total 406 9 90 19 82.2Notes: aWe refer to the case that a suggested block is accepted by the reviewers as “Hit.” bWe refer to the casethat a suggested block is declined but there is at least one block nearby accepted by the reviewers as “Nearby.”cWe refer to the case that neither the suggested block nor a block nearby is accepted by the reviewers as “Miss”
Table V.Validation result from
manual review(by ring road)
99
Intelligentsite selection
• business dynamics in the central part of Shanghai are substantially more complex,and in some cases, we cannot capture all the key criteria for site selection through ourexisting data source; and
• the scattered development pattern of the suburban area of Shanghai makes siteselection somewhat easier than in the central part of Shanghai.
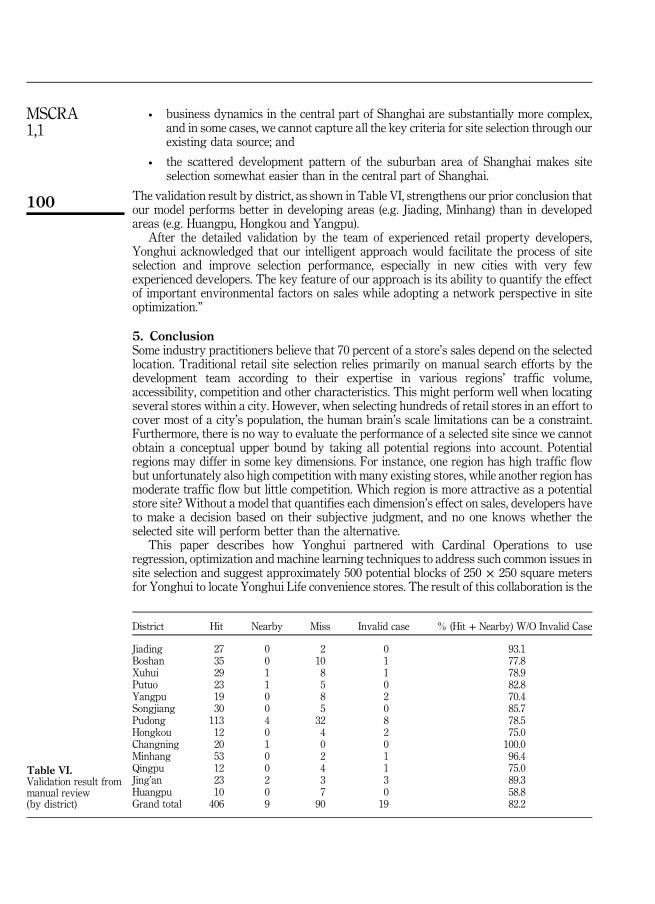
The validation result by district, as shown in Table VI, strengthens our prior conclusion thatour model performs better in developing areas (e.g. Jiading, Minhang) than in developedareas (e.g. Huangpu, Hongkou and Yangpu).
After the detailed validation by the team of experienced retail property developers,Yonghui acknowledged that our intelligent approach would facilitate the process of siteselection and improve selection performance, especially in new cities with very fewexperienced developers. The key feature of our approach is its ability to quantify the effectof important environmental factors on sales while adopting a network perspective in siteoptimization.”
5. ConclusionSome industry practitioners believe that 70 percent of a store’s sales depend on the selectedlocation. Traditional retail site selection relies primarily on manual search efforts by thedevelopment team according to their expertise in various regions’ traffic volume,accessibility, competition and other characteristics. This might perform well when locatingseveral stores within a city. However, when selecting hundreds of retail stores in an effort tocover most of a city’s population, the human brain’s scale limitations can be a constraint.Furthermore, there is no way to evaluate the performance of a selected site since we cannotobtain a conceptual upper bound by taking all potential regions into account. Potentialregions may differ in some key dimensions. For instance, one region has high traffic flowbut unfortunately also high competition with many existing stores, while another region hasmoderate traffic flow but little competition. Which region is more attractive as a potentialstore site? Without a model that quantifies each dimension’s effect on sales, developers haveto make a decision based on their subjective judgment, and no one knows whether theselected site will perform better than the alternative.
This paper describes how Yonghui partnered with Cardinal Operations to useregression, optimization and machine learning techniques to address such common issues insite selection and suggest approximately 500 potential blocks of 250 × 250 square metersfor Yonghui to locate Yonghui Life convenience stores. The result of this collaboration is the
District Hit Nearby Miss Invalid case % (Hit + Nearby) W/O Invalid Case
Jiading 27 0 2 0 93.1Boshan 35 0 10 1 77.8Xuhui 29 1 8 1 78.9Putuo 23 1 5 0 82.8Yangpu 19 0 8 2 70.4Songjiang 30 0 5 0 85.7Pudong 113 4 32 8 78.5Hongkou 12 0 4 2 75.0Changning 20 1 0 0 100.0Minhang 53 0 2 1 96.4Qingpu 12 0 4 1 75.0Jing’an 23 2 3 3 89.3Huangpu 10 0 7 0 58.8Grand total 406 9 90 19 82.2
Table VI.Validation result frommanual review(by district)
100
MSCRA1,1
Intelligent Site Selection System that includes three modules. In the BDS module, by usingthe existing 101 Yonghui Life stores’ sales data, we calibrate, using a generalized additiveregression model, the key dimensions’ effects on sales. Such relationships can be used toassess the potential sales of any potential region. The short-term sales should not be theunique criterion to consider, and population coverage is another criterion for long-rundevelopment. Then in the ISE module, we integrate these two criteria, together with somepractical constraints, and use integer programming to select the top regions. Each region(or block) is of 250 × 250 square meters and in each region, there might be several candidatesites proposed by developers after visiting the suggested region. Which site should Yonghuiultimately select? We need a more precise sales forecasting model that also takes thepotential stores’ information and more detailed micro-environment data into consideration.This is executed in a machine learning model in the PSF module. The site with the highestforecasted sales will enter the final pool of sites for Yonghui Life stores.
The above hybrid approaches to site selection have been applied and proven effective.In an industry with many competitors adopting optimization and artificial intelligencemodels to improve their decision making, it is difficult to imagine that a firm will be able tosurvive while relying on traditional approaches. In other words, in an era with massiveamounts of information collected and digitalized, we believe that firms can excel byexploiting recent developments in intelligent decision-making approaches.
AcknowledgmentsD. Ge is supported by the Program for Innovative Research Team of Shanghai University ofFinance and Economics and Shanghai Institute of International Finance and Economics. B.Jiang is supported in part by the National Natural Science Foundation of China (GrantNos 11771269 and 11831002) and the Program for Innovative Research Team of ShanghaiUniversity of Finance and Economics. X. Wu is supported by the National Natural ScienceFoundation of China (Grant Nos 71622001 and 71571047) and Shuguang Project of ShanghaiMunicipal Education Commission and Shanghai Education Development Foundation(Grant No. 15SG07). The authors are listed in alphabetical order.
Note
1. Yonghui divided Shanghai into two parts with respect to the Outer Ring Road. The central part ofShanghai is located within the Outer Ring Road, while the suburbs of Shanghai are outside theOuter Ring Road.
References
Aggarwal, A., Anand, L., Bansal, M., Garg, N., Gupta, N., Gupta, S. and Jain, S. (2010),“A 3-approximation for facility location with uniform capacities”, Proceedings of the 14th IntegerProgramming and Combinatorial Optimization, pp. 149-162.
Berman, O. and Krass, D. (2002), “The generalized maximal covering location problem”, ComputersOperations Research, Vol. 29 No. 6, pp. 563-581.
Breheny, M.J. (1988), “Practical methods of retail location analysis: a review”, in Wrigley, N. (Ed.), StoreChoice, Store Location and Market Analysis, Routledge, London, pp. 39-86.
Buckner, R.W. (1998), Site Selection: New Advancements in Methods and Technology, Chain StorePublishing Corp, New York, NY.
Karamshuk, D., Noulas, A., Scellato, S., Nicosia, V. and Mascolo, C. (2013), “Geo-spotting: mining onlinelocation-based services for optimal retail store placement”, Proceedings of the 19th ACMSIGKDD International Conference on Knowledge Discovery and Data Mining, ACM, pp. 793-801.
Ladle, J.K., Stiller, D. and Stiller, D. (2009), “Retail site selection: a new, innovative model for retaildevelopment”, Cornell Real Estate Review, Vol. 7 No. 1, pp. 1-26.
101
Intelligentsite selection

Li, S. (2013), “A 1.488 approximation algorithm for the uncapacitated facility location problem”,Information and Computation, Vol. 222, pp. 45-58.
Rogers, D.S. (2007), “Retail location analysis in practice”, Research Review, Vol. 14 No. 2, pp. 73-78.Rohani, A.M.B.M. and Chua, F.F. (2018), “Location analytics for optimal business retail site selection”,
in Gervasi, O., Murgante, B., Misra, S., Stankova, E., Torre, C.M., Rocha, A.M.A.C., Taniar, D.,Apduhan, B.O., Tarantino, E. and Ryu, Y. (Eds), Computational Science and Its Applications –ICCSA 2018, Lecture Notes in Computer Science, Vol. 10960, Springer Nature, AG, pp. 392-405,available at: https://link.springer.com/chapter/10.1007/978-3-319-95162-1_27#citeas
Roig-Tierno, N., Baviera-Puig, A., Buitrago-Vera, J. and Mas-Verdu, F. (2013), “The retail site locationdecision process using GIS and the analytical hierarchy process”, Applied Geography, Vol. 40,pp. 191-198.
Shmoys, D.B., Tardos, E. and Aardal, K. (1997), “Approximation algorithms for facility locationproblems”, Proceedings of the 29th Annual ACM Symposium on Theory of Computing,pp. 265-274.
Sviridenko, M. (2002), “An improved approximation algorithm for the metric uncapacitated facilitylocation problem”, Proceedings of the 9th International Conference on Integer Programming andCombinatorial Optimization, pp. 240-257.
Wang, F., Chen, L. and Pan, W. (2016), “Where to place your next restaurant? Optimal restaurantplacement via leveraging user-generated reviews”, CIKM ‘16 Proceedings of the 25th ACMInternational on Conference on Information and Knowledge Management, pp. 2371-2376.
Wu, Z., Wu, H. and Zhang, T. (1991), “Predict user in-world activity via integration of map query andmobility trace”, UrbComp’15, Sydney, August 10, available at: www.cs.uic.edu/~urbcomp2013/urbcomp2015/papers/User-In-World-Activity-Prediction_Wu.pdf
Xu, M., Wang, T., Wu, Z., Zhou, J., Li, J. and Wu, H. (2016), “Demand driven store site selection viamultiple spatial-temporal data”, SIGSPATIAL/GIS, Vol. 40 No. 10, pp. 1-40.
Yilmaz, E., Elbasi, S. and Ferhatosmanoglu, H. (2017), “Predicting optimal facility location withoutcustomer locations”, KDD’ 17 Proceedings of the 23rd ACM SIGKDD International Conferenceon Knowledge Discovery and Data Mining, pp. 2121-2130.
Zhang, J., Chen, B. and Ye, Y. (2005), “A multiexchange local search algorithm for the capacitatedfacility location problem”, Mathematics of Operations Research, Vol. 30 No. 2, pp. 389-403.
Corresponding authorXiaole Wu can be contacted at: [email protected]
For instructions on how to order reprints of this article, please visit our website:www.emeraldgrouppublishing.com/licensing/reprints.htmOr contact us for further details: [email protected]
102
MSCRA1,1