Embed Size (px)
Citation preview


Inventory Review 2006
Emission Data reported to LRTAP Convention and NEC Directive
Stage 1, 2 and 3 review
and
Evaluation of inventories of HMs and POPs
Vigdis Vestreng, MSC-W Elisabeth Rigler, ETC-ACC Martin Adams, ETC-ACC
Karin Kindbom, IVL
Jozef M. Pacyna, NILU Hugo Denier van der Gon, TNO
Stefan Reis, IER Oleg Travnikov, MSC-E
ISSN 1504-6179 (print) ISSN 1504-6206 (online)

ii

iii
Acknowledgements The authors would like to thank all the Parties to the Convention on Long-Range Transboundary Air Pollution (LRTAP) and the European Union Member States for their enthusiastic participation in this annual review of inventory data and their submission of emission data under the NEC Directive and under the Convention on LRTAP. Without them this report would not have been possible. We have appreciated the guidance and assistance from the Expert Panel on Review (co-chairs Karin Kindbom and Andreas Barkman), and support from the Task Force on Emissions Inventories and Projections (chair person Kristin Rypdal). The UNECE secretariat, Brinda Wachs, has supported the review process, acknowledging the receipt of each LRTAP submission and encouraging Parties to complete their inventories and re-submit data in the required format. Zbigniew Klimont and Janusz Cofala, IIASA, have kindly provided emission data from the RAINS model for the evaluation of completeness of LRTAP data. Tinus Pulles (TNO) is acknowledged for his input to the chapter reviewing POPs inventories and both he and Justin Goodwin representing the ETC-ACC are thanked for their contributions as lead reviewers for the trial Stage 3 centralised review. Heiko Klein and Per Helmer Skaali (MSC-W) have kindly contributed with technical support during the review. Elisabeth Kampel, Traute Köther, Michael Gager and Bernd Gugele (UBA-V) contributed with performing certain tests for this report. This work has been supported through joint funding from EMEP and the European Environment Agency through its European Topic Centre on Air and Climate Change (ETC-ACC). We are grateful for their interest in the continuous work of improving emission inventory quality.

iv

v
EXECUTIVE SUMMARY This report presents the second annual review of emissions data reported under the UNECE Convention on Long-Range Transboundary Air Pollution (LRTAP) and the National Emissions Ceilings Directive (NEC Directive). This annual review is a continuation of the 2005 inventory review that was formally performed for the first time last year. The review has been performed according to the Draft methods and procedures for the technical review of air pollutant emission inventories under the Convention on Long-Range Transboundary Air Pollution (EB.AIR/GE.1/2005/7, annex III) and informed by feedback obtained following the review and trial reviews of air emissions data in previous years. The report is arranged in four main sections. The first two sections present results from the Stages 1 and 2 of the 2006 review of inventory data quality. The objective of the Stage 1 review is to assess compliance aspects such as the timeliness, format and completeness of submissions with respect to Protocol obligations, while Stage 2 considers additional aspects of inventory ‘quality’ such as key source analysis, transparency, source and time series completeness, consistency and comparability of the data, and evaluates the extent and scope of recalculations and inventory comparisons. The feedback to the countries from the Stage 1 and 2 reviews are first the form of country specific review reports, so called Synthesis and Assessment reports Part I (S&A-I). This report includes an example of a S&A-I as provided to all Parties and Member States. The next feedback constitutes an overview of the findings, a Synthesis and Assessment report Part II (this report). This year test results are presented separately for the NEC and the LRTAP data. The preliminary results of the Stage 1 and 2 reviews were presented at the TFEIP/ Expert Panel on Review (EPR) meeting in Amersfoort, Netherlands, 14 June 2006. A main conclusion from this meeting was that the Parties acknowledged the usefulness of the review and considered it should be continued along the same general lines as present. Further support toward this opinion is provided by the increased active participation by countries in the annual review process. The main messages generated from this year’s Stage 1 and 2 review are summarised below. Further details on each issue are provided in the respective sections of the main body of the report. • Completeness: the overall completeness of reporting remains low for many LRTAP
countries. The completeness of the EMEP sector data time series (independent of reporting format, and regardless of time series consistency) is largest for SOx and NOx (80%) and lower for NMVOC and NH3 (70%). The completeness of the reporting of sector data is still lower for the PMs than for the Main Pollutants, but has been steadily increasing, from around 40% completeness in 2000 to about 60% in the reported 2004 emissions.
• Timeliness: The timeliness of reporting increased for the Convention countries compared to last year, but still only 27 Parties (55%) reported on time. By 15 June 2006, the total number of submissions had increased to 35 Parties (71%), an increase of 2 Parties compared to the same time last year. In contrast the number of countries reporting NEC data on time to the European Commission decreased. Only eleven of the twenty-five Member States reported emission data by the due date of 31 December 2005. Including late submissions, a total of twenty-one Member States reported data to the European Commission by July 2006.

vi
• Transparency. After several years of the review process, the level of transparency associated with the reported emissions data is increasing. Despite the fact that the Guidelines only ‘encourage’ Parties to submit Informative Inventory Reports, 35% of Parties submitted this information. Almost half of the Parties responded to the review questions.
• Time-series checks. Many countries reported a need for recalculation of their emission data having reviewed the results of the time series test. Therefore it is also clear that some of the data is not comparable and consistent between years.
• Comparability of data. Two tests to check the comparability of data across countries were performed – calculation of cross-pollutant ratios and implied emission factors. The comparability between pollutants and countries appears relatively good according to the cross-pollutant test, with relatively few outlying values determined. On the other hand, more than 40% of reporting countries showed more than 20 % flagged values in the Implied Emission Factor test. Responses from countries indicate that many of these differences are real, i.e. they correspond to differences in national circumstances such as different fuel splits, technologies etc.
• Fuel sold vs fuel used. This year’s review showed that more countries continue to report emission based on the amount of fuel used to estimate their emissions. The difference in emission values obtained from the two different methods is small in most countries. However, in countries with low fuel prices and resulting high fuel tourism from neighbouring countries, the difference can be as high as 40 %.
• Recalculations. A relatively large number of countries (46% of LRTAP Parties and 50% of NEC) reported significant recalculations (> 10%) between their 2005 and 2006 data submissions. All but two countries explain the reasons for their recalculation, mostly by means of Synthesis and Assessment report Part I; countries are to be thanked for providing this information. The magnitude of recalculations made also provides some indication of the general uncertainty of the emissions, relevant when emission ceiling targets are expressed in absolute terms, and not as percentage reduction targets. There was no general trend seen in the recalculations.
• Comparison of inventory submissions. Differences occur between inventories that countries submit to LRTAP, NEC and under the EU Monitoring Mechanism. Such differences were found to be mainly due to a) different reporting requirements, geographical scope etc and b) less stringent levels of QA/QC checking for air pollutant data reported to EU-MM leading to errors in reporting.
• Improvements for the review process. A number of improvements that could be made in the future in order to improve the utility of the review for countries have been identified. These include refinement of test on time series consistency and cross pollutant ratios, and improvements to REBDAB that countries may use to perform basic quality checks on their data prior to official submission.
The specific recommendations and requests made to the bodies from the 2006 review:
• Harmonisation of the LRTAP reporting Guidelines and NEC reporting on aspects such as source coverage and reporting deadlines;
• Provide a clear definition of completeness to allow this to be formally analysed for compliance purposes;
• Consider if the NEC data can be made publicly available through WEBDAB or an EEA website to improve public accessibility to, and transparency of this data.
• There is a clear need for improved coordination between the European Commission, the EEA and the review team to ensure that reported NEC data is made available for the review.

vii
The third section of the report presents a summary of the main findings from the trial Centralised review performed for the first time in 2006 on the air emission inventories of SOx, NOx, NMVOC and NH3 submitted by Parties to the Convention on Long-Range Transboundary Air Pollution (LRTAP) and by Member States under the requirements of the National Emissions Ceilings Directive (NEC Directive). General conclusions from the Stage 3 trial review consider that a Centralised review is a good model to follow for this type of review, but that time is needed to define the scope and purpose of future reviews. Also a clear guidance regarding what criteria to review against and definition of roles and responsibilities are needed. Further specific conclusions and recommendations were identified: • Guidelines. For review purposes clear guidance regarding what criteria to review against
is necessary in order to be able to assess completeness i.e. the mandatory reporting requirements on a country-specific basis. Submission of an IIR is necessary for review purposes and should be made mandatory in the Guidelines if future detailed reviews are desired. Similarly activity data that can be used in verifying emissions should be made available. A number of recommendations for the reporting template were identified to improve the comparability, transparency and consistency of data reported by countries.
• Guidebook. The Guidebook was considered suitable as a point of reference for the purposes of detailed review for the pollutants covered in this review. It was foreseen that the Guidebook will not provide sufficient information for other pollutants (e.g. PM10, pesticides etc) and will need to be further developed to support future review activities.
• Usefulness of Stage 1 and 2 reviews. The country specific reports from the Stage 1&2 review were considered by the expert reviewers to provide very useful input to the detailed review and were considered an excellent way of giving feedback to countries.
• Value of a Stage 3 review. The review team identified a number of issues concerning the value added from a stage 3 detailed review as compared with Stage 1&2 review. A number of benefits that may be obtained from participating in a Stage 3 review were identified both for the countries being reviewed as well as for the experts participating in the review. The most important of these was seen as being able to provide country-specific feedback and recommendations to help in prioritisation and inventory improvement, as well as a deeper assessment of comparability, e.g. methodologies and emission factors used.
Finally, the fourth section of this document presents recent independent studies addressing emissions of Heavy Metals and Persistent Organic Pollutants within (parts of) the EMEP domain. The results of these may be useful in reviewing official submitted HM and POP emission data reported annually to the Secretariat of the UNECE under the Convention LRTAP. Furthermore, data collected in these projects, comparisons between expert and official data and lessons learned may provide suggestions to improve the current official data reporting.

viii

ix
Contents
1 INTRODUCTION .......................................................................................................... 1
2 STAGE-1 REVIEW........................................................................................................ 3 2.1 Timeliness of submissions 3 2.2 Format 5 2.3 TRANSPARENCY 6
3 STAGE-2 REVIEW RESULTS AND ANALYSIS...................................................... 7 3.1 Introduction 7 3.2 Key source analysis 8 3.3 Completeness 11 3.4 Consistency 17 3.5 Comparability – cross pollutant tests 18 3.6 Comparability – recalculations 21 3.7 Comparability - inventory comparison 23 3.8 Comparability – fuel sold fuel used 26 3.9 Time series consistency 27 3.10 Implied emission factor checks 28 3.11 Conclusions and recommendations from the 2006 Stage 1 and 2 review 33 3.12 References 35
4 REPORT OF THE TFEIP ‘EXPERT PANEL ON REVIEW’ SECRETARIAT ON THE TRIAL THIRD STAGE REVIEW OF THE LRTAP AND NEC AIR EMISSION INVENTORIES ....................................................................................... 36 4.1 Introduction 36 4.2 Mandate 36 4.3 Objectives 37 4.4 Review management 37 4.5 Review planning and process 37 4.6 Trial review roles and responsibilities. 40 4.7 Technical review findings (by lead reviewers) 41 4.8 Feedback from the expert review team on the trial Stage 3 review process and
findings 42 4.9 Conclusions and issues for consideration for the future development of a Stage 3
review 48 4.10 References 50
5 EVALUATION OF INVENTORIES OF HEAVY METALS AND PERSISTENT ORGANIC POLLUTANTS WITHIN THE CONVENTION ON LRTAP ............ 51 5.1 Introduction 51 5.2 Heavy Metals: Differences between ESPREME emission data and official data. 54 5.3 Persistent Organic Pollutants 65 5.4 Substances proposed for possible addition to the POPs protocol 72 5.5 References 75
6 APPENDICES............................................................................................................... 93

x
1
1 INTRODUCTION At its twenty-first session, 21st January 2004, the Executive Body of the Convention on Long-range Transboundary Air Pollution (LRTAP) recognized the importance of high-quality emission data and strongly encouraged further work on its improvement and validation (UNECE, 2004a, paras. 56 and 60(n)1). The Convention’s Task Force on Emission Inventories and Projections (TFEIP), in collaboration with the European Environmental Agency (EEA) and the European Commission’s Joint Research Centre (JRC), has subsequently initiated an Inventory Improvement Programme. This initiative has been supported by the European Commission, as it is also relevant to emission data submitted under Directive 2001/81/EC (EC, 2001) of the European Parliament and of the Council on national emission ceilings for certain atmospheric pollutants (the NEC Directive). This report presents results from the second annual review of emissions data reported under the UNECE Convention on Long-Range Transboundary Air Pollution (LRTAP) and the NEC Directive. This annual review is a continuation of the inventory review that was performed in 2005, and the two preceding trial reviews performed in 2003 and 2004 (e.g. Vestreng et al., 2005). In 2006, as in the preceding reviews, the assessment of the inventory data has been performed on both emissions data reported under the LRTAP Convention and under the NEC Directive. The review results for the two datasets are shown separately under each of the review tests. The review itself has been performed according to the Draft methods and procedures for the technical review of air pollutant emission inventories under the Convention on Long-Range Transboundary Air Pollution (EB.AIR/GE.1/2005/7, annex III). This formal review process currently consists of two stages: Stage 1 assesses compliance aspects such as the timeliness, format and completeness of submissions with respect to Protocol obligations, while Stage 2 considers additional aspects of inventory ‘quality’ such as key source analysis, transparency, source and time series completeness, consistency and comparability of the data, and evaluates the extent and scope of recalculations and inventory comparisons. As in previous years, Parties were requested to report according to the criteria for reporting in the Emission Reporting Guidelines2 (herafter referred to as the Guidelines), and were encouraged to check their submissions for correct formatting, internal consistency and completeness before transmitting them to the UNECE secretariat for stage 1 reviews. To facilitate this task, the latest update of the electronic data-checking tool, REPDAB, including key source analysis and trend plots, was made available to Parties at: http://webdab.emep.int/repdab.html. In addition to the formal Stage 1 and 2 reviews, a main focus this year has also been on the development of a trial in-depth (Stage-3) review, as agreed at the 2005 joint EIONET/TFEIP meeting at Rovaniemi, Finland. The Stage 3 reviews are intended to build on results from Stages 1 and 2 and aim to assess several aspects of inventory quality, including accuracy. A trial stage 3 centralised, review was therefore carried out on the submissions from 11 countries in February 2006 on a voluntary basis. As with the Stage 1 and 2 reviews, this
1 UNECE, 2004a, ECE/EB.AIR/79, Report on the twenty-first session of the Executive Body, UNECE, 21. January, 2004. 2 UNECE, 2003, Emission Reporting Guidelines, Air Pollution Studies No. 15, United Nations, New York and Geneva, 2003
2
initiative has also been supported by the European Commission. Scope and purpose for future in-depth (Stage 3) reviews are currently being developed by the Task Force on Emission Inventories and Projections and will be discussed at the Steering Body at its thirtieth session (4-6 September, Geneva, Switzerland).. We have also continued the review of Heavy Metals (HMs) and Persistent Organic Pollutants (POPs), initiated in the 2005 review. Moreover, both the NEC Directive and the Protocol to Abate Acidification, Eutrophication and Ground-level Ozone (Gothenburg Protocol) are being reviewed in 2006-2007. A focus has therefore also been to assess the completeness of emission data, emissions recalculations and the comparability of NEC and LRTAP data. The report has four main sections. The two first sections present the summary of Stages 1 and 2 of the 2006 review of inventory data quality, referred to as the Synthesis and Assessment report Part II (S&A-II). The first Synthesis and Assessment report (S&A-I), were the country specific reports posted on a password protected site on the EMEP website (http://www.emep.int/REVIEW/2006/) on 15th May 2006. An example of a country-specific Synthesis and Assessment report is provided in Appendix 6. These S&A-I contain the same elements as covered in the two first sections of this report, but at a country specific level. The review has included all data that were officially submitted and received by the review team of experts by 10th March 2006. The data was available to the countries from WEBDAB (http://webdab.emep.int/) (Vestreng and Klein, 2002) at the time the country specific reports were launched, and to the public in general from June 2006. Ten review tests have been performed. Two of these can be regarded as being compliance-focussed i.e. assessments of the timeliness and format of the submitted data. In contrast, the remaining eight tests (analysis of key sources, completeness, consistency, cross pollutant, recalculations, inventory comparison, time series, implied emission factors) share the general aim of providing countries with information to allow them to optimise their own inventory quality and hence future reporting in subsequent submission rounds. Additionally, it is intended that the more general findings from the review can also be used to prioritise future activities of the Task Force on Emission Inventories and Projections (TFEIP) and the European Environment Information and Observation Network (EIONET). The third section of this report presents a summary of the main findings from the Stage-3, trial centralised review, prepared by the review Secretariat team. Finally, the fourth section presents recent independent studies addressing emissions of Heavy Metals and Persistent Organic Pollutants within (parts of) the EMEP domain. The results of these may be useful in reviewing official submitted HM and POP emission data reported annually to the Secretariat of the UNECE under the Convention LRTAP. Furthermore, data collected in these projects, comparisons between expert and official data and lessons learned, may provide suggestions to improve the current official data reporting. The preliminary results from the Stage 1-3 review were presented at the TFEIP/ Expert Panel on Review (EPR) meeting in Amersfoort, Netherlands, 14 June 2006. The experiences with the 2006 review procedures will also be further discussed at the joint EIONET/TFEIP meeting in Thessaloniki, Greece, 31 October – 2 November 2006. The results of the 2006 inventory review contained in this report will be presented there, and the TFEIP and EIONET will have the opportunity to give feedback, taking account of comments from the thirtieth session of the EMEP Steering Body, with the aim of improving review procedures in future years.

3
2 STAGE-1 REVIEW An overview of the results from Stage-1 review together with information on the amount of documentation received for each LRTAP submission can be found in Appendix 1.
2.1 TIMELINESS OF SUBMISSIONS
Key messages –Timeliness • LRTAP: A total of 27 Parties reported emission data by the due date of 15 February 2006.
This was an increase of 3 Parties compared to last year (2005) and implied that 55% of Parties reported their submissions in time. By 15 June 2006, the total number of submissions had increased to 35 Parties (71%), an increase of 2 Parties compared to the same time last year.
• NEC: Only eleven of the twenty-five Member States reported emission data by the due date of 31 December 2005. Six EU15 Member States reported by this date, a decrease of three Member States compared to last year. Five new EU10 Member States reported emission data on time, an increase of 2 Member States compared to last year. Including late submissions, a total of twenty-one Member States have reported data to the European Commission by July 2006. Stage 2 tests were performed for 15 countries (excluding Finland and Denmark and including Italy for 2003) for national totals and 14 countries (excluding Hungary) that reported in the NFR format.
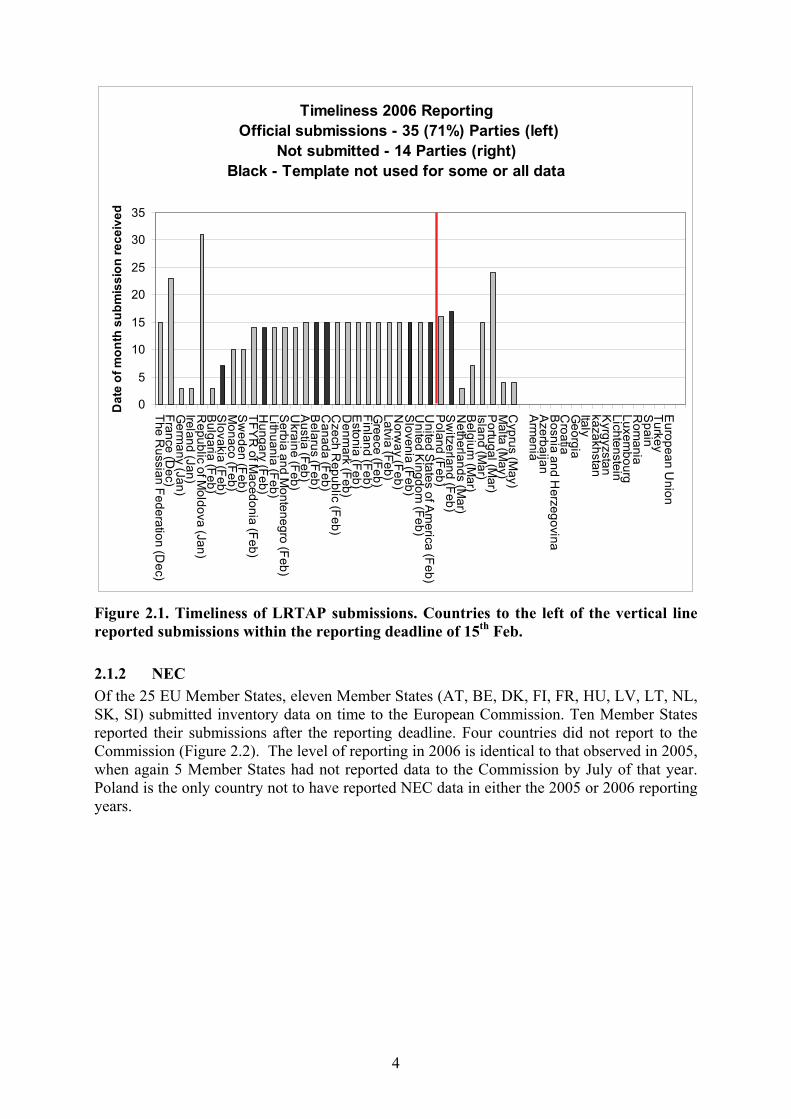
2.1.1 LRTAP Figure 2.1 displays the timeliness of the Party submissions of data under the Convention of LRTAP. The submission date is annotated at the y-axis, while the Parties are listed on the x-axis. Parties listed to the left in the figure submitted data in the 2006 reporting round (71%), 55% of them within deadline (those listed to the left of the red line). Parties to the right have not submitted data in 2006 at the time of writing this report. The issue of Parties resubmitting (corrected) data after the formal reporting deadline was discussed in the meeting of the Expert Panel on Review, June 14th 2006 in Amersfoort, theNetherlands. It was clarified that the review ‘Draft Methods and Procedures’ document (UNECE 2005) allows a 3-week window for Parties to resubmit data following the reporting deadline. The objective of this 3 week period is to provide Parties with an opportunity to find obvious errors and mistakes in their submissions (assisted by the Stage 1 review feedback provided by the UNECE Secretariat); countries then have an opportunity to further improve the quality of their submitted data that can subsequently be used in the review process and for EMEP modelling purposes.
4
Timeliness 2006 Reporting Official submissions - 35 (71%) Parties (left)
Not submitted - 14 Parties (right)Black - Template not used for some or all data
0
5
10
15
20
25
30
35
The Russian Federation (D
ec)France (D
ec)G
ermany (Jan)
Ireland (Jan)R
epublic of Moldova (Jan)
Bulgaria (Feb)
Slovakia (Feb)
Monaco (Feb)
Sw
eden (Feb)TFY
R of M
acedonia (Feb)H
ungary (Feb)Lithuania (Feb)S
erbia and Montenegro (Feb)
Ukraine (Feb)
Austia (Feb)
Belarus (Feb)
Canada (Feb)
Czech R
epublic (Feb)D
enmark (Feb)
Estonia (Feb)
Finland (Feb) G
reece (Feb)Latvia (Feb)N
orway (Feb)
Slovenia (Feb)
United K
ingdom (Feb)
United S
tates of Am
erica (Feb)P
oland (Feb)S
witzerland (Feb)
Netherlands (M
ar)B
elgium (M
ar)Island (M
ar)P
ortugal (Mar)
Malta (M
ay)C
yprus (May)
Arm
eniaA
zerbaijanB
osnia and Herzegovina
Croatia
Georgia
ItalykazakhstanK
yrgyzstanLichtensteinLuxem
bourgR
omania
Spain
TurkeyE
uropean Union
Dat
e of
mon
th s
ubm
issi
on re
ceiv
ed
Figure 2.1. Timeliness of LRTAP submissions. Countries to the left of the vertical line reported submissions within the reporting deadline of 15th Feb.
2.1.2 NEC Of the 25 EU Member States, eleven Member States (AT, BE, DK, FI, FR, HU, LV, LT, NL, SK, SI) submitted inventory data on time to the European Commission. Ten Member States reported their submissions after the reporting deadline. Four countries did not report to the Commission (Figure 2.2). The level of reporting in 2006 is identical to that observed in 2005, when again 5 Member States had not reported data to the Commission by July of that year. Poland is the only country not to have reported NEC data in either the 2005 or 2006 reporting years.

5
0
5
10
15
20
25
30
35
Finland (Dec)
Slovakia (Dec)
Denm
ark (Dec)
Netherlands (D
ec)
Belgium (D
ec)
Slovenia (D
ec)
France (Dec)
Hungary (D
ec)
Austria (Dec)
Latvia (Dec)
Lithuania (Dec)
Sw
eden (Jan)
Estonia (Jan)
U.K. (Jan)
Ireland (Jan)
Greece (Feb)
Malta (M
ar)
Portugal (M
ar)
Cyprus (A
pr)
Spain (Jun)
Italy (Jun)
Czech R
ep.
Germ
any
Luxembourg
PolandD
ate
of m
onth
sub
mis
sion
s re
ceiv
ed
Figure 2.2. Date of first receipt of Member State NEC submissions received by the Commission or the EEA by 30 June 2006. Member States submitting data within deadline are displayed to the left (light), the others to the right (dark). From the perspective of the review team, problems again experienced in 2006 in terms of receiving NEC data in time for inclusion in the review. Several countries (e.g. Finland, Denmark) reported NEC data to the European Commission, but this data was not made available to the EEA or the review team, which would have allowed it to be included within this year’s review. This was evident when Parties responded to the Synthesis and Assessment Report Part I. As has been noted in previous years, there is still a clear need to improve the organisation and dataflow between the EC, EEA and the review team and to agree a clear definition of responsibilities. It is also noted that there are more MS reporting to LRTAP than to NEC. The earlier NEC deadline is known to be one aspect behind the lower levels of reporting observed to NEC.
2.2 FORMAT Key messages – Format
• LRTAP: Reporting in the NFR format has increased dramatically for all Parties since 2000. In 2006, all Parties submitted data for source categories using the Nomenclature for Reporting (NFR) format specified in the Guidelines, with the exception of the United States.
• EMEP still has to use emissions reported using the old SNAP format, including the intermediate NFR 01 format, for a substantial amount of emission data in the 1990s as about 80% of Parties have not recalculated their time series with the new (NFR02) format.
• NEC: Of the Member States that had reported NEC emission data by 30 June 2006, only Hungary reported data in a non-standard format. All other Member States that did report used the new NFR format for reporting.

6
2.2.1 LRTAP All Parties submitted data in the 2006 reporting round according to the format specified in the Guidelines using the Nomenclature for Reporting (NFR) for source categories, with the exception of the United States. Seven countries reported additional data in formats other than in the NFR template provided. These countries are shown in black in Figure 2.1.
2.2.2 NEC Of the Member States that had reported NEC emission data by 30 June 2006, only Hungary reported national totals in a non standard format (MS Word tables). All other Member States that did report used the new NFR format for reporting.
2.3 TRANSPARENCY
Key messages – Transparency • Seventeen Parties (i.e. 35%) submitted an Informative Inventory Report (IIR) to
accompany their 2006 LRTAP submissions, an encouraging level given that that submission of an IIR is not mandatory.
• Twenty-three countries (47% of total or 66% of those reporting) replied to the stage-2 country specific Synthesis and Assessment review reports (Appendix 6). This was a considerable increase in the transparency from earlier years. The IIR submissions have more than doubled since 2004. Both the number of IIRs and the responses increased by 5 countries since last year.
2.3.1 LRTAP The overall transparency of the data submissions has increased substantially, particularly as a result of the introduction of the stage-2 review and its responses. The present reporting Guidelines do not request, but merely encourages, the submission of an Informative Inventory Report (IIR). Seen in this perspective it is indeed encouraging that 35% of the Parties do submit this information. The number of IIRs and review responses are quite similar (17 versus 23), but the content and structure of the IIR does not always make it easy or even possible to find the answers to the specific review questions posed to countries. The challenges for Parties to provide an IIR suitable for informing the review process were discussed at the TFEIP meeting in 12-13 June 2006 in Amersfoort, the Netherlands. The proposal for a revision of the 2002 Guidelines will include a template for the IIR and a request to make this information mandatory. Appendix I gives an overview of Parties which have submitted IIRs and or Review responses.

7
3 STAGE-2 REVIEW RESULTS AND ANALYSIS 3.1 INTRODUCTION
This review was performed in accordance with the methods and procedures for review of emissions data under the LRTAP as outlined in Annex III of EB.AIR/GE.1/2005/7 (UNECE 2005). In addition, efforts have been made to meet the requests from the Parties following feedback from the first annual review in 2005 (Vestreng et al., 2005) and earlier trial reviews (e.g. Vestreng et al., 2004). The 2006 Stage 2 review presents the results of different types of review tests and lists specific questions about emissions inventory submissions to LRTAP and NEC. We have chosen to focus the tests on main pollutants, PMs and priority HMs and POPs and on key sources. This year’s review was performed by EMEP/MSC-W in co-operation with the European Topic Centre on Air and Climate Change (ETC-ACC) partner institutes UBA-Vienna and AEA Technology.
An underlying objective of the review process is to encourage and support inventory improvements. As part of the Inventory Improvement Programme under the Task Force on Emission Inventories and Projections (TFEIP), Parties are encouraged to gradually improve the quality of their reporting. However, it is recognised that Parties do not always have the levels of resources required to implement all possible improvements in time for the next reporting round. We do appreciate ideas for better solutions that may be implemented at an international level to help improve the reporting and quality at national scale over a longer timescale.
The improvements introduced to this year’s country specific review reports were:
• Separate testing and reporting of results for LRTAP and NEC data if the inventories are proved to differ by more than 0.1%;
• Improved key source analysis including percentage contribution for each sector; • Introduction of two ‘average’ reports, one for Eastern Europe and one for Western
Europe, to allow Parties to compare results against the ‘average’ results for their respective region;
• Improved completeness testing with a stronger focus on Protocol requirements, priority compounds, key sources and reporting of Not Estimated;
• Improved comparability testing by introducing ratios for a greater number of pollutants where relevant;
• Inclusion of inventory comparisons with EU Monitoring Mechanism data; • Inclusion of summary trend plots; • Streamlining and extension of the time series ‘dips and jumps’ check for main
pollutants back to 1980; • Improved implied emission factor (IEF) checks by analysis using the UNFCCC outlier
tool.
The country specific review reports containing questions from the review tests were made available on a password protected website under EMEP the 15th May 2006, requesting response by 15 June 2005. An example country specific report is provided below in Appendix 6.

8
The emission data included in the 2006 review were those data reported to the UNECE under the LRTAP Convention, or to the European Commission under the NEC Directive, and received before 10th March 2006/28 February 2006 respectively. The LRTAP data included in the review was made available to Parties through a pre-release of WEBDAB, at the same time as the country specific reports were issued. The draft review findings were discussed at the meeting of the TFEIP/Expert Panel on Review at its meeting in Amersfoort, the Netherlands, 12-14 June 2006. The countries present provided feedback that indicated they found the Stage 1 and 2 review process to be very helpful in terms of assisting to improve the quality of their own national inventories, and supported its continuation. Some recommendations for future developments were given, and these are listed in chapter 6 below. The results from the Stage 2 review are also able to provide feedback to the more in-depth Stage 3 review assessments. For example, a trial Stage 3 centralised review was performed in Copenhagen 27 February-3 March 2006 (see Chapter 4). Feedback from the experts involved in this review showed the Stage 1 and 2 review reports were useful input for the purposes of the Stage 3 review.
3.2 KEY SOURCE ANALYSIS Key messages – key source analysis
A modified key source analysis was performed in 2006 in order to identify major emission sources by country and compound. • Feedback received from Parties indicated they were pleased with the key source analysis
developments, and appreciated that these analysis are also available from the submission checking tool REPDAB.
• The average key source analysis for West and East Europe shows few differences, except that the Western countries tend to report information on a more detailed level than the Eastern countries.
This section describes the key source analysis performed under the Stage-2 review. Each country that had submitted data was provided with a key source analysis for 2004 in their review report. In addition, REPDAB provided key source analysis for each year submitted, for those countries that used this tool to check their data prior to submission. The analysis for the review report was made both at most aggregated and least aggregated sectoral (NFR02) levels if sufficient amount of data was provided. This was an improvement from last year where analysis at only one level of aggregation was provided. An average regional key source analysis was also made available for countries: one for Eastern Europe (Albania, Armenia, Azerbaijan, Belarus, Bosnia and Herzegovina, Bulgaria, Croatia, Czech Republic, Estonia, Georgia, Hungary, Kazakhstan, Kyrgyzstan, Latvia, Lithuania, Poland, Republic of Moldova, Romania, Serbia and Montenegro, Slovakia, Slovenia, TFYR of Macedonia, The Russian Federation, Turkey, Ukraine); and one for Western Europe (Austria, Belgium, Denmark, Finland, France, Germany, Greece, Iceland, Ireland, Italy, Luxembourg, Netherlands, Norway, Portugal, Spain, Sweden, Switzerland, and the United Kingdom). Parties responded in their review replies that they appreciated these improvements. The analysis on the least aggregated level for Eastern and Western European countries is
9
displayed in Table 3.1 and Table 3.2 below. A list of NFR02 sector codes can be found in Appendix 2. The tables present the key sources in order of importance on the x-axis and the priority pollutants on the y-axis. The table presents the NFR02 sector codes along with the percentage contribution of each respective sector to the national total. When 95% of national total or 10 sources (whichever came first) was reached, the sum of key sectors in percent was presented in column “Total %” and the number of sources not listed in the column “Not listed”. The most important key sources are very similar between the Eastern and Western European countries. The most striking difference is found in the level of detail provided within the two groups. The Eastern countries more often take the opportunity to report only aggregated levels of emissions, e.g. 1A3b, Road Transport, without detailing the emissions to different vehicle types. The larger number of sectors for emissions in the West is also reflected in the “Not listed” column, where except for a few exceptions, the West has a larger variation of sources. Differences occur for PMs and POPs. PM10 and PM2.5 from Residential plants (1A4bi) is more important in Western Europe than Energy production (1A1a), which seems to be most important in the East. Petroleum refining (1A1b) is the most important PCDD/F source in the West, while Residential plants (1A4bi) has this position in the East. While Metal production (2C) is the largest HCB source in the East, Manufacturing in industries of Non-ferrous metals (1A2b) is the largest source in the West. Average key source distribution reports like this should be interpreted with care, as the overview is biased towards the distribution of the largest emitter countries in each group. A smaller country could have a very different source distribution. As mentioned before, the countries were provided with key source analysis for their own country. Countries responding to the stage-2 review had no comments to the key source analysis performed.

10
Table 3.1. Key source analysis for Eastern European countries Component Key source categories (Sorted from high to low from left to right) Total (%) Not listed
SOx 1 A 1 a (59.1%)
1 A 2 (16.2%)
1 A 4 b (5.3%)
1 A 3 b (4.0%)
1 A 3 e ii(2.8%)
1 A 4 a (1.8%)
2 C (1.2%)
1 A 1 b (1.2%)
1 A 1 c (1.0%)
1 A 4 c i (0.6%) 93.2 31
NOx 1 A 3 b (37.6%)
1 A 1 a (24.8%)
1 A 3 e ii (14.7%)
1 A 2 (9.0%)
1 A 4 b (3.0%)
1 A 4 c ii(1.9%)
2 C (1.2%)
1 A 3 c (0.9%)
2 B (0.8%)
1 A 4 a (0.7%) 94.5 2
NH3 4 B (77.0%)
4 D 1 (8.1%)
2 B 1 (3.0%)
1 A 4 c (0.8%)
6 B (0.8%)
6 D (0.7%)
1 B 2 (0.4%)
1 A 3 b (0.3%)
2 B 5 (0.2%)
4 F (0.1%) 91.4 26
NMVOC 1 A 3 b (51.4%)
1 A 2 (9.4%)
1 B 2 (8.5%)
7 (6.3%)
3 A (4.3%)
1 A 4 b i(3.0%)
3 D (2.2%)
1 A 4 b ii(2.0%)
3 C (1.3%)
3 B (1.3%) 89.8 7
CO 1 A 3 b (61.6%)
1 A 2 (11.2%)
1 A 4 b i (11.0%)
2 C (5.0%)
6 C (3.9%)
1 A 4 c i(1.2%)
1 A 1 a(0.6%)
1 A 4 b ii(0.5%) 95.1 0
TSP 2 C (15.3%)
1 A 1 a (4.5%)
2 A 6 (2.7%)
1 A 4 b i (1.4%)
1 A 2 b (0.6%)
1 A 2 f (0.5%)
1 A 2 a(0.2%)
2 A 1 (0.1%)
1 A 3 b (0.1%)
1 A 4 c ii (0.1%) 25.5 39
PM10 1 A 1 a (33.8%)
1 A 4 b i(20.2%)
1 A 3 b (6.8%)
1 A 2 a (6.5%)
1 A 2 b (4.8%)
2 A (4.7%)
1 B 2 (3.6%)
2 C (1.8%)
1 A 4 c i(1.7%)
1 A 1 c (1.7%) 85.6 10
PM2.5 1 A 1 a (30.8%)
1 A 4 b i(23.7%)
1 A 3 b (9.4%)
1 A 2 a (6.9%)
1 A 2 b (4.9%)
2 A (4.8%)
1 B 2 (3.7%)
1 A 4 c i(1.7%)
1 A 4 c ii(1.4%)
6 C (1.4%) 88.8 8
Pb 1 A 2 (43.7%)
1 A 1 a (13.9%)
2 A 7 (7.7%)
2 C (7.7%)
6 C (7.0%)
1 A 4 c i(6.4%)
1 A 3 b(4.4%)
1 A 4 b (3.5%)
1 B 1 b (1.2%) 95.4 0
Hg 1 A 1 a (41.6%)
1 A 2 (23.8%)
1 A 3 b (13.0%)
6 C (4.4%)
1 A 4 b i(4.2%)
1 A 1 c (3.2%)
2 A (2.4%)
1 A 4 c i(1.6%)
2 B 5 (1.4%) 95.6 0
Cd 1 A 2 (48.2%)
1 A 1 a (19.5%)
1 A 4 c i (13.5%)
1 A 4 b i (5.0%)
1 B 1 b (3.8%)
2 C (2.5%)
6 C (2.3%)
1 A 3 b (1.7%) 96.5 0
DIOX 1 A 4 b i (27.7%)
6 D (18.7%)
1 A 2 (17.7%)
1 A 1 a (13.3%)
2 C (10.9%)
6 C (5.0%)
1 A 3 b i(1.2%)
1 A 4 a (0.9%) 95.5 0
PAH 1 A 4 b i (71.6%)
1 A 4 c i(12.8%)
1 B 1 b (10.0%)
2 C (3.6%) 98.0 0
HCB 2 C (51.7%)
1 A 2 (25.9%)
1 A 1 a (8.7%)
1 A 4 b i (6.1%)
6 C (5.5%) 97.9 0
Table 3.2. Key source analysis for Western European countries Component Key source categories (Sorted from high to low from left to right) Total (%) Not listed
SOx 1 A 1 a (47.3%)
1 A 1 b (10.0%)
1 A 2 f (9.7%)
1 A 4 b i (5.6%)
1 A 2 a (2.9%)
1 A 3 d ii(2.3%)
1 B 2 a (2.3%)
1 A 4 a (2.3%)
2 B 5 (2.0%)
1 A 2 c (1.6%) 86.0 8
NOx 1 A 3 b iii (20.2%)
1 A 3 b i(15.3%)
1 A 1 a (15.3%)
1 A 2 f (9.1%)
1 A 4 c ii(5.1%)
1 A 4 b i(5.0%)
1 A 3 b ii(4.4%)
1 A 3 d ii(3.6%)
4 D 1 (2.3%)
1 A 1 c (2.1%) 82.5 14
NH3 4 B 1 b (24.8%)
4 B 1 a (21.7%)
4 D 1 (17.2%)
4 B 8 (15.2%)
4 B 9 (10.6%)
1 A 3 b i(2.2%)
4 B 3 (1.5%)
4 B 13 (1.4%)
4 B 6 (1.0%) 95.5 0
NMVOC 1 A 3 b (19.0%)
3 D (17.5%)
3 A (14.8%)
1 B 2 a (8.7%)
1 A 4 b i(8.3%)
3 C (3.4%)
2 D 2 (3.1%)
2 B 5 (3.1%)
4 D 1 (2.8%)
3 B (2.1%) 82.9 13
CO 1 A 3 b i (31.2%)
1 A 4 b i(21.1%)
1 A 2 a (10.3%)
2 C (9.5%)
1 A 2 f (3.9%)
1 A 3 b iv(3.2%)
1 A 4 b ii(2.5%)
1 A 3 b ii(2.3%)
1 A 1 a (1.7%)
6 C (1.6%) 87.1 12
TSP 2 A 7 (22.6%)
4 D 1 (17.4%)
1 A 4 b i (9.8%)
1 A 5 b (7.1%)
1 A 3 b vi(5.2%)
2 A 6 (4.9%)
2 C (4.2%)
1 A 2 f (2.8%)
7 (2.1%)
1 A 4 c ii (2.0%) 78.1 16
PM10 1 A 4 b i (20.2%)
2 A 7 (12.1%)
4 D 1 (7.8%)
2 C (5.5%)
1 A 3 b vi(4.6%)
1 A 2 f (4.2%)
1 A 3 b i(4.0%)
4 B 9 (3.6%)
1 A 1 a (3.2%)
7 (3.1%) 68.2 22
PM2.5 1 A 4 b i (29.5%)
2 A 7 (9.1%)
2 C (5.9%)
1 A 3 b i (5.7%)
1 A 2 f (5.1%)
1 A 3 b iii(4.5%)
1 A 3 b ii(4.2%)
1 A 4 c ii(3.8%)
1 A 1 a (3.2%)
4 D 1 (2.9%) 74.0 20
Pb 1 A 2 f (42.7%)
2 C (12.8%)
1 A 2 a (6.2%)
1 A 3 a ii (ii)(5.0%)
1 A 3 b i(4.5%)
1 A 4 b i(4.3%)
1 A 1 a (4.0%)
1 A 3 b iii(3.0%)
1 A 3 b ii(2.6%)
1 A 4 a (2.5%) 87.8 5
Hg 1 A 1 a (36.2%)
6 A (11.2%)
1 A 2 f (10.7%)
6 C (9.9%)
2 B 5 (8.3%)
2 C (5.5%)
1 A 4 b i(4.7%)
1 A 2 a (2.4%)
1 A 1 b (2.3%)
1 A 2 d (2.2%) 93.5 2
Cd 1 A 2 f (22.4%)
2 C (22.1%)
1 A 1 a (13.2%)
1 A 1 b (12.8%)
1 A 4 b i(8.3%)
1 A 2 a (3.7%)
1 A 2 d (3.1%)
1 A 2 b (3.0%)
6 C (1.4%)
1 A 3 b i (1.3%) 91.2 4
DIOX 1 A 1 b (67.7%)
6 C (10.5%)
1 A 1 a (4.1%)
1 A 3 b i (3.4%)
1 A 4 b i(3.0%)
2 C (3.0%)
1 A 2 f (1.9%)
1 A 2 a (1.4%)
1 A 3 b iii(0.9%) 95.8 0
PAH 1 A 4 b i (24.2%)
3 D (23.4%)
2 G (15.1%)
1 A 3 b i (12.9%)
2 C (7.9%)
1 A 3 b iii(3.5%)
1 A 3 b ii(2.1%)
1 B 1 b (1.9%)
1 A 2 f (1.3%)
2 A 6 (1.0%) 93.4 2
HCB 1 A 2 b (88.5%)
2 C (4.5%)
1 A 4 b i (2.8%) 95.7 0
11
3.3 COMPLETENESS
Key messages – completeness LRTAP: • For the first time all Parties have now reported at least one emissions figure under the
Convention on LRTAP. • Only 20% of Parties report complete time series in NFR 1990-2004 for the main
pollutants (2000-2004 for PMs), e.g. emissions are reported for all years and relevant source sectors .
• The completeness of the EMEP sector data time series (independent of reporting format) is largest for SOx and NOx (about 80%) and less (about 68%) for NMVOC and NH3. Reporting of PM began in 2000 and is almost solely reported in NR02 format. For PM, the completeness of sector data is still lower than for the Main Pollutants, but has been steadily increasing, from around 40% in 2000 to about 60% completeness in 2004.
• The completeness of sector time series data for priority heavy metals (cadmium, lead and mercury varies between pollutant and years, and is between 29-50% complete for lead and cadmium and 37-61% for mercury. Completeness for priority POPs was even lower, 29-48% for PCDD/F and PAH, while only eight countries (16%) reported HCB emissions.
• Parties should not report an emission figure more than once at the time. E.g. not report different or even similar national totals in both NFR and SNAP.
NEC: • According to the requirements of the NEC directive, in 2006 countries had to report
provisional emissions for the year 2004 and finalised data for 2003. However, 3 countries (AT, FR, LV) reported emissions for the whole time-series 1990- 2004. 2 countries (GR, LT) only reported for 2004. Italy submitted in May 2005 (late submission 2005) data for 1990-2003.
• Four countries filled more than 95% of their reporting template cells. Comparing all cells, notation keys are more often used than unique values are reported, which in itself is not necessarily problematic. The notation key NA ('not applicable') is used the most, followed by NO ('not occurring'). None of the countries used the notation key C ('confidential') and NR ('not relevant'). Sweden reported the most unique values, followed by Austria and Italy.
• Most unique values were reported for NMVOC (56 %), followed by NOx (43 %). Most ‘0’ values were reported for NH3 (13 %).
3.3.1 LRTAP Malta officially submitted data for the first time to the Convention on LRTAP this year. All Parties have now reported at least one single emission value to the UNECE. We reported last year that it was a real challenge to assess the overall completeness of emissions. This is both due to the three different formats of source categories available, SNAP (Selected Nomenclature for Air Pollutants), NFR01 (defined in the 2001 intermediate Guidelines) and NFR02 (from the current 2002 reporting Guidelines (ECE/EB.AIR/80)), and because there are differing definitions of completeness according to the Protocols and the

12
Guidelines. This issue is discussed in more detail in Chapter 4 below on the results of the Trial Stage-3 review. In previous years, the review of completeness has only concerned data in NFR02 format. As noted by one of the Parties’ comment to the completeness test: ‘This analysis doesn’t show the real situation. A low percentage of total reported values for time series is a consequence of using an old format for years before 2000. The old format doesn’t provide use of notation key so the percentage of use of notation key is also unreal’. Since a majority of the emission data in the 1980 and 1990s are in SNAP format (see below), it was decided this year to assess the overall completeness of emission data held by EMEP that have been reported under the Convention of LRTAP also at SNAP level. Hence all NFR02 emissions data were converted to SNAP according to Table IIIA in the reporting Guidelines. Thereafter we analysed the completeness of officially submitted data by means of checking if a value was reported or not for the country, year and pollutant in question and as available from the sixth version of WEBDAB. Figure 3.1 shows the result for main pollutant (1990-2004) and PMs (2000-2004) for selected sectors. Only one of the main sectors per pollutant is displayed, i.e. SOx: SNAP sector 1, Combustion in energy and transformation, NOx: SNAP sector 7, Road Transport, NMVOC: SNAP sector 6, Solvent and other product use, NH3: SNAP sector 10, Agriculture, and PMs: SNAP sector 2, Non-industrial combustion plants. Nine Parties (20%) (Austria, Denmark, France, Germany, Latvia, Norway, Portugal, Sweden, United Kingdom) reported complete time series of main pollutants in the NFR02 format for 1990 to 2004, the period relevant for the revision of the Gothenburg Protocol. Three countries miss only one year of data, Estonia year 2000, Italy and Spain year 2004. The figure shows for each of the pollutants and sectors the completeness with respect to format. Data in NFR02 format requested from the 2002 Guidelines, are shown in blue; for the main pollutants there is a clear increase from 2000 onwards. In 2004 all sector data that was reported was in NFR02. The reporting in NFR01 format amounts to a few percent only, and vanishes in 2002. Reporting in SNAP is still substantial in the 1990s for all Main Pollutants. The completeness of the sector data time series independently of formats was largest for SOx and NOx (about 80%) and less (about 68%) for NMVOC and NH3. The PMs (lowermost row in Figure 3.1) are almost solely reported in NR02 format. Reporting of PM began in 2000. The completeness of the reporting of PM sector data is still lower than for the Main Pollutants, but has been steadily increasing, from around 40% in 2000 to about 60% in 2004 emissions. The completeness of sector data time series 1990-2004 for priority heavy metals (cadmium, lead and mercury) (not shown) varied between pollutant and years, and was between 29-50% for lead and cadmium and 37-61% for mercury. Completeness for priority POPs was even lower, 29-48% for PCDD/F and PAH, while only eight countries (16%) reported HCB emissions. It can be concluded that the overall completeness of reporting is still low for many countries. This becomes much clearer after quality control of comparability and in particular consistency. Appendix 5 gives an overview of the emission totals as considered in the modelling assessments under EMEP. Reported values are displayed with white background, expert estimates replacing gaps in grey. Values in bold italic show replacement of reported data by expert estimates. The procedure for replacements is documented in EMEP Report

13
1/2006. From these tables and the analysis documented in EMEP Report 1/2006 it is clear that much of the reported data lack time series consistency and therefore has to be replaced. Confusion arises when countries report for the same year, an identical emission value in two different reporting formats (e.g. SNAP and NFR02), or as sometimes is observed, different values in different formats. Parties like Slovakia and Switzerland currently do this. Parties are requested not to double report emissions. One Party noted that the completeness test is not very significant and useful to provide an informative basis of completeness. The review team will look at improving this test, whenever the definition of completeness becomes more clear.

14
SOx:
SN
AP s
ecto
r 1
0 %
20 %
40 %
60 %
80 %
100
%
1990
1991
1992
1993
1994
1995
1996
1997
1998
1999
2000
2001
2002
2003
2004
Gap
01
SN
AP
01
NFR
1 0
1N
FR2
01
NO
x: S
NAP
sec
tor 7
0 %
20 %
40 %
60 %
80 %
100
%
1990
1991
1992
1993
1994
1995
1996
1997
1998
1999
2000
2001
2002
2003
2004
Gap
07
SN
AP
07
NFR
1 0
7N
FR2
07
N
MVO
C: S
NAP
sec
tor 6
0 %
20 %
40 %
60 %
80 %
100
%
1990
1991
1992
1993
1994
1995
1996
1997
1998
1999
2000
2001
2002
2003
2004
Gap
06
SN
AP
06
NFR
1 0
6N
FR2
06
NH
3: S
NAP
sec
tor 1
0
0 %
20 %
40 %
60 %
80 %
100
%
1990
1991
1992
1993
1994
1995
1996
1997
1998
1999
2000
2001
2002
2003
2004
Gap
10
SNAP
10
NFR
1 1
0NF
R2
10
PM10
: SN
AP s
ecto
r 2
0 %
20 %
40 %
60 %
80 %
100
%
2000
2001
2002
2003
2004
Gap
02
SN
AP
02
NFR
1 0
2N
FR2
02
PM2.
5: S
NAP
sec
tor 2
0 %
20 %
40 %
60 %
80 %
100
%
2000
2001
2002
2003
2004
Gap
02
SN
AP
02
NFR
1 0
2N
FR2
02
Fi
gure
3.1
. O
vera
ll co
mpl
eten
ess o
f Mai
n Po
lluta
nts a
nd P
Ms f
or se
lect
ed p
ollu
tant
s and
sect
ors (
%)

15
3.3.2 NEC This year for the first time a completeness analysis of NEC data has been performed for those countries that submitted data. 15 countries (60 %) of the EU25 Member States reported NEC emissions inventories in NFR format on time (including Italy for 2003). According to the NEC Directive requirements (Directive 2001/81/EC), countries have to report their final emission inventories for the previous year but one and their provisional emission inventories for the previous year. However, 3 countries (AT, FR, LV) reported emissions for the whole time-series 1990- 2004. 2 countries (GR, LT) only reported for 2004. Italy submitted in May 2005 (late submission 2005) data for 1990-2003. The Italian data should strictly not have been included in this year’s review. Late submissions will not benefit from the review in the future. Figure 3.2 provides an overview for each year of the number submissions received in 2006 (although as noted above, formally Member States are only required to report data for 2003 and 2004).
0
5
10
15
1990 1991 1992 1993 1994 1995 1996 1997 1998 1999 2000 2001 2002 2003 2004
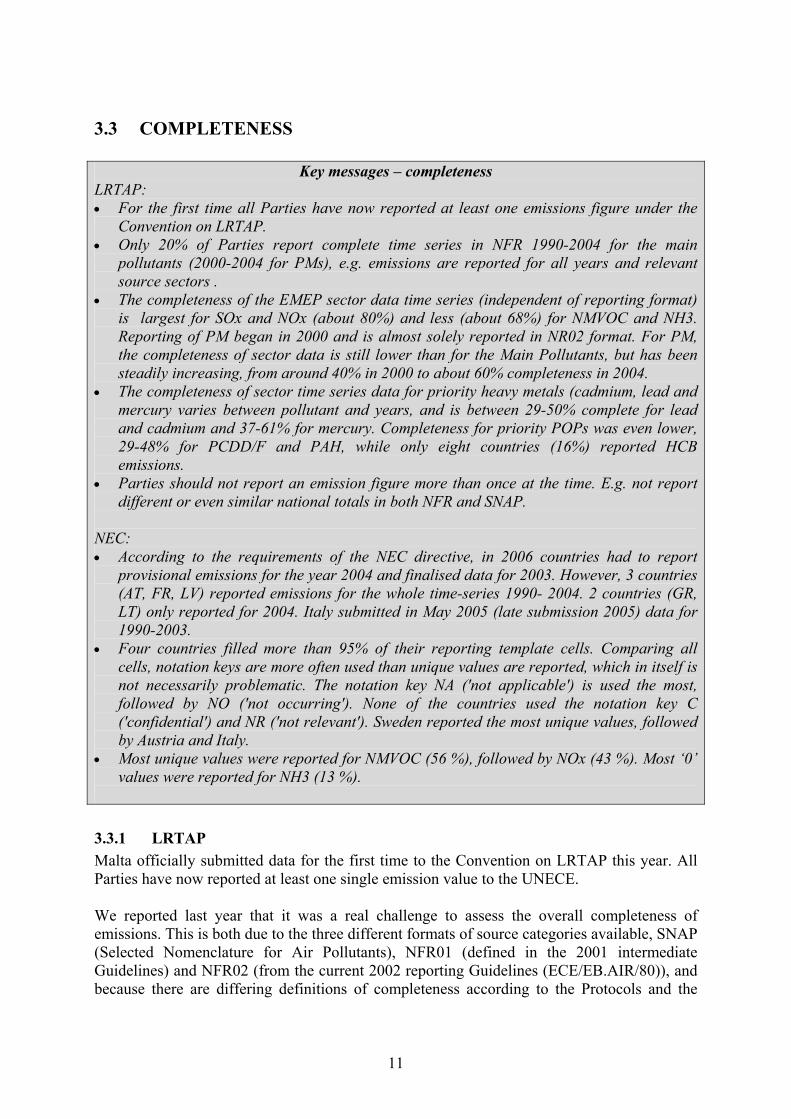
Figure 3.2. Number of submissions per year. Figure 3.3 shows the analysis of completeness by country for the whole time series. Four countries filled more than 95% of their reporting template cells. Comparing all cells, notation keys are more often used than unique values are reported, which in itself is not necessarily problematic. The notation key NA ('not applicable') was used the most, followed by NO ('not occurring'). None of the countries used the notation key C ('confidential') or NR ('not relevant'). Sweden reported the most unique values, followed by Austria and Italy. France still do not use notation keys, but rather report zeros, although feedback from the country indicates these zeros are calculated values.
16
0
10
20
30
40
50
60
70
80
90
100
France
SwedenLa
tvia
Austria Ita
ly
Belgium
United
Kingdo
mIre
landSpa
in
Netherl
ands
Lithu
ania
Sloven
ia
Slovak
ia
Estonia
Greece
Denmark
Finlan
d
German
y
Luxe
mbourg
Portug
al
Cyprus
Czech
Rep
ublic
Malta
Hunga
ry
Poland
%Reported as '0' Reported as 'NO' Reported as 'NE' Reported as 'NA'Reported as 'IE' Reported as 'C' Reported as 'NR' Unique Value
Figure 3.3. Completeness of NEC data for 1990-2004: by country.
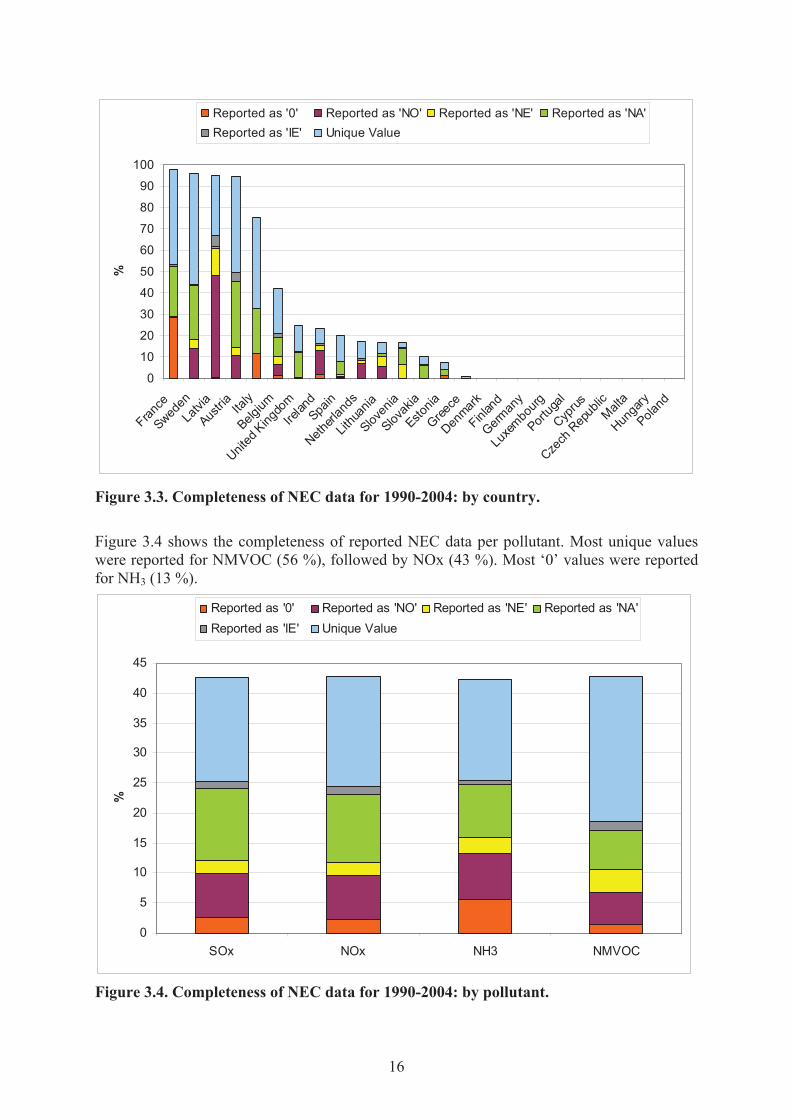
Figure 3.4 shows the completeness of reported NEC data per pollutant. Most unique values were reported for NMVOC (56 %), followed by NOx (43 %). Most ‘0’ values were reported for NH3 (13 %).
0
5
10
15
20
25
30
35
40
45
SOx NOx NH3 NMVOC
%
Reported as '0' Reported as 'NO' Reported as 'NE' Reported as 'NA'Reported as 'IE' Reported as 'C' Reported as 'NR' Unique Value
Figure 3.4. Completeness of NEC data for 1990-2004: by pollutant.
0
10
20
30
40
50
60
70
80
90
100
France
SwedenLa
tvia
Austria Ita
ly
Belgium
United
Kingdo
mIre
landSpa
in
Netherl
ands
Lithu
ania
Sloven
ia
Slovak
ia
Estonia
Greece
Denmark
Finlan
d
German
y
Luxe
mbourg
Portug
al
Cyprus
Czech
Rep
ublic
Malta
Hunga
ry
Poland
%Reported as '0' Reported as 'NO' Reported as 'NE' Reported as 'NA'Reported as 'IE' Unique Value
0
5
10
15
20
25
30
35
40
45
SOx NOx NH3 NMVOC
%
Reported as '0' Reported as 'NO' Reported as 'NE' Reported as 'NA'Reported as 'IE' Unique Value
17
3.4 CONSISTENCY
Key messages – consistency The aim of this test is to confirm the internal data consistency of submissions. It checks that values reported within sub-sectors add up to the reported sector total, and that the values reported for sectors add up to the reported National Total. All notation keys are converted to zero in the calculation. • The internal consistency of LRTAP inventories is improving, assisted by the ability of
countries to use the online software QC tool REPDAB which gives countries an easy way to check internal consistency before submitting their data. REBDAB will be developed further to improve the feedback it provides to countries on data inconsistencies.
• 2 of 14 countries that reported their NEC inventories in NFR format on time were found to contain internal inconsistencies. Member States are free to use REBDAB to check data prior to submission if they report using the LRTAP excel templates (as most countries presently do).
3.4.1 LRTAP Inconsistencies were found for 14 countries (BE, LV, CZ, DE, EE, IE, PL, SI, CA, GR, MD, NL, MK and UA) (40% of those reporting). This appears a significant level, but many of these inconsistencies were small (e.g. where decimal places had been removed in aggregated sectors) or correspond to situations where numbers were only reported at aggregated levels and notation keys, notably IE (included elsewhere), were reported in all sub sectors. It was agreed at the joint EIONET/TFEIP meeting in Pallanza in 2004 to calculate consistency with all notation keys set to zero, this will hence automatically lead to an inconsistency in this latter situation (i.e. a number compared to the sum of notation keys (= zero)). We will look into both improving the review check and REPDAB on this point. It was also noted that the COPERT tools only generate summary data for the POPs emissions, without separating activities, and hence no sub-sectors are able to be reported by countries.
3.4.2 NEC Under the NEC Directive data from 14 Member States that reported their inventories in NFR format on time were reviewed. Of the 14 reporting Member States, the time series of twelve Member States did not contain any inconsistencies, while 2 Member States show inconsistencies (United Kingdom and Greece).

18
3.5 COMPARABILITY – CROSS POLLUTANT TESTS
Key messages – cross pollutant tests A cross pollutant test was performed in order to check the consistency between reported pollutants and the comparability of pollutant ratios between countries. It is a further method to identify outliers across countries. The review team chose pollutant ratios which it assumed would be more or less identical in all countries. • Generally, some pollutant ratios turned out to be not useful as most countries did not
report emissions for one of the selected sectors (e.g. landfills and agriculture). The ratios used in future checks will be reviewed.
• Next year, based on feedback from countries, more emphasis will be laid on the explanation of why certain pollutant ratio were chosen and on providing a range of expected ratios to make it easier for countries to compare their ratios against this range.
• Nevertheless, the cross pollutant test is considered to be a useful initial method to identify outliers and possible differences between countries.
Table 3.3 provides an overview of explanations as to why particular pollutant ratios were chosen for comparison.
Table 3.3. Overview of reasons for the selection of pollutant ratios
Pollutant ratios were calculated for the following sectors: transport (sum of 1A3bi passenger cars, 1A3bii light duty vehicles, 1A3biii heavy duty vehicles, 1A3biv mopeds and motorcycles, 1A3bv gasoline evaporation), agriculture (sum of 4B and 4D), landfills (6A), fuel combustion (sum of all 1A sectors) and for national totals. An average pollutant ratio was subsequently calculated for each country region (Western and Eastern Europe country grouping) and individual country pollutant ratios flagged if they exceeded the average pollutant ratio for the respective country region by more than a factor of 5 or by less than a factor of 0.2. Results are presented in Table 3.4 for Western countries and in Table 3.5 for Eastern countries.
3.5.1 LRTAP In most cases, flagged differences in cross pollutant tests could be simply explained by different fuel splits used in countries (e.g. the ratio of consumed Diesel oil/consumed gasoline in Monaco compared to other European countries; no solid fuel combustion except wood and waste incineration in Switzerland, use of natural gas and wood products for domestic fuel use in Latvia and Estonia etc). Some countries still have to identify the reason for the differences noted.
Sector Ratio BackgroundNational totals TSP : PM2.5, PM10Fuel combustion TSP : PM2.5, PM10Fuel combustion PM10 : Pb, Cd, Hg HM are part of PM10Transport NOx : NMVOC, CO, PM2.5 Constant ratio in exhaust gasTransport NH3 : N2O Constant ratio due to catalystAgriculture NOx, NH3, N2O Microbial activityLandfills NMVOC, NH3, CO Constant ratio in landfill gas

19
Generally, some pollutants turned out to be not useful as most countries did not report emissions for at least one of the selected sectors (e.g. especially landfills and agriculture). However, the cross pollutant test is a good method to identify outliers across countries. Next year, more emphasis will be laid on the explanation of why a certain pollutant ratio was chosen and on providing a range of expected ratios to make it easier for countries to compare their ratios against this range.
3.5.2 NEC Results of the analysis of NEC data did not differ significantly from the LRTAP analysis results.

20
Tab
le 3
.4. P
ollu
tant
rat
ios f
or W
este
rn c
ount
ries
. Sha
ded
cells
indi
cate
flag
ged
valu
es
Pollu
tant
rat
ioSe
ctor
AT
BEC
AC
HDE
DKFI
FRG
BG
RIE
MC
NLNO
PTSE
Mea
nNO
x/NM
VO
CTr
ansp
ort
6.26
2.99
1.84
2.22
4.34
1.66
1.94
4.13
0.68
2.03
0.48
2.00
1.33
2.18
2.23
2.42
NOx/
COTr
ansp
ort
0.77
0.41
0.12
0.22
0.43
0.23
0.30
0.44
0.40
0.26
0.13
0.46
0.20
0.35
0.28
0.33
NOx/
PM2.
5Tr
ansp
ort
18.0
416
.64
1.10
24.5
422
.16
14.3
012
.61
20.8
814
.39
14.6
816
.09
13.8
517
.35
15.8
9NH
3/N2
OTr
ansp
ort
1.46
0.83
2.62
1.80
0.97
0.65
1.81
1.63
0.92
9.61
2.23
NOx/
NH3
Agr
icul
ture
0.09
0.04
0.07
NH3/
N2O
Agr
icul
ture
5.07
4.41
4.63
4.69
2.61
3.98
3.53
4.53
3.71
3.82
2.72
3.97
PM10
/Pb
Fuel
com
bust
ion
3.17
1.21
0.86
0.99
1.80
0.82
2.03
1.56
1.04
2.04
3.97
8.96
0.09
4.34
2.35
PM10
/Cd
Fuel
com
bust
ion
26.4
135
.84
7.37
4.99
13.1
09.
1142
.13
40.4
723
.10
26.6
067
.83
111.
4511
.53
147.
5640
.54
PM10
/Hg
Fuel
com
bust
ion
33.8
85.
6446
.82
9.05
4.69
4.52
90.5
836
.48
25.3
045
.78
81.6
415
0.82
21.1
112
1.14
48.3
9TS
P/PM
2.5
Fuel
com
bust
ion
1.64
13.3
214
.49
2.23
1.54
1.26
1.84
1.63
2.08
1.23
1.18
2.14
1.89
3.57
TSP/
PM2.
5Na
tiona
l tot
als
3.52
9.43
18.1
62.
101.
892.
084.
602.
111.
991.
403.
171.
924.
36TS
P/PM
10Fu
el c
ombu
stio
n1.
435.
903.
341.
151.
311.
151.
321.
351.
541.
101.
141.
991.
281.
85TS
P/PM
10Na
tiona
l tot
als
2.02
4.59
3.22
1.17
1.39
1.41
2.80
1.55
1.18
1.26
2.50
1.30
2.03
NMV
OC/
COLa
ndfil
ls0.
010.
030.
02NM
VO
C/NH
3La
ndfil
ls30
.00
0.01
1.61
2.61
8.56
CO/N
H3La
ndfil
ls22
65.0
50.
2811
32.6
7
Tab
le 3
.5. P
ollu
tant
rat
ios f
or E
aste
rn c
ount
ries
. Sha
ded
cells
indi
cate
flag
ged
valu
es.
Pollu
tant
ratio
Sect
orB
GC
SC
YC
ZEE
HU
LTLV
MD
MK
PLR
USI
SKU
AM
ean
NO
x/N
MV
OC
Tran
spor
t2,
371,
210,
482,
052,
041,
882,
881,
961,
211,
042,
040,
672,
711,
500,
491,
64N
Ox/
CO
Tran
spor
t0,
400,
180,
130,
410,
260,
250,
510,
220,
180,
220,
370,
120,
660,
330,
080,
29N
Ox/
PM
2,5
Tran
spor
t11
,10
18,9
519
,60
10,5
020
,58
11,1
015
,28
49,2
214
,16
12,8
177
9,29
18,3
3N
H3/
N2O
Tran
spor
t0,
9719
,91
0,01
1,03
1,19
1,87
1,35
3,76
NO
x/N
H3
Agric
ultu
reN
H3/
N2O
Agr
icul
ture
4,03
3,40
2,47
5,88
3,28
4,23
4,63
2,86
3,85
PM10
/Pb
Fuel
com
bust
ion
7,54
0,55
0,76
1,50
2,11
128,
567,
540,
492,
633,
230,
430,
902,
52PM
10/C
dFu
el c
ombu
stio
n14
0,50
14,8
048
,70
17,6
529
,04
268,
2514
0,50
5,68
13,7
16,
465,
5960
,09
62,5
8PM
10/H
gFu
el c
ombu
stio
n43
,29
9,43
52,8
019
,96
33,9
360
6,49
43,2
911
,05
45,0
413
,67
15,2
114
,71
75,7
4TS
P/P
M2,
5Fu
el c
ombu
stio
n4,
442,
822,
012,
951,
681,
194,
442,
782,
692,
091,
8752
,97
6,83
TSP
/PM
2,5
Nat
iona
l tot
als
3,02
2,16
2,16
3,31
1,75
1,42
3,02
3,37
2,69
3,05
49,6
96,
88TS
P/P
M10
Fuel
com
bust
ion
1,87
2,23
1,54
1,72
1,37
1,10
1,87
1,41
1,59
1,82
1,44
5,97
1,99
TSP
/PM
10N
atio
nal t
otal
s1,
561,
601,
611,
911,
431,
151,
561,
621,
592,
276,
102,
04N
MVO
C/C
OLa
ndfil
ls0,
930,
93N
MVO
C/N
H3
Land
fills
CO
/NH
3La
ndfil
ls

21
3.6 COMPARABILITY – RECALCULATIONS
Key messages – Recalculation The aim of this test is to identify differences between national totals reported by Parties between the 2006 and 2005 reporting years LRTAP: • 46% of Parties reported at least one pollutant recalculation of more than 10% between
2005 and 2006. • All but two countries have explained their recalculation, mostly by means of the review
report. • POPs and PM2.5 have the highest number of recalculations, followed by HMs and
NMVOC. PM10 recalculations number less than half of the number of PM2.5 recalculations, which is somewhat concerning. In percentage terms, the largest recalculations are for PMs followed by PCDD/F , Pb, Cd, other POPs, Hg, CO, SOx, NMVOC, NH3 and NOx.
NEC: • For 10 of 14 countries that submitted their NEC submissions on time a recalculation
analysis could be performed. In 5 countries, recalculations exceeded 10 % for some pollutants and/or years. Most recalculations occurred for NMVOC emission, followed by NH3. Compared to NOx and SOx, NMVOC emissions are more difficult to estimate.
It is important and necessary to identify inventory recalculations and to understand their origin in order to correctly evaluate the officially reported emission data. This is especially the case when emission ceiling targets are expressed in absolute terms, and not as percentage reduction targets. From a country perspective, it is necessary to recalculate the whole of the time series when new information (i.e. activity or emission factor data) becomes available in order to provide comparable and consistent data. The magnitude of recalculations also provides some indication of the general uncertainty of the emissions. The aim of the recalculation test is to identify differences between national totals reported by Parties between the 2006 and 2005 reporting years (100*[(X2006 – X2005)/ X2005]). Differences larger than 10% were flagged. Details with respect to the recalculations of LRTAP data are shown in Appendix 3. In these overviews, highlighted values show recalculations per country and priority pollutants larger than 10% between this year and last year’s submissions. The greatest recalculation per recalculated time series is quoted, together with the period for which recalculations were provided. The annex also gives an overview of any explanations provided by countries concerning the recalculations, and from where this explanation was obtained (Informative Inventory Report (IIR) or Review Report (RR)).
3.6.1 LRTAP The result of the recalculation test for the LRTAP data can be found in Appendix 3. The number of recalculations is relatively high. Of those 35 Parties reporting data in 2006, 16 Parties (46%) provided recalculations larger than 10%. Many countries do not recalculate their emissions and whether this is due to lack of resources, lack of scientific information on improved methodologies, or missing Guidebook improvements is not easy to say. It is likely a mix of these factors. As many Parties have the possibility to update their emissions, whiles other have not, there is evidently an element of resource requirements to this.

22
Perhaps not surprisingly, POPs and PM2.5 have the highest number of significant (> 10%) recalculations, followed by HMs and NMVOC (Table 3.6). Other main pollutants have relatively few recalculations. It seems like the focus on PM2.5, and more information being available has led to an increase in recalculations of PM2.5 compared to 2005. PM10 is recalculated less than half the number of times that PM2.5 is recalculated. It is somewhat concerning that Parties do not recalculate PM10 at the same time PM2.5 is recalculated, although as noted earlier, this may be related to more information on PM2.5 calculation methodologies becoming available. HCB has been calculated fewer times, which is not unexpected as very few Parties actually report HCB. The largest recalculations in terma os percentages are found for PMs followed by PCDD/F , Pb, Cd, other POPs, Hg, CO, SOx, NMVOC, NH3 and NOx.
Table 3.6. Number of significant (>10%)recalculations per pollutant for the LRTAP inventories (of 35 submissions received). Component No recalc
PAH 8 PM2.5 7
PCDD/F 6 Pb 5 Hg 5
NMVOC 4 Cd 4
NH3 3 PM10 3 SOx 2 NOx 2 CO 2
HCB 2
It is very encouraging that all but two countries explain their recalculation either through their IIR (3 countries), their Review Reply (9 countries) or both (2 countries). This shows a clear need for the country specific review reports in order to understand the changes in emissions form one year to another. In the long run it is appreciated that the recalculations are reported in the IIR upfront the review process.
3.6.2 NEC Recalculation analysis was performed for 10 EU Member States which submitted their NEC inventories in time. For 4 countries, this analyisis was not possible as they reported data for 2004 only or not for 2004, but 1990 to 2003 only. All 10 countries recalculated their emissions. In Belgium, France, the Netherlands, the United Kingdom and Slovenia only minor recalculations were performed, while recalculations in Austria, Estonia, Ireland, Latvia and Sweden exceeded 10 % for certain pollutants. Table 3.7 shows these recalculations that exceeded 10 %.

23
Table 3.7. Recalculations of NEC submission by countries that exceeded 10%. (‘v’ recalculation < 10%, NA – data not received).
SOx NOx NH3 NMVOCAustria v v 20% (1990-2003) vBelgium v v v vDenmark NA NA NA NAFinland NA NA NA NAFrance v v v vGermany NA NA NA NAGreece NA NA NA NAIreland v v v -14% (2002-2003)Italy NA NA NA NALuxembourg NA NA NA NANetherlands v v v vPortugal NA NA NA NASpain NA NA NA NASweden v v v -14% (1990-2003)United Kingdom v v v vCyprus NA NA NA NACzech Republic NA NA NA NAEstonia v -14% (2003) 23% (2003) vHungary NA NA NA NA
Latvia-17% (1994), -36% (2000-2003) v v v
Lithuania NA NA NA NAMalta NA NA NA NAPoland NA NA NA NASlovakia NA NA NA NASlovenia v v v v
3.7 COMPARABILITY - INVENTORY COMPARISON
Key messages – Inventory comparison The aim of this test is to assess comparability through comparison of national totals reported by countries to NEC, LRTAP and under the EU Monitoring Mechanism. NEC vs LRTAP: • Differences larger than 0.1% between emission data submitted under the Convention on
LRTAP and under the NEC directive were found for seven countries. This is an increase by two from last year. All but two countries have provided explanations for the differences e.g. updates that occurred due to differences in submission dates (i.e. new EFs or statistics became available) and differences in the Guidelines definitions.
LRTAP/NEC vs. EU Monitoring Mechanism: • Reasons for differences between emissions reported under CLRTAP/NEC and the EU
Monitoring Mechanism are manifold and are mainly due to a) different reporting requirements, b) different QA/QC requirements and c) errors in reporting.
• The highest number of differences occurred for NMVOC and CO (65 % each), followed by SOx (50 %) and NOx (45 %). Differences in CO and NMVOC emissions are mainly due to whether or not memo items are included in the national total, due to the sector 1A3b, Transport and to errors in reporting.
The aim of this test is to compare national totals reported to NEC, LRTAP and under the EU Monitoring Mechanism received by 10th March 2006 (LRTAP), 28th February 2006 (NEC) and 8th April 2006 (EU MM). A summary showing results of the EU25 comparison performed between officially reported data to NEC-LRTAP-EU MM for the most recent reporting year

24
(2004) is given in Appendix 4. Differences are expressed as percentages (%). Explanations for the noted differences are provided where these have been received in response to the review or where they were already documented by the respective country. Flagged values indicate differences of greater than 0.1% between the respective national totals.
3.7.1 NEC vs. LRTAP Differences larger than 0.1% between emission data submitted under the Convention on LRTAP and under the NEC directive were found for seven countries (Belgium, Estonia, Hungary, Latvia, Lithuania, Netherlands and Slovenia). This is two more than last year. An overview of all inventory comparisons is given in Appendix 4. Differences occurred most frequently for NMVOC, followed by SOx, NOx and NH3. The differences were explained for those countries responding to the review. Only two countries did not explain their recalculations. In the case of the Netherlands, the differences could be explained by the differences in the definitions of 1 A 3 d ii National Navigation and 1 A 3 a ii (i) Civil Aviation (Domestic, LTO). For the other countries, the reason for the differences was that the NEC data was submitted earlier than the LRTAP data, hence the LRTAP data was more complete. For six of the reporting countries (Cyprus, Czech Republic, Finland, Germany, Poland, Portugal) the test could not be performed due to the lack of NEC data.
3.7.2 LRTAP/NEC vs. EU Monitoring Mechanism Figure 3.5 shows the number of flagged values (i.e. differences > 0.1%) by pollutant expressed as a percentage of the number of inventory comparisons made between national totals reported under CLRTAP and NEC, and under the EU Monitoring Mechanism. For the LRTAP vs EU-MM comparisons, on a percentage basis the highest number of flags occurred for NMVOC and CO (65 % each), followed by SOx (50 %) and NOx (45 %). Differences in CO and NMVOC emissions are mainly due to differences in the sectors 5(E) and 1A3b and to errors in reporting. The percentage of flagged values for NEC vs EU-MM comparisons are higher than for the LRTAP vs EU-MM comparisons, as the lower number of NEC datasets received means the overall number of comparisons able to be made was lower.
0%
10%
20%
30%
40%
50%
60%
70%
NMVOC CO SOx NOx
% o
f inv
ento
ry c
ompa
rison
s th
at w
ere
flagg
ed
LRTAPNEC
Figure 3.5. Number of flagged values by pollutant of inventory comparisons between CLRTAP/NEC and EU Monitoring Mechanism as a percentage of the number of inventory comparisons made.

25
For the NEC vs EU-MM comparison, the highest number of flags occurred for NMVOC and CO (65 % each), followed by SOx (50 %) and NOx (45 %). Differences in CO and NMVOC emissions are mainly due to whether or not memo item, sectors 5 E, ‘OTHER’ are included in the national total and due to sector 1A3b and to errors in reporting. 5E is reported under LRTAP as memo item, but is included in the CRF in the national total. This difference was found e.g. for France. Reasons for differences between emissions reported under CLRTAP/NEC and the EU Monitoring Mechanism are manifold and are mainly due to a) different reporting requirements, b) different QA/QC requirements and c) errors in reporting. a) Different reporting requirements
The three reporting obligations differ mainly in the geographical coverage of countries (e.g. France, Spain, Portugal, UK), and in emissions that are included in one format, but not the other. This relates mainly to the inclusion or exclusion of domestic and international aviation and navigation in the national total, but also to differences in the Land Use, Land Use Change and Forestry (LULUCF) sector. Additionally, emissions from road transport reported under the EU Monitoring Mechanism have to be calculated based on the amount of fuel sold, whereas emissions reported under CLRTAP/NEC may be calculated based on the amount of fuel either sold or used. The major differences are summarised in Table 3.8.
Table 3.8. Major differences between the reporting obligations under CLRTAP, NEC and the EU Monitoring Mechanism CRF (Council Decision 280/2004/EC)
NFR (CLRTAP) NFR (NEC) CRF
Domestic aviation (LTO) Included in national total Included in national total Included in national total
Domestic aviation (Cruise) Included in national total Not included in national total
Included in national total
International aviation (LTO) Not included in national total
Included in national total Not included in national total
International aviation (Cruise) Not included in national total
Not included in national total
Not included in national total
International navigation on rivers Not included in national total
Included in national total Not included in national total
International marine Not included in national total
Not included in national total
Not included in national total
Road transport Calculations based on fuel sold or used
Calculations based on fuel sold or used
Calculations based on fuel sold
b) Different QA/QC requirements The reporting of NOx, SOx, NMVOC and CO under UNFCCC is a “should” requirement for countries. Therefore the quality of this data is often not as robust as that reported to LRTAP. It is known for example, that some countries perform QA/QC checks under CLRTAP/NEC more extensively and carefully than for the main pollutant data reported under the EU Monitoring Mechanism.

26
3.8 COMPARABILITY – FUEL SOLD FUEL USED
Key messages – fuel sold fuel used • Results from the 2006 review show that still, more countries report using fuel consumed to
estimate their emissions. However, it is not always clear for some countries as to the basis of their emission estimates.
• The difference in emission values obtained from the two different methods is small in most countries. However, in countries with low fuel prices, and resulting high fuel tourism from neighbouring countries, the difference can be as high as 40 %.
Last year it was reported that most countries reported their emissions according to fuel used (Vestreng et al., 2005). We wanted to elaborate somewhat on this check this year because it may influence the revision of the Guidelines due in 2007 and provide information for the review of the Gothenburg Protocol and the NEC Directive. Likewise, we wanted to give an estimate of the difference in emissions that the two methodologies were likely to give. This year’s review show that more countries still continue to report to use fuel used to estimate their emissions (Table 3.9). The amount of fuel consumed in a country is obtained from traffic models and therefore is more difficult to estimate than the amount of fuel sold from the energy statistics. Reporting according to fuel sold has the advantage of being less resource demanding, more accurate, and easier to verify and in accordance with the reporting guidelines under the Intergovernmental Panel on Climate Change (IPCC) (UNECE 2004c). However for countries that experience large amounts of ‘fuel tourism’ this can lead to over-estimation of ‘national’ emissions.
Table 3.9. Overview of emission estimation according to Fuel Sold (FS) and Fuel Used (FU) in 2005 and 2006 IIR= information obtained from the informative inventory report. Else the information is obtained form the footnote sheet in reporting table 1
COUNTRY 2005
FUEL SOLD / FUEL USED 2006
FUEL SOLD / FUEL USED Austria FU (IIR) LRTAP: FS (IIR); NEC: FU Belarus FU FU Belgium FU (IIR) FU Bulgaria FS, FU: Agriculture (1A4ci) FS, FU: Agriculture (1a4ci) Cyprus FU (IIR) FU (IIR) Czech
Republic FS, FU (IIR) FS, FU
Estonia FU (sold not available) FU Finland FU FU
France N/A FS: 1A3ai(ii), 1A3b, 1A3c, 1A3di(i), 1A3dii, 1A4ciii FU: 1A3ai(i), 1A3aii(i), 1A3aii(ii), 1A4ci, 1A4ciii
Germany FS FS Ireland N/A LRTAP: FS; NEC: FS/FU Latvia N/A FU
Lithuania FS/FU Norway FS: 1A3b, 1A3dii, 1A4ciii, 1a5b FS: 1A3b, 1A3dii, 1A4ciii, 1A5b
FU: 1A3aii (i), 1A3aii (ii), 1A3ci, 1A4cii FU: 1A3aii (i), 1A3aii (ii), 1A3ci, 1A4cii Moldova FU FU Sweden FU (IIR) FS, FU (1A3b, 1A3c, 1A5b) Slovakia FU FU Slovenia N/A FS United
Kingdom N/A FS, FU (1A4ci, 1A4cii, 1A5b)
Total FS: 1, FU: 9, FS&FC:3 FS: 2, FU: 8, FS&FU: 9
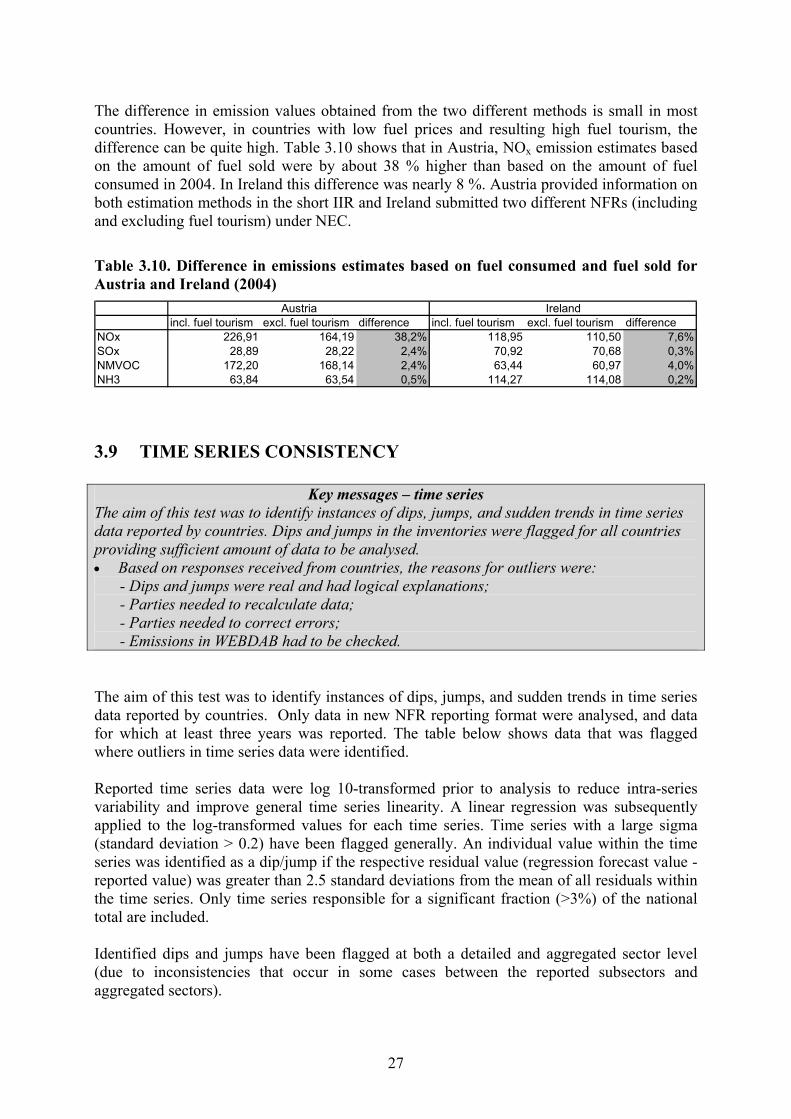
27
The difference in emission values obtained from the two different methods is small in most countries. However, in countries with low fuel prices and resulting high fuel tourism, the difference can be quite high. Table 3.10 shows that in Austria, NOx emission estimates based on the amount of fuel sold were by about 38 % higher than based on the amount of fuel consumed in 2004. In Ireland this difference was nearly 8 %. Austria provided information on both estimation methods in the short IIR and Ireland submitted two different NFRs (including and excluding fuel tourism) under NEC.
Table 3.10. Difference in emissions estimates based on fuel consumed and fuel sold for Austria and Ireland (2004)
incl. fuel tourism excl. fuel tourism difference incl. fuel tourism excl. fuel tourism differenceNOx 226,91 164,19 38,2% 118,95 110,50 7,6%SOx 28,89 28,22 2,4% 70,92 70,68 0,3%NMVOC 172,20 168,14 2,4% 63,44 60,97 4,0%NH3 63,84 63,54 0,5% 114,27 114,08 0,2%
Austria Ireland
3.9 TIME SERIES CONSISTENCY
Key messages – time series The aim of this test was to identify instances of dips, jumps, and sudden trends in time series data reported by countries. Dips and jumps in the inventories were flagged for all countries providing sufficient amount of data to be analysed. • Based on responses received from countries, the reasons for outliers were:
- Dips and jumps were real and had logical explanations; - Parties needed to recalculate data; - Parties needed to correct errors; - Emissions in WEBDAB had to be checked.
The aim of this test was to identify instances of dips, jumps, and sudden trends in time series data reported by countries. Only data in new NFR reporting format were analysed, and data for which at least three years was reported. The table below shows data that was flagged where outliers in time series data were identified. Reported time series data were log 10-transformed prior to analysis to reduce intra-series variability and improve general time series linearity. A linear regression was subsequently applied to the log-transformed values for each time series. Time series with a large sigma (standard deviation > 0.2) have been flagged generally. An individual value within the time series was identified as a dip/jump if the respective residual value (regression forecast value - reported value) was greater than 2.5 standard deviations from the mean of all residuals within the time series. Only time series responsible for a significant fraction (>3%) of the national total are included. Identified dips and jumps have been flagged at both a detailed and aggregated sector level (due to inconsistencies that occur in some cases between the reported subsectors and aggregated sectors).

28
Dips and jumps in the inventories were flagged for all countries providing sufficient amount of data to be analysed. The explanations for the outliers were four fold; firstly, the majority of flagged values turn out to have a reasonable explanation according to the Review Response to S&A-I provided from 23 Parties: e.g. plants were shut down, new flue gas desulphurisation plant was installed in a power plant of large SOx emission, coal miners strikes, and emissions changing sector from “waste” to “energy” as a result of the plant being equipped with energy recovery were among the explanations given. Many countries also saw the need to recalculate part of their data, while other found errors in their reporting. A few Parties did not recognize their emission data from the test, and claimed errors in WEBDAB. Some of the reason for this was that Parties had also re-submitted data too late to be taken into account in the review, and hence discrepancies between WEBDAB data (that was used in the review) and the latest submission occurred. One Party noted that: Most of the time series identified have highly non-linear trends. Such series will be identified as anomalous with linear regression methods. The lack of most data points between 1980 and 1989 probably increases the risk of being identified as anomalous. This group includes:
* Series with high initial values that drop rapidly and then stabilise. Examples: SOx - 1A2d, Pb - 1A3bi.
* Series with high stable initial values that begin to drop in the middle of the period. Example: CO - 1A3bi.
* Series that peak in the middle of the period. Examples: NOx - 1A3bi, NMVOC - 1B2a The review team agrees with this comment, and we will look into how the time trend test might be improved to give an even better feedback to the countries in the future.
3.10 IMPLIED EMISSION FACTOR CHECKS
Key messages- Implies emission factors The objective of the implied emission factors (IEF) check was to identify significant changes of IEFs within time series and/or significant differences in the IEFs across countries. This test therefore helps to identify outliers of IEF within time series for individual countries and across countries. Implied emissions factors were calculated for the sectors that had been identified as key sources for Western and Eastern European countries for the year 2004 and for the main air pollutants. LRTAP: . • More than 40% of reporting countries showed more than 20 % flagged values. In general,
the more data countries have reported, the greater the number of flagged values occur. • In the Western Countries, CO emission values contain most flagged values (28%), SOx
(25%), NH3 (19%), NOx (14%) and NMVOC (10%). The situation for Eastern Countries is somewhat different, most flagged values were also for CO (17%) reporting, but then SOx, NH3 and NMVOC are all on the same level (8%). Very few values are flagged in NOx reporting (3%).
• Five sectors (4B1b, 1A1c, 6C, 1A4a, 1A2a) contain more than 40 % flagged values. These sectors are concerning emissions from agriculture, energy and waste.
NEC: • Additional findings for NEC were only observed for Ireland (SOx from 1A3d, Navigation)
and Italy (SOx from 1A3d and 1A4a, Commercial/Institutional).
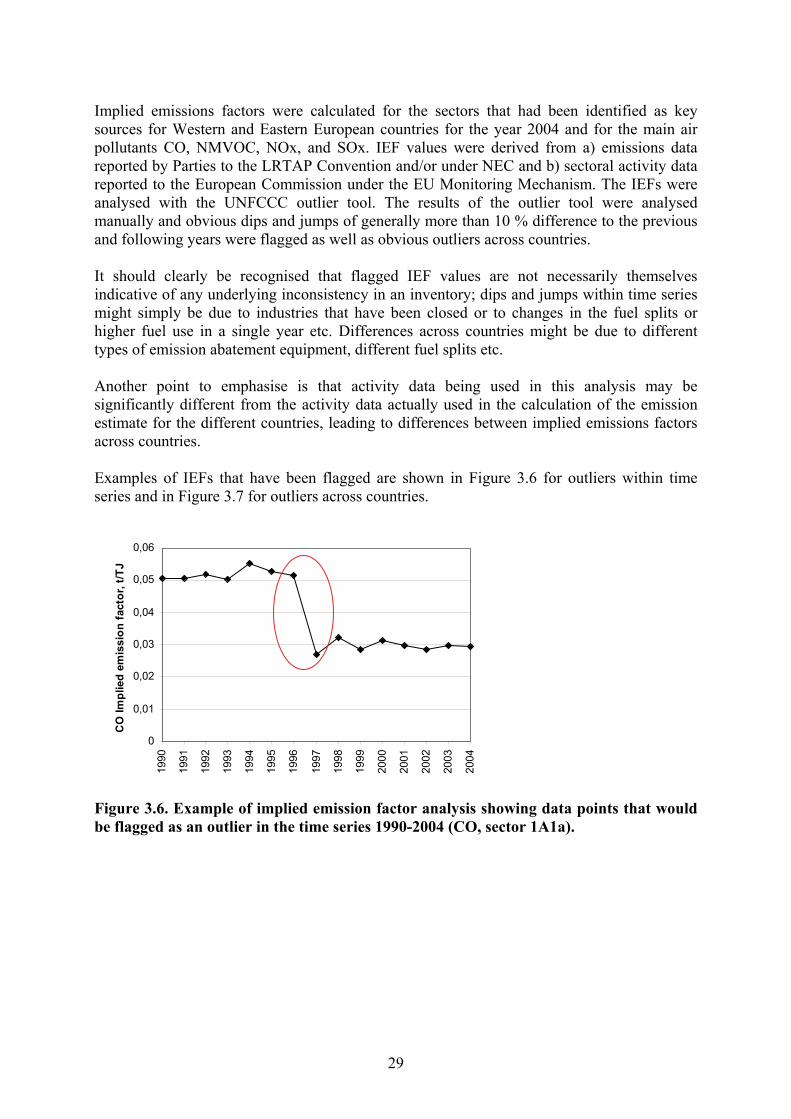
29
Implied emissions factors were calculated for the sectors that had been identified as key sources for Western and Eastern European countries for the year 2004 and for the main air pollutants CO, NMVOC, NOx, and SOx. IEF values were derived from a) emissions data reported by Parties to the LRTAP Convention and/or under NEC and b) sectoral activity data reported to the European Commission under the EU Monitoring Mechanism. The IEFs were analysed with the UNFCCC outlier tool. The results of the outlier tool were analysed manually and obvious dips and jumps of generally more than 10 % difference to the previous and following years were flagged as well as obvious outliers across countries. It should clearly be recognised that flagged IEF values are not necessarily themselves indicative of any underlying inconsistency in an inventory; dips and jumps within time series might simply be due to industries that have been closed or to changes in the fuel splits or higher fuel use in a single year etc. Differences across countries might be due to different types of emission abatement equipment, different fuel splits etc. Another point to emphasise is that activity data being used in this analysis may be significantly different from the activity data actually used in the calculation of the emission estimate for the different countries, leading to differences between implied emissions factors across countries. Examples of IEFs that have been flagged are shown in Figure 3.6 for outliers within time series and in Figure 3.7 for outliers across countries.
0
0,01
0,02
0,03
0,04
0,05
0,06
1990
1991
1992
1993
1994
1995
1996
1997
1998
1999
2000
2001
2002
2003
2004
CO
Impl
ied
emis
sion
fact
or, t
/TJ
Figure 3.6. Example of implied emission factor analysis showing data points that would be flagged as an outlier in the time series 1990-2004 (CO, sector 1A1a).
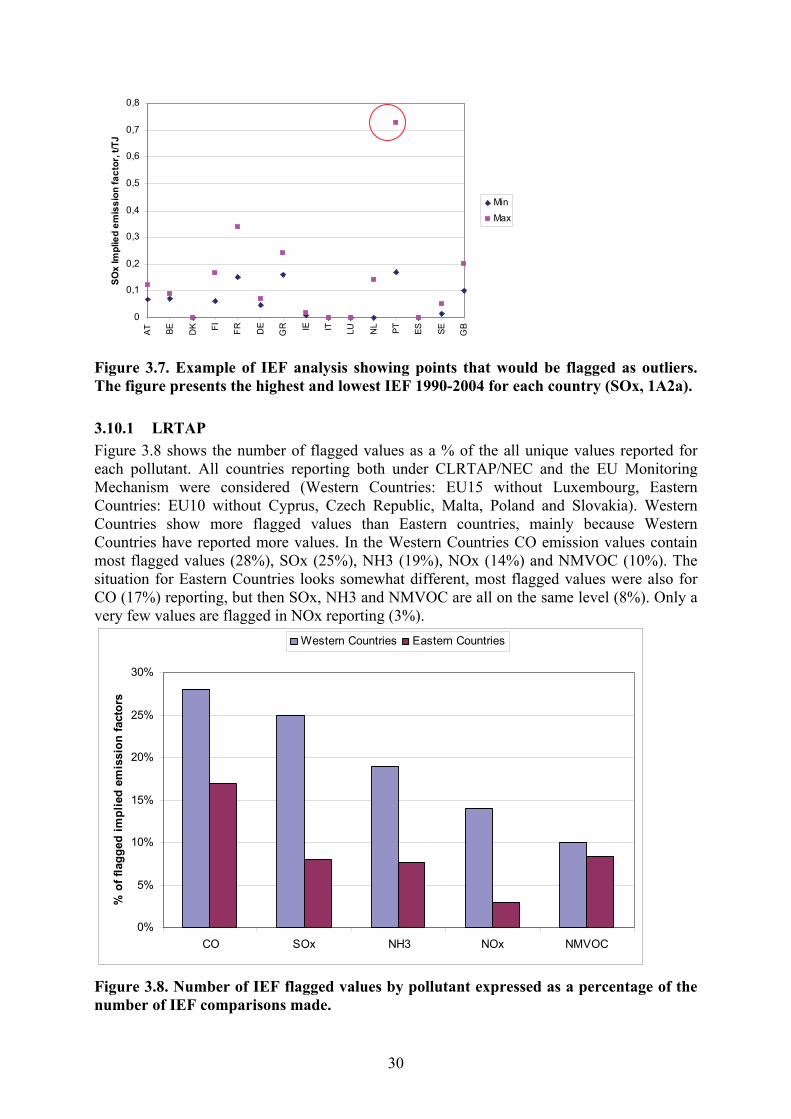
30
0
0,1
0,2
0,3
0,4
0,5
0,6
0,7
0,8
AT BE DK FI FR DE
GR IE IT LU NL PT ES SE GB
SOx
Impl
ied
emis
sion
fact
or, t
/TJ
Min
Max
Figure 3.7. Example of IEF analysis showing points that would be flagged as outliers. The figure presents the highest and lowest IEF 1990-2004 for each country (SOx, 1A2a).
3.10.1 LRTAP Figure 3.8 shows the number of flagged values as a % of the all unique values reported for each pollutant. All countries reporting both under CLRTAP/NEC and the EU Monitoring Mechanism were considered (Western Countries: EU15 without Luxembourg, Eastern Countries: EU10 without Cyprus, Czech Republic, Malta, Poland and Slovakia). Western Countries show more flagged values than Eastern countries, mainly because Western Countries have reported more values. In the Western Countries CO emission values contain most flagged values (28%), SOx (25%), NH3 (19%), NOx (14%) and NMVOC (10%). The situation for Eastern Countries looks somewhat different, most flagged values were also for CO (17%) reporting, but then SOx, NH3 and NMVOC are all on the same level (8%). Only a very few values are flagged in NOx reporting (3%).
0%
5%
10%
15%
20%
25%
30%
CO SOx NH3 NOx NMVOC
% o
f fla
gged
impl
ied
emis
sion
fact
ors
Western Countries Eastern Countries
Figure 3.8. Number of IEF flagged values by pollutant expressed as a percentage of the number of IEF comparisons made.

31
Figure 3.9 lists all reporting countries according to their number of flagged values in comparison to all reported values. In general, the more data countries report, the greater the number of flagged values that occur. Of the 19 reporting countries, eight show more than 20 % flagged values. The low number of new Member States results from the low number of available data both from LRTAP and EU Monitoring Mechanism. Many new Member States only reported data for 2003/2004 which made it impossible to find outliers in time series.
0%
5%
10%
15%
20%
25%
30%
35%
40%
Greece UK
Irelan
d
Netherlan
dsSpa
in
Finlan
d
Portug
al
Sweden
Latvi
aIta
ly
Austria
German
y
Belgium
Denmark
Hungary
Slovenia
Estonia
Lithu
ania
France
% o
f fla
gged
impl
ied
emis
sion
fact
ors
Figure 3.9. Number of IEF flagged values by country expressed as a percentage of the number of IEF comparisons made. Comparisons could not be made for a number of countries due to lack of emissions and /or activity data; these are not shown in the chart above. Figure 3.10 compares the number of flagged values within different sectors. Five sectors (4B1b, 1A1c, 6C, 1A4a, 1A2a) contain more than 40 % flagged values in Western countries, concerning emissions from agriculture, energy and waste. Twelve sectors have less than 20 % flagged values.
0%
20%
40%
60%
80%
100%
120%
4B1b
1A1c 6C
1A4a
1A2a
1A2c
4B6
1A2f
4B9
3B 3A
1A4c
1A3d
1A4b
4B1a
4B3
1A1a
4B8
4D1
1A1b
1A3b
% o
f fla
gged
impl
ied
emis
sion
fact
ors
Western CountriesEastern Countries
Figure 3.10. Number of IEF flagged values by sector expressed as a percentage of the number of IEF comparisons made.

32
3.10.2 NEC Additional findings for NEC were only observed for Ireland (SOx from 1A3d, Navigation) and Italy (SOx from 1A3d and 1A4a, Commercial/Institutional).
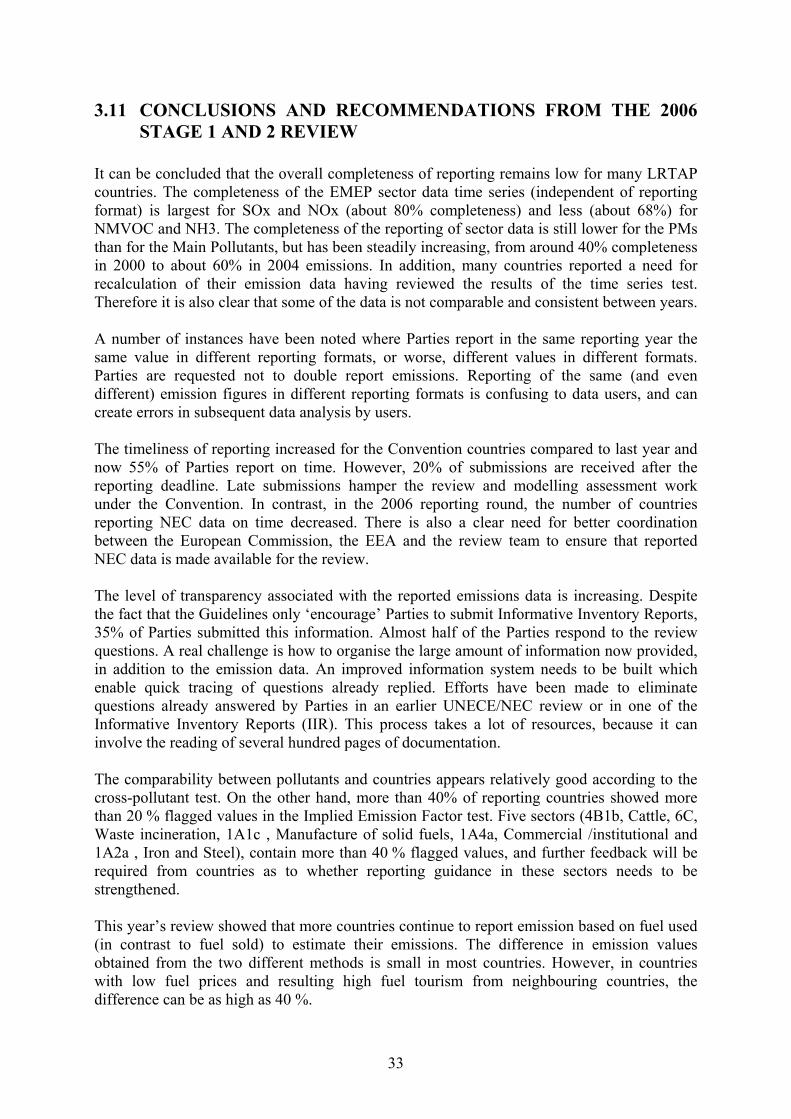
33
3.11 CONCLUSIONS AND RECOMMENDATIONS FROM THE 2006 STAGE 1 AND 2 REVIEW
It can be concluded that the overall completeness of reporting remains low for many LRTAP countries. The completeness of the EMEP sector data time series (independent of reporting format) is largest for SOx and NOx (about 80% completeness) and less (about 68%) for NMVOC and NH3. The completeness of the reporting of sector data is still lower for the PMs than for the Main Pollutants, but has been steadily increasing, from around 40% completeness in 2000 to about 60% in 2004 emissions. In addition, many countries reported a need for recalculation of their emission data having reviewed the results of the time series test. Therefore it is also clear that some of the data is not comparable and consistent between years. A number of instances have been noted where Parties report in the same reporting year the same value in different reporting formats, or worse, different values in different formats. Parties are requested not to double report emissions. Reporting of the same (and even different) emission figures in different reporting formats is confusing to data users, and can create errors in subsequent data analysis by users. The timeliness of reporting increased for the Convention countries compared to last year and now 55% of Parties report on time. However, 20% of submissions are received after the reporting deadline. Late submissions hamper the review and modelling assessment work under the Convention. In contrast, in the 2006 reporting round, the number of countries reporting NEC data on time decreased. There is also a clear need for better coordination between the European Commission, the EEA and the review team to ensure that reported NEC data is made available for the review. The level of transparency associated with the reported emissions data is increasing. Despite the fact that the Guidelines only ‘encourage’ Parties to submit Informative Inventory Reports, 35% of Parties submitted this information. Almost half of the Parties respond to the review questions. A real challenge is how to organise the large amount of information now provided, in addition to the emission data. An improved information system needs to be built which enable quick tracing of questions already replied. Efforts have been made to eliminate questions already answered by Parties in an earlier UNECE/NEC review or in one of the Informative Inventory Reports (IIR). This process takes a lot of resources, because it can involve the reading of several hundred pages of documentation. The comparability between pollutants and countries appears relatively good according to the cross-pollutant test. On the other hand, more than 40% of reporting countries showed more than 20 % flagged values in the Implied Emission Factor test. Five sectors (4B1b, Cattle, 6C, Waste incineration, 1A1c , Manufacture of solid fuels, 1A4a, Commercial /institutional and 1A2a , Iron and Steel), contain more than 40 % flagged values, and further feedback will be required from countries as to whether reporting guidance in these sectors needs to be strengthened. This year’s review showed that more countries continue to report emission based on fuel used (in contrast to fuel sold) to estimate their emissions. The difference in emission values obtained from the two different methods is small in most countries. However, in countries with low fuel prices and resulting high fuel tourism from neighbouring countries, the difference can be as high as 40 %.
34
A relatively large number of countries (46% of LRTAP Parties and 50% of NEC) reported significant recalculations (> 10%) between their 2005 and 2006 data submissions. All but two countries explain their recalculation, mostly by means of the Stage 2 review Synthesis and Assessment report. POPs and PM2.5 have the highest number of recalculations, followed by HMs and NMVOC. It seems like the focus on PM2.5, and more information being available led to an increase in recalculations of PM2.5 compared to 2005. PM10 is recalculated less than half of the times PM2.5 is recalculated, and this needs to be looked into. The largest percentage recalculations are found for PMs followed by PCDD/F , Pb, Cd, other POPs, Hg, CO, SOx, NMVOC, NH3 and NOx. There was no general trend seen in the recalculations. Differences occur between inventories countries submit to LRTAP, NEC and under the EU Monitoring Mechanism e.g. differences larger than 0.1% between emission data submitted under the Convention on LRTAP and under the NEC directive were found for seven countries. However, the overall improved level of transparency noted above assists in understanding these differences, all but two countries have reported explanations for differences noted in the review. Such differences were found to be mainly due to a) different reporting requirements, geographical scope etc and b) less stringent levels of QA/QC checking for air pollutant data reported to EU-MM leading to errors in reporting. Feedback received from Parties present at the Expert Panel on review meeting in Amersfoort, 14 June 2006 were satisfied with the Stage-2 review, and indicated they wish it to continue along the same general lines as present. There are a number of improvements that could be made in the future in order to improve the utility of the review for countries, and given an adequate level of resourcing; those identified so far are: • Dips and jumps in the inventories were flagged for all countries providing sufficient
amount of data to be analysed. The majority of the outliers could be explained as real. The test has a weakness in that most of the time series identified have highly non-linear trends. The review team will investigate options for improvement of this test.
• The cross pollutant test could be strengthened by removing certain ratios checked this
year e.g. landfills and agriculture where many countries do not report emissions of CO from these sectors. Next year, more emphasis will also be laid on the explanation as to why a certain pollutant ratio was chosen and on providing a range of expected ratios to make it easier for countries to compare their ratios against this range.
• Parties are also still encouraged to check their submission using REBDAB before the due
date, both for NEC and LRTAP submissions. This provides a number of preliminary quality checks including identifying internal consistencies. REBDAB should be developed further to provide still better feedback in a more user friendly manner. Areas targetted for improvement include on inconsistencies, e.g. by acknowledging and accepting the use of notation keys better, and by increasing the internal threshold for when two values are accepted to be equal to take account of rounding in decimal places.
The specific recommendations and requests made to the bodies from the 2006 review:
• Harmonisation of the LRTAP reporting Guidelines and NEC reporting on aspects such as source coverage and reporting deadlines;
• Provide a clear definition of completeness to allow this to be formally analysed for compliance purposes;
35
• Consider if the NEC data can be made publicly available through WEBDAB or an EEA website to improve public accessibility to, and transparency of this data.
3.12 REFERENCES UNECE, 2003. Emission Reporting Guidelines. Air Pollution studies No. 15. Guidelines for Estimating and Reporting Emission Data under the Convention on Long-Range Transboundary Air Pollution. ECE/EB.AIR/80. ISBN 92-1-116861-9. United Nations, New York and Geneva, 2003 UNECE, 2004. EB.AIR/GE.1/2004/8. Draft note on the differences between the revised and the previous emission reporting guidelines. UNECE 2005. EB.AIR/GE.1/2005/7, Annex III. Draft methods and procedures for the technical review of air pollutant emission inventories reported under the Convention and its protocols. Vestreng, V., Breivik K., Adams M., Wagner A., Goodwin J., Rozovskaya O., and Pacyna J. 2005. Inventory Review 2005. Emission Data reported to LRTAP Convention and NEC Directive Initial review for HMs and POPs. EMEP/EEA Joint Review Report, July 2005. Available: http://www.emep.int/reports/2005 ISSN 0804-2446 Vestreng, V. M. Adams and J. Goodwin, 2004, Inventory Review 2004. Emission data reported to CLRTAP and under the NEC Directive. EMEP/EEA Joint Review Report, July 2004. Available from: http://www.emep.int/reports/2004/emep_technical_1_2004.pdf Vestreng, V. and Klein, H., 2002, Emission data reported to UNECE/EMEP: Quality assurance and trend analysis – Presentation of WebDab, EMEP/MSC-W Note 1/2002
All UNECE/EMEP documents are available from: http://www.unece.org/env/emep/
Other UNECE/CLRTAP documents are available from: http://www.unece.org/env/lrtap/
This report and other EMEP reports are available from the EMEP home page:
http://www.emep.int/

36
4 REPORT OF THE TFEIP ‘EXPERT PANEL ON REVIEW’ SECRETARIAT ON THE TRIAL THIRD STAGE REVIEW OF THE LRTAP AND NEC AIR EMISSION INVENTORIES
Karin Kindbom, co chair Expert Panel on Review Martin Adams, ETC/ACC Vigdis Vestreng, EMEP/MSC-W
4.1 INTRODUCTION This chapter presents a summary of the main findings from the trial centralised review performed on the air emission inventories submitted by Parties to the Convention on Long-Range Transboundary Air Pollution (LRTAP) and by Member States under the requirements of the National Emissions Ceilings Directive (NEC Directive). This was the first year that a centralised review of air emission inventory data has been performed using LRTAP and NEC inventory data. The review builds on the results of the annual Stage 1 and 2 review performed by the Expert Review Team in 2005 (EMEP/EEA 2005). The Task Force on Emission Inventories and Projections (TFEIP) Expert Panel on Review thanks the national experts that contributed to this 3rd Stage review, and the national Agencies that provided funding to allow their participation. The European Environment Agency (EEA) is thanked for hosting the review team and providing meeting facilities.
4.2 MANDATE The EMEP Steering Body, at its twenty-ninth session welcomed the ‘Draft methods and procedures for the technical review of air pollutant inventories reported under the Convention and its Protocols’ (EB.AIR/GE.1/2005/7, annex III), as developed by the TFEIP (http://www.emep.int/emis2006/annex3.pdf). These were subsequently adopted by the Executive Body at the 23rd session (ECE/EB.AIR/87). The review and improvement of emission data is an important part of the work of the Convention’s TFEIP in its aim to achieve high quality emission inventories. The Executive Body, the Working Group on Strategies and Review (WGSR), the EMEP Steering Body (SB) and the European Commission (EC) have all underlined in recent years the importance of data quality for the effective implementation of the Protocols under the Convention and for policy development. The decision to conduct a trial centralised review was agreed at the 6th joint TFEIP/EIONET meeting, held in Rovaniemi, Finland October 2005. The review has been performed in accordance with the UNECE EMEP ‘Draft methods and procedures’ document (EB.AIR/GE.1/2005/7, annex III). As the 3rd Stage review this year was a trial process only, the country specific review results were only communicated to the Party concerned.
37
4.3 OBJECTIVES
The overall objectives for the LRTAP review process are outlined in the ‘Draft methods and procedures’ document (EB.AIR/GE.1/2005/7, annex III, para 2).
• The review will check and assess Parties’ data submissions with a view to improving the quality of emission data and associated information reported to the Convention.
• The review also seeks to achieve a common approach to prioritizing and monitoring inventory improvements under the Convention with those of other organizations with similar interests such as the United Nations Framework Convention on Climate Change and the European Union National Emission Ceilings (NEC) Directive.
In addition, the objective for this trial stage 3 review was to gain experience from a detailed review exercise in order to provide feedback to the TFEIP for future development of the reporting and review process. Issues for consideration were to:
• evaluate the perceived value added from a stage 3 review over stages 1&2;
• evaluate if the centralised review is an efficient stage 3 model;
• estimate resource requirements;
• assess the usefulness of the present Emission Reporting Guidelines (ECE/EB.AIR/80, Air Pollution Studies series, No. 15) and the Emission Inventory Guidebook (EEA, 2005) for detailed review purposes;
• discuss timing issues;
• consider organisation and management issues.
4.4 REVIEW MANAGEMENT The trial review was planned and coordinated by the TFEIP Expert Panel on Review in cooperation with the European Topic Centre for Air and Climate Change (ETC-ACC). The review took place from 27th of February to 3rd of March 2006 in Copenhagen, Denmark and was conducted by the following team of experts nominated by the volunteering participating countries: Generalist - Mr. Justin Goodwin (ETC-ACC); Energy - Mr. Tomas Gustafsson (Sweden), Mr Tinus Pulles (ETC-ACC), Mr Stephan Poupa (Austria); Industrial Processes - Ms. Zuzana Elenicova (Slovakia), Ms Jitka Hlavicova (Czech Rep), Ms Kristina Saarinen (Finland); Agriculture - Mr. Chris Dore (United Kingdom), Mr. Steen Gyldenkærne (Denmark). Mr. Justin Goodwin and Mr. Tinus Pulles were the lead reviewers. The review was coordinated by a trial review secretariat led by Ms. Karin Kindbom (co-chair of the Expert Panel on Review) with additional support from Mr Martin Adams (ETC-ACC) and Ms. Vigdis Vestreng (EMEP MSC-W).
4.5 REVIEW PLANNING AND PROCESS The planning and implementation of the trial stage 3 review followed the schedule outlined below.
- Sept-Oct 2005: TFEIP agreement to perform the trial review and invitation to countries to participate in the trial review issued;
- 11-12 Jan 2006: Planning meeting in Gothenburg (Kindbom, Goodwin, Vestreng);

38
- 27th Jan 2006: Review material and information distributed to review experts;
- 27 Jan - 27 Feb: Experts start to get acquainted and work with review material;
- 27 Feb - 3 Mar: Review week in Copenhagen;
- June: Lead reviewers edit draft review reports and send back to experts and review secretariat;
- June-August: Review experts and review secretariat approve of the draft reports;
- August: Draft reports sent by review secretariat to the individual country for comments and clarifications;
- September: Comments on reports from countries to review secretariat. Feedback from countries on the review process usefulness and timing;
- September: Clarifications of report comments from countries with Review Experts via review secretariat;
- September-October: Lead reviewers and review secretariat finalise review reports and send to countries;
- 15th July: Review Secretariat produce a trial review chapter for the annual review report.
4.5.1 Countries and data reviewed In September 2005, the Chairpersons of the TFEIP sent a preliminary invitation to Parties who had submitted informative inventory reports (IIRs) with their 2005 LRTAP inventory submissions to participate in a voluntary centralised review. Eleven Parties subsequently volunteered to have their inventory submissions reviewed:
• Austria • Finland • Belarus • Slovakia • Belgium • Spain • Cyprus • Sweden • Czech Republic • United Kingdom • Denmark
As noted previously, a number of the volunteering participating countries also nominated national experts to contribute to the 3rd Stage review process. The trial review was organised in a way that the national experts participating as reviewers did not review their own country's submission. The reviewers only assessed inventory data reported in the NFR reporting format and submitted up to 10th March 2005 to the UNECE secretariat under the LRTAP Convention. The scope of the review was on the pollutants covered by the Gothenburg Protocol, SO2, NOx, NMVOC and NH3, for the years 1980 – 2003, and covering the source sectors Energy, Industrial processes and solvent use, and Agriculture. NEC data was not reviewed explicitly in this trial 3rd stage review. However results from the Stage 1 and 2 reviews performed in 2005 (EMEP/EEA 2005) indicated that, except for one of the countries reviewed, there were no differences larger than 0.1% between the respective LRTAP and NEC submissions.

39
Prior to the review, the following preparatory material was provided to the experts:
(a) Background material a. 2005 joint EMEP/EEA Review report
(http://emep.int/publ/reports/2005/emep_technical_1_2005.pdf) b. Informative Inventory Report template
(b) Country Data and Reports a. Officially reported data (Excel file), instructions for using the file b. Informative Inventory reports (IIRs) c. Country specific Review reports (Questions and Responses from review stage
1&2),
(c) Guidelines a. UNECE, 2002. Emission Reporting Guidelines b. Link to EMEP/CORINAIR Guidebook c. Guidebook Chapter on Good Practice Guidance d. Overview of reporting requirements according to UN protocols signed by
country (base year, pollutants, area included)
(d) Review Mandate and Guidance a. Guidance for Reviewers (draft, prepared for this trial centralised review). b. Draft methods and procedures for the technical review of air pollutant
emission inventories reported under the Convention and its protocols (Annex III of EB.AIR/GE.1/2005/7)
(e) Review transcript and Review report template
a. Review Report Template (derived from UNFCCC template) b. Review transcripts template (derived from UNFCCC template) c. Instructions for review transcript

40
4.6 TRIAL REVIEW ROLES AND RESPONSIBILITIES. Table 4.1 summarises the tasks and responsibilities of those involved with the trial stage 3 review process.
Table 4.1. Roles and responsibilities for the trial stage 3 review process.
Secretariat Lead reviewers Expert Review Team Provide the background preparatory material, guidance and templates for the review to the Expert Review Team (ERT)
Prepare a brief work plan for the review activity
Examine the adherence of the inventory information to guidelines etc
Present stage 1 & 2 review findings and clarify use of the templates, data and guidance for review
Monitor the progress of the review activity and ensure that there was good communication within the expert review team
Review the transparency of the inventories and examine whether good practice was applied
Available to provide administrative advice on the review process
Coordinate queries of the expert review team to the Party and coordinate the inclusion of the answers in the review reports
Compare emission estimates, activity data, implied emission factors and any recalculations to identify irregularities or inconsistencies
Communication of the ERT's questions and draft review reports to the parties and receipt of responses from the parties
Provide ad-hoc technical advice to the experts, if needed
Identify any missing sources and examine any explanatory information relating to their exclusion from the inventory
Finalisation of the review reports in cooperation with the Lead Reviewers
Ensure that the review is performed and the review report is prepared in accordance with the draft guidelines
Identify the reason for any differences between the Party’s and the Stage 1 and 2 key source determination
Collecting and compiling experiences from the trial stage 3 review for a chapter in the annual review report
Verify that the review team gives priority to key source categories
Assess the consistency of information in the data with that in the IIR
Identify if countries differ in terms of their implied emission factors and their sectoral allocation, and obtain explanations for differences
Identify areas for further improvement of the inventories

41
4.7 TECHNICAL REVIEW FINDINGS (BY LEAD REVIEWERS) This trial review has provided a great deal of insight into the possible usefulness and functioning of future stage 3 reviews. A summary of these from a lead reviewers perspective follow:
• A third stage of review is essential in order to understand and solve the real issues with reported inventories
• It provides a unique technical opportunity for inventory experts to exchange ideas and learn from each other
• It has the profile to attract attention from high up in Parties organisations and get support from ministries.
Due to the large number of UNECE pollutants and the absence of metrics to combine these pollutants the review and the review reports can not follow the same structure as that of the UNFCCC.
The review teams need specific training and review support to be able to review non GHGs. Even review experts with experience from the UNFCCC review process found this review difficult because of the lack of technical structure and mandate boundaries to review against. Agreement and guidance is needed on the reviews mandate and scope as well as the language to use that will be interpreted appropriately by parties politically and technically (e.g. sector, source, pollutant, compound, category, recommends, should, shall etc)
Review reports have the potential to be long and time consuming and unfocused, because of the wide scope of the inventories therefore, streamlining the review reports to concentrate on identifying the good practices and the key improvements needed is necessary. For example, summaries of the trends and important sources in similar detail to the UNFCCC review reports will be time consuming and not necessary for the desired review outcomes of improved emission estimates and compliance assessments.
Limiting the number of countries reviewed in a review week to 5-6 and not 11 as was done for this trial review.
Better reporting guidelines are needed for Parties and for review teams to review against.
Improvements to the guidebook are required to provide the review teams with a benchmark for methodology quality.
Specific findings from this trial Stage 3 review include:
• A general lack of description of trends and clear identification of the reasons for significant dips and jumps in the inventory time-series.
• A lack of clarity about the methods, emission factors and assumptions used for sectors in the inventory.
• Some time-series inconsistency resulting in methodology based changes in the inventory.
• The general quality and professionalism of the inventories was good and the review teams all felt that Parties inventory compilers were highly technically and professionally competent but hampered by limited resources.

42
4.8 FEEDBACK FROM THE EXPERT REVIEW TEAM ON THE TRIAL STAGE 3 REVIEW PROCESS AND FINDINGS
4.8.1 Assessment of completeness in relation to reporting requirements A key problem experienced by the review team was that the legally required reporting requirements for each Party are not clear. The requirements as defined in the LRTAP Protocols, the Guidelines (Para 9 and 21) and the footnotes to the NFR reporting template in the Reporting Guidelines (Section D, Table IV 1 A and IV 1 B) are not consistent and therefore are somewhat ambiguous. This made it difficult for the expert review team to compare the reported data received from Parties against mandatory reporting requirements. It was a general agreement that for review purposes a clear guidance regarding what criteria to review against is needed in order to be able to assess completeness, especially concerning reporting years (time-series), pollutants and whether or not source categories or only national totals are required.
4.8.2 Availability of information for the review A further challenge in performing a 3rd stage review was that the review team had to rely on additional information presently provided by countries on a voluntary basis such as an Informative Inventory report, IIR (Guidelines para 38). The review team considered the availability of IIRs to be essential to perform a stage 3 review. IIRs received from countries varied in the amount of information, level of detail and format. Despite the provision of an IIR template, not all countries included the necessary information in terms of detailed methodology description, sources of activity, emission factors etc. Detailed information on activity data, emission factors and methodology (and references for these) is necessary to ensure sufficient transparency for the review. From the review team it was stressed that it is important that in future years the IIR become mandatory and that countries are requested to provide IIRs in a standard format to facilitate the review. The experts felt that the availability of relevant activity data is important to be able to perform a detailed review. At present reporting of activity data under LRTAP is required every 5th year, and in a rather aggregated format which is not detailed enough for 3rd stage review purposes. In stage 2 of the review, activity data reported by Parties to UNFCCC were used, but due to differences in sources and timing of submission of data, the activity data cannot be fully used in the LRTAP review. Not all countries included details of their QA/QC systems in their submitted IIRs. The expert review team encourages Parties in the future to report this information to further increase confidence in the reported data.
4.8.3 Transparency, reporting template The review team commonly found a lack of transparency of submitted data, especially for the NFR–codes “Other”. If the emissions included in “Other” are not separately explained in the IIR it is not clear what these emissions comprise. This limits the extent to which a detailed review can comment on the reported data. This problem was particularly noted for emissions from industrial processes reported as ”Other”. It was also stressed from the expert review team that it would be helpful if relevant information on process types used in the industrial sector within countries would be reported in the IIRs.
43
4.8.4 Consistency, reporting template The stages 1&2 review consistency tests noted that for some of the countries reviewed in the stage 3 review, the reported aggregated data was not always internally consistent with the sum of the detailed sub sectors reported. This introduced an uncertainty if data in the sub-sectors provided really were meant to constitute all of the aggregated emissions, or if there were emissions added at aggregated level that were not allocated to any of the sub sectors. Alternatively, the inconsistencies could simply be a result of errors in summing the sub sectors to the aggregated level. These problems with inconsistencies in aggregations should be carefully considered in the revisions of the Guidelines and reporting template. The review team however, recognised the importance of not changing the reporting templates too often, which inevitably leads to problems and additional work for the Parties, as well as in the review process. An additional problem for the reviewers was that for some countries only a limited set of data were available for review in the NFR format, and additional (older submissions) are only available in the SNAP system. There is a need to consider extending the review to cover data reported in other formats. It is however not always straightforward to compare data reported in different formats on a detailed level.
4.8.5 Comparability and source allocation During the trial review it was discovered, or suspected, in several cases that there are inconsistencies in source allocation between Parties. It is not always clear if this is a result of misinterpretation of the reporting guidance or if it is not possible to split out the data within a respective country’s inventory. The allocation and separation of emissions between e.g. Energy and Industrial processes involving combustion may be a problem in some countries. The review team suggested that a reference could be made in the Emission Reporting Guidelines at a generic level to UNFCCC guidance to define separation of process emissions from combustion of fuels. Sometimes, primarily for less significant sources and/or for sources emitting only particulate matter, it is probably not defined clearly enough in the reporting guidance where to allocate emissions. The review team stated that emissions may be aggregated and need not necessarily be split and reported in the correct reporting code, but reported data need to be transparent and traceable.
4.8.6 Usefulness of Guidebook for reviewers and for national experts compiling inventory The guidebook was generally considered suitable as a point of reference for the purposes of detailed review for the pollutants covered in this review. In terms of assisting countries to compile emission inventories, the review team however commented that for some sources a large number (>30) of ‘default’ emission factors are provided in the Guidebook, which can encompass a wide range of values. It is maybe not clear for the inventory compiler to know what factor should be used in the first instance. The review team anticipate that the guidebook won’t provide sufficient information for other pollutants e.g. PM10, pesticides etc. and that the Guidebook needs to be further developed to support review activities if these substances are to be included in future review activities. The review team considered that there is a need to distinguish between the function of available guidance for review purposes within the UNFCCC system and that of LRTAP. The UNFCCC system could be described as being a review primarily targeted towards compliance

44
while in the LRTAP system the function of guidance is also to provide and reference best science for emission inventory.
4.8.7 Usefulness of Stage 1&2 review Feedback received from the review team indicated that generally the country specific reports from the Stage 1&2 review provided useful input to the 3rd stage review. Stage 1&2 was considered an excellent way of giving feedback to countries, and several instances of e.g. flagged data had been adequately commented and explained by the countries already in their responses to the Stage 1&2 review. It was however noted that the time series test (dips & jumps) could be further refined since it was felt that some irrelevant flagging, as well as some missing dips & jumps that could have been flagged existed in the material. It was suggested from the review team to consider investigating the use of different thresholds for key sources and non-key sources, or different thresholds for sector/pollutant combinations. It was also noted that the usefulness of the Stage 1&2 tests would be further increased if Implied Emission Factor (IEF) checks could be performed for a greater number of sectors. More IEF checks in stages 1&2 would provide early comments from the countries as an input for a detailed review. This would however require better availability of relevant activity data. Some caution is needed when interpreting the results of IEF analysis, especially if it is conducted on an aggregated level. It has to be clear that a deviating IEF does not necessarily mean that something is wrong, but rather an issue to investigate further. For the countries the information from the IEF tests could be used as an indication on what sectors they need to provide additional information for. The review team noted that the compliance checks on the inventory submission data presently included in the Stage 1&2 review are not directly used as an input for the stage 3 review work. However these checks were recognised as necessary to the initial review process and need to be retained.
4.8.8 Recalculations and time series In this trial review, data from only one inventory submission was examined so the issue of recalculations could not be addressed through the available data. However, it is noted that recalculations, and country explanations for these, are presently covered in the stages 1&2 review country reports. The review experts assessed if the recalculations were transparently explained and justified in the responses to the stages 1&2 review and in the IIRs.
4.8.9 Value added from a stage 3 review over stages 1&2 The feedback from the review experts on the value added from a stage 3 review over stages 1&2 concerned both the value added for countries being reviewed, as well as the benefits for the experts participating in the review. The stage 1&2 review indicates possible errors and to a certain extent, sets emissions in context, but the technical steps and tests during these first stages of the review by their nature do not have the possibility to go into detail and assess and give feedback on e.g. choice of methodology, assess appropriateness of emission factors or make recommendations on improvements. These issues are addressed in a detailed review, given that suitable information such as a well developed IIR is available.

45
The 3rd Stage review also provides a number of additional longer-term benefits by providing confidence in the quality of reported data for compliance purposes for the work of the Convention and Commission, by providing feedback on the development needed for the Guidebook and the Guidelines, and by providing Parties/MS and national experts with information concerning the judged quality of their reported data and issues that might be addressed in the future to further strengthen the national emission inventories. The possibility of developing an indicator(s) to monitor progress and reflect improvements in the submitted inventory datasets over time was suggested for future consideration. The review team was concerned about the reactions from countries on the usefulness and also the added workload that will be the result of a detailed review. The review team noted that many countries under the Convention have been interested and positive with respect to the Stage 3 review process. It was also noted that it is important that countries feel that the information received in the country reports from the review is useful for national inventory improvement, e.g. to prioritize future work. It is recognized that participation in a Stage 3 review will require additional resources from national inventory teams. An estimate of the resources required for participation in a Stage 3 review is provided in the Resource Requirements section below. Some countries will of course have other priorities in terms of inventory development. However, a clear aim of a Stage 3 review is to support the underlying objectives of the Protocols themselves, through encouraging and supporting countries to submit good quality inventory data. The fact that the national inventory has been reviewed by an independent international review team is seen to add credibility and importance to the submitted data and the work performed by countries. The review team feedback was also that by participating in the review process the national experts themselves have the opportunity to study how other countries have organised and solved the inventory work. It is a good way of sharing best practice, to learn from other countries and to take ideas back for implementation in their own work etc. One of the prime reasons for a detailed review is to help countries improve the quality of their inventories in the future. The feedback received from countries in terms of seeing whether they found the review to be useful or not should be an important factor in any future development of the review process. Responses on the value of the stage 3 review from participating countries will be collected at the same time as the individual review reports are sent out for comments in August. The communication between contact persons in the countries and the review secretariat which took place during the review week in February, as responses to requests for clarification, were generally very informative and perceived by the review experts to be provided with a positive attitude. Members of the expert review team identified several clear benefits of their participation in a detailed review process. One benefit of the review noted by the review team is that countries can be made aware of the inventory systems, organisation and processes used in other countries. This information can, in the future, be made available through the country review reports if these are made public.
4.8.10 Is a centralised review an efficient model? The feedback from the review team was that a centralised review is an efficient and appropriate way of conducting a detailed review. It was also discussed how to further develop

46
and focus future detailed reviews. There are several options e.g. in terms of covering all reported sectors for selected pollutants, or concentrating on a specific sector and more or all pollutants, or concentrating on specific pollutants such as PMs, POPs and heavy metals. Irrespective of what a detailed review is planned to cover, a centralised review model could be applied. Depending on the focus and objective of a detailed review, the composition of the expert review team may need careful consideration. If appropriate the expert review team could include relevant scientific expertise as well as national inventory experts. The review team also raised the issue of future scheduling of detailed review activities. Issues that need to be considered are how often a detailed review should be performed, should there be a cycling between countries, sources, pollutants? There could also be a cycling of detailed reviews with different objectives, e.g. focussing on the review of inventory submissions from a compliance perspective, or a more scientific review.
4.8.11 Timing issues The planning and implementation of the trial review, as described above, was a working timetable, where the first version turned out to be too optimistic. The planning and preparation went according to schedule, as did the review week activities in Copenhagen. Eleven countries was considered to be just possible to review during one week, but this was largely made possible due to limited information being available for some countries which made more detailed (and lengthy) assessments impossible. In future centralised reviews, given the availability of more extensive background material, fewer country submissions for review are recommended given an equivalently sized expert review team. The work items to be performed after the review week, compilation of draft reports, distribution of reports to countries for comments and collating final reports incorporating country comments was delayed compared to the original planning as time originally allocated for these activities was underestimated.
4.8.12 Organisation and management issues The expert review team found the preparation of review material received prior to the review week appropriate and useful. An excel file (spreadsheet tool) prepared with all relevant data from WEBDAB, was considered by the review team to be very useful and should be used in future reviews. Some improvements in the original spreadsheet tool were made during the review week, such as adding summary tools and functions for creating overview graphs. If the review process will be formalized, careful consideration has to be given to the roles and responsibilities of the participants, as well as that of the secretariat. Evidently, in a formal process, country experts from a reviewed country would not be present. A clear role and organization of the review secretariat needs to be defined, as well as the role of the UNECE secretariat. Generally, the roles and responsibilities for the lead reviewers and the review experts as defined for this trial review was considered to be appropriate.
4.8.13 Harmonization with UNFCCC One of the aims in the development of the LRTAP review process is to harmonize as far as possible with the UNFCCC process in order to make use of those experiences and the familiarity of that system within the countries and among the experts. From the discussions and feedback during the trial review it was concluded that the LRTAP review needs to take a somewhat different approach than the UNFCCC review approach since there are large
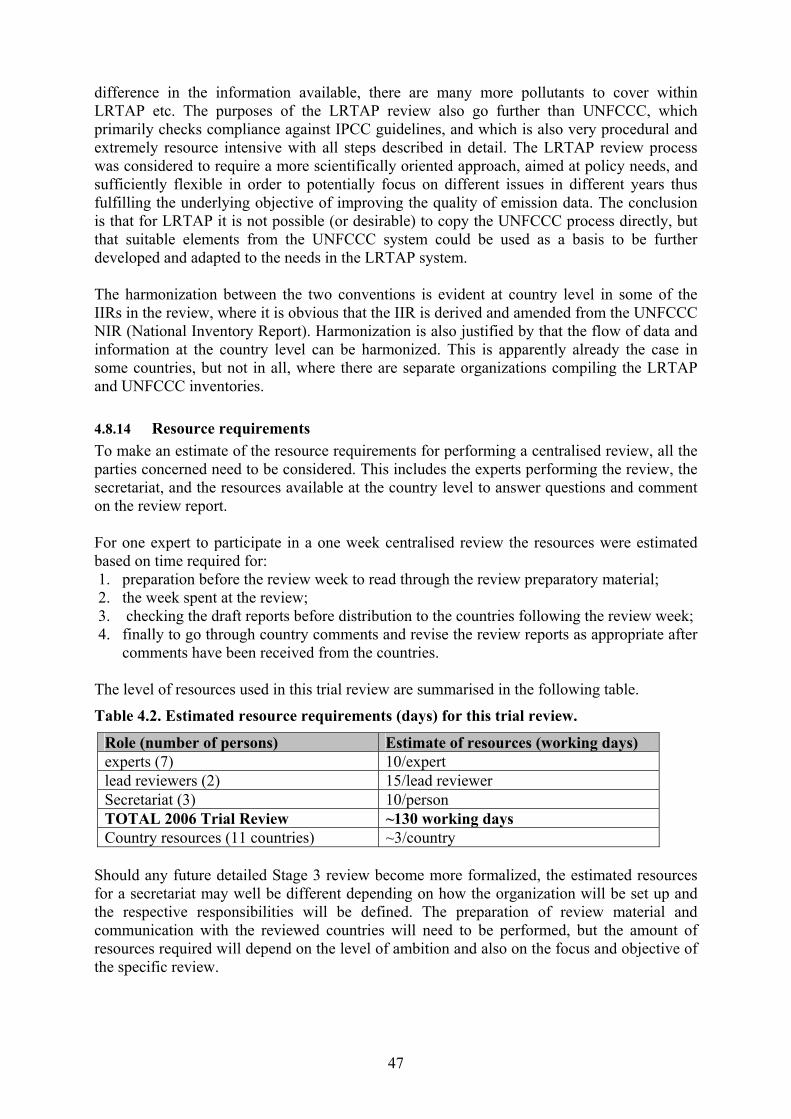
47
difference in the information available, there are many more pollutants to cover within LRTAP etc. The purposes of the LRTAP review also go further than UNFCCC, which primarily checks compliance against IPCC guidelines, and which is also very procedural and extremely resource intensive with all steps described in detail. The LRTAP review process was considered to require a more scientifically oriented approach, aimed at policy needs, and sufficiently flexible in order to potentially focus on different issues in different years thus fulfilling the underlying objective of improving the quality of emission data. The conclusion is that for LRTAP it is not possible (or desirable) to copy the UNFCCC process directly, but that suitable elements from the UNFCCC system could be used as a basis to be further developed and adapted to the needs in the LRTAP system. The harmonization between the two conventions is evident at country level in some of the IIRs in the review, where it is obvious that the IIR is derived and amended from the UNFCCC NIR (National Inventory Report). Harmonization is also justified by that the flow of data and information at the country level can be harmonized. This is apparently already the case in some countries, but not in all, where there are separate organizations compiling the LRTAP and UNFCCC inventories.
4.8.14 Resource requirements To make an estimate of the resource requirements for performing a centralised review, all the parties concerned need to be considered. This includes the experts performing the review, the secretariat, and the resources available at the country level to answer questions and comment on the review report. For one expert to participate in a one week centralised review the resources were estimated based on time required for: 1. preparation before the review week to read through the review preparatory material; 2. the week spent at the review; 3. checking the draft reports before distribution to the countries following the review week; 4. finally to go through country comments and revise the review reports as appropriate after
comments have been received from the countries.
The level of resources used in this trial review are summarised in the following table.
Table 4.2. Estimated resource requirements (days) for this trial review.
Role (number of persons) Estimate of resources (working days) experts (7) 10/expert lead reviewers (2) 15/lead reviewer Secretariat (3) 10/person TOTAL 2006 Trial Review ~130 working days Country resources (11 countries) ~3/country
Should any future detailed Stage 3 review become more formalized, the estimated resources for a secretariat may well be different depending on how the organization will be set up and the respective responsibilities will be defined. The preparation of review material and communication with the reviewed countries will need to be performed, but the amount of resources required will depend on the level of ambition and also on the focus and objective of the specific review.

48
Resources are also required in the countries to answer questions communicated by e-mail during the review week and to comment on the draft country review reports before they are finalised. The resources needed may vary between countries, depending on the number and nature of the issues raised. Additional resources required for a Stage 3 review include costs for traveling and accommodation during a centralised review week, as well as meeting facilities etc. All costs for the individual national review experts in this trial review, and for one person at the secretariat, were covered by the individual countries. The costs for the lead reviewers and one person at the secretariat were covered by the EEA/ETC-ACC, and by EMEP for one person at the secretariat.
4.9 CONCLUSIONS AND ISSUES FOR CONSIDERATION FOR THE FUTURE DEVELOPMENT OF A STAGE 3 REVIEW
This section summarise the general findings and main observations resulting from the trial Stage 3 centralised review.
• GUIDELINES: The Expert Review Team provided feedback on a number of issues where it was considered that the Emission Reporting Guidelines could be amended to better assist Parties in their reporting and to facilitate future in-depth reviews.
(a) For review purposes a clear guidance regarding what criteria to review against is
necessary in order to be able to assess completeness i.e. the mandatory reporting requirements on a country-specific basis. The amended Reporting Guidelines need to refer to the review mandate (Annex 3), which can itself be updated as appropriate.
(b) Submission of an IIR is necessary for review purposes and should be made mandatory
in the Guidelines if future detailed reviews are desired. It was recognised that there is a need to provide Parties with an improved template to provide guidance on the types and scope of information that should be included in the IIR. It is suggested that this is included in the Guidelines.
(c) The experts felt that the availability of relevant activity data is important to be able to
perform a detailed review, and several options were discussed.
(d) Reporting template: i. Comparability and source allocation: It was felt that the present template does
not provide sufficient clarity for Parties as to where emissions from certain sources should be reported. Hence, Parties are allocating emissions to different sources
ii. Transparency: The review team found lack of transparency of reported data, especially for the reporting codes "Other". The transparency of reported data would increase if the NFR codes were extended, but the need to harmonise the NFR inventory reporting code system with UNFCCC as far as possible was also recognised.
iii. Consistency and aggregations: It was felt that the mix of aggregated and detailed sectors in the present reporting template does not allow a summary of emissions to be easily compiled for assessment purposes. The format of the

49
template also allows countries to report inconsistent aggregated emissions and increases the risk of errors in aggregation.
iv. Time series: The expert review team considered it to be useful for the purposes of future reviews if Parties were requested to report complete time series of emissions in NFR format.
• GUIDEBOOK: The Guidebook was considered suitable as a point of reference for the
purposes of detailed review for the pollutants covered in this review. It was foreseen that the Guidebook will not provide sufficient information for other pollutants (e.g. PM10, pesticides etc) and will need to be further developed to support future review activities.
• USEFULNESS OF STAGE 1&2 REVIEW: The country specific reports from the Stage
1&2 review were considered by the expert reviewers to provide very useful input to the detailed review and were considered an excellent way of giving feedback to countries. It was recommended to try to improve the time series test and to calculate Implied Emission Factors for more sectors.
• STAGE 3 ADDED VALUE: The review team identified a number of issues concerning
the value added from a stage 3 detailed review as compared with Stage 1&2 review. A number of benefits that may be obtained from participating in a Stage 3 review were identified both for the countries being reviewed as well as for the experts participating in the review. The most important of these was seen as being able to provide country-specific feedback and recommendations to help in prioritisation and inventory improvement, as well as a deeper assessment of comparability, e.g. methodologies and emission factors used. The fact that several national experts cooperate in reviewing other countries submissions was seen as an excellent way of sharing good practice and to learn from the other reviewers present.
• STAGE 3 REVIEW MODEL: The centralised review format was considered to be an
efficient way of performing a detailed review. Possible options for future reviews were discussed although no firm recommendations were reached i.e. how often a detailed review should be performed; possibilities to cycle a review between countries, sources, pollutants; and benefits of having a compliance-based review compared to a more scientific review. Opportunities for harmonizing the LRTAP Stage 3 review process with the UNFCCC review process were discussed by the expert review team. For LRTAP purposes it was concluded that it was not possible (or desirable) to copy the UNFCCC review process directly, but that suitable elements from the UNFCCC system could be used as a basis to be further developed and adapted to the needs in the LRTAP system. The LRTAP review process was considered to require a more scientifically oriented approach and be aimed at policy needs (in comparison with the more compliance-focused UNFCCC review). Furthermore, the experts felt that the LRTAP review should be sufficiently flexible in order to potentially focus on different issue s in different years thus fulfilling the underlying objective of improving the quality of LRTAP and NEC emission data.
• STAGE 3 REVIEW ORGANISATION: If the review process will be formalised,
careful consideration has to be given to organisation and management issues. Roles and responsibilities have to be defined for participants and for the secretariat and administrative functions. In this trial review the original planned timing and resources for the process was too optimistic. The various preparatory information and software tools

50
provided to the expert reviewers were considered useful and it was recommended that this should be used in any future Stage 3 reviews.
• RESOURCE REQUIREMENTS: The resource requirements for performing this trial
review were estimated to a total of approximately 130 working days for the experts and the review secretariat. The resources needed in the reviewed countries for providing clarifying responses during the review week and commenting on the draft review reports was estimated to a few days per country. In a future formalised process the resources needed for the secretariat may well be different than for this trial review.
4.10 REFERENCES EB.AIR/GE.1/2005/7, Annex III. Draft methods and procedures for the technical review of air pollutant emission inventories reported under the Convention and its protocols. ECE/EB.AIR/80, Air Pollution Studies series, No. 15. Emission Reporting Guidelines - Guidelines for Estimating and Reporting Emission Data under the Convention on Long-range Transboundary Air Pollution. EEA (2005) EMEP/CORINAIR Emission Inventory Guidebook – 2005, http://reports.eea.eu.int/EMEPCORINAIR4/en EMEP/EEA (2005). Inventory Review 2005 - Emission data reported to LRTAP Convention and NEC Directive. EMEP Technical Report 1, 2005. http://www.emep.int/publ/reports/2005/emep_technical_1_2005.pdf
51
5 EVALUATION OF INVENTORIES OF HEAVY METALS AND PERSISTENT ORGANIC POLLUTANTS WITHIN THE CONVENTION ON LRTAP
Jozef M. Pacyna1, Hugo Denier van der Gon2, Stefan Reis3, Oleg Travnikov4, and Vigdis Vestreng5
1 Chemical Co-ordinating Centre (CCC), Norwegian Institute for Air Research (NILU), Kjeller, Norway 2 TNO Built Environment and Geosciences, Apeldoorn, The Netherlands. 3 Institute of Energy Economics and the Rational Use of Energy (IER), Stuttgart, Germany 4 Meteorological Synthesizing Centre – East (MSC/E), Moscow, Russia. 5 Meteorological Synthesizing Centre – West (MSC/W), The Norwegian Meteorological Institute (met.no), Oslo, Norway.
5.1 INTRODUCTION Recently several independent studies have addressed emissions of Heavy Metals and Persistent Organic Pollutants within (parts of) the UNECE domain. The results of three such studies will be briefly presented in this chapter because their results may be useful in reviewing official submitted HM and POP emission data reported annually to the Secretariat of the UNECE Convention on Long-Range Transboundary Air Pollution (CLRTAP). Furthermore, data collected in these projects, comparisons between expert and official data and lessons learned may provide suggestions to improve the current data reporting. The three projects are briefly introduced below. It should be noted that there may well be other relevant projects in the field of HM and POP emissions which are not addressed in this chapter. The term “expert estimates” is used throughout this chapter to indicate default emission estimates based on expert judgement in combination with literature data. A key feature of these estimates is that they are relatively consistent between countries as the same methodology is applied. However, it is important to note that the term “expert estimate” does not suggest a higher quality or accuracy than official emission data. In many cases local and/or national emission data and measurements may be better and more representative than a general “expert” methodology. Hence expert estimates are often used for gap filling. Improved expert estimates indicate a more thorough review of the available literature that may result in “improving” current or previously used expert judgement.
5.1.1 Estimation of willingness-to-pay to reduce risks of exposure to heavy metals and cost-benefit analysis for reducing heavy metals occurrence in Europe (ESPREME). The ESPREME project is carried out under the EU 6th framework programme and aims at the development of methods and tools to support European environmental policy making in the specific case of reducing the harmful impacts of heavy metals. The study is carried out for the whole of Europe, both EU Member States and Accession Countries with more detailed assessments for several individual countries in Western Europe (Norway, Germany, Italy) countries and in 3 Accession Countries (Poland, the Czech Republic and Hungary). As part of the ESPREME project detailed emission inventories were compiled for all relevant heavy metals (base year 2000 and scenarios for 2010), improving the quality of the current datasets

52
in terms of resolution (temporal, spatial and substance) and accuracy. These datasets also allow a comparison between official submitted emission data and expert estimates developed within the ESPREME project. These results are discussed in section 1.2 of this chapter. ESPREME is carried out by a consortium lead by the Institute of Energy Economics and the Rational Use of Energy (IER, University of Stuttgart). More information about the ESPREME project is available at http://espreme.ier.uni-stuttgart.de.
5.1.2 Study to the effectiveness of the UNECE Heavy Metals Protocol and UNECE Persistent Organic Pollutants Protocol and cost of additional measures (TNO HM & POP study) In 2003 the UNECE Protocols for Heavy Metals (HM) and Persistent Organic Pollutants (POP) entered into force. Once the protocols enter into force automatically a review starts. Therefore, the Dutch Ministry of Housing, Spatial Planning and the Environment (VROM) has asked TNO to execute a study to the effectiveness of the UNECE Heavy Metals Protocol and Persistent Organic Pollutants Protocol and an assessment of possible additional measures with their reductions and costs, based on projections of 2000 emission data to the years 2010, 2015 and 2020. The study consists of two phases. Phase I comprises the construction of an emission inventory for the year 2000, including actualisation of emission data and projections for 2010, 2015 and 2020, geographical allocation of these emissions, efficiency of the current protocols and a preliminary inventory of possible additional reduction measures. It was completed in August 2005 and published in two reports (Denier van der Gon et al., 2005a, b). Phase II comprises an estimation of the emission reduction as well as costs of options for revision of the HM/POP Protocols and will be published in 2006. The domain of study is the European region falling under the UNECE Convention on Long Range Transboundary Air Pollution (CLRTAP) and thus does not include Canada and the United States.
5.1.3 Dioxin Emissions in Candidate Countries (TNO CC dioxin inventory) At the EU Environment Council in December 2001 conclusions on the Dioxin Strategy
were
adopted and emphasised among other things the need to gather knowledge on the situation on dioxins in the new Member States. Against this background a project investigating the dioxin and furan emissions to air, water and land was commissioned to a consortium lead by TNO. The project " Dioxin Emissions in Candidate Countries" lays the foundation for a consistent and harmonised dioxin emission estimate for air, land and water releases in the new EU Member States. The report of the PCDD/F inventory (Pulles et al. 2005a) for candidate countries is available at http://ec.europa.eu/environment/dioxin/pdf/rapport_2005.pdf. The study assessed PCDD/F emissions in 13 countries (Bulgaria, Cyprus, Czech Republic, Estonia, Hungary, Latvia, Lithuania, Malta, Poland, Romania, Slovak Republic, Slovenia, Turkey).
5.1.4 Outline and scope of the chapter The three studies have overlaps in their coverage. Unfortunately no time (and budget) was available to make a complete integration of the individual project results resulting in a coherent assessment and comparison with officially submitted emission data by Parties to the Convention on LRTAP. Hence a few practical choices are made. The ESPREME project and the TNO HM & POP study both address heavy metal emissions in 2000 and 2010. The ESPREME project does not cover total UNECE-Europe; Azerbaijan,
53
Armenia, Georgia, Kazakhstan and Kyrgyzstan are not included. The explicit aim of the TNO HM & POP study is to incorporate as much country data as possible (country data meaning emission data prepared by national experts of that country) and complement the inventory by TNO default estimates to achieve completeness. The ESPREME project made two types of emission inventories; an inventory based on official emission data with ESPREME expert estimates to fill in gaps and a “full expert” emission inventory. The ESPREME “official” emission inventory is comparable to the TNO study which was developed under similar prior conditions. A quick informal comparison (data not shown) showed that the differences in the emission estimates for the two inventories were fairly small. For countries with officially submitted emission data this was by definition so, but for countries with no official emission data available, the deviations were limited. However, the ESPREME full expert emission inventory shows considerable deviation from the inventories based on official emission data and presents generally higher emissions. This suggests that the major differences are not caused by deviation between TNO expert estimates and ESPREME expert estimates but by deviation between expert estimates and official estimates. It is concluded that for the purpose of the present report the most useful contribution for heavy metals is a comparison between ESPREME expert emission data and official submitted heavy metal emission data. This comparison is made and discussed in section 5.2 of this chapter. The TNO study (Denier van der Gon et al., 2005b) covers Persistent Organic Pollutants and eight substances possibly proposed for addition to the POP protocol. Official emission reporting of POP by Parties to the convention is much less complete than HM and the TNO expert estimates for the POPs fill an important cavity. These data are reported in section 5.3 of this chapter along with some recommendations on future reporting. The study on Dioxin Emissions in Candidate Countries (Pulles et al, 2005) reports emissions for a subgroup of countries covered in the TNO HM & POP study. The results are separately presented in section 5.3.2 because the studies are not entirely compatible in their source sector descriptions and scope. The expert estimates in the TNO CC dioxin study are thought to more accurately estimate real emissions because special effort went into defining emission factors for the local / national situation. In the TNO HM & POP study expert estimates only served to fill in gaps but are to be overwritten if, or as soon as, official data become available. An interesting addition of the TNO CC dioxin study is the emphasis on the uncertainty surrounding emission estimates and the consequences of such uncertainties for policymaking. Parties to the protocol can propose new substances which can be added to annex I, II or III of the 1998 UNECE POP protocol. For several of these substances a first UNECE-wide emission inventories has been made by the TNO HM & POP study and the results are briefly discussed in section 5.4.

54
5.2 HEAVY METALS: DIFFERENCES BETWEEN ESPREME EMISSION DATA AND OFFICIAL DATA.
The EU 5th Framework Programme research project ‘Estimation of willingness-to-pay to reduce risks of exposure to heavy metals and cost-benefit analysis for reducing heavy metals occurrence in Europe’3, in short ESPREME, aims at the development of methods and tools to support European environmental policy making in the specific case of reducing the harmful impacts of heavy metals. Heavy Metals (in particular mercury, cadmium, chrome, nickel, lead and arsenic) from various sources contribute to ambient concentrations in air as well as to the accumulation in water and soils, thus leading to the exposure of the European population to HM levels causing a variety of adverse health effects. In this context, initial model applications by the EMEP MSC-East indicated significant gaps between modelled and measured ambient concentrations of almost all key metals. While model uncertainties are still significant, these gaps are to a large extent likely to stem from considerable underestimations of anthropogenic emissions. On this basis, ESPREME set out to revisit official emission estimates of all key metals and in most cases, conduct own expert estimates based on known activity rates and emission factors. The bulk of this work was executed by NILU, supported by NILU Polska, IETU and IER at the University of Stuttgart.
5.2.1 Emissions of As, Cd, Cr, Ni, and Pb Two sets of emission data for As, Cd, Cr, Ni, and Pb were prepared within the EU ESPREME project for the reference year 2000, including:
- official emission data reported by national authorities in the European countries to the UN ECE LRTAP Convention through the EMEP program (Annex 1), and
- Emission experts estimates prepared by the ESPREME experts (Annex 2). The official data in Annex 1 contain also estimates prepared by the ESPREME emission experts for the countries that no EMEP data were available. These expert estimates are marked in a final column in tables presented in Annex 1. The major reason to develop another set of emission data within ESPREME has been the conclusion reached by dispersion modelling groups, including the ESPREME modellers that the official emission data for heavy metals in Europe, prepared by national emissions experts in various European countries are often underestimated. This conclusion is based on extensive comparisons of model results and measurement data and subsequent modelling attempts to derive ‘true’ emission source strengths by inverse modelling. It was pointed out by the EMEP and ESPREME modellers that the EMEP emission data for the above mentioned heavy metals seem incomplete in terms of reporting emissions from all major source categories, and sometimes inaccurate with regard to the emission factors used in these estimates. Therefore, it was decided within the ESPREME project that independent emission estimates should be prepared by the ESPREME emission experts in order to obtain more complete and accurate emission datasets for modelling, since the aim of ESPREME is to develop meaningful abatement strategies based on a willingness-to-pay assessment.
3 See http://espreme.ier.uni-stuttgart.de for detailed information on the ESPREME project
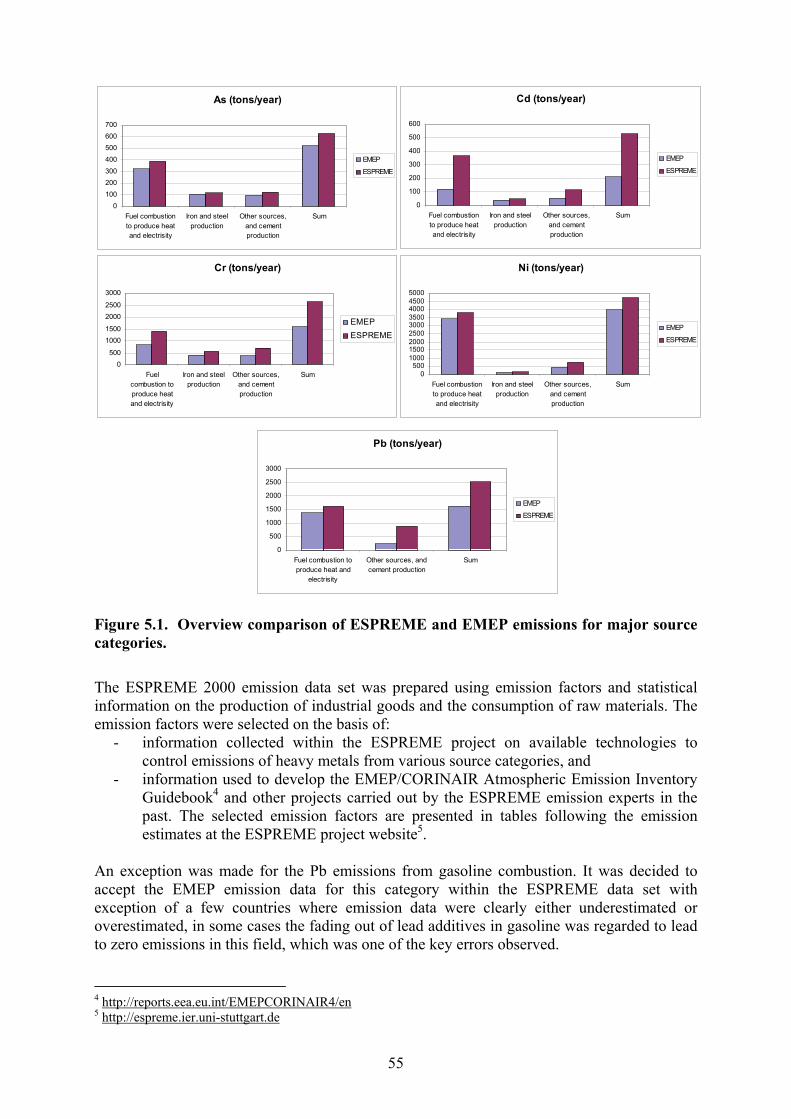
55
As (tons/year)
0100200300400500600700
Fuel combustionto produce heatand electrisity
Iron and steelproduction
Other sources,and cementproduction
Sum
EMEP
ESPREME
Cd (tons/year)
0
100
200
300
400
500
600
Fuel combustionto produce heatand electrisity
Iron and steelproduction
Other sources,and cementproduction
Sum
EMEP
ESPREME
Cr (tons/year)
0500
10001500
20002500
3000
Fuelcombustion toproduce heatand electrisity
Iron and steelproduction
Other sources,and cementproduction
Sum
EMEPESPREME
Ni (tons/year)
0500
100015002000250030003500400045005000
Fuel combustionto produce heatand electrisity
Iron and steelproduction
Other sources,and cementproduction
Sum
EMEP
ESPREME
Pb (tons/year)
0
500
1000
1500
2000
2500
3000
Fuel combustion toproduce heat and
electrisity
Other sources, andcement production
Sum
EMEP
ESPREME
Figure 5.1. Overview comparison of ESPREME and EMEP emissions for major source categories.
The ESPREME 2000 emission data set was prepared using emission factors and statistical information on the production of industrial goods and the consumption of raw materials. The emission factors were selected on the basis of:
- information collected within the ESPREME project on available technologies to control emissions of heavy metals from various source categories, and
- information used to develop the EMEP/CORINAIR Atmospheric Emission Inventory Guidebook4 and other projects carried out by the ESPREME emission experts in the past. The selected emission factors are presented in tables following the emission estimates at the ESPREME project website5.
An exception was made for the Pb emissions from gasoline combustion. It was decided to accept the EMEP emission data for this category within the ESPREME data set with exception of a few countries where emission data were clearly either underestimated or overestimated, in some cases the fading out of lead additives in gasoline was regarded to lead to zero emissions in this field, which was one of the key errors observed.
4 http://reports.eea.eu.int/EMEPCORINAIR4/en 5 http://espreme.ier.uni-stuttgart.de
56
The information on emissions from non-ferrous metal production, and waste incineration was also accepted from the EMEP data sets. Emission factors used by national emission experts to calculate the emissions from these source categories were observed to be within the ranges of emissions factors proposed in the emission factor guidebooks. Statistical data used in the estimates are available from various international and national statistical yearbooks. The basis for ESPREME estimates were, however, data produced by the PRIMES model. This model is used to generate information needed within the CAFÉ program. The use of PRIMES within ESPREME was required to build future scenarios for the year 2010 on the same assumptions and projections that were used in the CAFÉ work of the European Commission. A comparison of the official datasets for emissions of As, Cd, Cr, Ni, and Pb with the ESPREME estimates is shown in Figure 5.1 for emissions from fuel combustion, iron and steel production, other sources, and totals. The largest difference (a factor of more than 2) for totals was noted for Cd. The official Cd emissions from fuel combustion in utility boilers, industrial furnaces and residential and commercial units seem to be underestimated by a factor of more than 3. These emissions from other sources in sets of official data are indicated by a factor of more than 2.2. This indicates that the official data for Cd emissions are most likely incomplete with respect to the inclusion of all important sources of these emissions. The emissions of Cr in the official data sets are underestimated by a factor ranging from 1.4 to 1.9 depending on the source category. Low emission factors for fuel combustion and iron and steel production, and missing sources within the category Other sources are the main reasons for this underestimation. Emissions of As, Ni, and Pb are generally underestimated in the official datasets by factors ranging from 1.1 to 1.9, exept for Pb emissions from Other sources, which is likely by a factor of 3.6. This indicates a major omission of important Pb sources in this category. A source-sector analysis has been prepared taking into account the ESPREME emission data set. The source-sector analysis is presented in Table 5.1, where the percentage contribution of each sector to the total emissions are in brackets. Combustion of fuels in stationary sources was the main emission source for As, Cd, Cr, and Ni in Europe in 2000 (more than a 50% of the total anthropogenic emissions), while combustion of gasoline remains to be the main source of for Pb emissions overall. Coal combustion in large combustion plants (LCPs) contributed about 18 % to the total As emissions from anthropogenic sources in Europe in the year 2000, and another 17 % came from coal combustion in industrial boilers and small residential units. These contributions are 17 %, 17 % for Cd, and 15 % and 24 % for Cr. Oil combustion was the main emission source of Ni, in particular oil combustion in industrial boilers and residential units alone contributed as much as 55 % to the total anthropogenic emissions of this element in Europe in 2000. It should be added that oil combustion in industrial boilers and residential units contributed substantially also to the total As and Cd total anthropogenic emissions, with 15 % and 26 %, respectively. More than a half of the anthropogenic emissions of Pb in Europe in 2000 stems from the combustion of gasoline. One should be aware of the fact that there are Pb emissions also during the combustion of so called unleaded gasoline. This type of gasoline is defined as the

57
gasoline without lead additives. However, there is lead as an impurity in the gasoline due to the lead content of crude oil. It was assumed that the Pb content in unleaded gasoline is 15 mg/l. It was also assumed that 75 % of lead in gasoline is emitted to the atmosphere during the combustion process. Iron and steel production, cement production and high-temperature non-ferrous metal manufacturing are the three main industrial processes emitting all 5 heavy metals, particularly the two former industries. The contribution of emissions from these categories to the total anthropogenic emissions in Europe varies from 37 % for As to 11 % for Ni. Emissions of studied heavy metals from other sources, including waste incineration, contributed to the total anthropogenic emissions in Europe from 3 % for Pb to 14 % for Cr. Therefore, it is important to conclude that the major anthropogenic sources of As, Cd, Cr, Ni, and Pb emissions in Europe in the year 2000 included combustion of coal and oil in utility furnaces, industrial boilers, and residential units, and iron and steel production, and cement production.
Table 5.1. Contribution from various sources to the ESPREME HMs total estimates (Unit: Mg/Year (%)).
EMEP ESPREME EMEP ESPREME EMEP ESPREME EMEP ESPREME EMEP ESPREME
1. Fuel combustion to produce heat and electricity 322 (49) 391(51) 119 (44) 367 (62) 825 (50) 1394 (51) 3403 (85) 3795 (79) 1377 (13) 1623 (12)
2. Non ferrous metal 132 (20) 132 (17) 52 (19) 52 (9) 54 (3) 54 (2) 49 (1) 49 (1) 1471 (13) 1471 (10)
3. Iron and steel production 106 (16) 114 (15) 37 (14) 46 (8) 409 (25) 571 (21) 106 (3) 171 (4) 0 (0) 2282 (16)
4. Waste disposal 2 (0) 2 (0) 9 (3) 9 (2) 0 (0) 0 (0) 13 (0) 13 (0) 116 (1) 116 (1)
5. Cement procuction and othe sources 92 (14) 124 (16) 52 (19) 116 (20) 370 (22) 692 (26) 447 (11) 769 (16) 247 (2) 892 (6)
6. Gasoline combustion 7712 (71) 7712 (55)
Sum 654 763 269 590 1658 2711 4017 4797 10923 14096
Ni PbAs Cd Cr
5.2.2 Emissions of Hg Two approaches were used for calculation of the European anthropogenic emissions of mercury in the reference year 2000 within the ESPREME project:
- collection of emission data from countries where such data were estimated by national emission experts, and
- estimates of emissions on the basis of emission factors and statistical data on the production of industrial goods and/or the consumption of raw materials. These estimates were carried out for the countries where national estimates were not available.
National estimates of anthropogenic emissions of mercury were provided by national experts from 29 countries in Europe. The reporting of these data has been done within the UN ECE LRTAP convention. Emission experts in other countries might have also estimated their national emissions of mercury but these data were not available to ESPREME. The emission data received from national authorities have then been checked by ESPREME emission experts for completeness and comparability. The completeness of data regarded mainly the inclusion of all major source categories which may emit mercury to the atmosphere. No major omissions have been detected in the reported data. All major source categories in all countries reporting the emission data were included in this reporting.

58
It is very difficult to verify the data obtained from national authorities in various countries. The following approach has been undertaken: Information on emissions of mercury from various sources was brought together with statistics on the production of industrial goods and/ or the consumption of raw materials, and these two sets of data were used to calculate emission factors. Emission factors calculated in such way were then compared with emission factors reported in the Joint EMEP/ CORINAIR Atmospheric Emission Inventory Guidebook (http://reports.eea.eu.int/EMEPCORINAIR3/en/ ) (UN ECE, 2000). In a majority of the cases, emission factors estimated on the basis of national emission data reported to the project were within the range of emission factors proposed in the Guidebook. Emission estimates have been performed within ESPREME for the countries where national emission data were not available. These estimates were performed using the information on: – Statistical information on the consumption of raw materials and the production of
industrial goods in 2000, using the following references for: - energy production: UN Statistical Yearbook, - non-ferrous metal production: the World Bureau of Metal Statistics and Industrial
Commodity Statistics Yearbook, - iron and steel production and cement production: UN Statistical Yearbook, and - waste disposal: UNEP Environmental Data Report, and the OECD Environmental
Data Compendium, and – Emission factors of Hg, estimated for the UN ECE Task Force on Emission Inventories in
the period from 1997 through 1999 and presented in the Atmospheric Emission Inventory Guidebook (http://reports.eea.eu.int/EMEPCORINAIR4/en).
Emission factors were multiplied by statistical data in order to obtain emission data.
Hg emission data are presented in Annex 1. The emission data received from national experts are marked in these data. Combustion of coal in power plants and residential furnaces generates about half of the European emissions in the year 2000 (approx. 239 t). Coal combustion is followed by the production of caustic soda using Hg cell process (17 %). Major sources of mercury emissions within the mercury cell process include: by-product hydrogen stream, end box ventilation air, and cell room ventilation air. This technology is currently being replaced by other caustic soda production technologies and further reductions of Hg emissions can be expected in this context. The third category on the list of the largest Hg emitters in Europe is cement production (about 13 %). Information on emissions of various chemical forms is also presented in Annex 1. The major chemical form of mercury emitted from the anthropogenic sources in Europe to the atmosphere is gaseous elemental mercury, contributing with about 146 tonnes in 2000 (about 61 %). Gaseous bivalent mercury contributed about 76 tonnes (about 32 % of the total), and the emissions of Hg on particles were about 17 tonnes (7 % of the total). Gaseous elemental mercury contributes the most to the total emissions of Hg from all source categories, except for waste disposal. In the latter case, the contribution of gaseous bivalent mercury presents the highest share. This is probably because of the high content of chlorine in wastes thus resulting in the formation of chlorides of mercury.
59
5.2.3 Wind re-suspension of heavy metals Other processes responsible for input of heavy metals to the atmosphere are natural emissions and re-suspension of historical depositions of these pollutants accumulated in soil and water bodies. Indeed, relatively high natural content of such metals as Cr and Ni in the Earth’s crust can account for significant contribution of emission from natural sources. Besides, elevated airborne depositions of some metals like Pb comparing to the pre-industrial period were recorded in ice cores, freshwater sediments and peat bogs for the last century (e.g. Candelone and Hong, 1995; Farmer et al., 1997; Coggins et al., 2006). Re-suspension of the accumulated material can also significantly contribute to emission of these metals to the atmosphere. These unaccounted processes can be also partly responsible for inconsistencies between measured and modelled ambient concentrations of heavy metals [Ilyin and Travnikov, 2005]. Following recommendations of the EMEP/TFMM Workshop on the review of the EMEP HM and POP models [TFMM Workshop minutes, 2005] MSC-E within a framework of the ESPREME project has developed a tentative parameterisation for the wind re-suspension of particle-bound heavy metals (Pb, Cd, As, Cr, Ni) from soil and seawater. Pilot calculations evaluating contribution of the wind re-suspension to total emission of heavy metals to the atmosphere are presented below. The process of wind erosion and suspension of dust aerosol from the ground was incorporated to the MSCE-HM model as combination of two major processes: saltation and sandblasting. The first process (saltation) presents horizontal movement of large soil aggregates driven by wind stress. Indeed, in natural soils small particles (below 20 μm) never occur in free state, but are embedded in larger soil aggregates by cohesion forces (up to a few centimeters). These aggregates are too heavy to be directly suspended by wind in usual conditions. Instead, they are moved by wind stress close to the surface jumping from one place to another. When the saltating aggregates impact the ground they can eject much smaller particles (few micrometers), which can be easily suspended by wind and transported far away from the source region. This process is called the sandblasting. Parameterization of mentioned above processes are based on approaches applied in contemporary mineral dust production models [e.g. Gomes et al., 2003; Zender et al., 2003; Gong et al., 2003]. The dust suspension was estimated for the following types of non-vegetated land cover: – deserts and bare soils; – agricultural soils (during the cultivation period); – urban areas. For estimation of heavy metal emission with dust suspension from soils detailed measurement data on heavy metals concentration in topsoil from the Geochemical Atlas of Europe developed under the auspices of the Forum of European Geological Surveys (FOREGS) [www.gtk.fi/publ/foregsatlas/] were used. The data cover most parts of Europe (excluding Eastern European countries) with more than 2000 measurement sites. The kriging interpolation was applied to obtain spatial distribution of heavy metal concentration in soil. For Eastern Europe as well as for the rest of the model domain (Africa, Asia) we used default concentration values based on the literature data.

60
In order to estimate heavy metal re-suspension from seawater with sea-salt aerosol the empirical Gong-Monahan parameterization was applied [Gong, 2003] along with the emission factors derived from the literature. More detailed description of heavy metal re-suspension from soil and seawater is available in [Gusev et al., 2006]. Aggregated values of estimated re-suspension of Pb from soil in different European countries are presented in Figure 5.2a along with total anthropogenic emissions based on ESPREME data. As seen the estimated contribution of Pb re-suspension is comparable or even higher than anthropogenic emissions in such countries as Italy, France, Germany, Greece, Spain, the United Kingdom etc., where observed concentration of this metal in soil considerably exceeds its natural content in the Earth’s crust (Figure 5.2b). The most probable reason for this is long-term accumulation of historical depositions.
0
500
1000
1500
2000
2500
3000
Italy
Russia
France
German
y
Ukraine
Spain UK
Greece
Romania
Pola
nd
Turkey
Belgium
Czech
Rep
.
Bulgari
a
Portug
al
Netherla
nds
Serbia&
Mont.
Hungary
Bosnia
& Herz
.
Sweden
Kazakh
stan
Belarus
Irelan
d
Switzerl
and
Tota
l em
issi
on, t
/y
Re-suspensionAnthropogenic (ESPREME)
0
15
30
45
60
Italy
Russia
France
German
y
Ukraine
Spain UK
Greece
Romania
Pola
nd
Turkey
Belgium
Czech
Rep
.
Bulgari
a
Portug
al
Netherla
nds
Serbia&Mon
t.
Hungary
Bosnia
& Herz
.
Sweden
Kazakh
stan
Belarus
Irelan
d
Switzerl
and
Soil
conc
entra
tion,
mg/
kg Top soilEarth crust
Figure 5.2. Lead total anthropogenic emission (ESPREME data) and re-suspension from soil in Europe (a) and average topsoil concentration in some European countries Contrary to Pb, re-suspension of Cd from soil insignificantly contributes to total emission of this metal in most European countries (Figure 5.3a). The reason for this is the relatively low cadmium concentrations measured in European soils. Only in a few countries of Europe (Italy, France, Belgium, Greece etc.) mean topsoil concentration noticeably exceeds cadmium natural content in the crust (Figure 5.3b).
(a)
(b)

61
0
20
40
60
80
German
y
Russia
Italy
France
Ukraine
Pola
nd UKSpa
in
Turkey
Belgium
Romania
Bulgari
a
Czech
Rep
.
Greece
Netherla
nds
Portug
al
Hungary
Sweden
Austria
Slovak
ia
Finlan
d
Switzerl
and
Serbia&
Mont.
Irelan
d
Tota
l em
issi
on, t
/yRe-suspensionAnthropogenic (ESPREME)
0.0
0.2
0.4
0.6
0.8
1.0
German
y
Russia
Italy
France
Ukraine
Pola
nd UKSpa
in
Turkey
Belgium
Romania
Bulgari
a
Czech
Rep
.
Greece
Netherla
nds
Portug
al
Hungary
Sweden
Austria
Slovak
ia
Finlan
d
Switzerl
and
Serbia&
Mont.
Irelan
d
Soil
conc
entra
tion,
mg/
kg Top soilEarth crust
Figure 5.3. Cadmium total anthropogenic emission (ESPREME data) and re-suspension from soil in Europe (a) and average topsoil concentration in some European countries (b). The results presented above can hardly be considered as final taking into account essential uncertainties in current knowledge of the re-suspension process including parameterization of wind erosion, available data on soil properties, enrichment of mineral dust with heavy metals etc.
5.2.4 Evaluation of HM modelling results based on official and ESPREME emission data In order to compare modelled pollution levels based on official and ESPREME emission data one-year calculations of heavy metal transport and deposition in Europe were performed with the MSCE-HM model for the year 2000. Detailed description of the Eulerian 3D chemical transport model MSCE-HM is available in [Travnikov and Ilyin, 2005]. The model formulation and performance was thoroughly evaluated within the EMEP/TFMM Workshop on the model review, which concluded that “the MSCE-HM model is suitable for the evaluation of the long-range transboundary transport and deposition of HMs in Europe” [TFMM Workshop minutes, 2005]. Comparison of modelled results based on different emission estimates with observations is illustrated in Figure 5.4 and Figure 5.5. Figure 5.4 shows calculated vs. observed Pb concentration in precipitation for the official emissions data (Figure 5.4a), the ESPREME estimates (Figure 5.4b) and the ESPREME data supplemented with the wind re-suspension. As seen from the figure the modelling results based on official emissions data demonstrate significant (up to 65%) underestimation of the observed values, whereas correlation between modelled and measured concentrations is satisfactory. Using the ESPREME emission data
(a)
(b)

62
results in considerably better correspondence between calculated values and observations. And finally, the best agreement (with only 20% discrepancy) is achieved when combination of the ESPREME data and the wind re-suspension is used.
Cmod = 0.35 Cobs
Rcorr = 0.7
0
1
2
3
4
0 1 2 3 4Observed, μg/L
Mod
el, μg
/L
Cmod = 0.52 Cobs
Rcorr = 0.66
0
1
2
3
4
0 1 2 3 4Observed, μg/L
Mod
el, μg
/L
Cmod = 0.79 Cobs
Rcorr = 0.62
0
1
2
3
4
0 1 2 3 4Observed, μg/L
Mod
el, μg
/L
Figure 5.4. Comparison of observed Pb concentration in precipitation with modelling results based on official emissions data (a), ESPREME data (b), and ESPREME data along with re-suspension (c). Solid line depicts the linear regression, dashed line – 1:1 ratio of modelled to observed values The model underprediction of measured concentration in precipitation is even more noticeable for Cd (up to 75%) when the official emissions are used (Figure 5.5a). As was mentioned previously, the discrepancy between the official data and the ESPREME estimates is largest for this metal (up to a factor of 2). Therefore utilizing the ESPREME estimates leads to essential improvement of the modelling results in comparison with observations (Figure 5.5b). However, the model-to-measurement correlation somewhat decreases, possibly, because of uncertainties of the spatial distribution of emissions. Addition of the re-suspension slightly improves the comparison since, according to the current estimates, contribution this process for Cd is insignificant comparing to anthropogenic emissions.
Cmod = 0.26 Cobs
Rcorr = 0.76
0.00
0.05
0.10
0.15
0.20
0.00 0.05 0.10 0.15 0.20Observed, μg/L
Mod
el, μg
/L
Cmod = 0.64 Cobs
Rcorr = 0.56
0.00
0.05
0.10
0.15
0.20
0.00 0.05 0.10 0.15 0.20Observed, μg/L
Mod
el, μg
/L
Cmod = 0.71 Cobs
Rcorr = 0.53
0.00
0.05
0.10
0.15
0.20
0.00 0.05 0.10 0.15 0.20Observed, μg/L
Mod
el, μg
/L
Figure 5.5. Comparison of observed Cd concentration in precipitation with modelling results based on official emissions data (a), ESPREME data (b), and ESPREME data along with re-suspension (c). Solid line depicts the linear regression, dashed line – 1:1 ratio of modelled to observed values
(a) (b) (c)
(a) (b) (c)
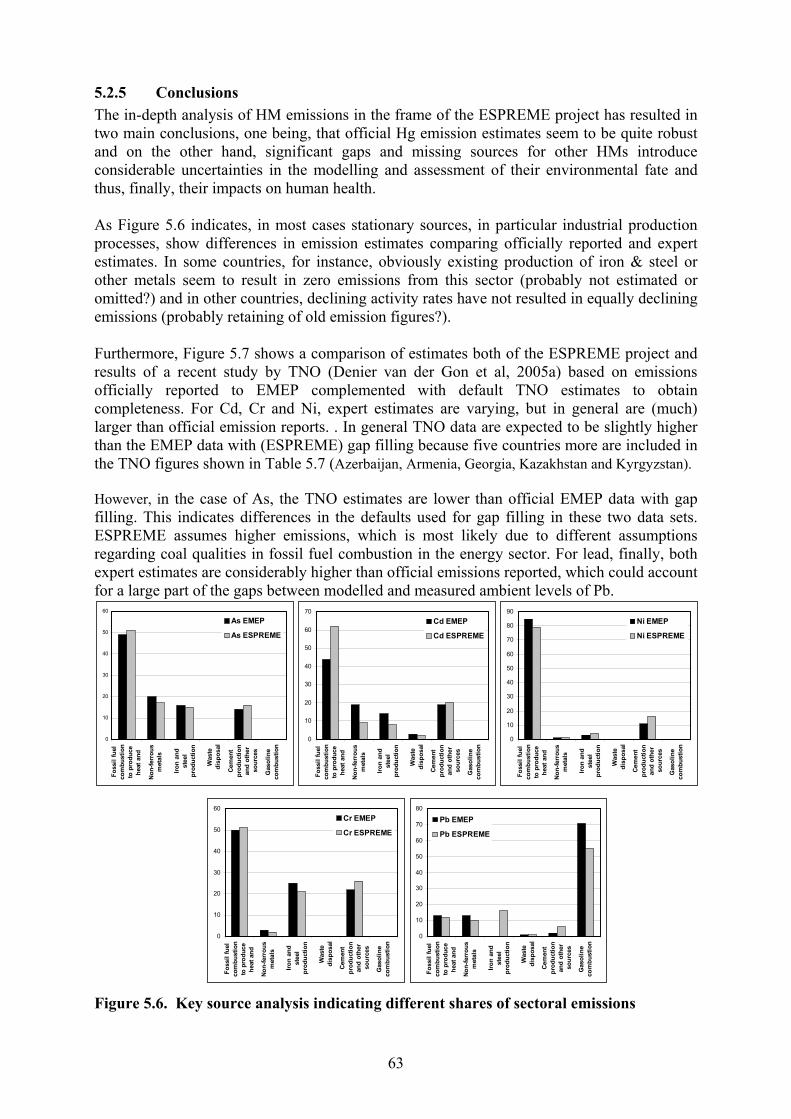
63
5.2.5 Conclusions The in-depth analysis of HM emissions in the frame of the ESPREME project has resulted in two main conclusions, one being, that official Hg emission estimates seem to be quite robust and on the other hand, significant gaps and missing sources for other HMs introduce considerable uncertainties in the modelling and assessment of their environmental fate and thus, finally, their impacts on human health. As Figure 5.6 indicates, in most cases stationary sources, in particular industrial production processes, show differences in emission estimates comparing officially reported and expert estimates. In some countries, for instance, obviously existing production of iron & steel or other metals seem to result in zero emissions from this sector (probably not estimated or omitted?) and in other countries, declining activity rates have not resulted in equally declining emissions (probably retaining of old emission figures?). Furthermore, Figure 5.7 shows a comparison of estimates both of the ESPREME project and results of a recent study by TNO (Denier van der Gon et al, 2005a) based on emissions officially reported to EMEP complemented with default TNO estimates to obtain completeness. For Cd, Cr and Ni, expert estimates are varying, but in general are (much) larger than official emission reports. . In general TNO data are expected to be slightly higher than the EMEP data with (ESPREME) gap filling because five countries more are included in the TNO figures shown in Table 5.7 (Azerbaijan, Armenia, Georgia, Kazakhstan and Kyrgyzstan). However, in the case of As, the TNO estimates are lower than official EMEP data with gap filling. This indicates differences in the defaults used for gap filling in these two data sets. ESPREME assumes higher emissions, which is most likely due to different assumptions regarding coal qualities in fossil fuel combustion in the energy sector. For lead, finally, both expert estimates are considerably higher than official emissions reported, which could account for a large part of the gaps between modelled and measured ambient levels of Pb.
0
10
20
30
40
50
60
Foss
il fu
elco
mbu
stio
nto
pro
duce
heat
and
Non
-ferr
ous
met
als
Iron
and
stee
lpr
oduc
tion
Was
tedi
spos
al
Cem
ent
prod
uctio
nan
d ot
her
sour
ces
Gas
olin
eco
mbu
stio
n
As EMEP
As ESPREME
0
10
20
30
40
50
60
70
Foss
il fu
elco
mbu
stio
nto
pro
duce
heat
and
Non-
ferr
ous
met
als
Iron
and
stee
lpr
oduc
tion
Was
tedi
spos
al
Cem
ent
prod
uctio
nan
d ot
her
sour
ces
Gas
olin
eco
mbu
stio
n
Cd EMEP
Cd ESPREME
0
10
20
30
40
50
60
Foss
il fu
elco
mbu
stio
nto
pro
duce
heat
and
Non-
ferr
ous
met
als
Iron
and
stee
lpr
oduc
tion
Was
tedi
spos
al
Cem
ent
prod
uctio
nan
d ot
her
sour
ces
Gas
olin
eco
mbu
stio
n
Cr EMEP
Cr ESPREME
0
10
20
30
40
50
60
70
80
90
Foss
il fu
elco
mbu
stio
nto
pro
duce
heat
and
Non-
ferr
ous
met
als
Iron
and
stee
lpr
oduc
tion
Was
tedi
spos
al
Cem
ent
prod
uctio
nan
d ot
her
sour
ces
Gas
olin
eco
mbu
stio
n
Ni EMEP
Ni ESPREME
0
10
20
30
40
50
60
70
80
Foss
il fu
elco
mbu
stio
nto
pro
duce
heat
and
Non-
ferr
ous
met
als
Iron
and
stee
lpr
oduc
tion
Was
tedi
spos
al
Cem
ent
prod
uctio
nan
d ot
her
sour
ces
Gas
olin
eco
mbu
stio
n
Pb EMEP
Pb ESPREME
Figure 5.6. Key source analysis indicating different shares of sectoral emissions
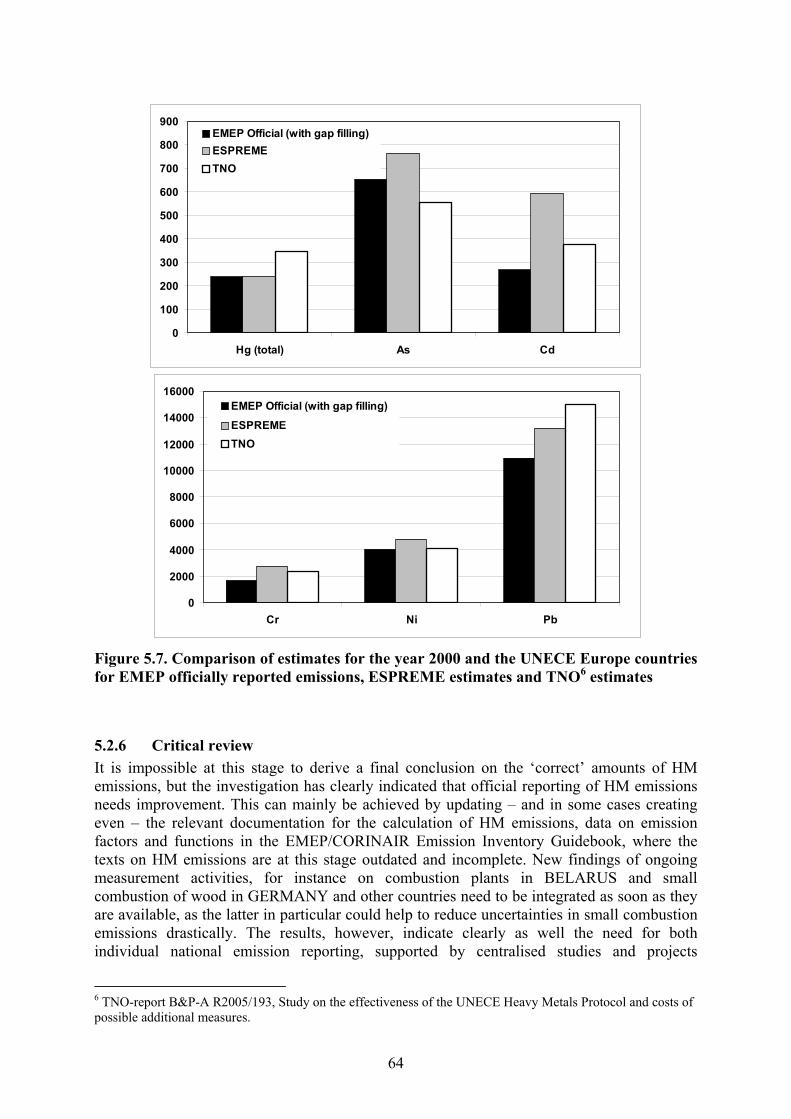
64
0
100
200
300
400
500
600
700
800
900
Hg (total) As Cd
EMEP Official (with gap filling)ESPREMETNO
0
2000
4000
6000
8000
10000
12000
14000
16000
Cr Ni Pb
EMEP Official (with gap filling)
ESPREMETNO
Figure 5.7. Comparison of estimates for the year 2000 and the UNECE Europe countries for EMEP officially reported emissions, ESPREME estimates and TNO6 estimates
5.2.6 Critical review It is impossible at this stage to derive a final conclusion on the ‘correct’ amounts of HM emissions, but the investigation has clearly indicated that official reporting of HM emissions needs improvement. This can mainly be achieved by updating – and in some cases creating even – the relevant documentation for the calculation of HM emissions, data on emission factors and functions in the EMEP/CORINAIR Emission Inventory Guidebook, where the texts on HM emissions are at this stage outdated and incomplete. New findings of ongoing measurement activities, for instance on combustion plants in BELARUS and small combustion of wood in GERMANY and other countries need to be integrated as soon as they are available, as the latter in particular could help to reduce uncertainties in small combustion emissions drastically. The results, however, indicate clearly as well the need for both individual national emission reporting, supported by centralised studies and projects
6 TNO-report B&P-A R2005/193, Study on the effectiveness of the UNECE Heavy Metals Protocol and costs of possible additional measures.

65
supporting the continuous improvement of the knowledge on emission factors, activities and parameters for the validation and verification of inventories. With regard to Figure 5.7, a note of caution has to be added, as the comparison is made with keeping in mind, that the EMEP officially reported emissions were gap-filled with EMEP expert estimates (see http://webdab.emep.int for access to data), hence differences between the TNO estimates (based on official emission data submitted) and the thus enhanced EMEP dataset occur. The only way to analyze both the differences between expert estimates and the reasons for expert estimates arriving at higher emissions in most cases (e.g. missing sources, usage of outdated emission factors etc.) would be to conduct an in-depth inventory review. At this stage, neither funding nor time is available to achieve this, but it is important to note, that even this coarse investigation has identified a clear need for a thorough assessment of HM emissions by country and source sector to develop emission datasets for modelling that are complete, comprehensive and robust enough to evaluate model results vs. measured concentrations and depositions of HM to support the development of HM abatement strategies. Both the TNO and the ESPREME review of currently available emission data of priority metals have contributed to a better understanding of the gaps and the identification of the next steps in this process. Along with an improvement of the anthropogenic emissions inventory heavy metal emission from natural sources and re-suspension of historical depositions should be further investigated since their contribution to the total emission can be significant. Particularly, this concerns the dust suspension processes, heavy metal accumulation in soil and other compartments, dynamical redistribution between the surface and subsoil layers, and availability for the wind erosion.
5.3 PERSISTENT ORGANIC POLLUTANTS
5.3.1 Emissions of Persistent Organic Pollutants in 2000 and projected emission data for 2010-2020 The starting point of the POP inventory for the year 2000 by Denier van der Gon et al. (2005b) are the submissions of emission data from the Parties to the Convention on LRTAP. For the countries, sources or compounds lacking in official submissions, default emission estimates have been prepared and applied to complete the inventory (Table 5.2). Several POPs are thought to be no longer emitted in Europe and these substances (aldrin, chlordane, chlordecone, dieldrin, endrin, hexabromo-biphenyl, mirex, toxaphene, DDT, and heptachlor) are not further addressed. An overview of the emission sources considered in the study by POP is presented in Annex 3. It is essential to have all relevant source categories covered for all countries to have comparable emission data. Therefore, only official data which have a split at the sector level (e.g. NFR level 1 or SNAP level 1) are used in the compilation of Table 5.2 because otherwise no indication of completeness of the inventory can be obtained. The origin of the national emission data in Table 5.2 is indicated by the formatting. A national total emission reported in Table 5.2 may consist of a mix of official data and TNO expert estimates. If the national official emission data do not cover all relevant source categories they have been complemented by TNO default estimates to achieve completeness. The data compilation in Table 5.2 indicates that official data cover PCDD/F emissions relatively well but for all other substances the coverage is poor. Again, as outlined above, official emission data reported at the national level only (e.g., no sectoral split provided) are

66
not considered because no assessment of the completeness of such a national estimate could be made. Please note that this does not necessarily mean that the national submission truly was incomplete, it was just not possible to clearly ascertain this. Furthermore, emissions no longer occurring (e.g. HCH) are often not reported or only at the national level and iii) countries often report PAH as a group (e.g., Bornheff-6) but not the individual PAH indicator compounds requested by the POP protocol. So, at first glance Table 5.2 paints a somewhat bleaker picture of the coverage of national emission reporting than fair. Nevertheless, a first clear conclusion from Table 5.2 is that a major improvement in POP emission reporting by countries can be made. The source categories identified in Denier van der Gon et al. 2005b and their respective default emission factors provide the means to make a first step and should subsequently be improved by national experts and/or source-specific local knowledge. Again, it is of utmost importance that official inventories provide insight in the sources covered by the reporting to assess completeness of the reporting and maintain comparability with other national reporting. The aggregated 1990, 2000 and projected emissions for the years 2010 and 2020 for UNECE-Europe are presented in Table 5.3. The presented 1990 emissions are conservative estimates and may be underestimated. For a description of the limitations of the projection data and the compatibility of the 1990 and 2000 data we refer to Denier van der Gon et al. (2005b, 2006). The comparison of the 1990 and 2000 emission data indicates that the emissions of PCDD/F and HCH decreased with 10% and 82%, respectively (Table 5.3). PCB emissions change little between 1990 and 2000. Remarkably, HCB emissions increase strongly going from 1990 – 2000. However, this is at least partly an artefact because unlike the inventory by Denier van der Gon et al. (2005b), Berdowski et al. (1997) did not include production of secondary Aluminium as a HCB source. It is anticipated that the increase in HCB from 1990 – 2000 is not a real trend. Compared to the period 1990-2000, over the next decade (2000-2010) and current ratification a large emission reduction is foreseen for PCB (-80%), HCB (-56%) and to a lesser extend also for PCDD/F (-27%). Full implementation of the POP protocol by all UNECE-Europe countries brings about considerable POP emission reductions with the exception of HCH. Important observations from the projected POP emissions in UNECE Europe for 2010, 2015 and 2020 following two policy scenarios (Table 5.3) are:
- HCB emissions are reduced from 2000 to 2010 but implementation of the POP Protocol by all countries results in only limited further reduction.
- HCH emissions do not change much over time because HCH use has been reduced already before 2000 and other measures are not affecting the currently allowed use of HCH.
- PCB emissions strongly decline from 2000 to 2010. If all countries implement the POP Protocol emissions will decline further and emission reductions that is otherwise achieved by 2020 may already be reached by 2010.
- Dioxin and furan emissions decline slightly under current legislation and autonomous measures but considerable additional reduction would result from full implementation of the POP Protocol.
- PAH indicator compound emissions are only slightly reduced going from 2000 to 2010 but a considerable further reduction (30-50%) is possible if the POP Protocol is implemented by all countries.

67
Table 5.2. National emissionsa) of POPs and PAH indicator compounds in UNECE-Europe in 2000 (Denier van der Gon et al. 2006). Country ISO3 HCB HCH PCB PCDD/F PAH indicator compounds BaP BbF BkF Indeno kg/yr kg Teq/yr kg/yr Albania ALB 0 123 26 0.043 2646 3471 1166 1928Armenia ARM 0 0 405 0.047 1997 2609 896 1408Austria AUT 42 0 948 0.050 24436 30394 9781 18099Azerbaijan AZE 0 0 810 0.098 4207 5548 1918 3013Belgium BEL 28 167 3698 0.114 7518 6394 2161 5541Bulgaria BGR 54 0 229 0.233 7803 7843 3230 5179Bosnia-Herzegovina BIH 0 115 187 0.067 4799 6440 2707 5073Belarus BLR 0 0 1147 0.018 7188 9300 3050 6380Switzerland CHE 31 0 1154 0.017 2245 2925 871 1726Cyprus CYP 1 0 45 0.011 480 655 175 380Czech Republic CZE 202 0 2091 0.744 13644 13319 4389 12555Germany DEU 2870 0 29887 0.406 50944 56876 18411 38537Denmark DNK 162 0 695 0.078 2831 3740 1355 2074Spain ESP 6082 9962 5868 0.143 27335 36905 15811 19997Estonia EST 0 0 223 0.003 2427 3149 1022 1949Finland FIN 226 0 1917 0.031 10203 12318 4162 7157France FRA 1800 39859 13380 0.560 83458 103070 31964 61657United Kingdom GBR 595 30308 1643 0.346 6692 5938 3176 4268Georgia GEO 0 0 582 0.067 2981 3897 1307 2144Greece GRC 2 2431 168 0.279 6163 8099 2689 4613Croatia HRV 0 6983 135 0.109 2821 3711 1236 2116Hungary HUN 279 0 323 0.687 8582 10967 4729 6398Ireland IRL 0 0 49 0.030 2468 3128 759 3399Iceland ISL 0 0 34 0.002 398 457 280 175Italy ITA 2863 143856 3648 0.245 53145 63830 20483 37492Kazakhstan KAZ 1 0 1202 0.288 14473 19585 7146 10857Kyrgyzstan KGZ 1 0 244 0.062 4055 5338 1831 2887Lithuania LTU 0 0 406 0.088 2518 3225 945 2316Luxembourg LUX 0 0 68 0.010 514 644 93 429Latvia LVA 0 0 267 0.054 1790 2293 687 1629Rep.of Moldova MDA 66 0 194 0.004 510 602 296 1219Form. Yug. Rep. of Macedonia MKD 0 87 86 0.028 1176 1551 520 869Netherlands NLD 598 0 164 0.031 6175 5458 2175 4077Norway NOR 1273 0 275 0.034 11925 33618 30190 6630Poland POL 46 0 2265 0.334 37420 35066 9977 46101Portugal PRT 96 7729 385 0.844 10105 12929 3994 7386Romania ROM 14 1052 496 0.400 10960 10513 4585 7165Russia RUS 8 0 31016 2.732 301794 362098 196248 232801Slovak Republic SVK 1 0 133 0.146 4591 4010 1856 3214Slovenia SVN 0 0 143 0.027 1317 1719 536 1020Sweden SWE 152 0 1373 0.028 10364 11964 4143 7049Turkey TUR 2 11806 326 1.012 47399 59546 22155 39484Ukraine UKR 655 0 24436 1.022 94286 54052 30005 64001Federal Rep. of Yugoslavia YUG 0 510 552 0.172 8526 11242 4019 7789
UNECE-Europe Totalb) 18.2 255 133 11.7 907 1040 459 700a) Origin of national emission data; official emission data in bold, TNO expert estimates are shaded, mixed official data and expert estimates in italics. Detailed emission data by source category and fuel type are available upon request. b) Total emissions in tonnes/yr, PCDD/F in kg TEQ/yr

68
Table 5.3. Emissions of POP in UNECE Europe for 1990, 2000 and projected emissions for 2010, 2015 and 2020 following two policy scenarios (Tonnes/yr, PCDD/f in kg Teq/yr).
Year_policy HCB HCH PCB PCDD/F PAH indicator compounds
scenarioa) BaP BbF BkF Indeno
1990b) 8.0 1326 122 12.9 NA c) NA c) NA c) NA c)
2000 18.2 255 133 11.7 907 1040 459 700
2010_BL_CLE_CRP
OP 8.0 255 26.5 8.63 869 1006 434 657
2020_BL_CLE_CRP
OP 8.4 255 8.1 8.32 817 930 448 578
2010_BL_CLE_FIPO
P 1.2 255 9.4 4.29 682 803 246 566
2020_BL_CLE_FIPO
P 1.5 255 7.4 3.79 597 678 222 460 a) BL_CLE_CRPOP: Base Line scenario with Current LEgislation and Current Ratification of the UNECE POP Protocol; BL_CLE_FIPOP: Base Line scenario with Current LEgislation and Full Implementation of the UNECE POP Protocol. b) 1990 data taken from Berdowski et al. (1997) for indicative comparison. Countries not covered by
Berdowski et al. are represented by their year 2000 emissions c) NA = Not Available
The results show that full implementation (all UNECE-Europe countries) of the POP protocol would result in an important further reduction of HCB, PAHs and PCDD/F emissions and will effectively address the still remaining PCB emissions (Table 5.3). For PCB it should be noted that the autonomous replacement of PCB containing equipment which is incorporated in our scenario is an important cause of the strong reductions that are foreseen in the year 2010 and onwards. The POP Protocol is effective in addressing the still remaining emissions and full implementation of the POP Protocol is an important step in POP emission reduction. Only HCH emissions do not change much upon full implementation because HCH use has been reduced already before 2000 and other measures are not affecting the currently allowed use of HCH. A key source analysis of the projected emissions assuming full implementation of the UNECE POP Protocol identifies the remaining source strengths and a number of potential measures to achieve further reduction of POP can be suggested (Denier van der Gon et al. 2005). Examples of suggested measures are the use of cleaner fuels and/or ban of specific fuels in small combustion units (Capacity < 5 MWth) (addressing PCDD/F, PAH), replacement of chlorine and chlorine compound additives in the Secondary aluminium
69
production (addressing HCB), further tightening of existing limit value for incineration of hazardous waste (addressing PCCD/F) and further restriction of the use of Lindane. It is important to note that inventory methodologies for POP are under constant development and are subject to a considerable uncertainty; any observed trend may well be an artefact caused by an improved methodology rather than actual changes in emissions. Important improvements in the quality of the POP emission inventories can be made through more detailed country usage data (e.g., for pesticides) and determination of emission factors. The present emission estimation methodologies are often too simple and appropriate emission factor data are too limited.
5.3.2 Uncertainties in Dioxin Emission Estimates for Central Europe Pulles et al. (2005; 2006) use an improved emission inventory model to assess the uncertainties in emissions of dioxins and furans associated with both knowledge on the exact technologies and processes used and with the uncertainties of both activity data and emission factors. The annual total emissions for the year 2000 in thirteen countries in Central and Eastern Europe can be estimated with 90 % confidence within a range that is about a factor of 2 to 3 lower to a factor of 3 to 5 higher than a point value obtained from a more classical approach. The total emissions of dioxins and furans in the thirteen countries in this study are estimated to be 3.3 kg I-TEQ per annum, applying the information obtained from the participating countries where-ever possible and applying the “best” choice of emission factors from the UNEP Chemicals Toolkit as determined basically by means of expert judgement (Table 5.4). The importance of the selection of emission factors is confirmed by the Monte Carlo analysis taking into account the uncertainties in all parameters and variables, used in the emission inventory. The 90 % confidence interval for the total emissions in the area is as wide as 1.2 to 7.4 kg I-TEQ per annum (Table 5.5). The highest contributions to this uncertainty range are due to the uncertainties in emission factors for incineration of hospital waste, open burning of domestic waste and iron sintering (Pulles et al., 2006)

70
Table 5.4. Dioxin emissions by sector in 13 countries as estimated by Pulles et al (2005). Numbers are rounded to two significant digits (in g I-TEQ for the year 2000).
Country
Waste
incineration and burning
Metal industry
Cem
ent production
Preservation of w
ood and accidental fires
Residential
heating
Other
combustion
Other sources
Country T
otal
Bulgaria 150 56 11 16 4 3 45 290 Cyprus 4.2 0.01 0.84 1.4 0.06 0.09 0 6.6 Czech Republic 37 200 24 20 21 7.8 13 320 Estonia 0.52 0 0.24 2.8 1.5 3.5 0.12 8.7 Hungary 33 27 2.1 20 16 18 6 120 Latvia 8.1 0 0.05 4.8 3.1 1.5 0.14 18 Lithuania 37 0 0.39 7 2.5 0.95 0.88 48 Malta 2.9 0 0 0.78 0.1 0.06 0.05 3.9 Poland 310 110 0.98 78 210 32 47 790 Romania 270 95 29 44 9.2 8.7 32 490 Slovak Republic 53 80 15 11 2.8 2.3 14 180 Slovenia 17 5.6 5 4 1.2 2 1.5 36 Turkey 470 130 170 130 26 10 29 960 Sector total 1 400 700 250 340 300 90 190 3 300 Share in total 43% 21% 8% 11% 9% 3% 6%
Table 5.5. National total emissions (g I-TEQ/year): point estimate and boundaries of the 90-% confidence intervals. The percentiles are not additive, so the value for the 13 countries does not equal the sum of the values for each country separately.
point estimate 5 %-ile 95 %-ile Bulgaria 290 66 790 Cyprus 6.6 0.8 20 Czech Republic 320 72 880 Estonia 8.7 1.6 25 Hungary 120 35 300 Latvia 18 2.4 54 Lithuania 48 7.1 140 Malta 3.9 0.34 13 Poland 790 220 2 000 Romania 490 110 1 300 Slovak Republic 180 36 500 Slovenia 36 8.2 97 Turkey 960 190 2 600 13 country total 3 300 1 200 7 400
Source: Pulles et al. (2006)
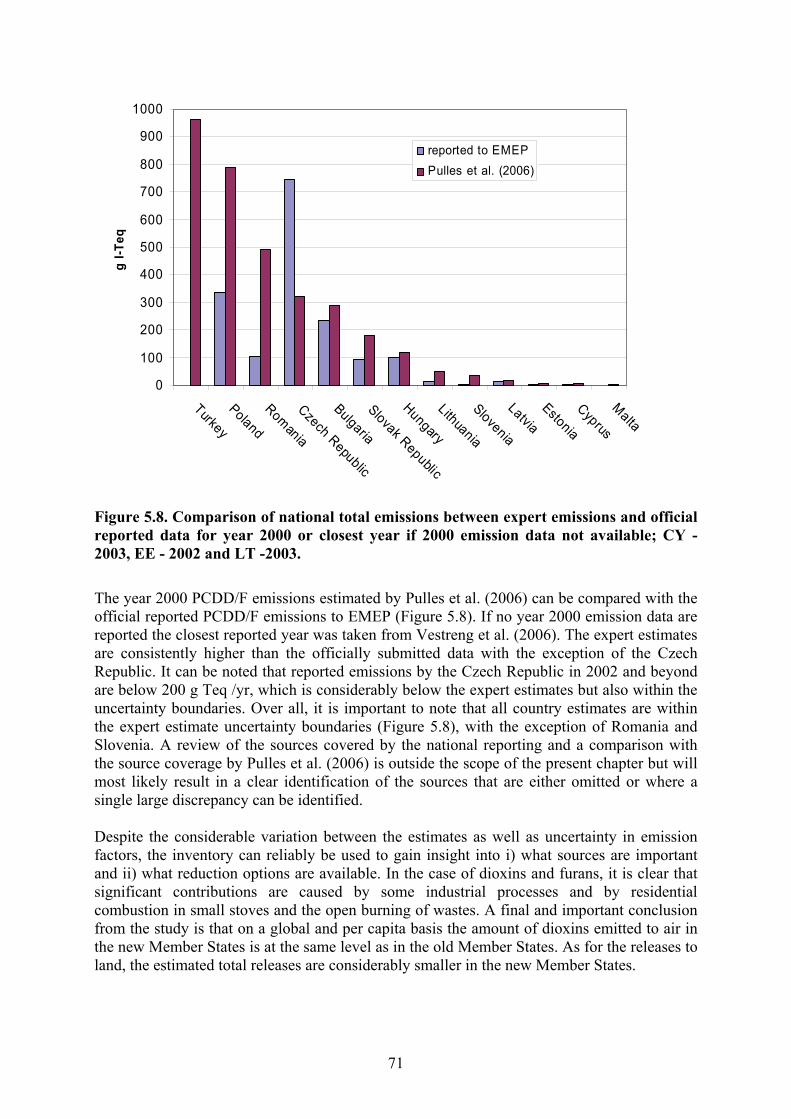
71
0
100
200
300
400
500
600
700
800
900
1000
Turkey
Poland
Romania
Czech Republic
Bulgaria
Slovak Republic
Hungary
Lithuania
Slovenia
LatviaEstonia
Cyprus
Malta
g I-T
eq
reported to EMEPPulles et al. (2006)
Figure 5.8. Comparison of national total emissions between expert emissions and official reported data for year 2000 or closest year if 2000 emission data not available; CY -2003, EE - 2002 and LT -2003. The year 2000 PCDD/F emissions estimated by Pulles et al. (2006) can be compared with the official reported PCDD/F emissions to EMEP (Figure 5.8). If no year 2000 emission data are reported the closest reported year was taken from Vestreng et al. (2006). The expert estimates are consistently higher than the officially submitted data with the exception of the Czech Republic. It can be noted that reported emissions by the Czech Republic in 2002 and beyond are below 200 g Teq /yr, which is considerably below the expert estimates but also within the uncertainty boundaries. Over all, it is important to note that all country estimates are within the expert estimate uncertainty boundaries (Figure 5.8), with the exception of Romania and Slovenia. A review of the sources covered by the national reporting and a comparison with the source coverage by Pulles et al. (2006) is outside the scope of the present chapter but will most likely result in a clear identification of the sources that are either omitted or where a single large discrepancy can be identified. Despite the considerable variation between the estimates as well as uncertainty in emission factors, the inventory can reliably be used to gain insight into i) what sources are important and ii) what reduction options are available. In the case of dioxins and furans, it is clear that significant contributions are caused by some industrial processes and by residential combustion in small stoves and the open burning of wastes. A final and important conclusion from the study is that on a global and per capita basis the amount of dioxins emitted to air in the new Member States is at the same level as in the old Member States. As for the releases to land, the estimated total releases are considerably smaller in the new Member States.

72
5.4 SUBSTANCES PROPOSED FOR POSSIBLE ADDITION TO THE POPS PROTOCOL
According to article 14.6 of the 1998 UNECE POP protocol, Parties to the protocol can propose new substances which can be added to annex I, II or III of the protocol. This makes identification and proposal of substances for addition to the POP Protocol a continuous process and a number of chemicals are currently being investigated for inclusion on the UN/ECE POP protocol list of priority compounds. A preliminary year 2000 emission inventory for eight substances that have or may be proposed for addition to the protocol (Dicofol, Edosulfan, Hexachlorobutadiene (HBU or HCBD), Pentabromodiphenyl ether (PeDBE, PDBE), Pentachlorobenzene (PCBe), Pentachlorophenol (PCP), Polychlorinated naftalenes (PCN) and Short chained chlorinated paraffin’s (SCCP’s)) has recently been published (Denier van der Gon et al., 2005). Since identification and proposal of substances as candidates for inclusion in the POP protocol is a dynamic process, this inventory does not cover all substances under discussion at the moment. For example, PerFluoroOctane Sulphonate (PFOS) and OctaBDE have also recently been proposed for addition to the UNECE POP Protocol but are not addressed by Denier van der Gon et al (2005b). A first (preliminary) UNECE-wide emission inventory for these substances is not yet available. Construction of inventories (by one of the Parties) for any substance that is proposed for addition is highly recommended to have better appreciation of the emissions and possible emission reduction measures. Since countries have no obligation to report emissions of substances possibly proposed for addition to the POP protocol, these preliminary emission inventories will be almost exclusively filled with expert estimates. The estimation methodology for the substances is described in detail by Denier van der Gon et al. (2005; 2006). The estimated annual emissions of selected substances in UNECE-Europe per source category for the year 2000 are presented in Table 5.6. Emissions of the substances mostly originate from one major source category, a more detailed overview of the sources considered for each substance is given in annex 3. The exception is PCN which, like PCDD/F, is mostly emitted as an unwanted by-product and can be released from a large number of sources. The national emissions estimated for the year 2000 are presented in Table 5.7. The complete calculated figures are represented in Table 5.7 because this may facilitate discussion and cross-checking of data, however, the accuracy is at most two significant digits. Uncertainties in the emission estimates for these substances are large and this inventory should be seen as a first step towards a reliable emission inventory. The most effective improvements vary by substance and no generic approach can be given but we conclude that emissions from in-use products are especially uncertain due to a lack of emission and/or usage data. For example, national usage/sales data for the pesticides Dicofol and Endosulfan for all UNECE countries would greatly improve the inventory. Provided that some of these substances may be added to the POP protocol in the near future, an investment in research to improve the quality of our knowledge on emissions, sources and measures is highly recommended.
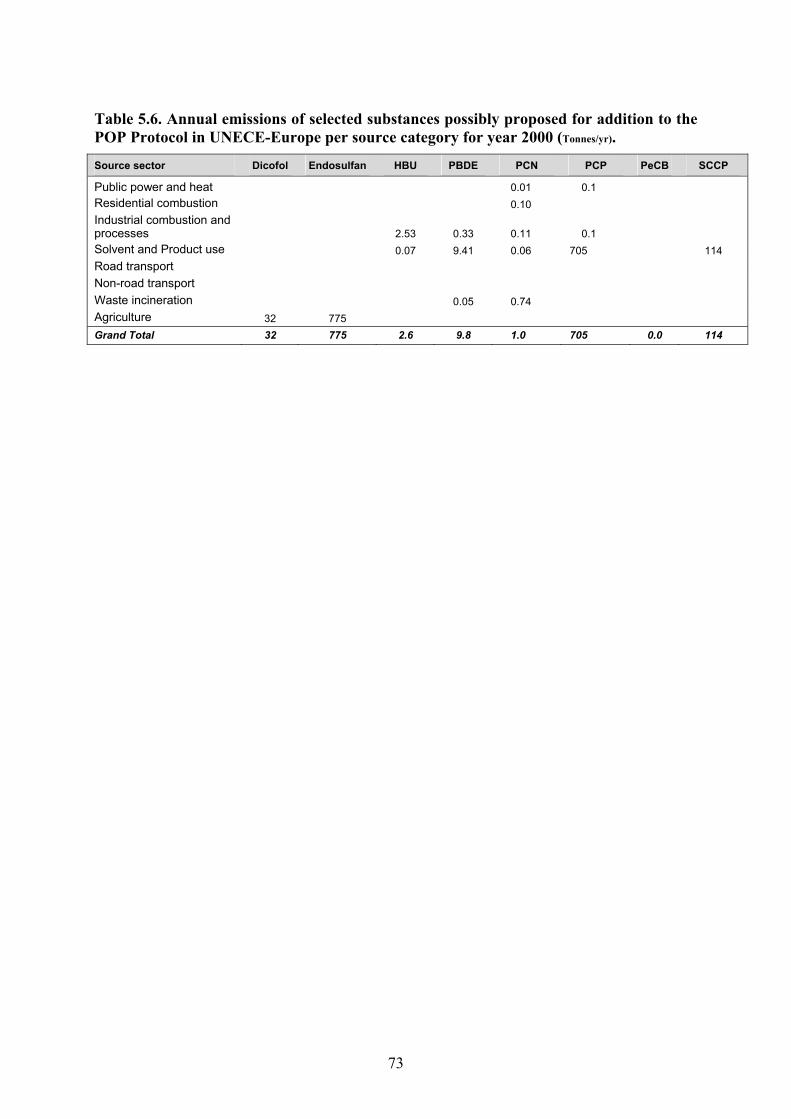
73
Table 5.6. Annual emissions of selected substances possibly proposed for addition to the POP Protocol in UNECE-Europe per source category for year 2000 (Tonnes/yr).
Source sector Dicofol Endosulfan HBU PBDE PCN PCP PeCB SCCP
Public power and heat 0.01 0.1 Residential combustion 0.10 Industrial combustion and processes 2.53 0.33 0.11 0.1 Solvent and Product use 0.07 9.41 0.06 705 114 Road transport Non-road transport Waste incineration 0.05 0.74 Agriculture 32 775 Grand Total 32 775 2.6 9.8 1.0 705 0.0 114
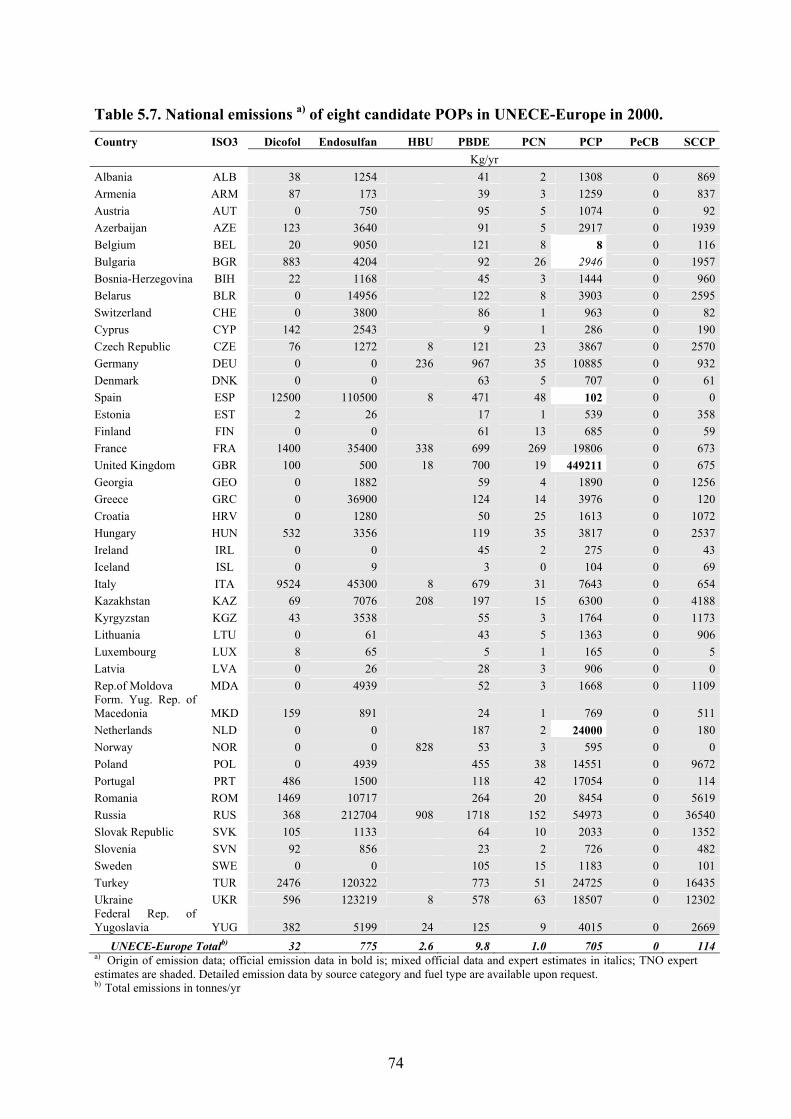
74
Table 5.7. National emissions a) of eight candidate POPs in UNECE-Europe in 2000.
Country ISO3 Dicofol Endosulfan HBU PBDE PCN PCP PeCB SCCP Kg/yr Albania ALB 38 1254 41 2 1308 0 869Armenia ARM 87 173 39 3 1259 0 837Austria AUT 0 750 95 5 1074 0 92Azerbaijan AZE 123 3640 91 5 2917 0 1939Belgium BEL 20 9050 121 8 8 0 116Bulgaria BGR 883 4204 92 26 2946 0 1957Bosnia-Herzegovina BIH 22 1168 45 3 1444 0 960Belarus BLR 0 14956 122 8 3903 0 2595Switzerland CHE 0 3800 86 1 963 0 82Cyprus CYP 142 2543 9 1 286 0 190Czech Republic CZE 76 1272 8 121 23 3867 0 2570Germany DEU 0 0 236 967 35 10885 0 932Denmark DNK 0 0 63 5 707 0 61Spain ESP 12500 110500 8 471 48 102 0 0Estonia EST 2 26 17 1 539 0 358Finland FIN 0 0 61 13 685 0 59France FRA 1400 35400 338 699 269 19806 0 673United Kingdom GBR 100 500 18 700 19 449211 0 675Georgia GEO 0 1882 59 4 1890 0 1256Greece GRC 0 36900 124 14 3976 0 120Croatia HRV 0 1280 50 25 1613 0 1072Hungary HUN 532 3356 119 35 3817 0 2537Ireland IRL 0 0 45 2 275 0 43Iceland ISL 0 9 3 0 104 0 69Italy ITA 9524 45300 8 679 31 7643 0 654Kazakhstan KAZ 69 7076 208 197 15 6300 0 4188Kyrgyzstan KGZ 43 3538 55 3 1764 0 1173Lithuania LTU 0 61 43 5 1363 0 906Luxembourg LUX 8 65 5 1 165 0 5Latvia LVA 0 26 28 3 906 0 0Rep.of Moldova MDA 0 4939 52 3 1668 0 1109Form. Yug. Rep. of Macedonia MKD 159 891 24 1 769 0 511Netherlands NLD 0 0 187 2 24000 0 180Norway NOR 0 0 828 53 3 595 0 0Poland POL 0 4939 455 38 14551 0 9672Portugal PRT 486 1500 118 42 17054 0 114Romania ROM 1469 10717 264 20 8454 0 5619Russia RUS 368 212704 908 1718 152 54973 0 36540Slovak Republic SVK 105 1133 64 10 2033 0 1352Slovenia SVN 92 856 23 2 726 0 482Sweden SWE 0 0 105 15 1183 0 101Turkey TUR 2476 120322 773 51 24725 0 16435Ukraine UKR 596 123219 8 578 63 18507 0 12302Federal Rep. of Yugoslavia YUG 382 5199 24 125 9 4015 0 2669
UNECE-Europe Totalb) 32 775 2.6 9.8 1.0 705 0 114a) Origin of emission data; official emission data in bold is; mixed official data and expert estimates in italics; TNO expert estimates are shaded. Detailed emission data by source category and fuel type are available upon request. b) Total emissions in tonnes/yr

75
5.5 REFERENCES Berdowski J.J.M., J. Baas, J.P.J. Bloos, A.J.H. Visschedijk and P.Y.J. Zandveld, 1997. The European
Inventory of Heavy Metals and Persistent Organic Pollutants for 1990, TNO Institute of Environmental Sciences, Energy Research and Process Innovation (MEP), UBA FB, June 1997.
Candelone, J.-P., Hong, S. (1995): Post-industrial revolution changes in large-scale atmospheric
pollution of the northern hemisphere by heavy metals as documented in central Greenland snow and ice. Journal of Geophysical Research, 100(D8): 16605-16616
Coggins A.M., Jennings S.G., Ebinghaus R. (2006): Accumulation rates of the heavy metals lead,
mercury and cadmium in ombrotrophic peatlands in the west of Ireland. Atmospheric Environment 40(2): 260-278
Denier van der Gon, H.A.C., M. van het Bolscher A.J.H. Visschedijk P.Y.J. Zandveld, Study to the
effectiveness of the UNECE Heavy Metals Protocol and costs of possible additional measures Phase I: Estimation of emission reduction resulting from the implementation of the HM Protocol, TNO report B&O-A R 2005/193, 2005a.
Denier van der Gon, H.A.C., M. van het Bolscher A.J.H. Visschedijk P.Y.J. Zandveld, Study to the
effectiveness of the UNECE Persistent Organic Pollutants Protocol and costs of possible additional measures Phase I: Estimation of emission reduction resulting from the implementation of the POP Protocol, TNO report B&O-A R 2005/194, 2005b.
Denier van der Gon, H.A.C., M. van het Bolscher A.J.H. Visschedijk P.Y.J. Zandveld, 2006,
Emissions of Persistent Organic Pollutants and eight candidate POPs from UNECE-Europe in 2000, 2010 and 2020 and the emission reduction resulting from the implementation of the UNECE POP Protocol (submitted)
Farmer, J.G., Mackenzie, A.B., Sugden, C.L., Edgar, P.J., Eades, L.J. (1997): A comparison of the
historical lead pollution records in peat and freshwater lake sedimants from central Scotland. Water, Air and Soil Pollution, 100: 253-270
Gomes L., Rajot J.L., Alfaro S.C. and A. Gaudichet [2003] Validation of a dust production model
from measurements performed in semi-arid agricultural areas of Spain and Niger. Catena 52, 257 – 271
Gong S.L. [2003] A parameterization of sea-salt aerosol source function for sub- and super-micron
particles. Global Biogeochemical Cycles 17(4), 1097-1103 Gong S.L., Zhang X.Y., Zhao T.L., McKendry I.G., Jaffe D.A., Lu N.M. [2003] Characterization of
soil dust aerosol inChina and its transport and distribution during 2001 ACE-Asia: 2. Model simulation and validation. Journal of Geophysical Research, 108(D9), 4262
Gusev A., Ilyin I., Mantseva L., Rozovskaya O., Shatalov V., Travnikov O. [2006] Progress in further
development of MSCE-HM and MSCE-POP models. EMEP/MSC-E Technical Report 4/2006. Meteorological Synthesizing Centre – East of EMEP, Moscow, Russia. Available at: http://www.msceast.org/publications.html
Ilyin, I., Travnikov, O. (2005): Modelling of heavy metal airborne pollution in Europe: Evaluation of
the model performance. EMEP/MSC-E Technical Report 8/2005. Meteorological Synthesizing Centre – East of EMEP, Moscow, Russia. Available at: http://www.msceast.org/publications.html

76
Kakareka S., Gromov S., Pacyna J.M. and T. Kukharchyk. Estimation of heavy metal emission fluxes on the territory of the NIS. (2004) Atmospheric Environment, 38, 7101-7109.
Pacyna J.M. and E.G. Pacyna. (2001) Assessment of global and regional emissions of trace metals to
the atmosphere from anthropogenic sources worldwide. Canadian Journal of Environmental Reviews, 9, 269-298.
Pacyna E.G. and J.M. Pacyna. (2002) Global emission of mercury from anthropogenic sources in
1995. Water, Air and Soil Pollution, 137, 149-165. Storch van H., Costa-Cabral M., Hagner, C., Feser F., Pacyna J.M., and E.G. Pacyna E. (2003) Four
decades of gasoline lead emissions and control policies in Europe: a retrospective assessment. The Science of the Total Environment, 311, 151-176.
Pacyna J.M., Pacyna E.G., Steenhuisen F. and S. Wilson. Mapping 1995 global anthropogenic
emissions of mercury (2003). Atmospheric Environment, 37, Supplement No. 1, 109-117. Pacyna E.G., Pacyna J.M., Steenhuisen F. and S.J. Wilson. Global anthropogenic mercury emission
inventory for 2000. Atmospheric Environment, (in print). Pacyna E.G., Pacyna J.M. Fudala J., Strzelecka-Jastrzab E., Hlawiczka S. and D. Panasiuk. Mercury
emissions from anthropogenic sources in Europe in 2000 and their scenarios until 2020. The Science of the Total Environment (submitted)
Pulles, T, H Kok, U. Quass, C. Juéry and J Matejovicova (2005), Dioxin emissions in Candidate
Countries, TNO Report R&I-A R 2005/054, http://europa.eu.int/comm/environment/dioxin/pdf/rapport_2005.pdf
Pulles, T, H Kok, U. Quass, 2006, Application of the emission inventory model TEAM : Uncertainties
in dioxin emission estimates for central Europe, Atmospheric environment, 40, 2321-2332. Ryaboshapko A., Bullock O.R., Christensen J., Cohen M., Dastoor, A., Ilyin I., Petersen G., Syrakov
D., Travnikov O., Artz R.S., Davignon, D., Draxler R.R., Munthe J. and J. M. Pacyna. Intercomparison study of atmospheric mercury models: Modelling results vs. long-term observations and comparison of country atmospheric balances. Atmospheric Environment, (submitted).
TFMM Workshop Minutes [2005]. Minutes of Workshop on the review of the EMEP Models on
Heavy Metals and Persistent Organic Pollutants, Moscow, 13 – 14 October 2005. Available at: www.msceast.org/events/review.html
Vestreng, V., Rigler E., Adams, M., Kindbom, K., Pacyna, J.M., Denier van der Gon, H., Reis, S.,
Travnikov, O, Inventory review 2006, Emission data reported to LRTAP and NEC Directive, Stage 1, 2 and 3 review and Evaluation of inventories of HM and POPs. EMEP/MSC-W Technical Report 2006, ISSN 1504-6179. Available from http://www.emep.int
Wilson S.J., Steenhuisen F., Pacyna J.M. and E.G. Pacyna Mapping the spatial distrubution of global
anthropogenic mercury atmospheric emission inventories. Atmospheric Environment, (in print).
Zender C. S., Bian H. and D. Newman [2003] Mineral dust entrainment and deposition (DEAD) model: description and 1990s dust climatology. Journal of Geophysical Research 108(D14), 4416

77
T
otal
Hg
Em
issi
ons
from
Ant
hrop
ogen
ic S
ourc
es i
n E
urop
e, 2
000
(in
Tons
/Yea
r)
C
oal C
ombu
stio
n O
ilC
emen
t N
on-fe
rrous
Met
als
Iron
& S
teel
Cau
stic
Was
teO
ther
Info
rmat
ion
Cou
ntry
Pow
erR
esid
entia
lC
ombu
stio
nP
rodu
ctio
nLe
adZi
ncPr
oduc
tion
Sod
aD
ispo
sal
Sou
rces
Tota
lS
ourc
e 20
00Pl
ants
heat
Alb
ania
0.07
0.10
0.17
JP/E
P A
ustri
a0.
100.
570.
100.
130.
100.
030.
071.
10E
MEP
1/2
002
Bel
arus
0.
020.
320.
010.
010.
36N
atio
nal
Bel
gium
1.06
0.13
0.06
0.25
0.06
0.44
0.06
2.06
EME
P 1
/200
2 (1
), J
P/E
P B
osni
a-H
erze
govi
na0.
220.
22JP
/EP
Bul
garia
1.64
1.64
0.06
0.06
0.06
0.06
0.06
0.49
0.12
4.19
EM
EP 1
/200
2 C
roat
ia0.
310.
31EM
EP
1/2
002
(1),
Cyp
rus
0.10
0.10
JP/E
P C
zech
Rep
ublic
1.
711.
710.
020.
050.
070.
283.
84E
MEP
1/2
002,
JP/E
P D
enm
ark
0.60
0.17
0.17
0.85
0.26
2.05
EM
EP 1
/200
2 E
ston
ia0.
400.
100.
020.
030.
55N
atio
nal
Fin
land
0.05
0.21
0.05
0.16
0.05
0.03
0.05
0.60
EM
EP 1
/200
2,JP
/EP
Fra
nce
2.06
0.14
3.44
0.69
1.79
1.37
0.70
2.61
2.20
15.0
0E
MEP
1/2
002
Ger
man
y
5.24
4.05
1.19
5.49
2.00
1.24
1.19
3.00
23.4
0JP
/EP
Gre
ece
0.
730.
631.
560.
100.
200.
030.
203.
45JP
/EP
Hun
gary
1.00
1.11
0.10
0.30
0.10
0.20
1.04
0.36
4.21
Nat
iona
l I
cela
nd0.
00 I
rela
nd0.
200.
120.
110.
43JP
/EP
Ita
ly0.
462.
543.
270.
100.
700.
560.
651.
000.
509.
78JP
/EP
Lat
via
0.08
0.07
0.15
Nat
iona
l L
ithua
nia
0.25
0.25
EM
EP 1
/200
2 L
uxem
burg
0.14
0.13
0.27
EM
EP 1
/200
2 M
onac
o0.
040.
040.
08N
atio
nal
Net
herla
nds
0.05
0.05
0.15
0.15
0.03
0.10
0.53
EME
P 1
/200
2 (1
), J
P/E
P N
orw
ay0.
240.
240.
240.
240.
96E
MEP
1/2
002,
JP/E
P P
olan
d10
.20
12.8
40.
100.
100.
900.
100.
570.
7925
.60
Nat
iona
l P
ortu
gal
0.17
0.88
0.03
1.08
JP/E
P R
epub
lic o
f Mol
dova
0.
060.
070.
050.
18EM
EP
1/2
002
(1),
INTA
S R
oman
ia2.
102.
700.
050.
050.
105.
00N
atio
nal
Rus
sian
Fed
erat
ion
15.5
011
.00
3.70
5.90
1.90
28.0
00.
1066
.10
INTA
S/J
P,E
P S
lova
kia
1.09
1.09
0.27
0.27
0.11
1.62
4.45
EM
EP 1
/200
2 S
love
nia
0.29
0.29
0.58
EM
EP 1
/200
2 S
pain
5.39
4.35
5.60
0.42
2.49
1.04
0.61
3.10
23.0
0E
MEP
1/2
002
Sw
eden
0.06
0.06
0.06
0.04
0.25
0.07
0.54
EME
P 1
/200
2 (1
), S
witz
erla
nd0.
100.
100.
200.
800.
101.
300.
032.
63N
atio
nal
TFY
R o
f Mac
edon
ia0.
040.
010.
05N
atio
nal
Tur
key
2.69
1.17
0.20
4.06
JP/E
P U
krai
ne
5.70
1.71
0.85
1.69
6.26
0.08
16.2
9IN
TAS
Uni
ted
Kin
gdom
3.42
0.62
0.26
0.09
0.09
0.13
0.68
3.25
8.54
EM
EP 1
/200
2 Y
ugos
lavi
a3.
520.
660.
210.
280.
100.
200.
120.
401.
607.
09JP
/EP
EUR
OPE
63.4
748
.72
1.69
30.1
87.
637.
8412
.49
40.4
011
.57
15.2
623
9.25
(1)
19
99 y
ear
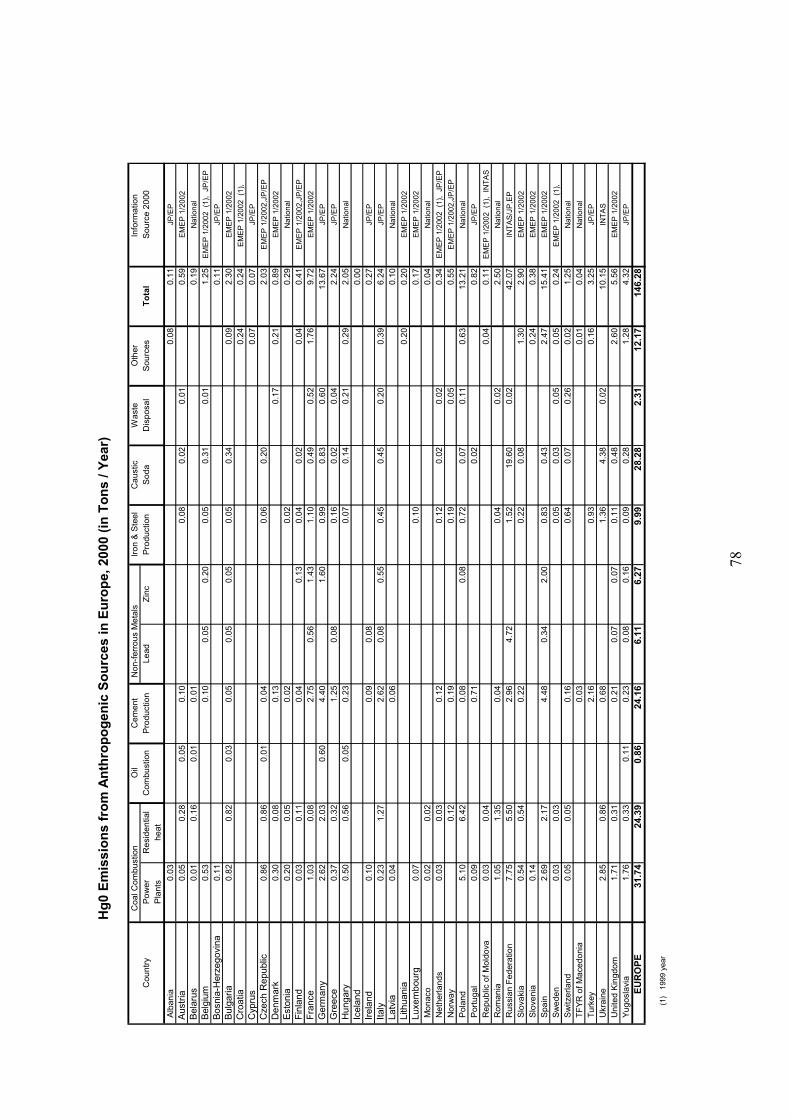
78
Hg0
Em
issi
ons
from
Ant
hrop
ogen
ic S
ourc
es in
Eur
ope,
200
0 (in
Ton
s / Y
ear)
C
oal C
ombu
stio
n O
ilC
emen
t N
on-fe
rrou
s M
etal
sIro
n &
Ste
elC
aust
icW
aste
Oth
erIn
form
atio
n C
ount
ryP
ower
Res
iden
tial
Com
bust
ion
Pro
duct
ion
Lead
Zinc
Pro
duct
ion
Sod
aD
ispo
sal
Sou
rces
Tota
lS
ourc
e 20
00P
lant
she
at A
lban
ia0.
030.
080.
11JP
/EP
Aus
tria
0.05
0.28
0.05
0.10
0.08
0.02
0.01
0.59
EMEP
1/2
002
Bel
arus
0.01
0.16
0.01
0.01
0.19
Nat
iona
l B
elgi
um0.
530.
100.
050.
200.
050.
310.
011.
25E
ME
P 1
/200
2 (1
), J
P/E
P B
osni
a-H
erze
govi
na0.
110.
11JP
/EP
Bul
garia
0.82
0.82
0.03
0.05
0.05
0.05
0.05
0.34
0.09
2.30
EMEP
1/2
002
Cro
atia
0.24
0.24
EM
EP
1/2
002
(1),
Cyp
rus
0.07
0.07
JP/E
P C
zech
Rep
ublic
0.86
0.86
0.01
0.04
0.06
0.20
2.03
EM
EP
1/2
002,
JP/E
P D
enm
ark
0.30
0.08
0.13
0.17
0.21
0.89
EMEP
1/2
002
Est
onia
0.20
0.05
0.02
0.02
0.29
Nat
iona
l F
inla
nd0.
030.
110.
040.
130.
040.
020.
040.
41E
ME
P 1
/200
2,JP
/EP
Fra
nce
1.03
0.08
2.75
0.56
1.43
1.10
0.49
0.52
1.76
9.72
EMEP
1/2
002
Ger
man
y2.
622.
030.
604.
401.
600.
990.
830.
6013
.67
JP/E
P G
reec
e0.
370.
321.
250.
080.
160.
020.
042.
24JP
/EP
Hun
gary
0.50
0.56
0.05
0.23
0.07
0.14
0.21
0.29
2.05
Nat
iona
l Ic
elan
d0.
00 Ir
elan
d0.
100.
090.
080.
27JP
/EP
Ital
y0.
231.
272.
620.
080.
550.
450.
450.
200.
396.
24JP
/EP
Lat
via
0.04
0.06
0.10
Nat
iona
l L
ithua
nia
0.20
0.20
EMEP
1/2
002
Lux
embo
urg
0.07
0.10
0.17
EMEP
1/2
002
Mon
aco
0.02
0.02
0.04
Nat
iona
l N
ethe
rland
s0.
030.
030.
120.
120.
020.
020.
34E
ME
P 1
/200
2 (1
), J
P/E
P N
orw
ay0.
120.
190.
190.
050.
55E
ME
P 1
/200
2,JP
/EP
Pol
and
5.10
6.42
0.08
0.08
0.72
0.07
0.11
0.63
13.2
1N
atio
nal
Por
tuga
l0.
090.
710.
020.
82JP
/EP
Rep
ublic
of M
oldo
va
0.03
0.04
0.04
0.11
EM
EP
1/2
002
(1),
INTA
S R
oman
ia1.
051.
350.
040.
040.
022.
50N
atio
nal
Rus
sian
Fed
erat
ion
7.75
5.50
2.96
4.72
1.52
19.6
00.
0242
.07
INTA
S/J
P,E
P S
lova
kia
0.54
0.54
0.22
0.22
0.08
1.30
2.90
EMEP
1/2
002
Slo
veni
a0.
140.
240.
38EM
EP 1
/200
2 S
pain
2.69
2.17
4.48
0.34
2.00
0.83
0.43
2.47
15.4
1EM
EP 1
/200
2 S
wed
en0.
030.
030.
050.
030.
050.
050.
24E
ME
P 1
/200
2 (1
), S
witz
erla
nd0.
050.
050.
160.
640.
070.
260.
021.
25N
atio
nal
TFY
R o
f Mac
edon
ia0.
030.
010.
04N
atio
nal
Tur
key
2.16
0.93
0.16
3.25
JP/E
P U
krai
ne
2.85
0.86
0.68
1.36
4.38
0.02
10.1
5IN
TAS
Uni
ted
Kin
gdom
1.71
0.31
0.21
0.07
0.07
0.11
0.48
2.60
5.56
EMEP
1/2
002
Yug
osla
via
1.76
0.33
0.11
0.23
0.08
0.16
0.09
0.28
1.28
4.32
JP/E
PEU
RO
PE
31.7
424
.39
0.86
24.1
66.
116.
279.
9928
.28
2.31
12.1
714
6.28
(1)
19
99 y
ear
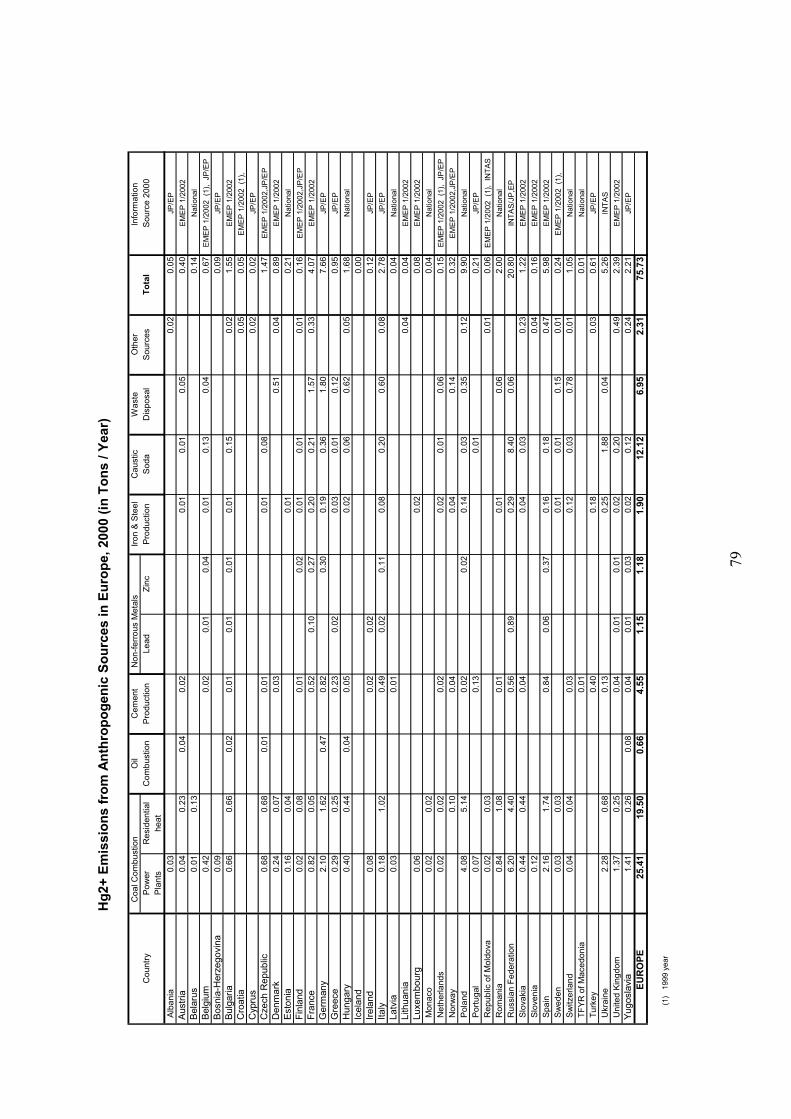
79
Hg2
+ Em
issi
ons
from
Ant
hrop
ogen
ic S
ourc
es in
Eur
ope,
200
0 (in
Ton
s / Y
ear)
C
oal C
ombu
stio
n O
ilC
emen
t N
on-fe
rrous
Met
als
Iron
& St
eel
Cau
stic
Was
teO
ther
Info
rmat
ion
Cou
ntry
Pow
erR
esid
entia
lC
ombu
stio
nPr
oduc
tion
Lead
Zinc
Pro
duct
ion
Soda
Dis
posa
lS
ourc
esTo
tal
Sou
rce
2000
Pla
nts
heat
Alb
ania
0.03
0.02
0.05
JP/E
P A
ustri
a0.
040.
230.
040.
020.
010.
010.
050.
40E
ME
P 1
/200
2 B
elar
us0.
010.
130.
14N
atio
nal
Bel
gium
0.42
0.02
0.01
0.04
0.01
0.13
0.04
0.67
EM
EP
1/2
002
(1),
JP
/EP
Bos
nia-
Her
zego
vina
0.09
0.09
JP/E
P B
ulga
ria0.
660.
660.
020.
010.
010.
010.
010.
150.
021.
55E
ME
P 1
/200
2 C
roat
ia0.
050.
05E
ME
P 1
/200
2 (1
), C
ypru
s0.
020.
02JP
/EP
Cze
ch R
epub
lic0.
680.
680.
010.
010.
010.
081.
47E
ME
P 1
/200
2,JP
/EP
Den
mar
k0.
240.
070.
030.
510.
040.
89E
ME
P 1
/200
2 E
ston
ia0.
160.
040.
010.
21N
atio
nal
Fin
land
0.02
0.08
0.01
0.02
0.01
0.01
0.01
0.16
EM
EP
1/2
002,
JP/E
P F
ranc
e0.
820.
050.
520.
100.
270.
200.
211.
570.
334.
07E
ME
P 1
/200
2 G
erm
any
2.10
1.62
0.47
0.82
0.30
0.19
0.36
1.80
7.66
JP/E
P G
reec
e0.
290.
250.
230.
020.
030.
010.
120.
95JP
/EP
Hun
gary
0.40
0.44
0.04
0.05
0.02
0.06
0.62
0.05
1.68
Nat
iona
l Ic
elan
d0.
00 Ir
elan
d0.
080.
020.
020.
12JP
/EP
Ital
y0.
181.
020.
490.
020.
110.
080.
200.
600.
082.
78JP
/EP
Lat
via
0.03
0.01
0.04
Nat
iona
l L
ithua
nia
0.04
0.04
EM
EP
1/2
002
Lux
embo
urg
0.06
0.02
0.08
EM
EP
1/2
002
Mon
aco
0.02
0.02
0.04
Nat
iona
l N
ethe
rland
s0.
020.
020.
020.
020.
010.
060.
15E
ME
P 1
/200
2 (1
), J
P/E
P N
orw
ay0.
100.
040.
040.
140.
32E
ME
P 1
/200
2,JP
/EP
Pol
and
4.08
5.14
0.02
0.02
0.14
0.03
0.35
0.12
9.90
Nat
iona
l P
ortu
gal
0.07
0.13
0.01
0.21
JP/E
P R
epub
lic o
f Mol
dova
0.
020.
030.
010.
06E
ME
P 1
/200
2 (1
), IN
TAS
Rom
ania
0.84
1.08
0.01
0.01
0.06
2.00
Nat
iona
l R
ussi
an F
eder
atio
n6.
204.
400.
560.
890.
298.
400.
0620
.80
INTA
S/J
P,E
P S
lova
kia
0.44
0.44
0.04
0.04
0.03
0.23
1.22
EM
EP
1/2
002
Slo
veni
a0.
120.
040.
16E
ME
P 1
/200
2 S
pain
2.16
1.74
0.84
0.06
0.37
0.16
0.18
0.47
5.98
EM
EP
1/2
002
Sw
eden
0.03
0.03
0.01
0.01
0.15
0.01
0.24
EM
EP
1/2
002
(1),
Sw
itzer
land
0.04
0.04
0.03
0.12
0.03
0.78
0.01
1.05
Nat
iona
l T
FYR
of M
aced
onia
0.01
0.01
Nat
iona
l T
urke
y0.
400.
180.
030.
61JP
/EP
Ukr
aine
2.
280.
680.
130.
251.
880.
045.
26IN
TAS
Uni
ted
King
dom
1.37
0.25
0.04
0.01
0.01
0.02
0.20
0.49
2.39
EM
EP
1/2
002
Yug
osla
via
1.41
0.26
0.08
0.04
0.01
0.03
0.02
0.12
0.24
2.21
JP/E
PEU
RO
PE
25.4
119
.50
0.66
4.55
1.15
1.18
1.90
12.1
26.
952.
3175
.73
(1)
19
99 y
ear
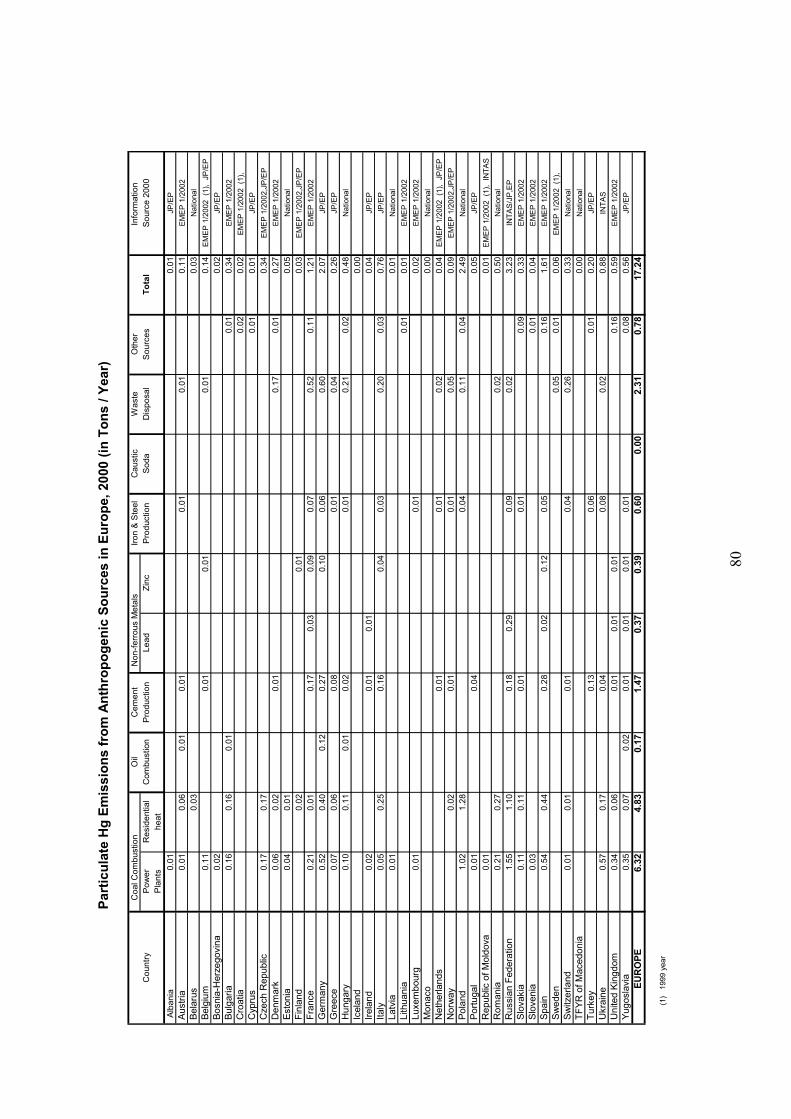
80
Part
icul
ate
Hg
Emis
sion
s fr
om A
nthr
opog
enic
Sou
rces
in E
urop
e, 2
000
(in T
ons
/ Yea
r)
C
oal C
ombu
stio
n O
ilC
emen
t N
on-fe
rrou
s M
etal
sIro
n &
Ste
elC
aust
icW
aste
Oth
erIn
form
atio
n C
ount
ryP
ower
Res
iden
tial
Com
bust
ion
Pro
duct
ion
Lead
Zinc
Pro
duct
ion
Sod
aD
ispo
sal
Sou
rces
Tota
lSo
urce
200
0P
lant
she
at A
lban
ia0.
010.
01JP
/EP
Aus
tria
0.01
0.06
0.01
0.01
0.01
0.01
0.11
EM
EP
1/2
002
Bel
arus
0.03
0.03
Nat
iona
l B
elgi
um0.
110.
010.
010.
010.
14E
ME
P 1
/200
2 (1
), J
P/E
P B
osni
a-H
erze
govi
na0.
020.
02JP
/EP
Bul
garia
0.16
0.16
0.01
0.01
0.34
EM
EP
1/2
002
Cro
atia
0.02
0.02
EM
EP
1/2
002
(1),
Cyp
rus
0.01
0.01
JP/E
P C
zech
Rep
ublic
0.17
0.17
0.34
EM
EP
1/2
002,
JP/E
P D
enm
ark
0.06
0.02
0.01
0.17
0.01
0.27
EM
EP
1/2
002
Est
onia
0.04
0.01
0.05
Nat
iona
l F
inla
nd0.
020.
010.
03E
ME
P 1
/200
2,JP
/EP
Fra
nce
0.21
0.01
0.17
0.03
0.09
0.07
0.52
0.11
1.21
EM
EP
1/2
002
Ger
man
y0.
520.
400.
120.
270.
100.
060.
602.
07JP
/EP
Gre
ece
0.07
0.06
0.08
0.01
0.04
0.26
JP/E
P H
unga
ry0.
100.
110.
010.
020.
010.
210.
020.
48N
atio
nal
Icel
and
0.00
Irel
and
0.02
0.01
0.01
0.04
JP/E
P It
aly
0.05
0.25
0.16
0.04
0.03
0.20
0.03
0.76
JP/E
P L
atvi
a0.
010.
01N
atio
nal
Lith
uani
a0.
010.
01E
ME
P 1
/200
2 L
uxem
bour
g0.
010.
010.
02E
ME
P 1
/200
2 M
onac
o0.
00N
atio
nal
Net
herla
nds
0.01
0.01
0.02
0.04
EM
EP
1/2
002
(1),
JP
/EP
Nor
way
0.02
0.01
0.01
0.05
0.09
EM
EP
1/2
002,
JP/E
P P
olan
d1.
021.
280.
040.
110.
042.
49N
atio
nal
Por
tuga
l0.
010.
040.
05JP
/EP
Rep
ublic
of M
oldo
va0.
010.
01E
ME
P 1
/200
2 (1
), IN
TAS
Rom
ania
0.21
0.27
0.02
0.50
Nat
iona
l R
ussi
an F
eder
atio
n1.
551.
100.
180.
290.
090.
023.
23IN
TAS
/JP
,EP
Slo
vaki
a0.
110.
110.
010.
010.
090.
33E
ME
P 1
/200
2 S
love
nia
0.03
0.01
0.04
EM
EP
1/2
002
Spa
in0.
540.
440.
280.
020.
120.
050.
161.
61E
ME
P 1
/200
2 S
wed
en0.
050.
010.
06E
ME
P 1
/200
2 (1
), S
witz
erla
nd0.
010.
010.
010.
040.
260.
33N
atio
nal
TFY
R o
f Mac
edon
ia0.
00N
atio
nal
Tur
key
0.13
0.06
0.01
0.20
JP/E
P U
krai
ne0.
570.
170.
040.
080.
020.
88IN
TAS
Uni
ted
King
dom
0.34
0.06
0.01
0.01
0.01
0.16
0.59
EM
EP
1/2
002
Yug
osla
via
0.35
0.07
0.02
0.01
0.01
0.01
0.01
0.08
0.56
JP/E
PEU
RO
PE
6.32
4.83
0.17
1.47
0.37
0.39
0.60
0.00
2.31
0.78
17.2
4
(1)
19
99 y
ear

81
T
otal
As
Em
issi
ons
from
Ant
hrop
ogen
ic S
ourc
es i
n E
urop
e, 2
000
(in
Tons
/Yea
r)C
oal C
ombu
stio
nC
ount
ryP
ower
Res
iden
tial
Non
-ferr
ous
Met
alIro
n &
Ste
elW
aste
Oth
erTo
tal
Ref
eren
ces
Pla
nts
Hea
tM
anuf
actu
ring
Pro
duct
ion
Dis
posa
lSo
urce
s A
lban
ia0.
10.
10.
2JP
/EP
Aus
tria
0.1
0.4
2.5
0.5
0.4
3.9
JP/E
P B
elar
us
0.2
3.0
0.1
3.3
EM
EP
-W, J
uly
2003
Bel
gium
1.5
0.5
0.3
0.6
2.9
EM
EP
-W, J
uly
2003
Bos
nia-
Her
zego
vina
0.2
0.2
JP/E
P B
ulga
ria0.
50.
51.
82.
8JP
/EP
Cro
atia
0.2
0.3
0.6
1.1
EM
EP
-W, J
uly
2003
Cyp
rus
0.1
0.1
JP/E
P C
zech
Rep
ublic
0.
90.
80.
70.
70.
43.
5EM
EP
-W, J
uly
2003
(1
) D
enm
ark
0.6
0.2
0.1
0.9
EM
EP
-W, J
uly
2003
Est
onia
4.2
1.1
0.4
4.0
9.7
EM
EP
-W, J
uly
2003
Fin
land
0.2
0.7
1.7
2.0
4.6
EM
EP
-W, J
uly
2003
Fra
nce
18.7
1.3
0.8
0.8
0.6
22.2
EM
EP
-W, J
uly
2003
Ger
man
y
10.7
8.3
4.2
23.2
JP/E
P G
reec
e
1.1
0.9
1.5
0.5
4EM
EP
-W, J
uly
2003
(3
) H
unga
ry1.
31.
41.
01.
01.
05.
7E
ME
P-W
, Jul
y 20
03 I
cela
nd0
JP/E
P I
rela
nd0.
50.
10.
6JP
/EP
Ita
ly2.
111
.70.
21.
015
JP/E
P L
atvi
a0.
50.
10.
6E
ME
P-W
, Jul
y 20
03 L
ithua
nia
0.3
0.2
0.2
0.1
0.8
EM
EP
-W, J
uly
2003
Lux
embu
rg0.
10.
1E
ME
P-W
, Jul
y 20
03 M
onac
o0.
00.
10.
1JP
/EP
Net
herla
nds
0.1
0.1
0.2
0.6
0.1
0.2
1.3
EM
EP
-W, J
uly
2003
Nor
way
0.2
0.3
0.3
1.7
2.5
EM
EP
-W, J
uly
2003
Pol
and
11.1
13.9
12.0
12.0
1.4
50.4
EM
EP
-W, J
uly
2003
Por
tuga
l0.
41.
11.
5JP
/EP
Rep
ublic
of M
oldo
va
0.1
0.1
0.2
EME
P-W
, Jul
y 20
03
(2)
Rom
ania
3.1
3.9
2.0
1.0
10JP
/EP
Rus
sian
Fed
erat
ion
23.4
16.6
33.0
20.0
40.1
133.
1JP
/EP
Slo
vaki
a2.
62.
62.
02.
02.
011
.2E
ME
P-W
, Jul
y 20
03 S
love
nia
0.5
0.2
0.2
0.3
1.2
JP/E
P S
pain
11.1
8.9
17.0
12.0
8.3
57.3
EM
EP
-W, J
uly
2003
Sw
eden
0.1
0.2
0.7
0.1
1.1
EM
EP
-W, J
uly
2003
Sw
itzer
land
0.7
0.7
1.4
2.8
JP/E
P T
FYR
of M
aced
onia
0.1
0.0
0.1
JP/E
P T
urke
y1.
51.
51.
01.
01.
06
JP/E
P U
krai
ne
79.2
23.8
50.0
48.0
20.1
221.
1EM
EP
-W, J
uly
2003
(1
) U
nite
d K
ingd
om27
.34.
93.
01.
50.
31.
038
EM
EP
-W, J
uly
2003
Yug
osla
via
6.7
1.3
0.5
0.5
1.5
10.5
JP/E
P
EUR
OPE
212
109.
613
2.3
106.
41.
592
.065
3.8
(1)
2001
yea
r(2
) 19
99 y
ear
(3)
1996
yea
r

82
T
otal
Cd
Em
issi
ons
from
Ant
hrop
ogen
ic S
ourc
es i
n E
urop
e, 2
000
(in
Tons
/Yea
r)
Coa
l Com
bust
ion
Cou
ntry
Pow
er
Res
iden
tial
Non
-ferr
ous
Met
alIro
n &S
teel
Was
teO
ther
Tota
lR
efer
ence
sPl
ants
Hea
tM
anuf
actu
ring
Pro
duct
ion
Dis
posa
lSo
urce
s A
lban
ia
0.5
0.1
0.6
EM
EP
-E 3
/200
2 A
ustri
a
0.1
0.5
0.1
0.1
0.6
1.4
EM
EP
-W, J
uly
2003
Bel
arus
0.
11.
20.
11.
4E
ME
P-W
, Jul
y 20
03 B
elgi
um0.
60.
60.
20.
50.
42.
3E
ME
P-W
, Jul
y 20
03 B
osni
a-H
erze
govi
na0.
30.
3E
ME
P-E
3/2
002
Bul
garia
1.2
1.2
8.3
0.1
0.2
11.0
EM
EP
-W, J
uly
2003
Cro
atia
0.3
0.2
0.5
1.0
EM
EP
-W, J
uly
2003
Cyp
rus
0.0
0.1
0.1
0.2
EM
EP
-E 3
/200
2 C
zech
Rep
ublic
1.3
1.3
0.2
0.1
2.9
EM
EP
-W, J
uly
2003
Den
mar
k0.
20.
10.
10.
30.
7E
ME
P-W
, Jul
y 20
03 E
ston
ia0.
30.
10.
10.
20.
7E
ME
P-W
, Jul
y 20
03 F
inla
nd0.
10.
21.
00.
11.
4E
ME
P-W
, Jul
y 20
03 F
ranc
e0.
70.
12.
20.
93.
93.
711
.5E
ME
P-W
, Jul
y 20
03 G
erm
any
0.
80.
64.
61.
40.
23.
411
.0E
ME
P-W
, Jul
y 20
03
(3)
Gre
ece
0.
80.
70.
10.
11.
33.
0E
ME
P-W
, Jul
y 20
03
(2)
Hun
gary
0.6
0.7
0.5
0.9
2.7
EM
EP
-W, J
uly
2003
Ice
land
0.1
0.1
0.2
EM
EP
-E 3
/200
2 I
rela
nd0.
70.
21.
12.
0E
ME
P-E
3/2
002
Ita
ly
1.
37.
28.
23.
23.
16.
929
.9E
ME
P-E
3/2
002
Lat
via
0.5
0.1
0.6
EM
EP
-W, J
uly
2003
Lith
uani
a0.
40.
40.
40.
21.
4E
ME
P-W
, Jul
y 20
03 L
uxem
burg
0.1
0.1
EM
EP
-W, J
uly
2003
Mon
aco
0.0
EM
EP
-W, J
uly
2003
Net
herla
nds
0.4
0.3
0.1
0.1
0.3
1.2
EM
EP
-W, J
uly
2003
Nor
way
0.3
0.3
0.1
0.7
EM
EP
-W, J
uly
2003
Pol
and
20.1
25.4
1.4
1.5
2.0
50.4
EM
EP
-W, J
uly
2003
Por
tuga
l1.
51.
10.
10.
33.
0E
ME
P-E
3/2
002
Rep
ublic
of M
oldo
va
0.0
0.1
0.1
EM
EP
-E 3
/200
2 R
oman
ia4.
45.
63.
74.
82.
521
.0E
ME
P-E
3/2
002
Rus
sian
Fed
erat
ion
9.4
6.6
10.3
7.7
16.5
50.5
EM
EP
-W, J
uly
2003
Slo
vaki
a0.
70.
73.
00.
12.
77.
2E
ME
P-W
, Jul
y 20
03 S
love
nia
0.6
0.3
0.3
0.3
1.5
EM
EP
-W, J
uly
2003
Spa
in2.
72.
23.
87.
53.
619
.8E
ME
P-W
, Jul
y 20
03 S
wed
en0.
10.
20.
50.
10.
9E
ME
P-W
, Jul
y 20
03 S
witz
erla
nd0.
40.
31.
20.
32.
2E
ME
P-W
, Jul
y 20
03 T
FYR
of M
aced
onia
0.1
0.1
0.2
EM
EP
-W, J
uly
2003
Tur
key
0.1
0.1
0.2
EM
EP
-E 3
/200
2 U
krai
ne
2.7
1.8
2.5
2.5
110
.5E
ME
P-W
, Jul
y 20
03
(1)
Uni
ted
King
dom
2.4
0.4
1.0
0.5
1.1
1.8
7.2
EM
EP
-W, J
uly
2003
Yug
osla
via
3.4
0.6
0.5
0.5
16.
0E
ME
P-E
3/2
002
EUR
OPE
6059
.151
.836
.89.
252
.026
8.9
(1)
200
1 ye
ar
(2)
1996
yea
r
(3
) 19
95 y
ear
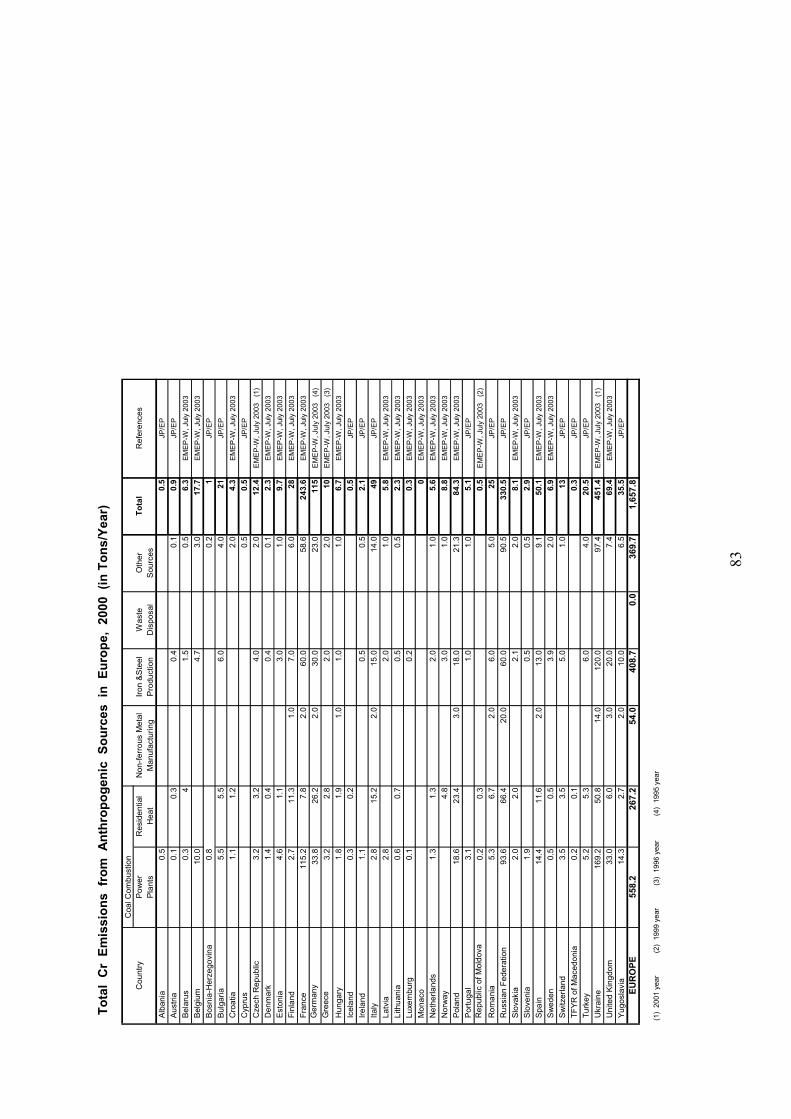
83
To
tal
Cr
Emis
sion
s fr
om A
nthr
opog
enic
Sou
rces
in
Eur
ope,
200
0 (i
n To
ns/Y
ear)
Coa
l Com
bust
ion
Cou
ntry
Pow
erR
esid
entia
lN
on-fe
rrou
s M
etal
Iron
&S
teel
Was
teO
ther
Tota
lR
efer
ence
sP
lant
sH
eat
Man
ufac
turin
gP
rodu
ctio
nD
ispo
sal
Sou
rces
Alb
ania
0.5
0.5
JP/E
P A
ustri
a0.
10.
30.
40.
10.
9JP
/EP
Bel
arus
0.3
41.
50.
56.
3E
ME
P-W
, Jul
y 20
03 B
elgi
um10
.04.
73.
017
.7E
ME
P-W
, Jul
y 20
03 B
osni
a-H
erze
govi
na0.
80.
21
JP/E
P B
ulga
ria5.
55.
56.
04.
021
JP/E
P C
roat
ia1.
11.
22.
04.
3E
ME
P-W
, Jul
y 20
03 C
ypru
s0.
50.
5JP
/EP
Cze
ch R
epub
lic
3.2
3.2
4.0
2.0
12.4
EM
EP
-W, J
uly
2003
(1
) D
enm
ark
1.4
0.4
0.4
0.1
2.3
EM
EP
-W, J
uly
2003
Est
onia
4.6
1.1
3.0
1.0
9.7
EM
EP
-W, J
uly
2003
Fin
land
2.7
11.3
1.0
7.0
6.0
28E
ME
P-W
, Jul
y 20
03 F
ranc
e11
5.2
7.8
2.0
60.0
58.6
243.
6E
ME
P-W
, Jul
y 20
03 G
erm
any
33
.826
.22.
030
.023
.011
5E
ME
P-W
, Jul
y 20
03
(4)
Gre
ece
3.
22.
82.
02.
010
EM
EP
-W, J
uly
2003
(3
) H
unga
ry1.
81.
91.
01.
01.
06.
7E
ME
P-W
, Jul
y 20
03 I
cela
nd0.
30.
20.
5JP
/EP
Ire
land
1.1
0.5
0.5
2.1
JP/E
P I
taly
2.8
15.2
2.0
15.0
14.0
49JP
/EP
Lat
via
2.8
2.0
1.0
5.8
EM
EP
-W, J
uly
2003
Lith
uani
a0.
60.
70.
50.
52.
3E
ME
P-W
, Jul
y 20
03 L
uxem
burg
0.1
0.2
0.3
EM
EP
-W, J
uly
2003
Mon
aco
0E
ME
P-W
, Jul
y 20
03 N
ethe
rland
s1.
31.
32.
01.
05.
6E
ME
P-W
, Jul
y 20
03 N
orw
ay4.
83.
01.
08.
8E
ME
P-W
, Jul
y 20
03 P
olan
d18
.623
.43.
018
.021
.384
.3E
ME
P-W
, Jul
y 20
03 P
ortu
gal
3.1
1.0
1.0
5.1
JP/E
P R
epub
lic o
f Mol
dova
0.2
0.3
0.5
EM
EP
-W, J
uly
2003
(2
) R
oman
ia5.
36.
72.
06.
05.
025
JP/E
P R
ussi
an F
eder
atio
n93
.666
.420
.060
.090
.533
0.5
JP/E
P S
lova
kia
2.0
2.0
2.1
2.0
8.1
EM
EP
-W, J
uly
2003
Slo
veni
a1.
90.
50.
52.
9JP
/EP
Spa
in14
.411
.62.
013
.09.
150
.1E
ME
P-W
, Jul
y 20
03 S
wed
en0.
50.
53.
92.
06.
9E
ME
P-W
, Jul
y 20
03 S
witz
erla
nd3.
53.
55.
01.
013
JP/E
P T
FYR
of M
aced
onia
0.2
0.1
0.3
JP/E
P T
urke
y5.
25.
36.
04.
020
.5JP
/EP
Ukr
aine
169.
250
.814
.012
0.0
97.4
451.
4E
ME
P-W
, Jul
y 20
03
(1)
Uni
ted
Kin
gdom
33.0
6.0
3.0
20.0
7.4
69.4
EM
EP
-W, J
uly
2003
Yug
osla
via
14.3
2.7
2.0
10.0
6.5
35.5
JP/E
PEU
RO
PE55
8.2
267.
254
.040
8.7
0.0
369.
71,
657.
8
(1)
2001
yea
r
(2)
1999
yea
r
(3)
1996
yea
r
(4)
1995
yea
r

84
Tot
al N
i Em
issi
ons
from
Ant
hrop
ogen
ic S
ourc
es i
n E
urop
e, 2
000
(in
Tons
/Yea
r)
Coa
l Com
bust
ion
Cou
ntry
Pow
erR
esid
entia
l N
on-fe
rrou
s M
etal
Iron
&St
eel
Was
teO
ther
Tota
lR
efer
ence
sPl
ants
Hea
tM
anuf
actu
ring
Prod
uctio
nD
ispo
sal
Sour
ces
Alb
ania
7.0
1.0
8.0
JP/E
P A
ustri
a2.
44.
90.
27.
515
.0JP
/EP
Bel
arus
5.5
88.7
0.2
94.4
EM
EP
-W, J
uly
2003
Bel
gium
44.9
0.5
2.5
0.1
1.6
49.6
EM
EP
-W, J
uly
2003
Bos
nia-
Her
zego
vina
0.2
0.2
JP/E
P B
ulga
ria80
.780
.63.
712
.017
7.0
JP/E
P C
roat
ia11
.111
.20.
34.
026
.6E
ME
P-W
, Jul
y 20
03 C
ypru
s5.
05.
010
.0JP
/EP
Cze
ch R
epub
lic
6.0
6.0
2.0
1.5
15.5
EM
EP
-W, J
uly
2003
(1
) D
enm
ark
10.2
2.9
0.1
0.7
13.9
EM
EP
-W, J
uly
2003
Est
onia
4.7
1.2
2.0
7.9
EM
EP
-W, J
uly
2003
Fin
land
4.7
19.8
8.8
33.3
EM
EP
-W, J
uly
2003
Fra
nce
191.
313
.09.
42.
93.
522
0.1
EM
EP
-W, J
uly
2003
Ger
man
y
77.7
60.1
20.2
158.
0E
ME
P-W
, Jul
y 20
03
(4)
Gre
ece
43
.637
.61.
50.
318
.010
1.0
EM
EP
-W, J
uly
2003
(3
) H
unga
ry13
.815
.30.
41.
76.
037
.2E
ME
P-W
, Jul
y 20
03 I
cela
nd1.
11.
22.
44.
7JP
/EP
Ire
land
15.5
2.5
18.0
JP/E
P I
taly
70.4
388.
82.
48.
470
.054
0.0
JP/E
P L
atvi
a10
.11.
011
.1E
ME
P-W
, Jul
y 20
03 L
ithua
nia
12.1
12.0
2.5
26.6
EM
EP
-W, J
uly
2003
Lux
embu
rg0.
60.
10.
7E
ME
P-W
, Jul
y 20
03 M
onac
o0.
0E
ME
P-W
, Jul
y 20
03 N
ethe
rland
s21
.821
.90.
41.
00.
18.
053
.2E
ME
P-W
, Jul
y 20
03 N
orw
ay7.
04.
07.
018
.0JP
/EP
Pol
and
101.
612
7.8
2.0
20.0
251.
4E
ME
P-W
, Jul
y 20
03 P
ortu
gal
57.0
1.0
12.0
70.0
JP/E
P R
epub
lic o
f Mol
dova
1.
92.
30.
24.
4E
ME
P-W
, Jul
y 20
03
(2)
Rom
ania
16.6
21.4
25.0
1.0
64.0
JP/E
P R
ussi
an F
eder
atio
n48
2.5
342.
55.
020
.010
0.0
950.
0JP
/EP
Slo
vaki
a5.
85.
87.
02.
52.
523
.6E
ME
P-W
, Jul
y 20
03 S
love
nia
8.5
0.8
2.0
11.3
JP/E
P S
pain
119.
996
.71.
05.
010
0.0
322.
6E
ME
P-W
, Jul
y 20
03 S
wed
en4.
84.
84.
02.
215
.8E
ME
P-W
, Jul
y 20
03 S
witz
erla
nd4.
94.
80.
83.
514
.0JP
/EP
TFY
R o
f Mac
edon
ia3
3.0
1.0
7.0
JP/E
P T
urke
y10
1.3
101.
30.
415
.012
.023
0.0
JP/E
P U
krai
ne
161.
748
.50.
415
.012
.023
7.6
EM
EP
-W, J
uly
2003
(1
) U
nite
d Ki
ngdo
m10
1.0
18.3
1.0
4.0
1.0
125.
3E
ME
P-W
, Jul
y 20
03 Y
ugos
lavi
a31
.65.
91.
24.
37.
050
.0JP
/EP
EUR
OPE
1842
.51,
560.
348
.910
5.7
12.5
447.
14,
017.
0 (
1) 2
001
year
(
2) 1
999
year
(
3) 1
996
year
(
4) 1
995
year
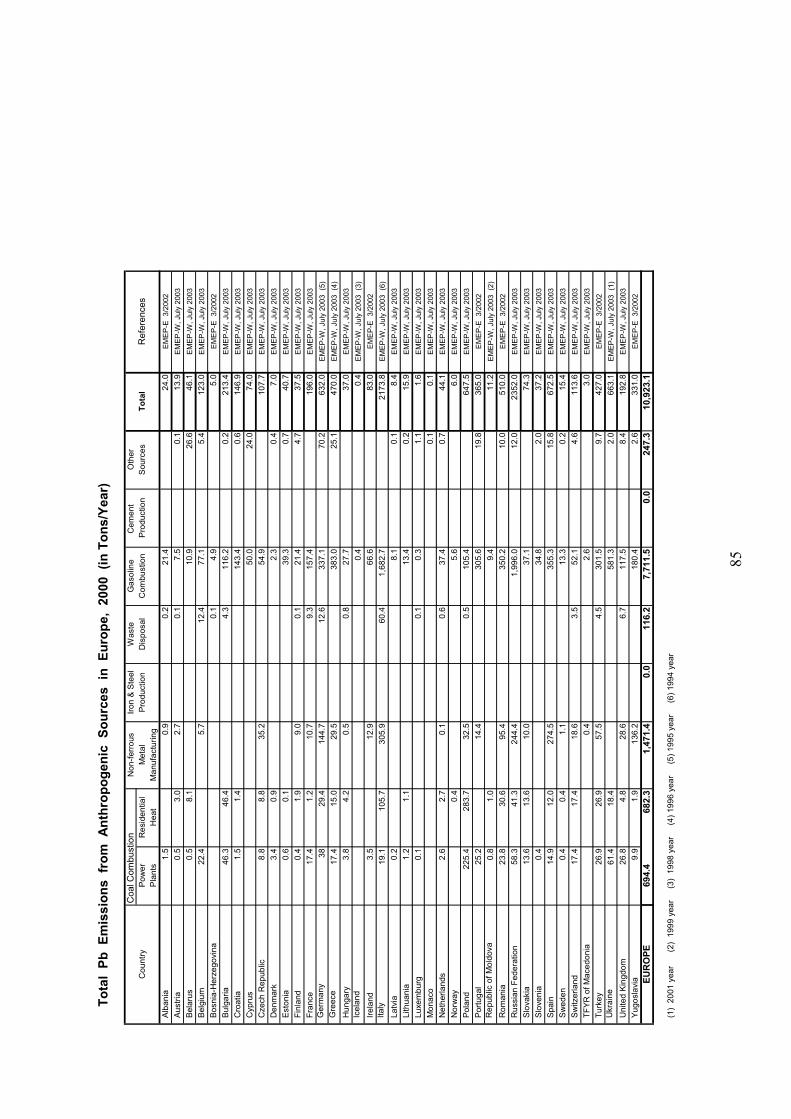
85
Tota
l Pb
Em
issi
ons
from
Ant
hrop
ogen
ic S
ourc
es i
n E
urop
e, 2
000
(in
Tons
/Yea
r)
Coa
l Com
bust
ion
Non
-ferr
ous
Iron
& S
teel
Was
teG
asol
ine
Cem
ent
Oth
erC
ount
ryPo
wer
Res
iden
tial
Met
alP
rodu
ctio
nD
ispo
sal
Com
bust
ion
Pro
duct
ion
Sou
rces
Tota
lR
efer
ence
sP
lant
sH
eat
Man
ufac
turin
g A
lban
ia1.
50.
90.
221
.424
.0E
ME
P-E
3/2
002
Aus
tria
0.5
3.0
2.7
0.1
7.5
0.1
13.9
EM
EP
-W, J
uly
2003
Bel
arus
0.
58.
110
.926
.646
.1E
ME
P-W
, Jul
y 20
03 B
elgi
um22
.45.
712
.477
.15.
412
3.0
EM
EP
-W, J
uly
2003
Bos
nia-
Her
zego
vina
0.
14.
95.
0E
ME
P-E
3/2
002
Bul
garia
46.3
46.4
4.3
116.
20.
221
3.4
EM
EP
-W, J
uly
2003
Cro
atia
1.
51.
414
3.4
0.6
146.
9E
ME
P-W
, Jul
y 20
03 C
ypru
s50
.024
.074
.0E
ME
P-W
, Jul
y 20
03 C
zech
Rep
ublic
8.8
8.8
35.2
54.9
107.
7E
ME
P-W
, Jul
y 20
03 D
enm
ark
3.4
0.9
2.3
0.4
7.0
EM
EP
-W, J
uly
2003
Est
onia
0.6
0.1
39.3
0.7
40.7
EM
EP
-W, J
uly
2003
Fin
land
0.4
1.9
9.0
0.1
21.4
4.7
37.5
EM
EP
-W, J
uly
2003
Fra
nce
17.4
1.2
10.7
9.3
157.
419
6.0
EM
EP
-W, J
uly
2003
Ger
man
y
3829
.414
4.7
12.6
337.
170
.263
2.0
EM
EP
-W, J
uly
2003
(5)
Gre
ece
17
.415
.029
.538
3.0
25.1
470.
0E
ME
P-W
, Jul
y 20
03 (
4) H
unga
ry3.
84.
20.
50.
827
.737
.0E
ME
P-W
, Jul
y 20
03 I
cela
nd
0.4
0.4
EM
EP
-W, J
uly
2003
(3)
Ire
land
3.
512
.966
.683
.0E
ME
P-E
3/2
002
Ita
ly
19.1
105.
730
5.9
60.4
1,68
2.7
2173
.8E
ME
P-W
, Jul
y 20
03 (
6) L
atvi
a0.
28.
10.
18.
4E
ME
P-W
, Jul
y 20
03 L
ithua
nia
1.
21.
113
.40.
215
.9E
ME
P-W
, Jul
y 20
03 L
uxem
burg
0.1
0.1
0.3
1.1
1.6
EM
EP
-W, J
uly
2003
Mon
aco
0.1
0.1
EM
EP
-W, J
uly
2003
Net
herla
nds
2.
62.
70.
10.
637
.40.
744
.1E
ME
P-W
, Jul
y 20
03 N
orw
ay0.
45.
66.
0E
ME
P-W
, Jul
y 20
03 P
olan
d22
5.4
283.
732
.50.
510
5.4
647.
5E
ME
P-W
, Jul
y 20
03 P
ortu
gal
25
.214
.430
5.6
19.8
365.
0E
ME
P-E
3/2
002
Rep
ublic
of M
oldo
va
0.
81.
09.
411
.2E
ME
P-W
, Jul
y 20
03 (
2) R
oman
ia
23.8
30.6
95.4
350.
210
.051
0.0
EM
EP
-E 3
/200
2 R
ussi
an F
eder
atio
n58
.341
.324
4.4
1,99
6.0
12.0
2352
.0E
ME
P-W
, Jul
y 20
03 S
lova
kia
13.6
13.6
10.0
37.1
74.3
EM
EP
-W, J
uly
2003
Slo
veni
a0.
434
.82.
037
.2E
ME
P-W
, Jul
y 20
03 S
pain
14.9
12.0
274.
535
5.3
15.8
672.
5E
ME
P-W
, Jul
y 20
03 S
wed
en0.
40.
41.
113
.30.
215
.4E
ME
P-W
, Jul
y 20
03 S
witz
erla
nd17
.417
.418
.63.
552
.14.
611
3.6
EM
EP
-W, J
uly
2003
TFY
R o
f Mac
edon
ia0.
42.
63.
0E
ME
P-W
, Jul
y 20
03 T
urke
y
26.9
26.9
57.5
4.5
301.
59.
742
7.0
EM
EP
-E 3
/200
2 U
krai
ne
61.4
18.4
581.
32.
066
3.1
EM
EP
-W, J
uly
2003
(1)
Uni
ted
Kin
gdom
26.8
4.8
28.6
6.7
117.
58.
419
2.8
EM
EP
-W, J
uly
2003
Yug
osla
via
9.
91.
913
6.2
180.
42.
633
1.0
EM
EP
-E 3
/200
2EU
RO
PE69
4.4
682.
31,
471.
40.
011
6.2
7,71
1.5
0.0
247.
310
,923
.1
(1)
200
1 ye
ar
(2
) 19
99 y
ear
(3
) 19
98 y
ear
(4
) 199
6 ye
ar
(5)
199
5 ye
ar
(6)
199
4 ye
ar

86
T
otal
As
Em
issi
ons
from
Ant
hrop
ogen
ic S
ourc
es i
n E
urop
e, 2
000
(in
Tons
/Yea
r)C
ount
ryFu
el C
omba
stio
nIn
d. R
esid
.&C
om.b
oile
rsIro
n &
Ste
el
C
emen
tN
on-fe
rrou
sW
aste
O
ther
Tota
lC
oal
Oil
Coa
lO
ilPr
oduc
tion
Prod
uctio
nM
etal
Dis
posa
lSo
urce
s A
lban
ia0.
090.
010.
040.
090.
040.
020.
100.
39 A
ustri
a0.
250.
061.
841.
680.
710.
382.
500.
407.
82 B
elar
us
0.36
0.03
0.24
0.81
0.75
0.19
0.10
2.48
Bel
gium
0.61
0.04
4.13
3.26
5.82
0.80
0.50
0.60
15.7
6 B
osni
a-H
erze
govi
na1.
320.
020.
880.
090.
040.
032.
38 B
ulga
ria2.
520.
031.
680.
441.
010.
221.
807.
70 C
roat
ia0.
180.
090.
160.
450.
040.
290.
601.
81 C
ypru
s0.
000.
130.
030.
220.
000.
140.
100.
62 C
zech
Rep
ublic
8.
420.
036.
091.
111.
310.
410.
700.
4018
.47
Den
mar
k0.
740.
200.
261.
160.
010.
260.
102.
73 E
ston
ia1.
320.
000.
620.
080.
000.
034.
006.
05 F
inla
nd0.
630.
021.
501.
382.
050.
141.
707.
42 F
ranc
e1.
270.
247.
0513
.01
10.5
02.
000.
800.
6035
.47
Ger
man
y
13.0
50.
2612
.56
19.2
24.
943.
814.
2058
.04
Gre
ece
1.
650.
320.
652.
070.
531.
421.
500.
508.
64 H
unga
ry1.
720.
160.
880.
880.
990.
331.
001.
006.
96 I
cela
nd0.
000.
000.
050.
090.
000.
010.
15 I
rela
nd0.
380.
160.
581.
000.
190.
260.
102.
67 I
taly
1.17
3.02
5.46
10.3
213
.31
3.83
0.20
1.00
38.3
1 L
atvi
a0.
020.
010.
100.
170.
250.
100.
65 L
ithua
nia
0.00
0.02
0.08
0.33
0.00
0.06
0.10
0.59
Lux
embu
rg0.
000.
000.
100.
341.
290.
081.
81 M
onac
o0.
00 N
ethe
rland
s1.
030.
142.
264.
122.
840.
350.
200.
100.
2011
.24
Nor
way
0.00
0.00
0.72
1.77
0.00
0.19
0.30
1.70
4.68
Pol
and
20.8
70.
0317
.25
3.00
5.25
1.51
12.0
01.
4061
.31
Por
tuga
l0.
640.
300.
481.
960.
001.
011.
105.
49 R
epub
lic o
f Mol
dova
0.
040.
020.
020.
050.
000.
020.
15 R
oman
ia2.
760.
351.
760.
902.
340.
842.
0010
.95
Rus
sian
Fed
erat
ion
35.0
20.
7328
.94
14.2
527
.76
3.24
33.0
040
.10
183.
04 S
lova
kia
0.81
0.01
2.32
0.64
0.01
0.31
2.00
2.00
8.10
Slo
veni
a0.
750.
000.
070.
350.
000.
130.
200.
301.
80 S
pain
3.66
0.78
1.89
8.70
0.01
3.82
17.0
08.
3044
.16
Sw
eden
0.10
0.04
1.69
2.11
1.79
0.26
0.70
0.10
6.79
Sw
itzer
land
0.06
0.37
0.64
1.20
0.57
0.36
3.20
TFY
R o
f Mac
edon
ia0.
090.
020.
560.
110.
080.
080.
94 T
urke
y9.
601.
016.
403.
006.
343.
621.
001.
0031
.97
Ukr
aine
16
.25
0.17
13.4
21.
2015
.89
0.53
50.0
020
.10
117.
56 U
nite
d K
ingd
om5.
540.
176.
5811
.93
7.51
1.28
3.00
0.30
1.00
37.3
1 Y
ugos
lavi
a3.
000.
082.
000.
300.
501.
507.
38TO
TAL
EUR
OPE
135.
929.
0713
1.98
113.
7911
4.17
32.2
613
2.30
1.50
92.0
076
2.99
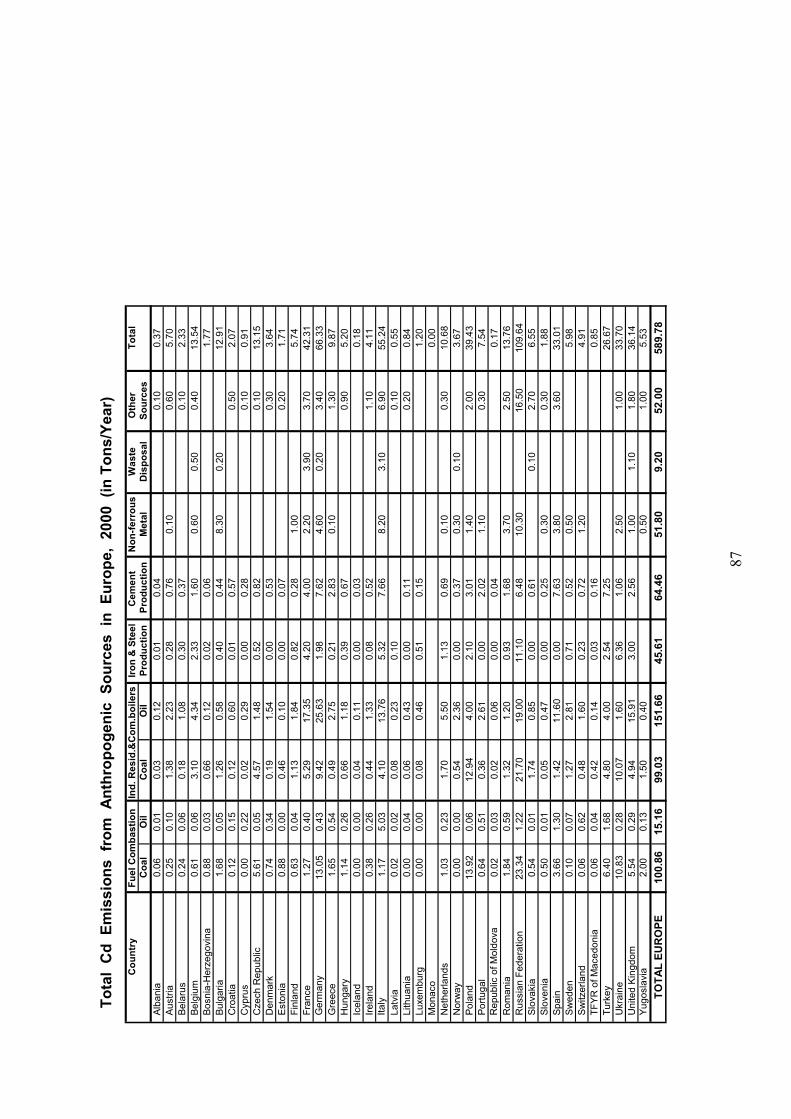
87
T
otal
Cd
Em
issi
ons
from
Ant
hrop
ogen
ic S
ourc
es i
n E
urop
e, 2
000
(in
Tons
/Yea
r)C
ount
ryFu
el C
omba
stio
nIn
d. R
esid
.&C
om.b
oile
rsIro
n &
Ste
el
Cem
ent
Non
-ferr
ous
Was
te
Oth
erTo
tal
Coa
lO
ilC
oal
Oil
Prod
uctio
nPr
oduc
tion
Met
alD
ispo
sal
Sour
ces
Alb
ania
0.
060.
010.
030.
120.
010.
040.
100.
37 A
ustri
a
0.25
0.10
1.38
2.23
0.28
0.76
0.10
0.60
5.70
Bel
arus
0.
240.
060.
181.
080.
300.
370.
102.
33 B
elgi
um0.
610.
063.
104.
342.
331.
600.
600.
500.
4013
.54
Bos
nia-
Her
zego
vina
0.88
0.03
0.66
0.12
0.02
0.06
1.77
Bul
garia
1.68
0.05
1.26
0.58
0.40
0.44
8.30
0.20
12.9
1 C
roat
ia0.
120.
150.
120.
600.
010.
570.
502.
07 C
ypru
s0.
000.
220.
020.
290.
000.
280.
100.
91 C
zech
Rep
ublic
5.61
0.05
4.57
1.48
0.52
0.82
0.10
13.1
5 D
enm
ark
0.74
0.34
0.19
1.54
0.00
0.53
0.30
3.64
Est
onia
0.88
0.00
0.46
0.10
0.00
0.07
0.20
1.71
Fin
land
0.63
0.04
1.13
1.84
0.82
0.28
1.00
5.74
Fra
nce
1.27
0.40
5.29
17.3
54.
204.
002.
203.
903.
7042
.31
Ger
man
y
13.0
50.
439.
4225
.63
1.98
7.62
4.60
0.20
3.40
66.3
3 G
reec
e
1.65
0.54
0.49
2.75
0.21
2.83
0.10
1.30
9.87
Hun
gary
1.14
0.26
0.66
1.18
0.39
0.67
0.90
5.20
Ice
land
0.00
0.00
0.04
0.11
0.00
0.03
0.18
Ire
land
0.38
0.26
0.44
1.33
0.08
0.52
1.10
4.11
Ita
ly
1.
175.
034.
1013
.76
5.32
7.66
8.20
3.10
6.90
55.2
4 L
atvi
a0.
020.
020.
080.
230.
100.
100.
55 L
ithua
nia
0.00
0.04
0.06
0.43
0.00
0.11
0.20
0.84
Lux
embu
rg0.
000.
000.
080.
460.
510.
151.
20 M
onac
o0.
00 N
ethe
rland
s1.
030.
231.
705.
501.
130.
690.
100.
3010
.68
Nor
way
0.00
0.00
0.54
2.36
0.00
0.37
0.30
0.10
3.67
Pol
and
13.9
20.
0612
.94
4.00
2.10
3.01
1.40
2.00
39.4
3 P
ortu
gal
0.64
0.51
0.36
2.61
0.00
2.02
1.10
0.30
7.54
Rep
ublic
of M
oldo
va
0.02
0.03
0.02
0.06
0.00
0.04
0.17
Rom
ania
1.84
0.59
1.32
1.20
0.93
1.68
3.70
2.50
13.7
6 R
ussi
an F
eder
atio
n23
.34
1.22
21.7
019
.00
11.1
06.
4810
.30
16.5
010
9.64
Slo
vaki
a0.
540.
011.
740.
850.
000.
610.
102.
706.
55 S
love
nia
0.50
0.01
0.05
0.47
0.00
0.25
0.30
0.30
1.88
Spa
in3.
661.
301.
4211
.60
0.00
7.63
3.80
3.60
33.0
1 S
wed
en0.
100.
071.
272.
810.
710.
520.
505.
98 S
witz
erla
nd0.
060.
620.
481.
600.
230.
721.
204.
91 T
FYR
of M
aced
onia
0.06
0.04
0.42
0.14
0.03
0.16
0.85
Tur
key
6.40
1.68
4.80
4.00
2.54
7.25
26.6
7 U
krai
ne
10.8
30.
2810
.07
1.60
6.36
1.06
2.50
1.00
33.7
0 U
nite
d K
ingd
om5.
540.
294.
9415
.91
3.00
2.56
1.00
1.10
1.80
36.1
4 Y
ugos
lavi
a2.
000.
131.
500.
400.
501.
005.
53TO
TAL
EUR
OPE
100.
8615
.16
99.0
315
1.66
45.6
164
.46
51.8
09.
2052
.00
589.
78
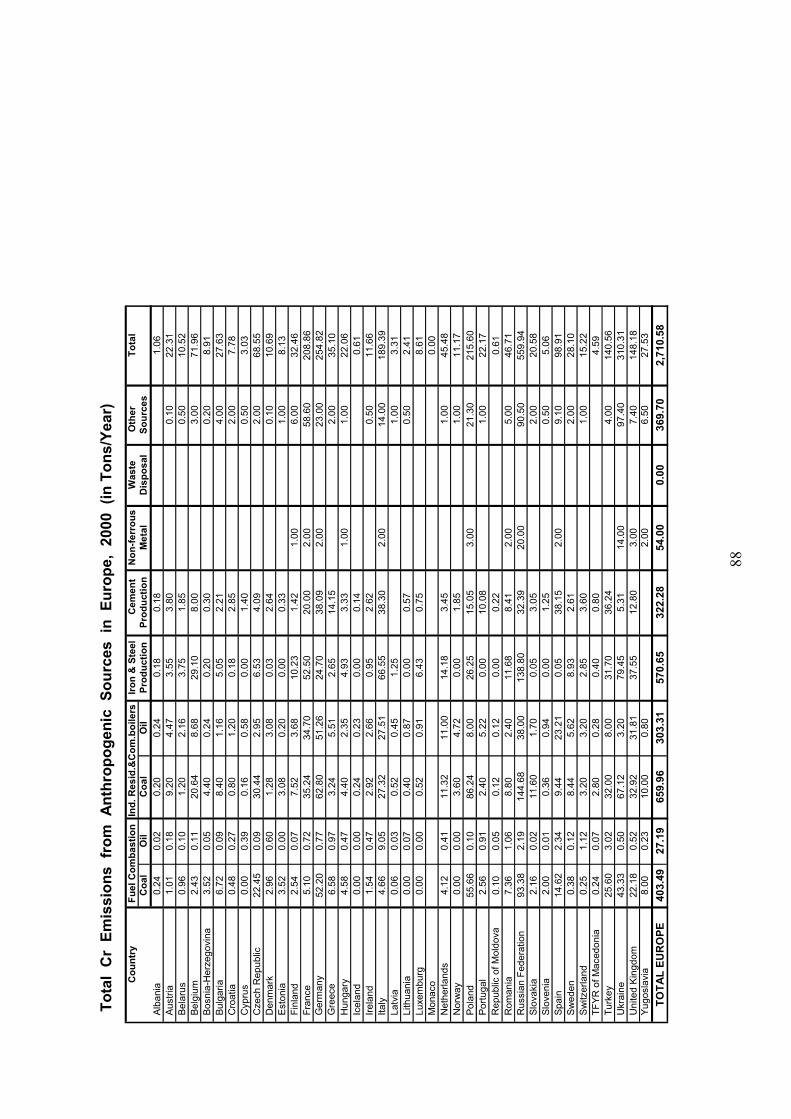
88
To
tal
Cr
Emis
sion
s fr
om A
nthr
opog
enic
Sou
rces
in
Eur
ope,
200
0 (i
n To
ns/Y
ear)
Cou
ntry
Fuel
Com
bast
ion
Ind.
Res
id.&
Com
.boi
lers
Iron
& S
teel
Cem
ent
Non
-ferr
ous
Was
te
Oth
erTo
tal
Coa
lO
ilC
oal
Oil
Prod
uctio
nPr
oduc
tion
Met
alD
ispo
sal
Sour
ces
Alb
ania
0.24
0.02
0.20
0.24
0.18
0.18
1.06
Aus
tria
1.01
0.18
9.20
4.47
3.55
3.80
0.10
22.3
1 B
elar
us0.
960.
101.
202.
163.
751.
850.
5010
.52
Bel
gium
2.43
0.11
20.6
48.
6829
.10
8.00
3.00
71.9
6 B
osni
a-H
erze
govi
na3.
520.
054.
400.
240.
200.
300.
208.
91 B
ulga
ria6.
720.
098.
401.
165.
052.
214.
0027
.63
Cro
atia
0.48
0.27
0.80
1.20
0.18
2.85
2.00
7.78
Cyp
rus
0.00
0.39
0.16
0.58
0.00
1.40
0.50
3.03
Cze
ch R
epub
lic
22.4
50.
0930
.44
2.95
6.53
4.09
2.00
68.5
5 D
enm
ark
2.96
0.60
1.28
3.08
0.03
2.64
0.10
10.6
9 E
ston
ia3.
520.
003.
080.
200.
000.
331.
008.
13 F
inla
nd2.
540.
077.
523.
6810
.23
1.42
1.00
6.00
32.4
6 F
ranc
e5.
100.
7235
.24
34.7
052
.50
20.0
02.
0058
.60
208.
86 G
erm
any
52
.20
0.77
62.8
051
.26
24.7
038
.09
2.00
23.0
025
4.82
Gre
ece
6.
580.
973.
245.
512.
6514
.15
2.00
35.1
0 H
unga
ry4.
580.
474.
402.
354.
933.
331.
001.
0022
.06
Ice
land
0.00
0.00
0.24
0.23
0.00
0.14
0.61
Ire
land
1.54
0.47
2.92
2.66
0.95
2.62
0.50
11.6
6 I
taly
4.66
9.05
27.3
227
.51
66.5
538
.30
2.00
14.0
018
9.39
Lat
via
0.06
0.03
0.52
0.45
1.25
1.00
3.31
Lith
uani
a0.
000.
070.
400.
870.
000.
570.
502.
41 L
uxem
burg
0.00
0.00
0.52
0.91
6.43
0.75
8.61
Mon
aco
0.00
Net
herla
nds
4.12
0.41
11.3
211
.00
14.1
83.
451.
0045
.48
Nor
way
0.00
0.00
3.60
4.72
0.00
1.85
1.00
11.1
7 P
olan
d55
.66
0.10
86.2
48.
0026
.25
15.0
53.
0021
.30
215.
60 P
ortu
gal
2.56
0.91
2.40
5.22
0.00
10.0
81.
0022
.17
Rep
ublic
of M
oldo
va
0.
100.
050.
120.
120.
000.
220.
61 R
oman
ia7.
361.
068.
802.
4011
.68
8.41
2.00
5.00
46.7
1 R
ussi
an F
eder
atio
n93
.38
2.19
144.
6838
.00
138.
8032
.39
20.0
090
.50
559.
94 S
lova
kia
2.16
0.02
11.6
01.
700.
053.
052.
0020
.58
Slo
veni
a2.
000.
010.
360.
940.
001.
250.
505.
06 S
pain
14.6
22.
349.
4423
.21
0.05
38.1
52.
009.
1098
.91
Sw
eden
0.38
0.12
8.44
5.62
8.93
2.61
2.00
28.1
0 S
witz
erla
nd0.
251.
123.
203.
202.
853.
601.
0015
.22
TFY
R o
f Mac
edon
ia0.
240.
072.
800.
280.
400.
804.
59 T
urke
y25
.60
3.02
32.0
08.
0031
.70
36.2
44.
0014
0.56
Ukr
aine
43.3
30.
5067
.12
3.20
79.4
55.
3114
.00
97.4
031
0.31
Uni
ted
Kin
gdom
22.1
80.
5232
.92
31.8
137
.55
12.8
03.
007.
4014
8.18
Yug
osla
via
8.00
0.23
10.0
00.
802.
006.
5027
.53
TOTA
L EU
RO
PE40
3.49
27.1
965
9.96
303.
3157
0.65
322.
2854
.00
0.00
369.
702,
710.
58
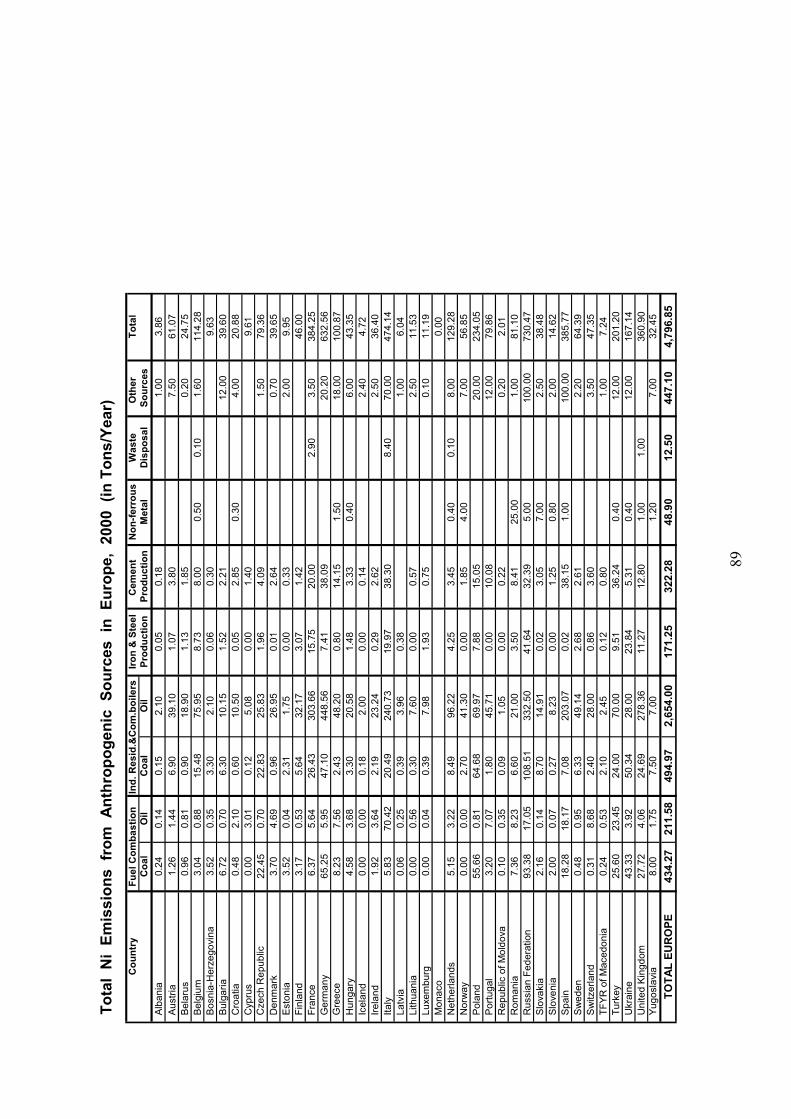
89
Tot
al N
i Em
issi
ons
from
Ant
hrop
ogen
ic S
ourc
es i
n E
urop
e, 2
000
(in
Tons
/Yea
r)C
ount
ryFu
el C
omba
stio
nIn
d. R
esid
.&C
om.b
oile
rsIro
n &
Ste
el
Cem
ent
Non
-ferr
ous
Was
te
Oth
erTo
tal
Coa
lO
ilC
oal
Oil
Prod
uctio
nPr
oduc
tion
Met
alD
ispo
sal
Sour
ces
Alb
ania
0.24
0.14
0.15
2.10
0.05
0.18
1.00
3.86
Aus
tria
1.26
1.44
6.90
39.1
01.
073.
807.
5061
.07
Bel
arus
0.96
0.81
0.90
18.9
01.
131.
850.
2024
.75
Bel
gium
3.04
0.88
15.4
875
.95
8.73
8.00
0.50
0.10
1.60
114.
28 B
osni
a-H
erze
govi
na3.
520.
353.
302.
100.
060.
309.
63 B
ulga
ria6.
720.
706.
3010
.15
1.52
2.21
12.0
039
.60
Cro
atia
0.48
2.10
0.60
10.5
00.
052.
850.
304.
0020
.88
Cyp
rus
0.00
3.01
0.12
5.08
0.00
1.40
9.61
Cze
ch R
epub
lic
22.4
50.
7022
.83
25.8
31.
964.
091.
5079
.36
Den
mar
k3.
704.
690.
9626
.95
0.01
2.64
0.70
39.6
5 E
ston
ia3.
520.
042.
311.
750.
000.
332.
009.
95 F
inla
nd3.
170.
535.
6432
.17
3.07
1.42
46.0
0 F
ranc
e6.
375.
6426
.43
303.
6615
.75
20.0
02.
903.
5038
4.25
Ger
man
y
65.2
55.
9547
.10
448.
567.
4138
.09
20.2
063
2.56
Gre
ece
8.
237.
562.
4348
.20
0.80
14.1
51.
5018
.00
100.
87 H
unga
ry4.
583.
683.
3020
.58
1.48
3.33
0.40
6.00
43.3
5 I
cela
nd0.
000.
000.
182.
000.
000.
142.
404.
72 I
rela
nd1.
923.
642.
1923
.24
0.29
2.62
2.50
36.4
0 I
taly
5.83
70.4
220
.49
240.
7319
.97
38.3
08.
4070
.00
474.
14 L
atvi
a0.
060.
250.
393.
960.
381.
006.
04 L
ithua
nia
0.00
0.56
0.30
7.60
0.00
0.57
2.50
11.5
3 L
uxem
burg
0.00
0.04
0.39
7.98
1.93
0.75
0.10
11.1
9 M
onac
o0.
00 N
ethe
rland
s5.
153.
228.
4996
.22
4.25
3.45
0.40
0.10
8.00
129.
28 N
orw
ay0.
000.
002.
7041
.30
0.00
1.85
4.00
7.00
56.8
5 P
olan
d55
.66
0.81
64.6
869
.97
7.88
15.0
520
.00
234.
05 P
ortu
gal
3.20
7.07
1.80
45.7
10.
0010
.08
12.0
079
.86
Rep
ublic
of M
oldo
va
0.10
0.35
0.09
1.05
0.00
0.22
0.20
2.01
Rom
ania
7.36
8.23
6.60
21.0
03.
508.
4125
.00
1.00
81.1
0 R
ussi
an F
eder
atio
n93
.38
17.0
510
8.51
332.
5041
.64
32.3
95.
0010
0.00
730.
47 S
lova
kia
2.16
0.14
8.70
14.9
10.
023.
057.
002.
5038
.48
Slo
veni
a2.
000.
070.
278.
230.
001.
250.
802.
0014
.62
Spa
in18
.28
18.1
77.
0820
3.07
0.02
38.1
51.
0010
0.00
385.
77 S
wed
en0.
480.
956.
3349
.14
2.68
2.61
2.20
64.3
9 S
witz
erla
nd0.
318.
682.
4028
.00
0.86
3.60
3.50
47.3
5 T
FYR
of M
aced
onia
0.24
0.53
2.10
2.45
0.12
0.80
1.00
7.24
Tur
key
25.6
023
.45
24.0
070
.00
9.51
36.2
40.
4012
.00
201.
20 U
krai
ne
43.3
33.
9250
.34
28.0
023
.84
5.31
0.40
12.0
016
7.14
Uni
ted
Kin
gdom
27.7
24.
0624
.69
278.
3611
.27
12.8
01.
001.
0036
0.90
Yug
osla
via
8.00
1.75
7.50
7.00
1.20
7.00
32.4
5TO
TAL
EUR
OPE
434.
2721
1.58
494.
972,
654.
0017
1.25
322.
2848
.90
12.5
044
7.10
4,79
6.85

90
Tota
l Pb
Em
issi
ons
from
Ant
hrop
ogen
ic S
ourc
es i
n E
urop
e, 2
000
(in
Tons
/Yea
r)C
ount
ryFu
el C
omba
stio
nIn
d. R
esid
.&C
om.b
oile
rsIro
n &
Ste
el
Cem
ent
Non
-ferr
ous
Was
teG
asol
ine
O
ther
Tota
lC
oal
Oil
Coa
lO
ilPr
oduc
tion
Prod
uctio
nM
etal
Dis
posa
lC
ombu
stio
nSo
urce
s A
lban
ia0.
300.
020.
190.
360.
700.
360.
900.
2021
.40
24.4
3 A
ustri
a1.
260.
258.
746.
7014
.20
7.60
2.70
0.10
22.4
00.
1064
.05
Bel
arus
1.
200.
141.
143.
2415
.00
3.70
95.7
026
.60
146.
72 B
elgi
um3.
040.
1519
.61
13.0
211
6.40
16.0
05.
7012
.40
77.1
05.
4026
8.82
Bos
nia-
Her
zego
vina
4.
400.
064.
180.
360.
800.
600.
104.
9015
.40
Bul
garia
8.40
0.12
7.98
1.74
20.2
04.
424.
3011
6.20
0.20
163.
56 C
roat
ia
0.60
0.36
0.76
1.80
0.70
5.70
143.
400.
6015
3.92
Cyp
rus
0.00
0.52
0.15
0.87
0.00
2.80
12.3
024
.00
40.6
4 C
zech
Rep
ublic
28.0
60.
1228
.92
4.43
26.1
08.
1835
.20
54.9
018
5.91
Den
mar
k3.
700.
801.
224.
620.
105.
2822
.40
0.40
38.5
2 E
ston
ia4.
400.
012.
930.
300.
000.
6612
.30
0.70
21.3
0 F
inla
nd3.
170.
097.
145.
5140
.90
2.84
9.00
0.10
21.4
04.
7094
.85
Fra
nce
6.37
0.97
33.4
852
.06
210.
0040
.00
10.7
09.
3015
7.40
520.
28 G
erm
any
65
.25
1.02
59.6
676
.90
98.8
076
.18
144.
7012
.60
337.
1070
.20
942.
41 G
reec
e
8.23
1.30
3.08
8.26
10.6
028
.30
29.5
019
6.80
25.1
031
1.17
Hun
gary
5.72
0.63
4.18
3.53
19.7
06.
660.
500.
8027
.70
69.4
2 I
cela
nd
0.00
0.00
0.23
0.34
0.00
0.28
0.40
1.25
Ire
land
1.
920.
622.
773.
983.
805.
2412
.90
66.6
097
.83
Ita
ly
5.83
12.0
725
.95
41.2
726
6.20
76.6
030
5.90
60.4
01,
125.
0019
19.2
2 L
atvi
a0.
080.
040.
490.
685.
008.
100.
1014
.49
Lith
uani
a
0.00
0.10
0.38
1.30
0.00
1.14
13.4
00.
2016
.52
Lux
embu
rg0.
000.
010.
491.
3725
.70
1.50
0.10
0.30
1.10
30.5
7 M
onac
o0.
100.
10 N
ethe
rland
s
5.15
0.55
10.7
516
.49
56.7
06.
900.
100.
6085
.10
0.70
183.
04 N
orw
ay0.
000.
003.
427.
080.
003.
7019
.00
33.2
0 P
olan
d69
.58
0.14
81.9
311
.99
105.
0030
.10
32.5
00.
5010
5.40
437.
14 P
ortu
gal
3.
201.
212.
287.
840.
0020
.16
14.4
012
9.20
19.8
019
8.09
Rep
ublic
of M
oldo
va
0.
120.
060.
110.
180.
000.
449.
4010
.31
Rom
ania
9.
201.
418.
363.
6046
.70
16.8
295
.40
350.
2010
.00
541.
69 R
ussi
an F
eder
atio
n11
6.72
2.92
137.
4557
.00
555.
2064
.78
244.
4019
96.0
012
.00
3186
.47
Slo
vaki
a2.
700.
0211
.02
2.56
0.20
6.10
10.0
037
.10
69.7
0 S
love
nia
2.50
0.01
0.34
1.41
0.00
2.50
34.8
02.
0043
.56
Spa
in18
.28
3.11
8.97
34.8
10.
2076
.30
274.
5035
5.30
15.8
078
7.27
Sw
eden
0.48
0.16
8.02
8.42
35.7
05.
221.
1045
.90
0.20
105.
20 S
witz
erla
nd0.
311.
493.
044.
8011
.40
7.20
18.6
03.
5052
.10
4.60
107.
04 T
FYR
of M
aced
onia
0.30
0.09
2.66
0.42
1.60
1.60
0.40
2.60
9.67
Tur
key
32
.00
4.02
30.4
012
.00
126.
8072
.48
57.5
04.
5030
1.50
9.70
650.
90 U
krai
ne
54.1
60.
6763
.76
4.80
317.
8010
.62
287.
102.
0074
0.91
Uni
ted
Kin
gdom
27.7
20.
7031
.27
47.7
215
0.20
25.6
028
.60
6.70
244.
208.
4057
1.11
Yug
osla
via
10
.00
0.30
9.50
1.20
136.
2018
0.40
2.60
340.
20TO
TAL
EUR
OPE
504.
3536
.26
626.
9545
4.96
2,28
2.40
644.
561,
471.
4011
6.20
6,77
2.50
247.
3013
,156
.88
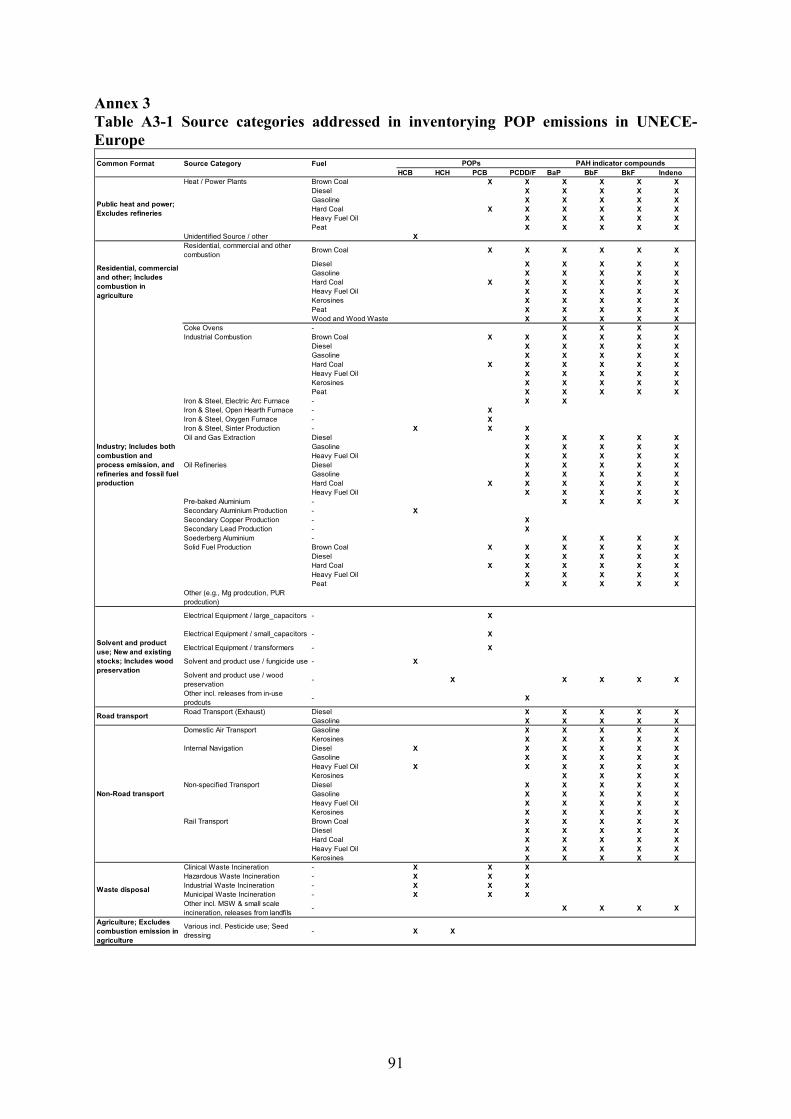
91
Annex 3 Table A3-1 Source categories addressed in inventorying POP emissions in UNECE-Europe Common Format Source Category Fuel
HCB HCH PCB PCDD/F BaP BbF BkF IndenoHeat / Power Plants Brown Coal X X X X X X
Diesel X X X X XGasoline X X X X XHard Coal X X X X X XHeavy Fuel Oil X X X X XPeat X X X X X
Unidentified Source / other X Residential, commercial and other combustion
Brown Coal X X X X X X
Diesel X X X X XGasoline X X X X XHard Coal X X X X X XHeavy Fuel Oil X X X X XKerosines X X X X XPeat X X X X XWood and Wood Waste X X X X X
Coke Ovens - X X X XIndustrial Combustion Brown Coal X X X X X X
Diesel X X X X XGasoline X X X X XHard Coal X X X X X XHeavy Fuel Oil X X X X XKerosines X X X X XPeat X X X X X
Iron & Steel, Electric Arc Furnace - X X Iron & Steel, Open Hearth Furnace - X Iron & Steel, Oxygen Furnace - X Iron & Steel, Sinter Production - X X X Oil and Gas Extraction Diesel X X X X X
Gasoline X X X X XHeavy Fuel Oil X X X X X
Oil Refineries Diesel X X X X XGasoline X X X X XHard Coal X X X X X XHeavy Fuel Oil X X X X X
Pre-baked Aluminium - X X X XSecondary Aluminium Production - X Secondary Copper Production - X Secondary Lead Production - X Soederberg Aluminium - X X X XSolid Fuel Production Brown Coal X X X X X X
Diesel X X X X XHard Coal X X X X X XHeavy Fuel Oil X X X X XPeat X X X X X
Other (e.g., Mg prodcution, PUR prodcution)
Electrical Equipment / large_capacitors - X
Electrical Equipment / small_capacitors - X
Electrical Equipment / transformers - X
Solvent and product use / fungicide use - X
Solvent and product use / wood preservation - X X X X X
Other incl. releases from in-use prodcuts - X
Road Transport (Exhaust) Diesel X X X X XGasoline X X X X X
Domestic Air Transport Gasoline X X X X XKerosines X X X X X
Internal Navigation Diesel X X X X X XGasoline X X X X XHeavy Fuel Oil X X X X X XKerosines X X X X
Non-specified Transport Diesel X X X X XGasoline X X X X XHeavy Fuel Oil X X X X XKerosines X X X X X
Rail Transport Brown Coal X X X X XDiesel X X X X XHard Coal X X X X XHeavy Fuel Oil X X X X XKerosines X X X X X
Clinical Waste Incineration - X X X Hazardous Waste Incineration - X X X Industrial Waste Incineration - X X X Municipal Waste Incineration - X X X Other incl. MSW & small scale incineration, releases from landfils - X X X X
Agriculture; Excludes combustion emission in agriculture
Various incl. Pesticide use; Seed dressing - X X
Road transport
Non-Road transport
Waste disposal
PAH indicator compoundsPOPs
Public heat and power; Excludes refineries
Residential, commercial and other; Includes combustion in agriculture
Industry; Includes both combustion and process emission, and refineries and fossil fuel production
Solvent and product use; New and existing stocks; Includes wood preservation
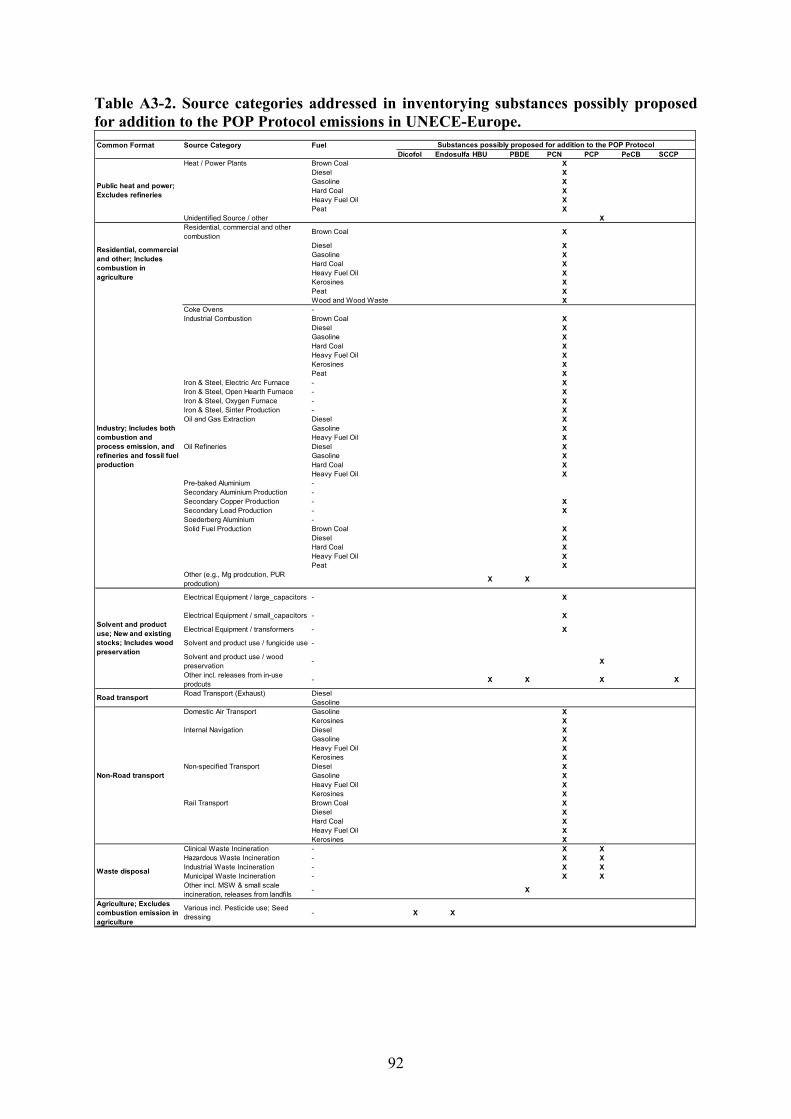
92
Table A3-2. Source categories addressed in inventorying substances possibly proposed for addition to the POP Protocol emissions in UNECE-Europe. Common Format Source Category Fuel
Dicofol EndosulfanHBU PBDE PCN PCP PeCB SCCPHeat / Power Plants Brown Coal X
Diesel X Gasoline X Hard Coal X Heavy Fuel Oil X Peat X
Unidentified Source / other X Residential, commercial and other combustion
Brown Coal X
Diesel X Gasoline X Hard Coal X Heavy Fuel Oil X Kerosines X Peat X Wood and Wood Waste X
Coke Ovens - Industrial Combustion Brown Coal X
Diesel X Gasoline X Hard Coal X Heavy Fuel Oil X Kerosines X Peat X
Iron & Steel, Electric Arc Furnace - X Iron & Steel, Open Hearth Furnace - X Iron & Steel, Oxygen Furnace - X Iron & Steel, Sinter Production - X Oil and Gas Extraction Diesel X
Gasoline X Heavy Fuel Oil X
Oil Refineries Diesel X Gasoline X Hard Coal X Heavy Fuel Oil X
Pre-baked Aluminium - Secondary Aluminium Production - Secondary Copper Production - X Secondary Lead Production - X Soederberg Aluminium - Solid Fuel Production Brown Coal X
Diesel X Hard Coal X Heavy Fuel Oil X Peat X
Other (e.g., Mg prodcution, PUR prodcution) X X
Electrical Equipment / large_capacitors - X
Electrical Equipment / small_capacitors - X
Electrical Equipment / transformers - X
Solvent and product use / fungicide use -
Solvent and product use / wood preservation - X
Other incl. releases from in-use prodcuts - X X X X
Road Transport (Exhaust) Diesel Gasoline
Domestic Air Transport Gasoline X Kerosines X
Internal Navigation Diesel X Gasoline X Heavy Fuel Oil X Kerosines X
Non-specified Transport Diesel X Gasoline X Heavy Fuel Oil X Kerosines X
Rail Transport Brown Coal X Diesel X Hard Coal X Heavy Fuel Oil X Kerosines X
Clinical Waste Incineration - X X Hazardous Waste Incineration - X X Industrial Waste Incineration - X X Municipal Waste Incineration - X X Other incl. MSW & small scale incineration, releases from landfils - X
Agriculture; Excludes combustion emission in agriculture
Various incl. Pesticide use; Seed dressing - X X
Substances possibly proposed for addition to the POP Protocol
Road transport
Non-Road transport
Waste disposal
Public heat and power; Excludes refineries
Residential, commercial and other; Includes combustion in agriculture
Industry; Includes both combustion and process emission, and refineries and fossil fuel production
Solvent and product use; New and existing stocks; Includes wood preservation

93
6 APPENDICES
Appendix 1: Overview of LRTAP submissions Appendix 2: Explanation of NFR sector codes Appendix 3: Overview of LRTAP Recalculations Appendix 4: Overview of inventory comparisons Appendix 5 Tables 1-7: Overview of national total emissions in EMEP 1990-2004 Appendix 6: Example of a country-specific Synthesis and Assessment report provided to countries in 2006.

94
App
endi
x 1
- Ove
rvie
w o
f rep
ortin
g un
der
the
Con
vent
ion
on L
RT
AP
PAR
TY
Dat
e R
ec'd
Re-
subm
issi
onN
FR te
mpl
ate
form
atN
FR te
mpl
ate
form
atO
wn
form
atIn
form
ativ
e In
vent
ory
Rep
ort (
IIR)
Rep
ly S
tage
2
revi
ew re
port
sFo
otno
tes
Exte
nsio
nsM
ain
(NEC
) SO
2 N
Ox
NH
3 N
MVO
CC
OC
dH
gPb
PM2.
5PM
10TS
PPO
Ps (P
AH
D
IOX
HC
B)
Proj
ectio
nsG
ridde
d da
ta
tabl
es a
nd
year
s
Act
ivity
da
taTi
me
serie
s pr
ovid
ed
yyyy
-mm
-dd
yyyy
-mm
-dd
Ver
sion
200
4-1
Ver
sion
200
2-2
Sum
mar
y
Tota
l: 35
(7
1%).
With
in
dead
line:
27
(55%
).
15 (
43%
) 28
(80%
)5
(14%
) in
old
fo
rmat
onl
y2
(6%
) in
own
form
at o
nly
17 (3
5%)
21 (4
3% o
f tot
al
or 6
0% o
f tho
se
repo
rtin
g)11
(31%
)
Arm
enia
Aust
ria20
06-0
2-15
XX
(pro
j, ac
tivity
)X
Xno
XX
XX
XX
XX
XX
XX
Mai
n:19
80-2
004,
HM
+PO
P: 1
985-
2004
, PM
: 199
0-20
04Az
erba
ijan
Bela
rus
2006
-02-
1520
06-0
2-22
XX
XX
XX
XX
XX
XX
XX
X20
04, n
h3: 1
990-
1999
Belg
ium
2006
-03-
07X
XX
nono
XX
XX
XX
XX
X19
90, 1
995,
200
0-20
04Bo
snia
and
H
erze
govi
naBu
lgar
ia20
06-0
2-03
2006
-02-
07X
XX
XX
XX
XX
XX
2004
Can
ada
2006
-02-
15X
Xno
noX
XX
XX
XX
XX
XM
ain+
PMs:
198
5-20
04, n
h3: 1
995-
2004
, PO
Ps/H
Ms:
199
0-20
04,
CLE
: 201
0, 2
015,
202
0C
roat
iaC
ypru
s20
06-0
4-05
XX
XX
XX
XX
XX
X20
04C
zech
R
epub
lic20
06-0
2-15
XX
Xno
noX
XX
XX
XX
XX
2004
Den
mar
k20
06-0
2-15
XX
nono
XX
XX
XX
XX
XX
XS
O2:
198
0-20
04, o
ther
mai
n: 1
985-
2004
, PM
s:20
00-2
004,
HM
s an
d PA
H: 1
990-
2004
, CLE
: 201
0, 2
015,
202
0Es
toni
a20
06-0
2-15
2006
-03-
27X
Xno
noX
XX
XX
XX
XX
2004
, 199
0-19
99
Finl
and
2006
-02-
1520
06-0
2-23
XX
XX
XX
XX
XX
XX
XX
X3a
,b:
2003
+200
4X
Fran
ce20
05-1
2-23
2006
-02-
14X
XX
XX
XX
XX
XX
XX
XX
XM
ain:
1980
-200
4, N
MVO
C:1
988-
2004
, H
M/P
OP
/PM
:199
0-20
04,
CLE
+CR
P: 2
010
Geo
rgia
Ger
man
y20
06-0
1-03
XX
XX
XX
XX
XX
XX
XX
XG
reec
e20
06-0
2-15
2006
-02-
20X
nono
XX
2004
:sox
, nox
, nm
voc,
co
Hun
gary
2006
-02-
1420
06-0
2-22
XX
XX
nono
XX
XX
XX
XX
X20
04Ic
elan
d20
06-0
3-15
Xno
noX
1990
-200
4: D
IOX,
PAH
Irela
nd20
06-0
1-03
XX
nono
XX
XX
XX
XX
XH
Ms:
199
0-20
04, O
ther
pol
luta
nts:
200
4Ita
lyKa
zakh
stan
Kyrg
yzst
anLa
tvia
2006
-02-
15X
XX
noX
XX
XX
XX
XX
X3c
: 200
0X
1990
-200
4, 2
010,
201
5,20
20. A
ll ac
tivity
dat
a.
Liec
hten
stei
nLi
thua
nia
2006
-02-
14X
XX
XX
XX
XX
XX
XX
X3a
,b,c
: 200
4X
Luxe
mbo
urg
XM
alta
2006
-04-
05X
X20
03, 2
004
data
Mol
dova
2006
-01-
3120
06-0
2-07
/ 20
06-0
2-22
XX
noX
X
XX
XX
XX
XX
1990
, 200
4
Mon
aco
2006
-02-
1020
06-0
2-24
XX
nono
XX
XX
XX
XX
3c:2
004
XN
ethe
rland
s20
06-0
3-03
Xno
noX
XX
XX
XX
XX
X19
90, 1
995,
200
0-20
04, C
LE:2
010,
201
5, 2
020
Nor
way
2006
-02-
15X
XX
Xno
XX
XX
XX
XX
XX
X19
80, 1
987,
198
9-20
04, C
LE: 2
010,
202
0, A
D: r
equi
red
yrs
Pola
nd20
06-0
2-16
2006
-03-
02X
XX
nono
XX
XX
XX
XX
X20
04Po
rtuga
l20
06-0
3-24
XX
nono
XX
XX
XX
XX
XR
oman
ia
Rus
sian
Fe
dera
tion
2005
-12-
15
2006
-02-
12 /
2006
-02-
22/
2006
-02-
28/2
006-
03-0
3
Xno
noX
XX
XX
XX
X20
02, 2
003,
NO
PO
Ps
Serb
ia a
nd
Mon
tene
gro
2006
-02-
1420
06-0
2-24
XX
nono
X20
04: N
ox, S
ox
Slov
akia
2006
-02-
0720
06-0
2-23
XX
XX
Xno
XX
XX
XX
XX
XX
3a:9
0,95
,00.
3c:
20
0020
00-2
004,
CLE
: 201
0, 2
015,
202
0
Slov
enia
2006
-02-
1520
06-0
2-23
XX
XX
nono
XX
XX
XX
XX
XX
2000
-200
4, C
LE: 2
010,
201
5, 2
020
Spai
nSw
eden
2006
-02-
10X
(200
4)X
(oth
er y
rs)
XX
XX
XX
XX
XX
XX
XX
X19
80-2
004,
201
0 (C
LE, C
RP
)
Switz
erla
nd20
06-0
2-17
XX
nono
XX
XX
XX
XX
XX
90,9
5,00
,04,
10,
15,
20.
Tot
als
each
yea
r fro
m 1
990-
2004
, 201
0,
2015
, 202
0TF
YR o
f M
aced
onia
2006
-02-
10X
nono
XX
XX
Turk
eyU
krai
ne20
06-0
2-14
Xno
noX
XX
XX
XX
X20
04U
nite
d Ki
ngdo
m20
06-0
2-15
2006
-02-
24X
XX
noX
XX
XX
XX
XM
ain,
pm
, hm
: 198
0-20
04, n
h3: 1
990-
2004
, pop
: 199
0-20
04
Uni
ted
Stat
es20
06-0
2-15
XX
XX
XX
XX
(HC
B on
ly)
2002
,03,
04. N
atio
nal t
otal
sEu
rope
an
Com
mun
ity
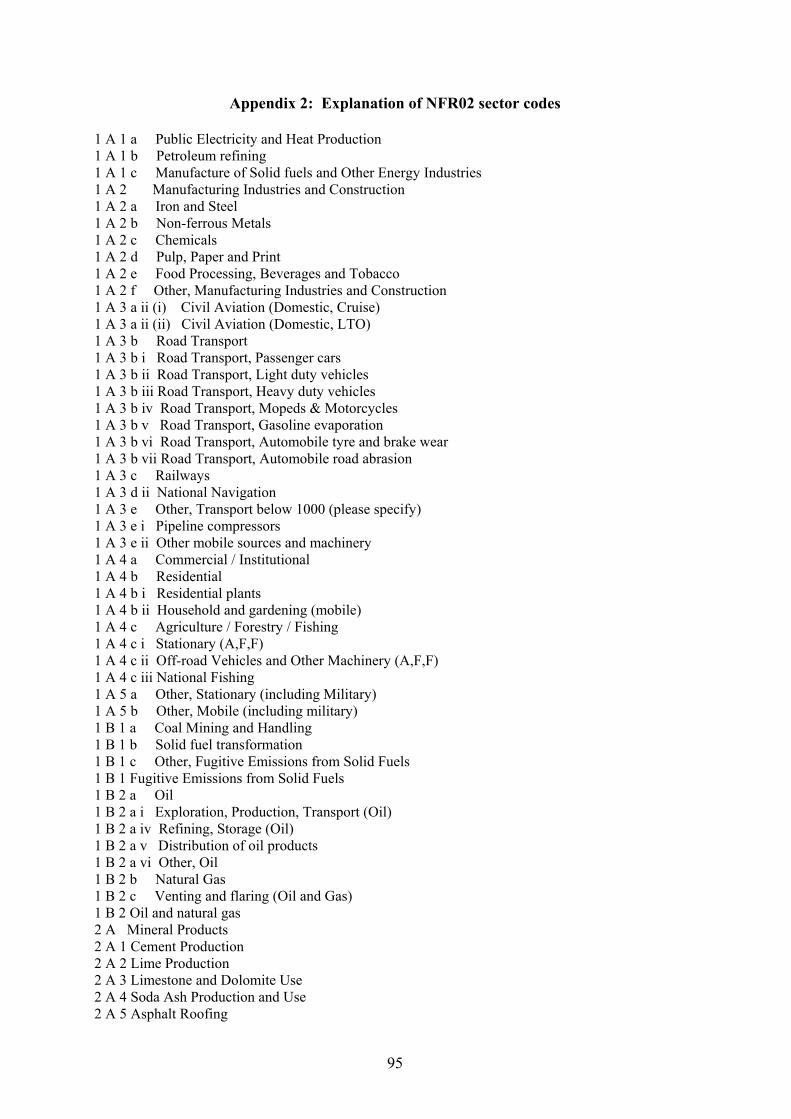
95
Appendix 2: Explanation of NFR02 sector codes 1 A 1 a Public Electricity and Heat Production 1 A 1 b Petroleum refining 1 A 1 c Manufacture of Solid fuels and Other Energy Industries 1 A 2 Manufacturing Industries and Construction 1 A 2 a Iron and Steel 1 A 2 b Non-ferrous Metals 1 A 2 c Chemicals 1 A 2 d Pulp, Paper and Print 1 A 2 e Food Processing, Beverages and Tobacco 1 A 2 f Other, Manufacturing Industries and Construction 1 A 3 a ii (i) Civil Aviation (Domestic, Cruise) 1 A 3 a ii (ii) Civil Aviation (Domestic, LTO) 1 A 3 b Road Transport 1 A 3 b i Road Transport, Passenger cars 1 A 3 b ii Road Transport, Light duty vehicles 1 A 3 b iii Road Transport, Heavy duty vehicles 1 A 3 b iv Road Transport, Mopeds & Motorcycles 1 A 3 b v Road Transport, Gasoline evaporation 1 A 3 b vi Road Transport, Automobile tyre and brake wear 1 A 3 b vii Road Transport, Automobile road abrasion 1 A 3 c Railways 1 A 3 d ii National Navigation 1 A 3 e Other, Transport below 1000 (please specify) 1 A 3 e i Pipeline compressors 1 A 3 e ii Other mobile sources and machinery 1 A 4 a Commercial / Institutional 1 A 4 b Residential 1 A 4 b i Residential plants 1 A 4 b ii Household and gardening (mobile) 1 A 4 c Agriculture / Forestry / Fishing 1 A 4 c i Stationary (A,F,F) 1 A 4 c ii Off-road Vehicles and Other Machinery (A,F,F) 1 A 4 c iii National Fishing 1 A 5 a Other, Stationary (including Military) 1 A 5 b Other, Mobile (including military) 1 B 1 a Coal Mining and Handling 1 B 1 b Solid fuel transformation 1 B 1 c Other, Fugitive Emissions from Solid Fuels 1 B 1 Fugitive Emissions from Solid Fuels 1 B 2 a Oil 1 B 2 a i Exploration, Production, Transport (Oil) 1 B 2 a iv Refining, Storage (Oil) 1 B 2 a v Distribution of oil products 1 B 2 a vi Other, Oil 1 B 2 b Natural Gas 1 B 2 c Venting and flaring (Oil and Gas) 1 B 2 Oil and natural gas 2 A Mineral Products 2 A 1 Cement Production 2 A 2 Lime Production 2 A 3 Limestone and Dolomite Use 2 A 4 Soda Ash Production and Use 2 A 5 Asphalt Roofing
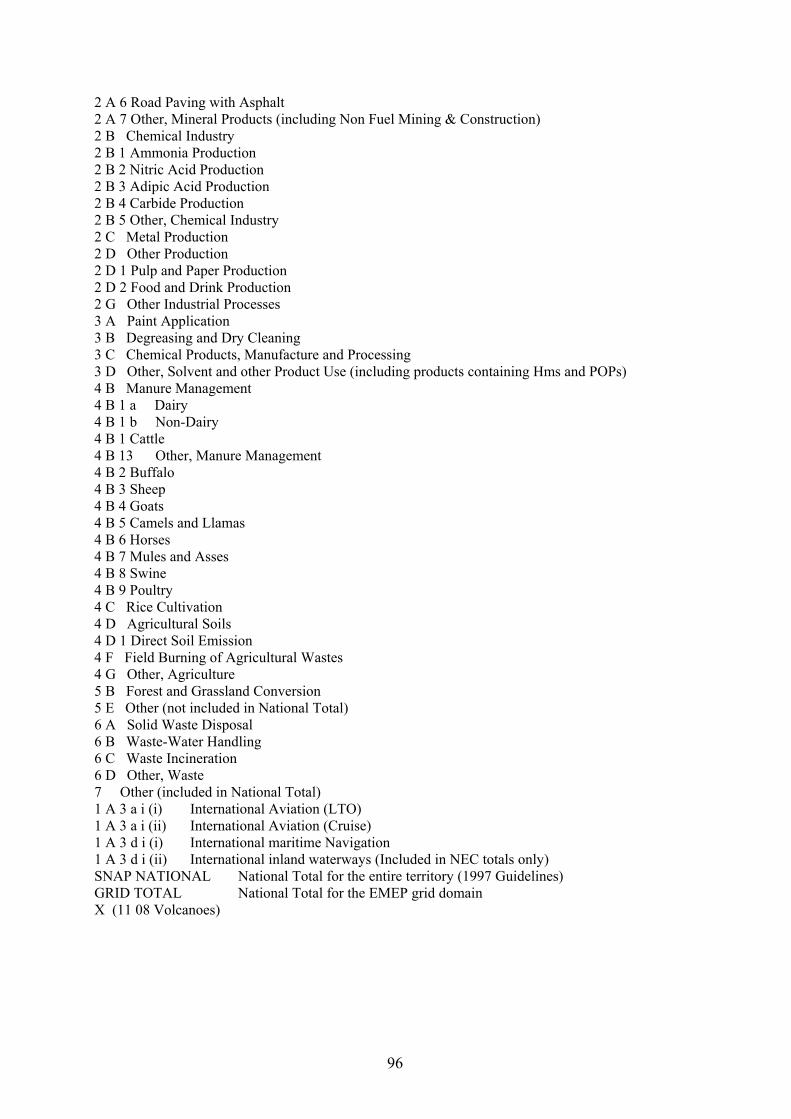
96
2 A 6 Road Paving with Asphalt 2 A 7 Other, Mineral Products (including Non Fuel Mining & Construction) 2 B Chemical Industry 2 B 1 Ammonia Production 2 B 2 Nitric Acid Production 2 B 3 Adipic Acid Production 2 B 4 Carbide Production 2 B 5 Other, Chemical Industry 2 C Metal Production 2 D Other Production 2 D 1 Pulp and Paper Production 2 D 2 Food and Drink Production 2 G Other Industrial Processes 3 A Paint Application 3 B Degreasing and Dry Cleaning 3 C Chemical Products, Manufacture and Processing 3 D Other, Solvent and other Product Use (including products containing Hms and POPs) 4 B Manure Management 4 B 1 a Dairy 4 B 1 b Non-Dairy 4 B 1 Cattle 4 B 13 Other, Manure Management 4 B 2 Buffalo 4 B 3 Sheep 4 B 4 Goats 4 B 5 Camels and Llamas 4 B 6 Horses 4 B 7 Mules and Asses 4 B 8 Swine 4 B 9 Poultry 4 C Rice Cultivation 4 D Agricultural Soils 4 D 1 Direct Soil Emission 4 F Field Burning of Agricultural Wastes 4 G Other, Agriculture 5 B Forest and Grassland Conversion 5 E Other (not included in National Total) 6 A Solid Waste Disposal 6 B Waste-Water Handling 6 C Waste Incineration 6 D Other, Waste 7 Other (included in National Total) 1 A 3 a i (i) International Aviation (LTO) 1 A 3 a i (ii) International Aviation (Cruise) 1 A 3 d i (i) International maritime Navigation 1 A 3 d i (ii) International inland waterways (Included in NEC totals only) SNAP NATIONAL National Total for the entire territory (1997 Guidelines) GRID TOTAL National Total for the EMEP grid domain X (11 08 Volcanoes)
97
Appendix 3: Overview of LRTAP Recalculations The aim of this test is to identify differences between national totals reported by Parties between the 2006 and 2005 reporting years (100*[(X2006 – X2005)/ X2005]). Recalculations larger than ± 10% are flagged Summary showing results of the recalculation check performed for officially reported data to LRTAP showing changes larger than ± 10% made to emission values reported in 2006 compared to 2005. The highest percentage per component is listed. The years with recalculations (also those smaller than ± 10%) are listed in brackets. IIR=Informative Inventory Report, RR= Stage 2 country specific Review Report.
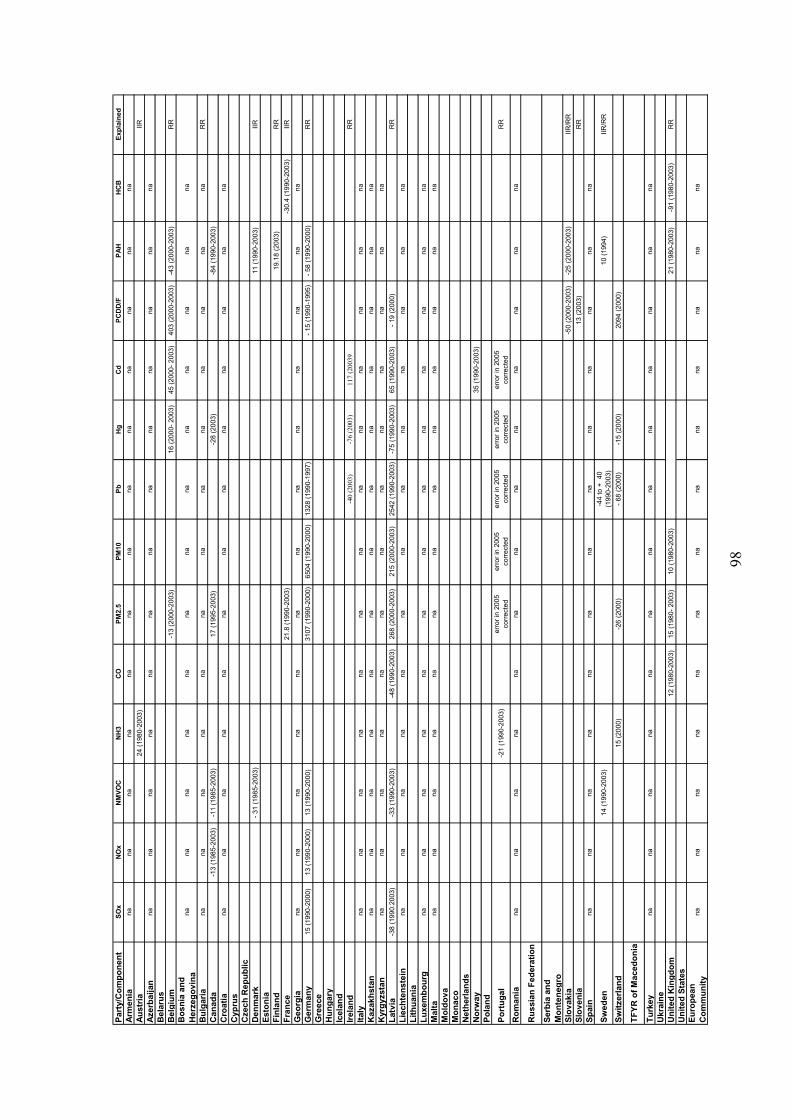
98
Part
y/C
ompo
nent
SOx
NO
xN
MVO
CN
H3
CO
PM2.
5PM
10Pb
Hg
Cd
PCD
D/F
PAH
HC
BEx
plai
ned
Arm
enia
nana
nana
nana
nana
nana
nana
naAu
stria
24 (1
980-
2003
)IIR
Azer
baija
nna
nana
nana
nana
nana
nana
nana
Bel
arus
Bel
gium
-13
(200
0-20
03)
16 (2
000-
200
3)45
(200
0- 2
003)
403
(200
0-20
03)
-43
(200
0-20
03)
RR
Bos
nia
and
Her
zego
vina
nana
nana
nana
nana
nana
nana
na
Bul
garia
nana
nana
nana
nana
nana
nana
naR
RC
anad
a-1
3 (1
985-
2003
)-1
1 (1
985-
2003
)17
(199
5-20
03)
-28
(200
3)-8
4 (1
990-
2003
)C
roat
iana
nana
nana
nana
nana
nana
nana
Cyp
rus
Cze
ch R
epub
licD
enm
ark
- 31
(198
5-20
03)
11 (1
990-
2003
)IIR
Esto
nia
Finl
and
19.1
8 (2
003)
RR
Fran
ce21
.8 (1
990-
2003
) -3
0.4
(199
0-20
03)
IIRG
eorg
iana
nana
nana
nana
nana
nana
nana
Ger
man
y15
(199
0-20
00)
13 (1
990-
2000
)13
(199
0-20
00)
3107
(199
0-20
00)
6504
(199
0-20
00)
1328
(199
0-19
97)
- 15
(199
0-19
95)
- 58
(199
0-20
00)
RR
Gre
ece
Hun
gary
Icel
and
Irela
nd-4
0 (2
003)
-76
(200
3)11
7 (2
0039
RR
Italy
nana
nana
nana
nana
nana
nana
naK
azak
hsta
nna
nana
nana
nana
nana
nana
nana
Kyr
gyzs
tan
nana
nana
nana
nana
nana
nana
naLa
tvia
-38
(199
0.20
03)
-33
(199
0-20
03)
-48
(199
0-20
03)
268
(200
0-20
03)
215
(200
0-20
03)
2542
(199
0-20
03)
-75
(199
0-20
03)
65 (1
990-
2003
)- 1
9 (2
000)
RR
Liec
hten
stei
nna
nana
nana
nana
nana
nana
nana
Lith
uani
aLu
xem
bour
gna
nana
nana
nana
nana
nana
nana
Mal
tana
nana
nana
nana
nana
nana
nana
Mol
dova
Mon
aco
Net
herla
nds
Nor
wa y
35 (1
990-
2003
)Po
land
Port
ugal
-21
(199
0-20
03)
erro
r in
2005
co
rrect
eder
ror i
n 20
05
corre
cted
erro
r in
2005
co
rrect
eder
ror i
n 20
05
corre
cted
erro
r in
2005
co
rrect
edR
R
Rom
ania
nana
nana
nana
nana
nana
nana
na
Rus
sian
Fed
erat
ion
Serb
ia a
nd
Mon
tene
gro
Slov
akia
-50
(200
0-20
03)
-25
(200
0-20
03)
IIR/R
RSl
oven
ia13
(200
3)R
RSp
ain
nana
nana
nana
nana
nana
nana
na
Swed
en14
(199
0-20
03)
-44
to +
40
(1
990-
2003
)10
(199
4)IIR
/RR
Switz
erla
nd15
(200
0)-2
6 (2
000)
- 68
(200
0)-1
5 (2
000)
2094
(200
0)
TFYR
of M
aced
onia
Turk
e yna
nana
nana
nana
nana
nana
nana
Ukr
aine
Uni
ted
Kin
gdom
12 (1
980-
2003
)15
(198
0- 2
003)
10 (1
980-
2003
)21
(198
0-20
03)
-91
(198
0-20
03)
RR
Uni
ted
Stat
esEu
rope
an
Com
mun
it yna
nana
nana
nana
nana
nana
nana

99
A
ppen
dix
4: O
verv
iew
of i
nven
tory
com
pari
sons
Inve
ntor
y co
mpa
rison
. The
aim
of
this
test
is to
com
pare
nat
iona
l tot
als
repo
rted
to N
EC, L
RTA
P an
d un
der
the
EU M
onito
ring
Mec
hani
sm
repo
rted
with
in 1
0th M
arch
200
6 (L
RTA
P), 2
8th F
ebru
ary
2006
(NEC
) and
8th
Apr
il 20
06 (E
U M
onito
ring
Mec
hani
sm).
Su
mm
ary
show
ing
resu
lts o
f th
e EU
25 c
ompa
rison
per
form
ed b
etw
een
offic
ially
rep
orte
d da
ta to
NEC
-LR
TAP-
EU M
M f
or th
e m
ost r
ecen
t re
porti
ng y
ear (
2004
). D
iffer
ence
s ar
e ex
pres
sed
as p
erce
ntag
es (%
). Ex
plan
atio
ns fo
r the
not
ed d
iffer
ence
s no
ted
are
prov
ided
whe
re th
ese
have
be
en r
ecei
ved
in r
espo
nse
to th
e re
view
or
wer
e al
read
y do
cum
ente
d by
the
resp
ectiv
e co
untry
. Fla
gged
val
ues
indi
cate
diff
eren
ces
of g
reat
er
than
0.1
% b
etw
een
the
resp
ectiv
e na
tiona
l to
tals
(N
EC-L
RTA
P-EU
MM
). II
R=I
nfor
mat
ive
Inve
ntor
y R
epor
t, R
R=
Stag
e 2
coun
try s
peci
fic
Rev
iew
Rep
ort
Cou
ntry
C
ompa
riso
n SO
x N
Ox
NH
3
NM
VO
C
CO
E
xpla
natio
n N
otes
& c
ount
ry e
xpla
natio
ns to
exp
lain
di
ffer
ence
s
Aus
tria
NEC
-LR
TAP
0.00
0.
00
0.00
0.
00
N/A
A
ustri
a LR
TAP-
EU M
M
0.00
0.
00
N/A
0.
00
0.00
A
ustri
a N
EC-E
U M
M
0.00
0.
00
N/A
0.
00
N/A
Bel
gium
N
EC-L
RTA
P 0.
04
-0.0
1 -0
.03
-3.5
1 N
/A
RR
/IIR
SOx:
em
issi
on fa
ctor
s of
the
Bru
ssel
s co
ke p
lant
hav
e be
en re
view
ed a
fter t
he N
EC-s
ubm
issi
on.
NM
VO
C:
Flem
ish
emis
sion
inv
ento
ry r
evis
ed b
ased
on
stud
ies
B
elgi
um
LRTA
P-EU
MM
6.
26
8.15
N
/A
25.0
1 18
.59
RR
Bel
gium
N
EC-E
U M
M
6.22
8.
16
N/A
27
.65
N/A
R
R
In
2004
, in
vent
ory
of
the
Wal
lon
regi
on
was
pr
ovis
iona
l and
still
inco
mpl
ete;
som
e er
rors
in C
RF
Cyp
rus
NEC
-LR
TAP
NEC
Dat
a no
t ava
ilabl
e to
allo
w c
ompa
rison
C
ypru
s LR
TAP-
EU M
M
CLR
TAP
data
not
ava
ilabl
e to
allo
w c
ompa
rison
for
20
04
Cyp
rus
NEC
-EU
MM
N
EC D
ata
not a
vaila
ble
to a
llow
com
paris
on
Cze
ch R
epub
lic
NEC
-LR
TAP
NEC
Dat
a no
t ava
ilabl
e to
allo
w c
ompa
rison
Cze
ch R
epub
lic
LRTA
P-EU
MM
-1
.48
1.00
N
/A
-0.1
0 -5
.50
RR
N
Ox
and
CO
: di
ffer
ence
s in
LU
LUC
F se
ctor
(e
mis
sion
s fr
om o
n-si
te c
ombu
stio
n ar
e in
clud
ed i
n C
RF,
but
not
in N
FR)
Den
mar
k N
EC-L
RTA
P
N
EC D
ata
not a
vaila
ble
to a
llow
com
paris
on
Den
mar
k LR
TAP-
EU M
M
0.00
0.
00
N/A
0.
00
5.13

10
0
Cou
ntry
C
ompa
riso
n SO
x N
Ox
NH
3
NM
VO
C
CO
E
xpla
natio
n N
otes
& c
ount
ry e
xpla
natio
ns to
exp
lain
di
ffer
ence
s
Esto
nia
NEC
-LR
TAP
-0.0
2 -2
.36
0.73
-1
.37
N/A
R
R
The
diff
eren
ce in
NO
x an
d N
MV
OC
em
issi
on w
as a
s re
sult
of e
mis
sion
cor
rect
ion
from
roa
d tra
nspo
rt.
Som
e co
rrec
tions
wer
e m
ade
also
in N
H3.
Esto
nia
LRTA
P-EU
MM
-2
.37
-33.
56
N/A
-1
5.19
-2
1.22
R
R
Two
diff
eren
t dat
abas
es a
re a
vaila
ble
for a
ir po
llutio
n an
d G
HG
s as
wel
l as
tw
o di
ffer
ent
appr
oach
es t
o in
vent
orie
s SO
x, N
Ox:
mai
nly
diff
eren
ces
in e
mis
sion
s fr
om
oils
hale
com
bust
ion
NM
VO
C: d
iffer
ence
s in
tran
spor
t; di
ffer
ent e
mis
sion
fa
ctor
for w
ood
com
bust
ion
in d
omes
tic se
ctor
C
O: d
iffer
ence
in e
mis
sion
fact
or fo
r fue
l com
bust
ion
and
for r
oad
trans
port
Esto
nia
NEC
-EU
MM
-2
.35
-30.
41
N/A
-1
3.60
N
/A
Finl
and
NEC
-LR
TAP
NEC
Dat
a no
t ava
ilabl
e to
allo
w c
ompa
rison
Finl
and
LRTA
P-EU
MM
0.
00
0.00
N
/A
-0.5
2 1.
42
RR
Air
emis
sion
s an
d G
HG
em
issi
ons
from
the
ene
rgy
sect
or a
re c
alcu
late
d by
two
diff
eren
t ins
titut
es. D
ata
subm
itted
un
der
CLR
TAP
are
the
offic
ial
data
, w
here
as e
mis
sion
s re
porte
d un
der
the
EU M
M a
re
prel
imin
ary.
Fi
nlan
d N
EC-E
U M
M
NEC
Dat
a no
t ava
ilabl
e to
allo
w c
ompa
rison
Fr
ance
N
EC-L
RTA
P 0.
00
0.00
0.
00
0.00
N
/A
Fran
ce
LRTA
P-EU
MM
-1
3.69
-2
.69
N/A
-9
3.70
-9
.30
RR
D
iffer
ence
s in
rep
ortin
g re
quire
men
ts u
nder
LR
TAP
and
EU M
M (L
ULU
CF,
ove
rsea
s ter
ritor
ies)
Fr
ance
N
EC-E
U M
M
-13.
69
-2.6
9 N
/A
-93.
70
N/A
R
R
See
abov
e G
erm
any
NEC
-LR
TAP
NEC
Dat
a no
t ava
ilabl
e to
allo
w c
ompa
rison
Ger
man
y LR
TAP-
EU M
M
0.03
-0
.05
N/A
-3
.20
10.5
2 R
R
NM
VO
C: n
ew in
form
atio
n w
as in
clud
ed in
sect
or 4
in
the
CR
F G
reec
e N
EC-L
RTA
P 0
0 N
/A
0 N
/A
Gre
ece
LRTA
P-EU
MM
-3
.57
0.00
N
/A
-0.0
2 -8
1.31
G
reec
e N
EC-E
U M
M
-3.5
7 0.
00
N/A
-0
,02
N/A
Hun
gary
N
EC-L
RTA
P -0
.75
-0.7
3 11
.75
2.06
N
/A
RR
Ther
e ar
e di
ffer
ence
s in
the
repo
rting
met
hods
, som
e ea
rlier
pu
blic
atio
n ha
ve
been
re
calc
ulat
ed
som
e re
mai
ned
inta
ct. I
n th
e ne
xt r
epor
ting
all s
ubm
issi
ons
will
be
reca
lcul
ate.
It
shou
ld b
e m
entio
ned
whe
n m
akin
g re
ports
till
15th
Feb
ruar
y, s
ome
stat
istic
al
publ
icat
ions
are
not
ava
ilabl
e in
our
cou
ntry
, and
thus

10
1
Cou
ntry
C
ompa
riso
n SO
x N
Ox
NH
3
NM
VO
C
CO
E
xpla
natio
n N
otes
& c
ount
ry e
xpla
natio
ns to
exp
lain
di
ffer
ence
s
the
data
repo
rted
are
prel
imin
ary.
Hun
gary
LR
TAP-
EU M
M
0.00
0.
00
N/A
-0
.32
0.25
R
R
See
abov
e H
unga
ry
NEC
-EU
MM
0.
75
0.73
N
/A
-2.3
9 N
/A
RR
Se
e ab
ove
Irel
and
NEC
-LR
TAP
0.00
0.
00
0.00
0.
00
N/A
Ir
elan
d
LRTA
P-EU
MM
0.
89
2.57
N
/A
5.64
0.
80
RR
Non
-GH
G d
ata
repo
rted
unde
r th
e EU
MM
do
not
unde
rgo
the
sam
e Q
A/Q
C a
nd r
evis
ion/
reca
lcul
atio
n ch
ecks
as
it
wou
ld
befo
re
repo
rting
to
N
EC
or
UN
ECE.
Ir
elan
d N
EC-E
U M
M
0.89
2.
57
N/A
5.
64
N/A
R
R
See
abov
e Ita
ly
NEC
-LR
TAP
Dat
a no
t ava
ilabl
e to
allo
w c
ompa
rison
for 2
004
Latv
ia
NEC
-LR
TAP
1.07
0.
004
-0.1
4 -3
.82
N/A
R
R
Cal
cula
tions
, act
ivity
dat
a an
d em
issi
on f
acto
rs w
ere
impr
oved
from
subm
issi
on to
subm
issi
on.
Latv
ia
LRTA
P-EU
MM
1.
92
-0.5
8 N
/A
6.23
-0
.03
RR
Cal
cula
tions
, act
ivity
dat
a an
d em
issi
on f
acto
rs w
ere
impr
oved
fr
om
subm
issi
on
to
subm
issi
on.
No
sign
ifica
nt d
iffer
ence
s w
ere
obse
rved
bet
wee
n th
e re
subm
issi
ons t
o C
LRTA
P an
d U
NFC
CC
by
15th
May
20
06.
Latv
ia
NEC
-EU
MM
0.
87
-0.5
9 N
/A
9.81
N
/A
RR
Se
e ab
ove
Lith
uani
a N
EC-L
RTA
P 13
.91
13.4
2 -0
.01
63.0
4 N
/A
RR
Emis
sion
in
vent
ory
repo
rted
to
LRTA
P is
m
ore
com
plet
e th
en
it re
porte
d ea
rlier
to
N
EC
(mor
e em
issi
on so
urce
s est
imat
ed).
Li
thua
nia
LRTA
P-EU
MM
15
.55
15.1
5 N
/A
47.0
7 1.
61
RR
Em
issi
ons
repo
rted
unde
r th
e EU
MM
wer
e no
t co
mpl
ete.
Li
thua
nia
NEC
-EU
MM
3.
81
3.76
N
/A
13.7
0 N
/A
RR
Se
e ab
ove
Luxe
mbo
urg
NEC
-LR
TAP
Dat
a no
t ava
ilabl
e to
allo
w c
ompa
rison
for 2
004
Mal
ta
NEC
-LR
TAP
0.00
0.
00
0.00
0.
00
N/A
Sam
e su
bmis
sion
to b
oth
NEC
and
LR
TAP
Mal
ta
LRTA
P-EU
MM
N
o C
RF
avai
labl
e to
allo
w c
ompa
rison
for 2
004
Mal
ta
NEC
-EU
MM
N
o C
RF
avai
labl
e to
allo
w c
ompa
rison
for 2
004
Net
herla
nds
NEC
-LR
TAP
-2.3
7 -6
.61
-0.0
05
-0.7
7 N
/A
G
uide
lines
di
ffer
ence
s fo
r 1
A
3 d
ii N
atio
nal
Nav
igat
ion
and
1 A
3
a ii
(i)
Civ
il A
viat
ion
(Dom
estic
, LTO
). N
ethe
rland
s LR
TAP-
EU M
M
3.75
1.
32
N/A
16
.78
-0.7
9
SOx:
diff
eren
ces o
ccur
in v
ario
us se
ctor
s N
MV
OC
: diff
eren
ces o
ccur
mai
nly
in 1
A3b
N
ethe
rland
s N
EC-E
U M
M
5.99
7.
84
N/A
17
.42
N/A
See
abov
e Po
land
N
EC-L
RTA
P
N
EC D
ata
not a
vaila
ble
to a
llow
com
paris
on

10
2
Cou
ntry
C
ompa
riso
n SO
x N
Ox
NH
3
NM
VO
C
CO
E
xpla
natio
n N
otes
& c
ount
ry e
xpla
natio
ns to
exp
lain
di
ffer
ence
s
Pola
nd
LRTA
P-EU
MM
0.
00
0.01
N
/A
0.00
0.
00
Pola
nd
NEC
-EU
MM
N
EC D
ata
not a
vaila
ble
to a
llow
com
paris
on
Portu
gal
NEC
-LR
TAP
NEC
Dat
a no
t ava
ilabl
e to
allo
w c
ompa
rison
Po
rtuga
l
LRTA
P-EU
MM
-0
.02
-0.0
4 N
/A
-3.3
3 -9
.80
RR
The
UN
FCC
C t
otal
s co
nsid
ered
inc
lude
em
issi
ons
from
fo
rest
fir
es
whi
ch
are
not
incl
uded
in
th
e C
LRTA
P to
tals
. Als
o em
issi
ons
from
wild
fires
diff
er
as u
nder
CLR
TAP,
em
issi
ons
from
bus
hlan
d bi
omas
s bu
rnt a
re c
onsi
dere
d, a
nd in
the
UN
FCC
C o
nly
fore
st
land
is ta
ken
into
acc
ount
. Po
rtuga
l N
EC-E
U M
M
NEC
Dat
a no
t ava
ilabl
e to
allo
w c
ompa
rison
Sl
ovak
ia
NEC
-LR
TAP
0.00
0.
00
0.00
0.
00
N/A
Sl
ovak
ia
LRTA
P-EU
MM
0.
00
0.00
N
/A
-0.0
1 0.
00
Slov
akia
N
EC-E
U M
M
0.00
-0
.09
N/A
-0
.01
N/A
Slov
enia
N
EC-L
RTA
P -4
.03
1.34
0
-0.4
6 N
/A
RR
Rep
ort
for
NEC
is
prov
isio
nal
and
not
com
plet
e,
beca
use
of m
issi
ng d
ata
at th
e en
d of
the
year
. The
re
is n
o le
gal o
blig
atio
n th
at d
ata
shou
ld b
e up
date
d af
ter
15th
of
Febr
uary
, whe
n th
e da
ta f
or C
LRTA
P re
port
are
com
plet
ed a
nd r
epor
ted.
By
the
requ
irem
ents
for
N
EC r
epor
ting
data
for
NEC
are
n’t
upda
ted
earli
er
than
in n
ext r
epor
ting
year
.
Slov
enia
LR
TAP-
EU M
M
91.8
3 99
.49
N/A
50
.46
80.3
0
Bec
ause
of
diff
icul
ties
with
the
new
rep
ortin
g fo
rmat
fo
r U
NFC
CC
(C
RF
repo
rter)
w
rong
da
ta
wer
e re
porte
d fo
r UN
FCC
C re
port
Slov
enia
N
EC-E
U M
M
92.1
6 99
.48
N/A
50
.69
N/A
See
abov
e Sp
ain
NEC
-LR
TAP
Dat
a no
t ava
ilabl
e to
allo
w c
ompa
rison
for 2
004
Spai
n LR
TAP-
EU M
M
Dat
a no
t ava
ilabl
e to
allo
w c
ompa
rison
for 2
004
Spai
n N
EC-E
U M
M
Dat
a no
t ava
ilabl
e to
allo
w c
ompa
rison
for 2
004
Swed
en
NEC
-LR
TAP
0.00
0.
00
0.00
0.
00
N/A
Sw
eden
LR
TAP-
EU M
M
0.00
0.
00
N/A
0.
00
0.00
Sw
eden
N
EC-E
U M
M
0.00
0.
00
N/A
0.
00
N/A
Uni
ted
Kin
gdom
N
EC-L
RTA
P 0
0 -0
.000
1 0
N/A
R
R
NEC
-LR
TAP
are
very
smal
l rou
ndin
g er
rors
.
Uni
ted
Kin
gdom
LR
TAP-
EU M
M
0.00
0.
02
N/A
0.
17
0.39
R
R
UN
FCC
C-L
RTA
P/N
EC
are
know
n di
ffer
ence
s to
ar
ise
from
the
diff
eren
t re
porti
ng f
orm
ats
i.e.
som
e m
issi
ons a
re in
clud
ed in
one
form
at, b
ut n
ot th
e ot
her
Uni
ted
Kin
gdom
N
EC-E
U M
M
0.00
0.
02
N/A
0.
17
N/A
R
R
See
abov
e

103
Appendix 5: Tables 1-5: Overview of national total emissions in EMEP 1990-2004 Table 1: National total emission trends Emissions of sulphur (1990-2004) used for modelling at the MSC-W (Gg of SO2 per year)a
Country 1990 1991 1992 1993 1994 1995 1996 1997 1998 1999 2000 2001 2002 2003 2004Albania 74 62 50 38 26 14 17 21 25 29 32 32 32 32 32Armenia 86 72 58 44 29 15 14 14 13 12 11 11 9.6 8.6 7.7Austria 74 71 55 53 48 47 45 40 36 34 32 33 33 33 29Azerbaijan 615 544 473 403 332 262 242 222 202 182 162 154 146 138 130Belarus 888 779 670 561 452 344 307 271 235 198 162 126 117 107 97Belgium 361 340 320 300 280 262 242 223 204 186 171 169 150 147 154Bosnia and Herzegovina 484 459 434 410 385 360 372 384 396 408 420 422 423 425 427
Bulgaria 2007 1665 1116 1426 1479 1477 1420 1365 1251 943 918 969 964 994 929Croatia 178 106 105 112 88 70 66 80 89 90 60 63 68 75 85Cyprus 46 33 39 43 42 41 45 48 49 51 51 47 51 46 45Czech Republic 1876 1775 1537 1418 1269 1090 946 700 443 269 264 248 235 232 227Denmark 176 235 180 145 143 133 168 95 73 53 27 24 24 30 23Estonia 274 251 192 156 152 117 126 117 103 97 96 92 88 101 90Finland 259 194 140 122 114 95 105 99 90 87 74 85 79 98 83France 1333 1438 1256 1099 1033 968 944 796 817 705 613 550 510 505 484Georgia 43 35 28 21 13 5.7 5.9 6.2 6.4 6.7 7.0 6.5 6.0 5.5 4.9Germany 5289 3920 3222 2859 2401 1708 1426 1197 956 776 630 628 588 595 559Greece 487 525 544 542 513 536 523 518 527 544 493 502 517 554 537Hungary 1011 914 828 757 741 705 673 659 592 590 486 400 360 339 240Iceland 8.7 8.8 9.0 9.1 9.3 9.4 9.4 9.3 9.2 9.2 9.1 9.1 9.1 9.0 9.0Ireland 186 180 172 161 175 161 147 166 176 157 131 126 96 76 71Italy 1795 1677 1578 1477 1387 1320 1209 1132 995 899 752 708 632 506 418Kazakhstan 651 626 602 577 553 528 524 519 515 510 506 486 466 445 425Latvia 97 82 66 65 65 47 53 38 35 29 10 7.9 6.0 4.7 4.0Lithuania 263 229 194 160 126 92 82 72 63 53 43 45 43 39 40Luxembourg 26 22 18 15 11 7.3 6.7 6.1 5.7 4.9 4.3 4.2 4.0 3.9 3.7Macedonia. TFYR of 110 107 103 100 97 93 93 92 91 91 90 89 88 88 87
Malta 29 41 34 30 31 33 30 27 27 25 26 29 29 33 17Moldova. Republic of 175 159 143 126 110 94 78 61 45 29 13 12 15 21 15
Monaco 0.078 0.091 0.094 0.100 0.089 0.084 0.076 0.073 0.072 0.076 0.067 0.065 0.066 0.076 0.074Netherlands 189 176 164 152 139 127 117 109 98 91 72 73 65 63 66Norway 53 44 37 35 35 34 33 31 30 29 27 25 23 23 25Poland 3278 3019 2835 2730 2610 2381 2373 2185 1902 1724 1507 1564 1455 1375 1286Portugal 317 308 370 316 296 332 270 292 341 341 306 294 294 200 203Romania 1310 1040 945 921 906 882 859 835 811 689 727 832 783 734 685Russian Federation 6113 5510 4908 4306 3704 3101 2934 2766 2599 2431 2263 2162 2061 1960 1858
Serbia and Montenegro 593 560 527 494 461 428 421 415 409 402 396 382 368 355 341
Slovakia 542 445 380 325 238 239 227 202 179 171 127 131 103 106 97Slovenia 198 182 188 185 179 127 114 120 125 107 99 68 71 64 55Spain 2166 2167 2133 1999 1947 1795 1566 1748 1597 1607 1489 1446 1550 1352 1172Sweden 117 114 109 96 93 79 77 70 67 54 52 51 51 52 47Switzerland 42 39 37 34 31 28 26 24 22 20 19 18 18 18 17Turkey 1519 1495 1470 1446 1421 1397 1542 1687 1832 1977 2122 2039 1957 1875 1792Ukraine 3921 3605 3289 2974 2658 2342 2193 2045 1896 1748 1599 1461 1324 1232 1145United Kingdom 3699 3522 3430 3085 2649 2343 1999 1635 1591 1202 1173 1111 994 973 833
a Reported values with white background, expert estimates replacing gaps in grey. Values in bold italic show replacement of reported data by expert estimates.

104
Table 2: National total emission trends Emissions of nitrogen oxides (1990-2004) used for modelling at the MSC-W (Gg of NO2 per year)a Country 1990 1991 1992 1993 1994 1995 1996 1997 1998 1999 2000 2001 2002 2003 2004Albania 23 21 20 18 17 16 17 18 19 20 22 22 23 24 25Armenia 60 51 43 35 26 18 21 23 26 28 31 32 33 38 38Austria 212 223 210 203 195 193 212 200 212 199 204 213 220 230 227Azerbaijan 171 153 136 119 101 85 83 80 78 76 76 77 80 86 85Belarus 379 350 320 291 262 232 228 223 218 213 208 204 205 209 213Belgium 382 380 378 376 374 372 363 355 347 338 330 316 300 298 298Bosnia and Herzegovina 73 68 64 60 55 51 51 52 52 52 53 53 52 52 52
Bulgaria 363 260 235 247 230 264 259 225 223 202 184 192 197 202 216Croatia 88 65 56 59 65 66 69 73 76 77 77 70 69 69 70Cyprus 19 17 20 21 21 20 22 22 23 23 25 19 23 22 19Czech Republic 742 724 697 573 435 413 432 423 413 391 398 332 316 324 328Denmark 266 315 271 270 268 253 290 244 221 205 188 184 181 189 171Estonia 74 69 43 40 43 38 41 40 39 35 37 38 40 39 37Finland 299 290 284 282 281 258 268 259 251 247 235 220 208 218 205France 1829 1888 1852 1739 1694 1643 1616 1551 1532 1461 1390 1335 1282 1243 1218Georgia 64 54 44 33 23 13 16 20 23 27 30 30 31 32 32Germany 2878 2648 2492 2383 2236 2131 2050 1976 1940 1916 1855 1763 1674 1605 1554Greece 299 312 314 313 320 320 325 332 348 337 328 343 318 343 317Hungary 276 237 213 199 198 193 197 200 204 205 194 192 196 192 190Iceland 8.7 8.7 8.6 8.6 8.5 8.5 8.6 8.7 8.8 8.9 9.0 9.2 9.4 11 11Ireland 119 122 133 121 120 120 124 122 126 123 129 132 122 117 116Italy 1945 2000 2019 1919 1840 1808 1731 1653 1552 1456 1377 1366 1275 1259 1244Kazakhstan 179 176 172 169 165 162 153 145 136 127 119 127 135 151 151Latvia 69 64 53 46 41 41 43 41 39 37 34 38 37 38 39Lithuania 158 166 98 78 77 65 64 63 65 57 49 47 51 53 55Luxembourg 20 23 25 28 30 32 33 33 33 33 33 32 31 30 29Macedonia, TFYR of 46 44 42 40 38 35 36 37 37 38 39 41 42 43 42
Malta 14 13 13 13 12 13 13 12 12 12 12 12 11 12 12Moldova, Republic of 131 120 110 100 89 79 69 58 48 37 27 23 25 30 38
Netherlands 549 532 515 498 481 464 443 428 402 397 389 381 368 367 360Norway 224 214 212 222 220 221 231 233 235 238 224 220 212 215 215Poland 1581 1419 1329 1224 1204 1121 1155 1114 991 953 838 848 796 808 804Portugal 243 257 277 266 265 274 268 267 278 287 285 286 294 271 271Romania 527 501 476 451 425 400 386 372 358 345 331 335 338 342 346Russian Federation 3600 3435 3123 3054 2667 2570 2477 2423 2542 2577 2457 2582 2698 3105 3093
Serbia and Montenegro 165 152 140 136 134 133 133 148 146 131 137 140 141 146 149
Slovakia 215 194 182 174 165 174 132 125 130 118 109 109 101 98 98Slovenia 63 58 58 63 66 67 69 71 64 58 60 59 58 56 58Spain 1247 1293 1325 1300 1329 1351 1317 1365 1376 1447 1477 1459 1522 1519 1519Sweden 306 295 293 281 283 271 261 250 242 230 217 211 206 203 197Switzerland 156 148 141 134 127 119 116 112 109 105 101 97 92 88 87Turkey 691 711 730 750 769 789 819 850 881 912 942 940 937 934 932Ukraine 1753 1652 1550 1448 1346 1245 1168 1091 1015 938 861 886 911 936 960United Kingdom 2932 2803 2719 2546 2456 2355 2277 2121 2052 1936 1857 1799 1693 1685 1621
a All years: Reported values with white background, expert estimates replacing gaps in grey. Values in bold italic show replacement of reported data by expert estimates.

105
Table 3: National total emission trends Emissions of ammonia (1990-2004) used for modelling at the MSC-W (Gg of NH3 per year)a Country 1990 1991 1992 1993 1994 1995 1996 1997 1998 1999 2000 2001 2002 2003 2004Albania 23 22 21 20 20 19 19 20 21 21 22 22 23 23 23Armenia 24 24 23 22 18 15 16 15 15 14 13 13 12 15 17Austria 69 70 68 68 69 70 69 69 69 67 66 65 64 65 64Azerbaijan 68 68 65 61 50 41 45 41 41 38 37 36 35 41 48Belarus 215 208 192 181 165 154 153 152 150 143 142 134 128 120 121Belgium 112 110 108 107 105 103 100 96 93 90 87 84 82 79 74Bosnia and Herzegovina 21 20 19 19 18 17 17 17 17 17 17 17 17 17 17
Bulgaria 144 124 111 109 101 99 83 77 66 60 56 56 56 52 54Croatia 53 52 52 52 52 52 52 53 54 55 53 52 53 53 53Cyprus 5 5 5 5 5 5 6 6 6 6 6 7 5 6 6Czech Republic 157 136 113 96 88 87 83 83 82 77 76 81 74 82 69Denmark 134 130 128 125 121 114 110 110 111 106 105 104 102 98 98Estonia 26 23 19 15 14 12 11 11 11 10 9 9 9 10 10Finland 38 37 37 36 35 35 36 38 35 33 33 33 33 33 33France 787 772 777 757 766 772 775 789 788 780 789 775 778 750 742Georgia 36 36 35 33 27 22 24 22 22 20 20 19 19 22 26Germany 758 670 653 654 633 642 645 636 644 650 646 659 649 648 641Greece 79 77 74 74 72 81 72 70 73 73 73 73 72 72 72Hungary 124 93 84 77 76 77 78 76 74 72 71 67 65 67 74Iceland 4 4 4 4 4 4 4 4 4 4 4 4 4 4 4Ireland 114 116 119 119 120 121 123 125 128 128 123 123 119 116 113Italy 405 417 411 420 416 417 411 426 428 436 424 433 435 423 412Kazakhstan 664 621 578 535 492 449 453 457 462 466 470 487 503 520 537Latvia 47 44 32 20 17 15 14 14 13 12 12 14 13 14 13Lithuania 82 73 63 54 44 34 36 38 40 41 43 45 46 47 49Luxembourg 7 7 7 7 7 7 7 7 7 7 7 7 7 7 7Macedonia, TFYR of 15 15 15 15 14 14 14 14 14 14 14 14 14 14 14
Malta 0.7 0.7 0.8 0.8 0.8 0.9 0.9 0.9 0.9 1.0 1.0 1.0 0.8 0.9 0.9Moldova, Republic of 61 58 54 51 48 45 41 38 35 31 28 30 30 27 26
Netherlands 249 238 227 216 204 193 186 180 173 167 152 143 136 130 134Norway 20 21 22 22 22 23 24 23 23 23 23 23 23 23 23Poland 511 442 416 381 383 378 363 349 369 340 321 328 325 323 317Portugal 55 60 61 60 63 63 63 66 65 65 64 66 64 64 64Romania 289 267 250 230 211 193 203 213 223 237 252 253 257 261 266Russian Federation 1204 1174 1097 916 785 837 762 743 688 670 663 638 613 613 621
Serbia and Montenegro 74 72 70 68 65 63 63 64 64 64 65 65 65 66 66
Slovakia 66 59 50 44 41 42 41 39 34 32 32 33 33 31 28Slovenia 25 24 24 24 23 22 22 20 20 20 20 20 20 19 17Spain 329 318 316 297 317 306 340 339 358 370 388 384 385 399 413Sweden 55 55 55 62 62 64 61 62 61 59 58 57 57 56 56Switzerland 68 67 66 65 64 63 62 62 61 61 60 57 55 52 58Turkey 373 376 379 382 385 387 390 394 397 400 403 404 405 406 407Ukraine 682 638 594 550 506 463 467 472 476 481 485 500 517 533 550United Kingdom 382 382 368 365 368 359 362 364 361 358 337 330 319 308 336
a All years: Reported values with white background, expert estimates replacing gaps in grey. Values in bold italic show replacement of reported data by expert estimates.

106
Table 4: National total emission trends Emissions of non-methane volatile organic compounds (1990-2004) used for modelling at the MSC-W (Gg of NMVOC per year)a Country 1990 1991 1992 1993 1994 1995 1996 1997 1998 1999 2000 2001 2002 2003 2004Albania 31 31 31 31 31 31 30 30 30 30 29 30 31 31 32Armenia 95 84 72 60 49 37 39 41 43 45 47 47 48 49 49Austria 284 272 243 238 221 221 216 203 190 179 179 182 176 175 172Azerbaijan 376 341 307 272 237 202 208 215 221 227 233 233 233 234 234Belarus 497 473 449 426 402 378 370 363 355 348 340 320 301 314 326Belgium 305 295 285 275 265 255 244 233 223 212 201 194 181 173 165Bosnia and Herzegovina 48 46 43 40 38 35 36 37 38 39 40 40 41 41 42
Bulgaria 214 183 176 174 185 192 164 138 144 140 123 128 123 121 132Croatia 105 86 64 69 75 74 81 80 79 77 80 83 91 104 122Cyprus 16 16 16 16 16 16 16 16 16 16 16 16 16 16 12Czech Republic 374 337 312 301 302 281 287 286 276 264 266 257 238 238 240Denmark 166 167 165 161 156 152 152 144 135 130 127 122 118 116 116Estonia 71 67 43 36 39 47 50 51 43 42 38 34 39 41 41Finland 221 208 201 194 192 187 181 175 171 167 154 157 151 145 142France 2414 2392 2344 2240 2119 2032 1944 1870 1812 1733 1658 1587 1476 1411 1367Georgia 151 132 112 92 73 53 64 76 87 99 110 110 109 108 107Germany 3584 3043 2775 2520 2247 2100 1974 1913 1842 1714 1569 1476 1381 1272 1268Greece 281 289 295 301 307 302 306 304 308 303 295 289 261 278 262Hungary 252 197 188 195 188 191 191 187 181 184 187 179 176 171 172Iceland 12 12 12 12 12 12 12 11 10 10 9 10 10 11 11Ireland 111 111 114 109 107 105 112 116 118 98 90 87 81 78 63Italy 2023 2090 2146 2102 2046 2022 1970 1904 1798 1711 1538 1453 1344 1307 1273Kazakhstan 214 195 177 158 140 122 125 129 133 136 140 143 145 147 150Latvia 73 63 55 51 63 62 64 64 64 64 58 58 59 60 64Lithuania 136 134 95 80 76 71 77 85 87 82 78 71 72 75 67Luxembourg 16 17 18 19 21 22 20 18 17 15 13 12 11 11 10Macedonia, TFYR of 21 22 24 25 26 27 27 27 26 26 25 26 27 27 28
Malta 8 8 8 8 8 8 8 8 8 8 8 8 8 8 7Moldova, Republic of 123 115 107 99 91 83 75 67 59 51 42 44 45 36 33
Monaco 1 1 1 1 1 1 1 1 1 1 1 1 0 0 0Netherlands 491 466 440 415 389 364 343 326 301 293 267 242 236 222 216Norway 295 294 323 340 353 367 369 367 360 368 379 389 343 297 265Poland 832 833 808 758 822 771 768 775 730 731 606 607 600 606 600Portugal 273 277 287 280 287 288 290 293 293 285 282 284 286 287 287Romania 517 485 453 421 389 357 362 366 370 374 378 385 391 398 404Russian Federation 3659 3354 3290 3053 2918 2848 2612 2379 2371 2446 2445 2510 2574 2791 2675
Serbia and Montenegro 158 151 145 138 131 125 128 131 134 138 141 142 144 145 147
Slovakia 122 115 111 108 110 111 108 99 97 90 86 88 84 88 91Slovenia 53 50 49 52 54 55 59 58 53 51 51 49 48 46 46Spain 1135 1177 1189 1119 1142 1093 1112 1126 1184 1181 1162 1147 1139 1146 1153Sweden 443 428 417 395 373 362 349 330 303 293 282 270 264 265 255Switzerland 262 245 228 211 194 177 168 158 149 139 130 126 121 117 98Turkey 636 613 591 568 546 523 531 539 547 555 563 561 559 556 554Ukraine 1053 992 931 870 809 748 727 705 684 663 641 662 683 704 725United Kingdom 2396 2315 2249 2140 2077 1939 1832 1766 1617 1463 1348 1252 1175 1073 1024
a All years: Reported values with white background, expert estimates replacing gaps in grey. Values in bold italic show replacement of reported data by expert estimates.
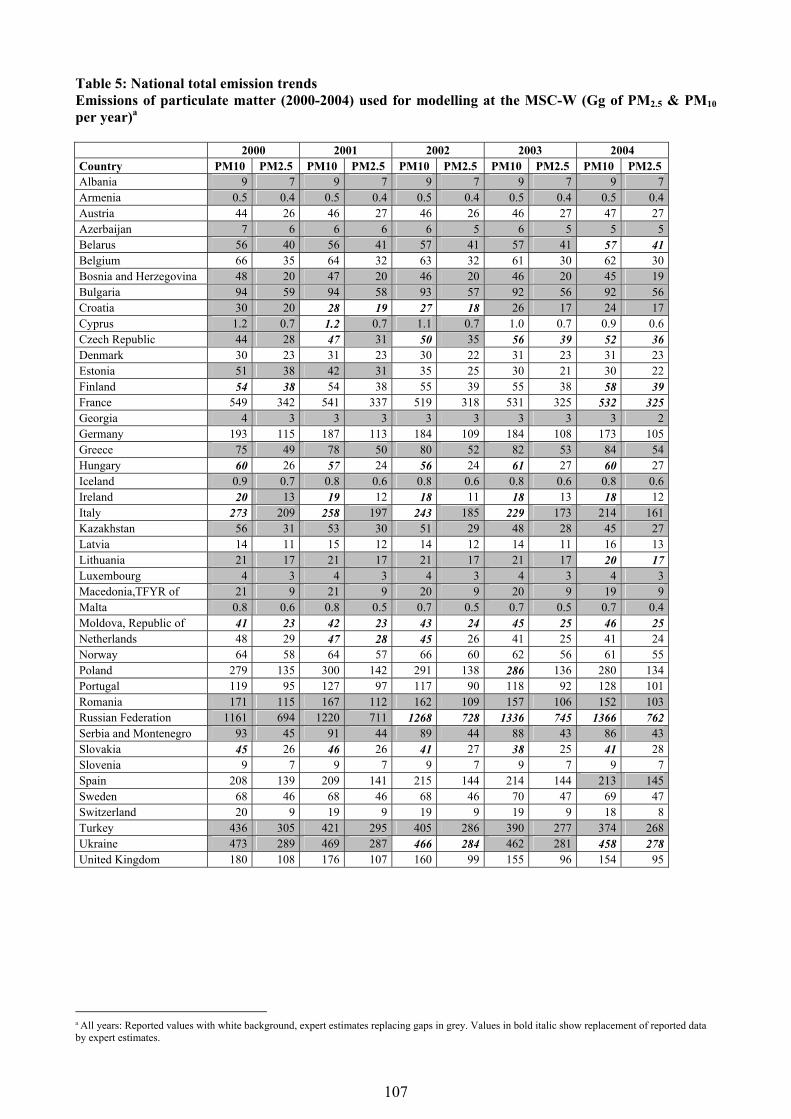
107
Table 5: National total emission trends Emissions of particulate matter (2000-2004) used for modelling at the MSC-W (Gg of PM2.5 & PM10 per year)a 2000 2001 2002 2003 2004 Country PM10 PM2.5 PM10 PM2.5 PM10 PM2.5 PM10 PM2.5 PM10 PM2.5 Albania 9 7 9 7 9 7 9 7 9 7Armenia 0.5 0.4 0.5 0.4 0.5 0.4 0.5 0.4 0.5 0.4Austria 44 26 46 27 46 26 46 27 47 27Azerbaijan 7 6 6 6 6 5 6 5 5 5Belarus 56 40 56 41 57 41 57 41 57 41Belgium 66 35 64 32 63 32 61 30 62 30Bosnia and Herzegovina 48 20 47 20 46 20 46 20 45 19Bulgaria 94 59 94 58 93 57 92 56 92 56Croatia 30 20 28 19 27 18 26 17 24 17Cyprus 1.2 0.7 1.2 0.7 1.1 0.7 1.0 0.7 0.9 0.6Czech Republic 44 28 47 31 50 35 56 39 52 36Denmark 30 23 31 23 30 22 31 23 31 23Estonia 51 38 42 31 35 25 30 21 30 22Finland 54 38 54 38 55 39 55 38 58 39France 549 342 541 337 519 318 531 325 532 325Georgia 4 3 3 3 3 3 3 3 3 2Germany 193 115 187 113 184 109 184 108 173 105Greece 75 49 78 50 80 52 82 53 84 54Hungary 60 26 57 24 56 24 61 27 60 27Iceland 0.9 0.7 0.8 0.6 0.8 0.6 0.8 0.6 0.8 0.6Ireland 20 13 19 12 18 11 18 13 18 12Italy 273 209 258 197 243 185 229 173 214 161Kazakhstan 56 31 53 30 51 29 48 28 45 27Latvia 14 11 15 12 14 12 14 11 16 13Lithuania 21 17 21 17 21 17 21 17 20 17Luxembourg 4 3 4 3 4 3 4 3 4 3Macedonia,TFYR of 21 9 21 9 20 9 20 9 19 9Malta 0.8 0.6 0.8 0.5 0.7 0.5 0.7 0.5 0.7 0.4Moldova, Republic of 41 23 42 23 43 24 45 25 46 25Netherlands 48 29 47 28 45 26 41 25 41 24Norway 64 58 64 57 66 60 62 56 61 55Poland 279 135 300 142 291 138 286 136 280 134Portugal 119 95 127 97 117 90 118 92 128 101Romania 171 115 167 112 162 109 157 106 152 103Russian Federation 1161 694 1220 711 1268 728 1336 745 1366 762Serbia and Montenegro 93 45 91 44 89 44 88 43 86 43Slovakia 45 26 46 26 41 27 38 25 41 28Slovenia 9 7 9 7 9 7 9 7 9 7Spain 208 139 209 141 215 144 214 144 213 145Sweden 68 46 68 46 68 46 70 47 69 47Switzerland 20 9 19 9 19 9 19 9 18 8Turkey 436 305 421 295 405 286 390 277 374 268Ukraine 473 289 469 287 466 284 462 281 458 278United Kingdom 180 108 176 107 160 99 155 96 154 95
a All years: Reported values with white background, expert estimates replacing gaps in grey. Values in bold italic show replacement of reported data by expert estimates.

108
Appendix 6: Example Synthesis and Assessment Report
Review report 2006 for Country XXX
Data included in review:
1. Emissions reported under the Convention on LRTAP to the UNECE Secretariat by: March 10th 2006
2. Emissions reported under the National Emission Ceilings Directive to the European Commission by: February 28th 2006
3. Emission and activity data reported to the UNFCCC by: 08th April 2006 Questions prepared and made available to countries by the Expert Review Team on: May 15th 2006.
Response from Country sent:
Date of your response:
Introduction
This review has been performed in accordance with the methods and procedures for review of emissions data under the LRTAP as outlined in Annex III of EB.AIR/GE.1/2005/7. In addition, efforts have been made to meet the requirements from the Parties following the first annual review in 2005. The 2006 review presents the results of different types of review tests and lists specific questions about your emissions inventory submitted to LRTAP and NEC. We have chosen to focus the tests on main pollutants, PMs and priority HMs and POPs and key sources. This year’s review is performed in co-operation with UBA-Vienna and AEAT in the framework of the European Topic Centre on Air and Climate Change (ETC-ACC). We wish to make the review process as easy as possible for you, and we will appreciate any additional feedback on the review process itself.
The review process is aiming at inventory improvements. As part of the Inventory Improvement Programme under the Task Force on Emission Inventories and Projections (TFEIP) Parties are expected to gradually improve the reporting. However, it may not be practical to implement all improvements in the next reporting. We do appreciate ideas for better solutions that may be implemented at a national or international level to improve the reporting and quality over a longer timescale.
The draft review findings will be discussed at the meeting of the TFEIP/Expert Panel on review at its meeting in den Haag 12-14 June 2006. Your response to this summary of Stage 1 and Stage 2 review will serve as input to a possible future Stage 3 review. A trial Stage 3, Centralized review was performed in Copenhagen 27 February-3 March 2006. Last year’s country specific review reports (this report) were found useful for the in-depth reviews.
The emission data included in the 2006 review is data reported to the UNECE under the LRTAP Convention or to the European Commission under the NEC Directive, and received before 10th

109
March 2006/28 February 2006 respectively. The LRTAP data is available through a pre-release of WEBDAB, user: webdab2006, password: wdab06.
We hope that you appreciate the improvements we have introduced to this year’s country specific review reports. These are:
• Separate testing and reporting of results for LRTAP and NEC data if the inventories are proved to differ by more than 0.1%
• Improved key source analysis including percentage contribution for each sector • Introduction of two average reports, one for Eastern Europe and one for Western Europe, in
order for you to compare your contribution to the average • Improved completeness testing with stronger focus on Protocol requirements, priority
compounds, key sources and reporting of Not Estimated • Improved comparability testing by introduction of more pollutant ratios • Inclusion of inventory comparisons with UNFCCC data • Inclusion of trend plots • Streamlining and extension of the time series check for main pollutants to 1980 • Improved IEFs checks by analysis with the UNFCCC outlier tool
We encourage you to take the time to complete the response boxes included in this document and return it to by e-mail to [email protected] with a copy to [email protected] by June 15th 2006.
Efforts have been made to eliminate questions already answered by you in an earlier UNECE/NEC review or in your Informative Inventory Report (IIR). We are still working on improving this part of the review procedure, and apologize beforehand if we have not managed to filter out all explained tasks.
110
Review tests performed in 2006 The review looks at several aspects of the national inventories. The intention of the review is to understand the common problems faced by countries with estimating and reporting emissions inventories.
• Part 1: An overview of key sources in order to understand the important source sectors for each country and prioritise review questions and improvement suggestions.
• Part 2: Compliance tests where the submissions are evaluated against the reporting guidelines and Protocols and checked according to timeliness, formats, completeness and that internal summations are consistent.
• Part 3: A review of consistency between Parties’ inventories on the basis of sector-implied emission factors, key sector pollutant ratios, and sector and national totals in other reported inventories (e.g. NEC and UNFCCC) and within the time series presented. Checks are performed against previously reported inventories for recalculations and changes in reported estimates to determine whether these have been applied consistently across the latest available time series.
We would like to know who is responding to our questions, so please enter your own contact details:
Your name: Your organisation: Your e-mail address:
Thank you for your assistance with the 2006 Inventory Review!
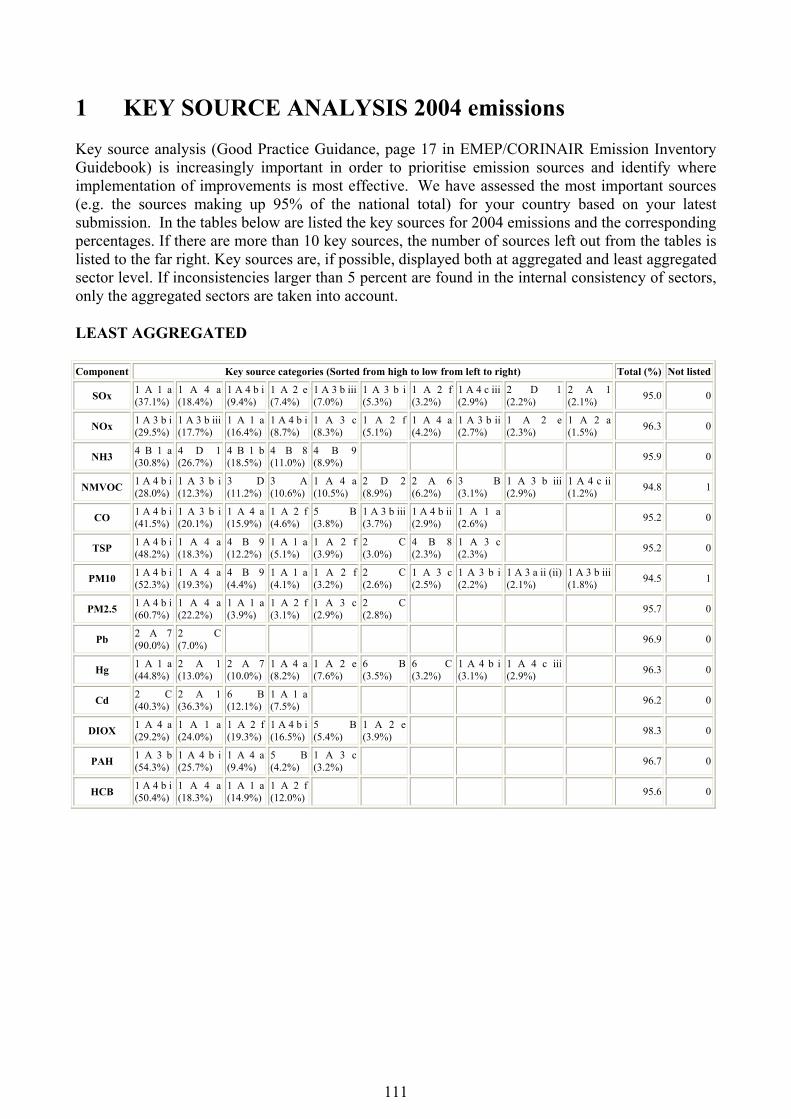
111
1 KEY SOURCE ANALYSIS 2004 emissions Key source analysis (Good Practice Guidance, page 17 in EMEP/CORINAIR Emission Inventory Guidebook) is increasingly important in order to prioritise emission sources and identify where implementation of improvements is most effective. We have assessed the most important sources (e.g. the sources making up 95% of the national total) for your country based on your latest submission. In the tables below are listed the key sources for 2004 emissions and the corresponding percentages. If there are more than 10 key sources, the number of sources left out from the tables is listed to the far right. Key sources are, if possible, displayed both at aggregated and least aggregated sector level. If inconsistencies larger than 5 percent are found in the internal consistency of sectors, only the aggregated sectors are taken into account.
LEAST AGGREGATED
Component Key source categories (Sorted from high to low from left to right) Total (%) Not listed
SOx 1 A 1 a (37.1%)
1 A 4 a (18.4%)
1 A 4 b i (9.4%)
1 A 2 e (7.4%)
1 A 3 b iii(7.0%)
1 A 3 b i(5.3%)
1 A 2 f(3.2%)
1 A 4 c iii(2.9%)
2 D 1 (2.2%)
2 A 1 (2.1%) 95.0 0
NOx 1 A 3 b i (29.5%)
1 A 3 b iii (17.7%)
1 A 1 a (16.4%)
1 A 4 b i (8.7%)
1 A 3 c(8.3%)
1 A 2 f(5.1%)
1 A 4 a(4.2%)
1 A 3 b ii(2.7%)
1 A 2 e (2.3%)
1 A 2 a (1.5%) 96.3 0
NH3 4 B 1 a (30.8%)
4 D 1 (26.7%)
4 B 1 b (18.5%)
4 B 8 (11.0%)
4 B 9(8.9%) 95.9 0
NMVOC 1 A 4 b i (28.0%)
1 A 3 b i (12.3%)
3 D (11.2%)
3 A (10.6%)
1 A 4 a(10.5%)
2 D 2(8.9%)
2 A 6(6.2%)
3 B(3.1%)
1 A 3 b iii (2.9%)
1 A 4 c ii (1.2%) 94.8 1
CO 1 A 4 b i (41.5%)
1 A 3 b i (20.1%)
1 A 4 a (15.9%)
1 A 2 f (4.6%)
5 B(3.8%)
1 A 3 b iii(3.7%)
1 A 4 b ii(2.9%)
1 A 1 a(2.6%) 95.2 0
TSP 1 A 4 b i (48.2%)
1 A 4 a (18.3%)
4 B 9 (12.2%)
1 A 1 a (5.1%)
1 A 2 f(3.9%)
2 C(3.0%)
4 B 8(2.3%)
1 A 3 c(2.3%) 95.2 0
PM10 1 A 4 b i (52.3%)
1 A 4 a (19.3%)
4 B 9 (4.4%)
1 A 1 a (4.1%)
1 A 2 f(3.2%)
2 C(2.6%)
1 A 3 c(2.5%)
1 A 3 b i(2.2%)
1 A 3 a ii (ii) (2.1%)
1 A 3 b iii (1.8%) 94.5 1
PM2.5 1 A 4 b i (60.7%)
1 A 4 a (22.2%)
1 A 1 a (3.9%)
1 A 2 f (3.1%)
1 A 3 c(2.9%)
2 C(2.8%) 95.7 0
Pb 2 A 7 (90.0%)
2 C (7.0%) 96.9 0
Hg 1 A 1 a (44.8%)
2 A 1 (13.0%)
2 A 7 (10.0%)
1 A 4 a (8.2%)
1 A 2 e(7.6%)
6 B(3.5%)
6 C(3.2%)
1 A 4 b i(3.1%)
1 A 4 c iii (2.9%) 96.3 0
Cd 2 C (40.3%)
2 A 1 (36.3%)
6 B (12.1%)
1 A 1 a (7.5%) 96.2 0
DIOX 1 A 4 a (29.2%)
1 A 1 a (24.0%)
1 A 2 f (19.3%)
1 A 4 b i (16.5%)
5 B(5.4%)
1 A 2 e(3.9%) 98.3 0
PAH 1 A 3 b (54.3%)
1 A 4 b i (25.7%)
1 A 4 a (9.4%)
5 B (4.2%)
1 A 3 c(3.2%) 96.7 0
HCB 1 A 4 b i (50.4%)
1 A 4 a (18.3%)
1 A 1 a (14.9%)
1 A 2 f (12.0%) 95.6 0

112
AGGREGATED Component Key source categories (Sorted from high to low from left to right) Total (%) Not listed
SOx 1 A 1 a (37.1%)
1 A 4 a (18.4%)
1 A 3 b (13.3%)
1 A 2 (10.9%)
1 A 4 b(9.5%)
1 A 4 c(4.2%)
2 D(2.2%) 95.6 0
NOx 1 A 3 b (49.8%)
1 A 1 a (16.4%)
1 A 2 (9.3%)
1 A 4 b (8.8%)
1 A 3 c(8.3%)
1 A 4 a(4.2%) 96.8 0
NH3 4 B (70.7%)
4 D 1 (26.7%) 97.4 0
NMVOC 1 A 4 b (28.5%)
1 A 3 b (15.8%)
3 D (11.2%)
3 A (10.6%)
1 A 4 a(10.5%)
2 D(8.9%)
2 A(6.3%)
3 B(3.1%)
1 A 4 c(2.0%) 96.9 0
CO 1 A 4 b (44.4%)
1 A 3 b (25.3%)
1 A 4 a (15.9%)
1 A 2 (5.5%)
5 B(3.8%)
1 A 1 a(2.6%) 97.6 0
TSP 1 A 4 b (48.2%)
1 A 4 a (18.3%)
4 B (15.6%)
1 A 2 (5.2%)
1 A 1 a(5.1%)
2 C(3.0%) 95.3 0
PM10 1 A 4 b (52.3%)
1 A 4 a (19.3%)
4 B (6.0%)
1 A 3 b (4.4%)
1 A 1 a(4.1%)
1 A 2(4.1%)
2 C(2.6%)
1 A 3 c(2.5%) 95.4 0
PM2.5 1 A 4 b (60.7%)
1 A 4 a (22.2%)
1 A 2 (4.0%)
1 A 1 a (3.9%)
1 A 3 c(2.9%)
2 C(2.8%) 96.5 0
Pb 2 A (92.6%)
2 C (7.0%) 99.6 0
Hg 1 A 1 a (44.8%)
2 A (23.0%)
1 A 2 (10.9%)
1 A 4 a (8.2%)
6 B(3.5%)
1 A 4 c(3.3%)
6 C(3.2%) 96.9 0
Cd 2 C (40.3%)
2 A (37.0%)
6 B (12.1%)
1 A 1 a (7.5%) 96.9 0
DIOX 1 A 4 a (29.2%)
1 A 1 a (24.0%)
1 A 2 (23.4%)
1 A 4 b (16.5%)
5 B(5.4%) 98.5 0
PAH 1 A 3 b (54.3%)
1 A 4 b (25.7%)
1 A 4 a (9.4%)
5 B (4.2%)
1 A 3 c(3.2%) 96.7 0
HCB 1 A 4 b (50.4%)
1 A 4 a (18.3%)
1 A 1 a (14.9%)
1 A 2 (14.6%) 98.1 0
NEC Component Key source categories (Sorted from high to low from left to right) Total (%) Not listed
SOx 1 A 1 a (37.5%)
1 A 4 a (18.6%)
1 A 4 b (9.5%)
1 A 2 e (7.4%)
1 A 3 b iii(7.1%)
1 A 3 b i(5.2%)
1 A 2 f(3.2%)
1 A 4 c iii(2.9%)
2 D 1(2.2%)
2 A 1 (2.2%) 95.9 0
NOx 1 A 3 b i (29.5%)
1 A 3 b iii (17.7%)
1 A 1 a (16.4%)
1 A 4 b (8.8%)
1 A 3 c(8.3%)
1 A 2 f(5.1%)
1 A 4 a(4.2%)
1 A 3 b ii(2.7%)
1 A 2 e(2.3%)
1 A 2 a (1.5%) 96.4 0
NH3 4 B 1 a (30.8%)
4 D 1 (26.6%)
4 B 1 b (18.5%)
4 B 8 (11.0%)
4 B 9(8.9%) 95.8 0
NMVOC 1 A 4 b (27.4%)
1 A 3 b i (15.6%)
3 D (10.8%)
3 A (10.2%)
1 A 4 a(10.1%)
2 D 2(8.5%)
2 A 6(6.0%)
3 B(3.0%)
1 A 3 b iii(2.8%)
1 A 4 c ii (1.1%) 95.5 0
AGGREGATED Component Key source categories (Sorted from high to low from left to right) Total (%) Not listed
SOx 1 A 1 a (37.5%)
1 A 4 a (18.6%)
1 A 3 b (14.7%)
1 A 2 (11.0%)
1 A 4 b(9.5%)
1 A 4 c(4.2%) 95.6 0
NOx 1 A 3 b (49.9%)
1 A 1 a (16.4%)
1 A 2 (9.3%)
1 A 4 b (8.8%)
1 A 3 c(8.3%)
1 A 4 a(4.2%) 96.8 0
NH3 4 B (70.6%)
4 D 1 (26.6%) 97.2 0
NMVOC 1 A 4 b (27.4%)
1 A 3 b (19.0%)
3 D (10.8%)
3 A (10.2%)
1 A 4 a(10.1%)
2 D(8.5%)
2 A(6.1%)
3 B(3.0%) 95.1 0

113
Review Team Comment:
Please indicate if the sources (in the table(s) above) are the key sources for your country or whether there are additional sources that are important but not reported. For your information, an overview of key sources for Western and Eastern European countries is found here.
Your comments:
114
2 COMPLIANCE TESTS
2. A TIMELINESS
Date of submission NEC: 30.12.2005
Review Team Comment: Submission was received within deadline 31.12.2005
Date of submission Convention of LRTAP: 15.2.2006
Review Team Comment: Submission was received within deadline 15.02.2006
Informative Inventory Report: Received by 1st May 2006
You may want to provide additional response to the comments above in the box below.
Your comments:
2 B FORMAT OF SUBMISSION
This section indicates whether the data submitted was in the correct Nomenclature For Reporting (NFR) and the files were formatted as requested in the Guidelines for Estimating and Reporting Emission data to the LRTAP and NEC. NEC Submitted Format: NFR Version 2002-2 LRTAP Submitted Format: NFR Version 2004-1
Review Team Comment to reporting format:
Please indicate any additional response to the review comments in the box below.
Your comments:

115
2 C COMPLETENESS PER POLLUTANT
The completeness of your submission of priority pollutants has been evaluated on the basis of the following criteria outlined in the Emission Reporting Guidelines;
• Main Pollutants from 1980 to latest year • HMs and POPs from 1990 to latest year • PMs from 2000 to latest year.
All numbers are in percent of the total number of reporting template cells per component and time series. Flagging occurs when the total number of cells containing a value or notation key is less than 80% , if there are more than 10% zeroes reported in cells and if the percent values reported is less than 10%.. An overview of the average completeness for Western and Eastern Europe is found at http://emep.int/REVIEW/2006/examples.
LRTAP:
Component % Total % 0 % NO % NE % NA % IE % C % NR % Value SOx 58 1 12 8 18 1 0 0 15 NOx 58 0 11 6 20 1 0 0 17 NH3 58 2 10 8 23 1 0 0 12
NMVOC 58 0 12 7 14 1 0 0 23 CO 58 0 9 6 23 1 0 0 17
DIOX 98 0 20 20 30 6 0 0 20 PAH 98 0 21 14 39 6 0 0 16 HCB 98 0 14 5 63 0 0 0 13 Pb 98 5 15 10 47 0 0 0 19 Hg 98 1 14 15 47 0 0 0 17 Cd 98 7 13 9 48 0 0 0 18
PM2.5 98 1 18 21 21 6 0 0 29 PM10 98 2 18 21 21 0 0 0 34 TSP 98 1 18 21 20 6 0 0 30
NEC:
Component % Total % 0 % NO % NE % NA % IE % C % NR % Value SOx 97 0 51 11 1 7 0 0 25 NOx 97 0 50 9 1 7 0 0 28 NH3 97 1 62 8 1 0 0 0 23
NMVOC 97 0 30 21 1 7 0 0 36
116
Review Team Comment:
For the main pollutants submitted to LRTAP the % total values/flags reported is lower than for other pollutants. Please comment. Please also comment on your review results in the context of the reports from Western and Eastern Europe provided here.
Please provide response to the specific request for clarification and any other additional related comments in the box below.
Your comments:

117
2 D COMPLETENESS PER SECTOR (YEAR 2004 EMISSIONS)
An X in the table below shows for which sectors you have reported Not Estimated (NE) in the 2004 emission data (priority pollutants included). The sectors with no reporting of emission values other than zero are flagged.
LRTAP:
Least aggregated sector SOx NOx NH3 NMVOC CO TSP PM10 PM2.5 Pb Hg Cd DIOX PAH HCB
1 A 1 b
1 A 3 a ii (i)
1 A 3 a ii (ii) X X X
1 A 3 b X
1 A 3 b iv X
1 A 3 b v X
1 A 3 b vi X X X X
1 A 3 b vii X X X X
1 A 3 c X
1 A 3 d i (i) X X
1 A 3 d i (ii) X X X X X X X X X X X X X
1 A 3 d ii X X
1 A 3 e X X X X X X X X X X
1 B 1 b
1 B 1 c
1 B 2 X X
1 B 2 a X X
1 B 2 a i
1 B 2 a v X X
1 B 2 a vi
1 B 2 b X X X
1 B 2 c
1 a 3 a i (i) X X X X X X X X X
1 a 3 a i (ii) X X X X X X X X X
2 A 3
2 A 4
2 A 5 X X X X X X X
2 B
2 B 1
2 B 5
2 D X X X X X X
4 B 4 X X X
4 B 5
4 B 6 X X X
4 B 7
4 C
4 F
6 C X X X X X
6 D
7 X X X X X X X X X X X X X X
X
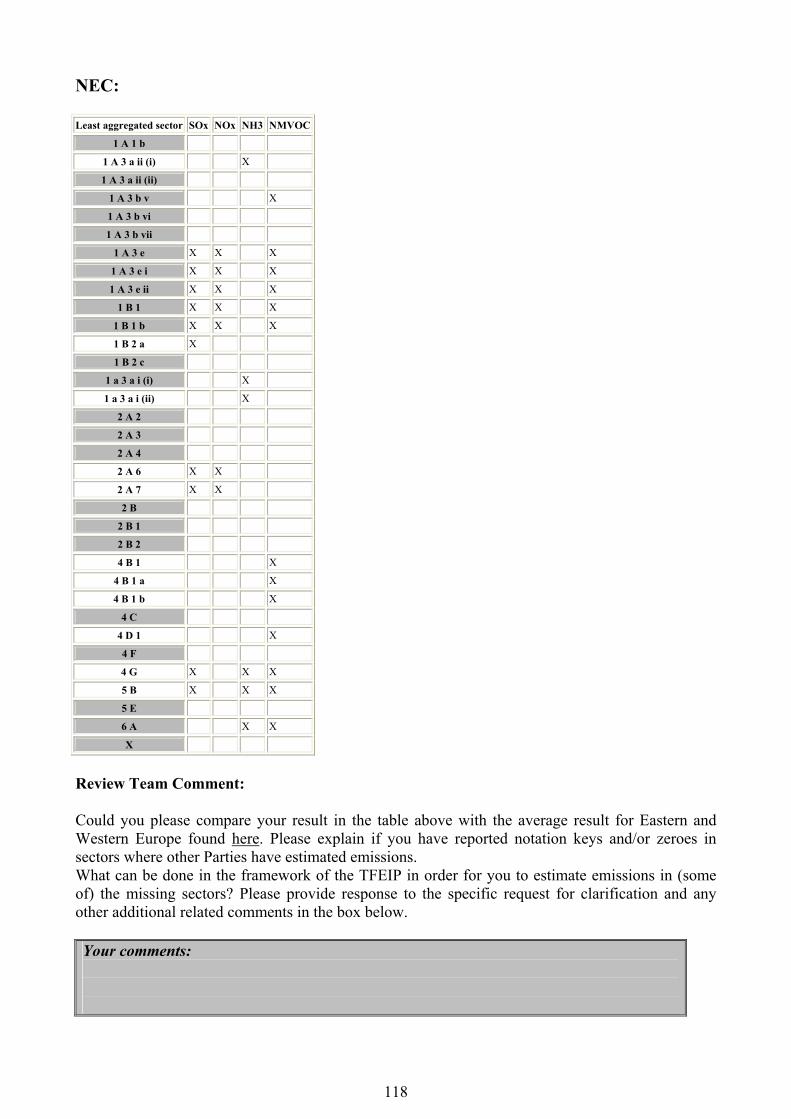
118
NEC:
Least aggregated sector SOx NOx NH3 NMVOC
1 A 1 b
1 A 3 a ii (i) X
1 A 3 a ii (ii)
1 A 3 b v X
1 A 3 b vi
1 A 3 b vii
1 A 3 e X X X
1 A 3 e i X X X
1 A 3 e ii X X X
1 B 1 X X X
1 B 1 b X X X
1 B 2 a X
1 B 2 c
1 a 3 a i (i) X
1 a 3 a i (ii) X
2 A 2
2 A 3
2 A 4
2 A 6 X X
2 A 7 X X
2 B
2 B 1
2 B 2
4 B 1 X
4 B 1 a X
4 B 1 b X
4 C
4 D 1 X
4 F
4 G X X X
5 B X X X
5 E
6 A X X
X
Review Team Comment: Could you please compare your result in the table above with the average result for Eastern and Western Europe found here. Please explain if you have reported notation keys and/or zeroes in sectors where other Parties have estimated emissions. What can be done in the framework of the TFEIP in order for you to estimate emissions in (some of) the missing sectors? Please provide response to the specific request for clarification and any other additional related comments in the box below. Your comments:

119
2 E CONSISTENCY (INTERNAL) for 2004 data
The aim of this test is to confirm the internal data consistency of submissions. It checks that values reported within sub-sectors add up to the reported sector total, and that the values reported for sectors add up to the reported National Total. All notation keys are converted to zero in the calculation.
Review Team Comment:
Your LTRAP submission contained 9 inconsistencies
INCONSISTENCIES:
Internal consistency error: NFR-code 1 A 3 b <-> Sum of NFR-subsectors, Component: PM10: 0.71 <-> 0.72
Internal consistency error: NFR-code 1 A 3 b <-> Sum of NFR-subsectors, Component: benzo(k): 10.86 <-> 0
Internal consistency error: NFR-code 1 A 3 b <-> Sum of NFR-subsectors, Component: SOx: 0.53 <-> 0.54
Internal consistency error: NFR-code 1 A 3 b <-> Sum of NFR-subsectors, Component: PAH: 41.69 <-> 0
Internal consistency error: NFR-code 1 A 3 b <-> Sum of NFR-subsectors, Component: benzo(b): 13.68 <-> 0
Internal consistency error: NFR-code 1 A 3 b <-> Sum of NFR-subsectors, Component: Indeno: 9.81 <-> 0
Internal consistency error: NFR-code 1 A 3 b <-> Sum of NFR-subsectors, Component: benzo(a): 7.34 <-> 0
The REBDAP tool (webdab.emep.int/repdab.html) may be used to test your inventory submission to obtain detailed information regarding any inconsistencies noted
Please provide clarification in the box below.
Your comments:

120
3 COMPARABILITY TESTS These tests review the year to year comparability per country for pollutant ratios, recalculation, emission time series, country specific and average implied emission factors and the differences between the LRTAP, NEC and UNFCCC submissions.
3 A CROSS POLLUTANT
A cross pollutant ratio test has been implemented this year. The aim of this test is to check the consistency between reported pollutants and the comparability of pollutant ratios between countries. Pollutant ratios have been calculated for the transport (The sum of: 1 A 3 b i R.T., Passenger cars, 1 A 3 b ii R.T., Light duty vehicles, 1 A 3 b iii R.T., Heavy duty vehicles, 1 A 3 b iv R.T., Mopeds & Motorcycles,1 A 3 b v R.T., Gasoline evaporation), for fuel combustion (sum of all 1A sectors), for landfills (6A), for agriculture (4B+4D) and for national totals. For transport and agriculture, additionally NH3/N2O ratios have been calculated. The results should be compared to the average rations found for the Eastern and Western Europe found here. LRTAP: Pollutant ratio Sector Ratio calculated from reported data NOx/NMVOC Transport 1.96
NOx/CO Transport 0.22 NOx/PM2.5 Transport No PM2.5 reporting in Transport sector, IE NH3/N2O Transport 1.19 NH3/N2O Agriculture 3.28 PM10/Pb Fuel combustion 128560.67 PM10/Cd Fuel combustion 268246.28 PM10/Hg Fuel combustion 606489.44
TSP/PM2.5 Fuel combustion 1.19 TSP/PM2.5 National totals 1.42 TSP/PM10 Fuel combustion 1.10 TSP/PM10 National totals 1.15
NMVOC/CO Landfills NA/NE is reported for CO and NMVOC, NH3 in 6A NMVOC/NH3 Landfills NA/NE is reported for CO and NMVOC, NH3 in 6A
CO/NH3 Landfills NA/NE is reported for CO and NMVOC, NH3 in 6A
NEC: Pollutant ratio Sector Ratio calculated from reported dataNOx/NMVOC Transport 1.56
NH3/N2O Transport 1.17NH3/N2O Agriculture 3.28
NMVOC/NH3 Landfills

121
Review Team Comment:
Please compare your pollutant ratios with the average ratios found here and explain the differences. Your comments:

122
3 B RECALCULATIONS
The aim of this test is to identify differences between national totals reported by Parties between the 2006 and 2005 reporting years (100*[(X2006 – X2005)/ X2005]). Differences larger than 10% are flagged.
Key: Blank cell: Data for one of the reporting years are missing. Zero: Data (value or notation key) for the two years are equal. NP (Not Possible): Different notation keys are reported for the two years or reporting 2005 is zero or notation key while reporting year 2006 has a value. Value: Percentage difference between 2006 and 2005 reporting. 6.1.1.1.1.1.1 LRTAP year SOx NOx NH3 NMVOC CO TSP PM10 PM2.5 Pb Hg Cd DIOX PAH HCB
1990 -1.9736 -2.0510 -9.3656 -17.9999 -12.2508 11180.6497 1279.8402 -56.4376 -16.7615
1991 0.8677 -1.9238 -9.5746 -32.7467 -47.7619 9357.9187 1828.5972 -57.0547 -4.6274
1992 -1.4769 -1.9061 -8.7553 -3.7212 -3.2434 4512.1808 2542.2194 -46.9454 -10.9553
1993 -3.3622 -1.0668 -7.0244 -5.5059 -4.1216 5606.3163 2289.2190 55.9449 -30.2430
1994 -15.6844 -4.3653 -6.1416 -2.7983 17.8710 15004.4715 2063.8506 6.3294 65.1440
1995 -1.6919 -1.5637 -7.3702 -12.5429 -6.2044 5283.5640 2498.5485 -15.4263 29.7675
1996 -1.8902 -1.8675 -7.3197 -13.5411 -6.0509 3244.5917 2505.0894 -31.6249 10.0729
1997 -4.1923 -3.2019 -6.4770 -18.8830 -8.9374 2822.1118 1840.7822 -35.6029 -6.8389
1998 -2.6522 -2.5894 -6.0605 -20.4280 -10.6016 2820.7894 1858.0892 61.9424 34.4764
1999 -1.5139 -1.8091 -6.4642 -19.8637 -11.4657 2861.0575 1840.8735 -42.1997 21.8355
2000 -31.2921 0.8121 -6.0451 -18.5179 -4.0650 122.3519 193.2966 262.6291 914.9337 -53.8656 33.1813
2001 -25.7414 1.7160 -6.0682 -22.8490 6.0229 123.5154 214.5873 268.0678 1872.8715 -58.9792 36.2625
2002 -34.4557 1.1248 -6.7083 -24.6330 10.9120 124.5220 208.9586 262.2519 1766.8739 -67.7928 4.5857 -18.9574
2003 -37.7633 3.6519 -6.7953 -25.6532 10.1578 112.1365 190.0952 234.4361 1816.4810 -75.8748 -4.0415
NEC: year SOx NOx NH3 NMVOC
1990 -2.0970 -0.9723 -9.3526 -14.8884
1991 -0.5741 -2.0790 -9.5585 -13.2402
1992 -1.4367 -1.9194 -8.7556 -2.1116
1993 -3.4235 -1.0824 -7.0302 0.1856
1994 -16.5055 -4.8120 -6.1447 2.5371
1995 -1.7907 -1.4799 -7.3855 -8.2936
1996 -1.4572 -1.7489 -7.3164 -9.2888
1997 -3.4469 -2.5361 -6.3762 -14.9164
1998 -5.0291 -2.5597 -6.0737 -16.8150
1999 1.2455 -1.1628 -6.4429 -16.3925
2000 -26.5464 1.5104 -6.0257 -15.0060
2001 -21.7963 2.3225 -6.0854 -19.3593
2002 -31.5063 1.4364 -6.6840 -21.5454
2003 -35.6689 3.6397 -6.7715 -21.5816
Review Team Comment:
We note very large recalculations. Can you please explain the recalculations flagged? Are there specific additional explanations to the ones given in the IIR?

123
3 C INVENTORY COMPARISON
The aim of this test is to compare national totals reported to NEC, LRTAP and UNFCCC reported within 10th March 2006 (LRTAP), 28th February 2006 (NEC) and 15th March 2006 (UNFCCC). Flagged values indicate difference of greater than 0.1% between the respective national totals (LRTAP-NEC-UNFCCC).
LRTAP-NEC
year SOx NOx NH3 NMVOC
1990 0.1533 -0.9201 -0.0143 -3.6651
1991 1.4501 0.1589 -0.0178 -22.4833
1992 -0.0378 0.0104 0.0003 -1.6475
1993 0.0634 0.0253 0.0062 -5.6805
1994 0.9835 0.4693 0.0034 -5.2034
1995 0.1150 0.2494 0.0166 -4.6396
1996 -0.0458 -0.0245 -0.0035 -4.6605
1997 -0.6987 -0.0545 -0.1076 -4.5569
1998 2.5031 -0.0305 0.0141 -4.2980
1999 -0.2627 -0.0390 -0.0227 -4.1239
2000 -3.3500 0.0148 -0.0207 -4.0504
2001 -2.1360 0.0190 0.0183 -4.2512
2002 -1.7836 0.1800 -0.0260 -3.8388
2003 -3.2091 0.0024 -0.0255 -5.1193
2004 1.0685 0.0038 -0.1395 -3.8152
LRTAP-UNFCCC
Year NOx CO NMVOC SOx 1990 0,47 -0,36 -0,08 -1,25 1991 0,88 -0,01 0,13 0 1992 -0,36 -0,09 1,24 -0,89 1993 -1,26 -0,32 -0,25 -1,25 1994 -0,84 -0,31 -0,21 -1,29 1995 -0,92 -0,11 -0,04 -0,77 1996 -0,88 -0,14 -0,12 -0,70 1997 -0,81 -0,15 -0,12 -0,55 1998 -0,85 -0,13 -0,10 -0,57 1999 -0,73 -0,13 -0,07 -0,59

124
Year NOx CO NMVOC SOx 2000 -1,15 -0,14 -0,11 -1,38 2001 -1,00 -0,19 -0,15 -2,83 2002 -0,87 -0,17 -0,10 -2,28 2003 -0,71 -0,05 -0,03 -0,23 2004 -0,58 -0,03 6,23 1,92
NEC-UNFCCC
Year Nox NMVOC SOx 1990 1,38 3,59 -1,40 1991 0,72 22,58 -1,45 1992 -0,37 2,87 -0,85 1993 -1,29 5,44 -1,31 1994 -1,31 5,00 -2,29 1995 -1,17 4,60 -0,89 1996 -0,85 4,55 -0,66 1997 -0,75 4,45 0,15 1998 -0,82 4,20 -3,09 1999 -0,69 4,05 -0,33 2000 -1,17 3,94 2,01 2001 -1,02 4,11 -0,64 2002 -1,05 3,75 -0,45 2003 -0,71 5,09 2,98 2004 -0,59 9,81 0,87
Review Team Comment: Please explain the flagged values Your comments:

125
3 D TRENDS
Please find below trends in your national totals of priority pollutants reported under CLRTAP. Please explain the possible dips and jumps seen. These plots add to the dips and jumps picked up in the time series test (3E below) by showing extreme potential outliers not picked up in test 3E because sigma became too large.

126
Your comments:

127
3 E TIME SERIES
The aim of this test is to identify instances of dips, jumps, and sudden trends in time series data reported by countries. Only data in new NFR reporting format were analysed, and data for which at least three years was reported. The table below shows data that was flagged where outliers in time series data were identified based on the following methodology: Reported time series data were log 10-transformed prior to analysis to reduce intra-series variability and improve general time series linearity. A linear regression was subsequently applied to the log-transformed values for each time series. Time series with a large sigma (> 0.2) have been flagged generally. An individual value within the time series was identified as a dip/jump if the respective residual value (regression forecast value - reported value) was greater than 2.5 standard deviations from the mean of all residuals within the time series. Only time series with a significant fraction (>3%) of the national total are included. Identified dips and jumps have been flagged at both a detailed and aggregated sector level (due to inconsistencies that occur in some cases between the reported subsectors and aggregated sectors). Please note that time series from 1980-2004 are presented in two rows. The test was performed for the following time series if data was available: Main pollutant s 1980-2004 HMs and POPs: 1990-2004 PMs: 2000-2004
1980 1981 1982 1983 1984 1985 1986 1987 1988 1989 1990 1991
NMVOC (Gg) 1A4c 28.482 3.070
NMVOC (Gg) 1A4cii 27.657 2.244
NMVOC (Gg) NATIONALTOTAL 99.092 63.933
CO (Gg) 1A1a 4.175 4.422
CO (Gg) 1A4a 33.512 32.541
CO (Gg) 1A4b 114.271 140.413
CO (Gg) NATIONALTOTAL 463.437 326.104
1992 1993 1994 1995 1996 1997 1998 1999 2000 2001 2002 2003 2004
SOx (Gg) 1A2 15.396 13.623 18.186 16.474 16.458 14.358 10.645 9.138 2.762 1.315 0.902 0.709 0.435
SOx (Gg) 1A2c 1.190 2.354 0.196 1.842 0.078 0.124 0.059 0.059 0.078 0.059
SOx (Gg) 1A2f 13.664 11.064 13.335 9.493 7.419 6.720 1.803 0.633 0.295 0.303 0.127
SOx (Gg) 1A3di(i) 6.970 11.990 12.020 7.070 4.310 2.930 0.160 0.010 0.010 0.390 0.490 0.470 0.560
NOx (Gg) 1A3di(i) 8.820 15.430 16.880 9.350 5.940 4.230 0.680 0.420 0.340 10.550 11.600 10.700 11.630
NH3 (Gg) 4D1 6.600 3.970 2.900 1.150 1.450 1.940 1.960 1.900 2.300 3.160 2.760 3.740 3.520
NMVOC (Gg) 1A4a 4.743 0.617 3.684 3.172 2.977 2.782 3.193 3.818 3.141 3.194 3.113 2.939 6.634
Colour Key indicates a dip in the Time Series Data indicates a jump in the Time Series Data indicates Time Series Data with large sigma

128
1992 1993 1994 1995 1996 1997 1998 1999 2000 2001 2002 2003 2004
NMVOC (Gg) 1A4b 15.341 9.620 17.012 18.516 19.341 18.282 18.282 17.612 17.386 18.914 18.605 18.205 18.005
CO (Gg) 1A1a 27.257 7.455 4.640 5.368 5.648 8.391 8.736 7.713 8.340 8.161 9.134 10.013 9.350
CO (Gg) 1A4a 116.093 9.170 35.811 27.092 27.084 25.491 28.102 34.029 28.244 28.679 27.169 25.711 56.526
CO (Gg) 1A4b 270.136 81.638 143.110 154.868 161.786 152.876 152.588 146.973 152.712 165.675 162.959 159.622 157.964
CO (Gg) NATIONALTOTAL 592.735 305.113 385.210 378.936 384.284 351.317 342.846 331.337 319.397 328.703 321.297 325.414 355.537
1990 1991 1992 1993 1994 1995 1996 1997 1998 1999 2000 2001 2002 2003 2004
DIOX (g) 1A2 0.938 0.253 0.172 0.196 1.851 4.087 4.877 4.776 4.296 4.275 3.786 4.568 4.916 4.218
DIOX (g) 1A2f 0.823 0.146 1.603 3.876 4.605 4.389 3.976 3.991 3.477 3.913 4.009 4.378 3.481
DIOX (g) 1A4a 2.225 2.241 0.020 0.018 2.274 2.268 2.020 1.874 2.268 2.808 2.307 2.357 2.343 2.196 5.265
HCB (kg) 1A2 0.008 0.007 0.007 0.033 0.073 0.087 0.085 0.077 0.076 0.068 0.082 0.088 0.076
HCB (kg) 1A2f 0.019 0.006 0.029 0.069 0.083 0.078 0.071 0.071 0.062 0.070 0.072 0.078 0.062
HCB (kg) 1A4a 0.041 0.041 0.001 0.001 0.042 0.041 0.037 0.034 0.041 0.051 0.042 0.043 0.042 0.040 0.095
HCB (kg) 1A4c 0.010 0.010 0.000 0.004 0.011 0.003 0.003 0.005 0.006 0.007 0.007 0.007 0.006 0.005 0.007
HCB (kg) 1A4ci 0.010 0.010 0.000 0.004 0.011 0.003 0.002 0.005 0.006 0.007 0.007 0.006 0.006 0.005 0.007
1990 1991 1992 1993 1994 1995 1996 1997 1998 1999 2000 2001 2002 2003 2004
Pb (Mg) 2A1 9.304 9.000 4.250 0.216 3.050 2.550 4.062 3.075 4.575 3.767 2.990 3.107 3.255 3.690 3.546
Hg (Mg) 1A4ci 0.001 0.003 0.001 0.000 0.086 0.015 0.000 0.000 0.000 0.000 0.000 0.000 0.000 0.000 0.000
Cd (Mg) 1A4b 0.002 0.001 0.005 0.004 0.407 0.168 0.001 0.000 0.000 0.000 0.000 0.000 0.000 0.000 0.000
Cd (Mg) 1A4bi 0.002 0.001 0.004 0.004 0.407 0.168 0.001 0.000 0.000 0.000 0.000 0.000 0.000 0.000 0.000
Cd (Mg) 1A4c 0.002 0.008 0.001 0.001 0.654 0.278 0.009 0.003 0.003 0.003 0.003 0.003 0.003 0.003 0.003
Cd (Mg) 1A4ci 0.001 0.008 0.001 0.001 0.318 0.076 0.001 0.001 0.001 0.001 0.000 0.000 0.000 0.000 0.000
Cd (Mg) 1A4ciii 0.335 0.201 0.008 0.003 0.002 0.003 0.003 0.003 0.003 0.003 0.003
Cd (Mg) 2A 0.487 0.472 0.225 0.012 0.162 0.136 0.215 0.164 0.242 0.199 0.159 0.165 0.173 0.196 0.188
Cd (Mg) 2A1 0.484 0.468 0.221 0.008 0.159 0.133 0.211 0.160 0.238 0.196 0.156 0.162 0.169 0.192 0.184
Review Team Comment: The table above highlights instances where large variations were found in the reported time series. While the respective jumps/dips may all have logical explanation (e.g. reduced fuel use in a given year) the identified instances may also reflect inconsistencies in underlying activity data/emission factors for that year. Any comments you are able to make concerning the identified jumps and dips are welcomed. (Time series from your NEC data submission that also contained identical flagged years as for CLRTAP NH3, NMVOC, NOx and SOx have been removed from the above table).
Your comments:

129
3 F Implied emission factors
The aim of this test was to identify outliers in the time series of Implied Emission Factors and across Parties. Activity data was obtained from the Greenhouse Gas Inventories reported under the Monitoring Mechanism (Directive 2004/280/EC) and used in conjunction with reported LRTAP and NEC emissions data to calculate implied emission factors for 1990-2004. Assessment has concentrated on the key categories for Western and Eastern European countries for the main pollutants SOx, NOx, NMVOC, NH3 and CO. For identification of outliers, the UNFCCC outlier tool was used. The table below lists individual country emission factors which are outliers in time series or across Parties (range from lowest to highest IEF provided). LRTAP: Key category Pollutant Type of
outlier Issue
1A1a CO Time series The IEF of CO from 1A1a increased by 733 % in 1992 from 0.04 to 0.31 t/TJ and decreased by 71 % in 1993 to 0.09 t/TJ.
1A4b CO Time series The IEF of CO from 1A4b increased by 132 % in 1992 from 3.3 to 7.7 t/TJ and decreased by 68 % in 1993 to 2.4 t/TJ.
1A4c CO Time series The IEF of CO from 1A4c decreased by 83 % in 1991 from 5.33 to 0.88 t/TJ and increased by 429 % in 1992 to 4.66 t/TJ.
4D1 NH3 Time series The IEF of NH3 from 4D1 decreased by 44 % in 1995 from 2.36 to 1.32 kg/kg N.
NEC:
Review Team Comment: Please explain the identified outliers.
Your comments:
130
4 YOUR COMMENTS ON THE REVIEW We would greatly appreciate your feedback (positive or negative) on the present review contents and any suggestions on how to improve the presentation of the review questions and responses.
Thank you for completing the 2006 review questionnaire and sending it to [email protected] with a copy to [email protected], before June 15th 2006.
Your comments:
Contact Details
For clarification of the questions please contact:
Vigdis Vestreng
Address: Mail: P.O. Box 43, Blindern, N-0313 Oslo Visit: Gaustadalleen 30D, 0373 OSLO NORWAY
Fax: +47 22 96 30 50 Work: +47 22 96 33 25 E-Mail: [email protected]