Embed Size (px)
Citation preview
M.Sc. Program in Wind Energy Technical University of Denmark
Ashikaga Institute of TechnologyCollaborative Research Center
Investigation of the Savonius‐type Magnus Wind Turbine
Master Thesis Project
Nemanja Komatinovic, s040570 MEK, Technical University of Denmark
Kgs. Lyngby, DK‐2800
Supervisors: Jens Nørkær Sørensen (Technical University of Denmark)
Izumi Ushiyama (Ashikaga Institute of Technology)
October 2006

Investigation of the Savonius‐type Magnus Wind Turbine ________________
Acknowledgements This study is a part of a Master Thesis project taken on Technical University of Denmark during the period April‐October 2006. Project was done in Japan as a part of the exchange between Technical University of Denmark and Collaborative Research Center at Ashikaga Institute of Technology, under the supervision of professor Jens Nørkær Sørensen and professor Izumi Ushiyama. I owe special thanks to both, professor Sørensen for allowing me to participate in such remote exchange program and to professor Ushiyama for accepting me on this project. Also I am thankful for their professional guidance during preparation of my thesis. I also would like to thank Nishizawa Yoshifumi and Kimishima Yoshinobu for necessary technical support and Satoshi Kawashima and Akira Ito for assistance during the wind tunnel experiments.
2

Investigation of the Savonius‐type Magnus Wind Turbine ________________
Abstract This papers deals with the concept of the so‐called Savonius‐type Magnus wind turbine. The turbine supports the idea of classical horizontal axis wind turbine where instead of the airfoil blades, Savonius rotors were used to create a lift forces. Blade simplicity allows production of the wind turbines at lower cost and possibility of spreading such technology for wind power production at more affordable rates. After 2D CFD analysis, static torque was found for the various Savonius configurations, and the four most promising, were chosen for the practical blade design. The wind tunnel tests were performed where the torque and rpm measurements of the main rotor took place. In addition, the measurements of the Savonius blade rpm were recorded for the purpose of finding the relationship between the rotational lift and a power output for different generator loading cases. A modal analysis of the Savonius blade was found to be necessary since a large vibrations occurred during the testing roughly around 1000rpm. Also a centrifugal buckling analysis was made with identification of the high‐stress locations. A Savonius‐type Magnus wind turbine was found to be a feasible device as a standalone low power production electromechanical system, and some aspects of possible prototype design were presented as a part of the current study.
3

Investigation of the Savonius‐type Magnus Wind Turbine ________________
Contents List of Symbols ............................................................................................................................ 6
1. Introduction............................................................................................................................. 8
1.1 Magnus Effect Theory ..................................................................................................... 8
1.1.1 Overview ..................................................................................................................... 8
1.1.2 Short Historical Note ............................................................................................. 12
1.2 Savonius Rotor Outline ................................................................................................ 13
1.2.1 Summary of Investigations on Savonius Rotor ................................................ 13
1.2.2 Some Characteristics of the Savonius Rotor...................................................... 14
1.2.3 Operating Principle ................................................................................................ 15
1.3 Idea Behind Savonius‐type Magnus Wind Turbine ............................................... 17
1.4 Plan of Investigations.................................................................................................... 21
2. Determination of the Static Torque ................................................................................... 23
2.1 Definition ......................................................................................................................... 23
2.2 Numerical Study.............................................................................................................. 23
2.3 Geometry Description .................................................................................................... 23
2.4 Flow Description ............................................................................................................. 25
2.5 Numerical Method.......................................................................................................... 25
2.6 Turbulence Model........................................................................................................... 26
2.7 Domain Size and Mesh Configuration ....................................................................... 28
2.8 Boundary Conditions.......................................................................................................... 33
2.9 Solver Algorithm............................................................................................................. 33
2.10 Post‐processing .............................................................................................................. 35
2.11 Results ............................................................................................................................. 35
2.11.1 Results Validation ................................................................................................. 35
2.11.2 Torque Analysis ..................................................................................................... 38
3. Blade Design and Prototype................................................................................................ 44
3.1 Design Objectives ........................................................................................................... 44
4

Investigation of the Savonius‐type Magnus Wind Turbine ________________
3.2 Prototype Description .................................................................................................... 45
4. Experimental Investigation ................................................................................................ 52
4.1 Experiment Setup and Facility...................................................................................... 52
4.2 Savonius Rotation Measurement ................................................................................. 54
4.3 Full Model Test Procedure ............................................................................................ 55
5. Results .................................................................................................................................... 56
5.1 Rotor Blade Experimental Results ............................................................................... 56
5.2 Magnus Experimental Results ...................................................................................... 62
6. Modal Analysis of the Blades ............................................................................................ 80
7. Stress and Deformation Analysis....................................................................................... 88
8. Future Investigations ............................................................................................................ 93
9. Conclusions and Recommendations.................................................................................. 94
10. Bibliography......................................................................................................................... 95
Appendix A: List of Figures..................................................................................................... 98
Appendix B: List of Tables .................................................................................................... 102
5

Investigation of the Savonius‐type Magnus Wind Turbine ________________
List of Symbols Note: List is not thorough, and omits some symbols that could be unique to particular chapters. a Savonius rotor overlap AM Swept area covered by the Magnus rotor AR Aspect ratio b Savonius rotor separation gap CD Total drag force coefficient cD Local 2D drag coefficient CL Total lift force coefficient cL Local 2D lift coefficient CP Power coefficient CQ Torque coefficient D Drag force DC Diameter of the Savonius rotor semi‐cylinders (paddles) DM Diameter of the Magnus turbine rotor DS Diameter of the Savonius rotor Fn Normal component of the total force vector Ft Tangential component of the total force vector GP Savonius rotor gap ratio HS Height of the Savonius rotor L Lift force nM Rotational speed of the Magnus turbine rotor nS Rotational speed of the Savonius rotor OL Savonius rotor overlap ratio Pmech Mechanical power on the main shaft of the Magnus turbine rotor Qmech Mechanical torque on the main shaft of the Magnus turbine rotor R Total force Rcyl Radius of the cylinder Re Reynolds number RM Radius of the Magnus turbine rotor RS Radius of the Savonius rotor St Strouhal number Vfree Velocity of the free‐stream flow Vrel Relative velocity seen by the Savonius rotor cross‐section Vwind Undisturbed wind speed θblade Azimuthal angle of the blade in the Magnus turbine rotor plane λ Tip speed ratio/rotational rate λM Tip speed ratio of the Magnus turbine rotor
6

Investigation of the Savonius‐type Magnus Wind Turbine ________________
λS Tip speed ratio of the Savonius rotor ρfree Density of the free‐stream flow ωcyl Angular velocity of the cylinder ωM Angular velocity of the Magnus turbine rotor ωS Angular velocity of the Savonius rotor
7

Investigation of the Savonius‐type Magnus Wind Turbine ________________
1. Introduction Before presenting the project together with the results of investigation, some notes from a Magnus effect theory and principles behind the Savonius turbine will be presented first. Reason lies in more complex application of aerodynamic lift theory and different approach that combines drag driven device in order to create the rotational lift.
1.1 Magnus Effect Theory
1.1.1 Overview Side‐force effect of the rotating bodies was noticed first time by an eminent English scientist Benjamin Roberts in 1742 during his investigations of spinning artillery projectiles using the swirling arm device. Regardless of the admiration for Roberts work, Euler disputed his results and ascribed transversal force of the rotating body to manufacturing irregularities [33].
Figure 1. Inviscid irrotational flow past a cylinder a) zero rotation, b) subcritical rotation, c) critical rotation, d) supercritical rotation
About the century after, German scientist Gustav Magnus explained this phenomenon as an aerodynamic effect. Further contribution came from Prandtl and his modification of Kutta‐Jukowski theorem for bodies of rotation. Assuming the inviscid and irrotational flow, and defining a rotation rate λ = Rω/Vwind, where R is the radius of the rotating body, it is possible to define a lift force L as a function of λ. One can distinguish between four general flow cases depending on the positions of the stagnation points on the cylinder
8

Investigation of the Savonius‐type Magnus Wind Turbine ________________
(see Figure 1). From the potential flow theory and introducing the circulation Γ, we yield the lift created by cylinder rotation as:
cylcylfreefree
cylcylcylfreefreerotfreefreefreefree
RVL
RRVdlVVVL
ωπρ
πωρρρ
⋅⋅=
⋅⋅=⋅⋅=Γ= ∫22
2 [1.1]
where ∫ dl is the integration of the full circumferential length of the cylinder wall and
index ʹfreeʹ assigns free‐stream parameters. Therefore a lift coefficient can be expressed:
λπωπ
ρ⋅=
⋅=
⋅= 2
2
21 2 free
cylcyl
freefree
L VR
DV
LC ; [1.2]
Utilizing 1.2, Prandtl presumed maximum non‐dimensional lift obtainable could be no bigger then CLmax = 2πλ = 4π (for λ=2 case) since so called a half saddle point (Figure 1c) would move to the flow below creating a two zones of the flow with the formed vorticity at the walls of the cylinder. However, recent investigations on rotating cylinder phenomena done by Tokumaru and Dimotakis [38] showed that for a large enough cylinder aspect ratio AR=18.7, Reynolds numbers Re=3800 and a rotational rate λ=5, mentioned vorticity is convected and diffused from the cylinder in disproportionate manner, therefore increase of the lift force could be observed above Prandtlʹs limit. Glauert also found possibility of exceeding Prandtlʹs limit for high values of λ, under circumstances that flow separation behind the cylinder is suppressed [26]. Other authors, such as Kang and Choi [21] report strong 3D effects for Re > 200 which negatively influences lift characteristic of the cylinder and Ingham and Tang [36] define a cylinder laminar regime for Re<47 and for small rotational rates (λ<3).
Figure 2. Computed wake behind the rotating cylinder for Re=100 and λ=1 [35]
Stojkovic, Breuer and Durst [35] prove a logarithmic dependence between a critical rotational rate λcritical, where a vortex shedding disappears and Reynolds number stating the independence of a Strouhal number St, for reasonable range of rotational rate values below λcritical. Also computations confirm a highly asymmetric wake behind the cylinder (see Figure 2). Super‐critical rotation rates reveal that the three‐dimensionality of the flow is largely suppressed due the Coriolis forces being predominant comparing to
9

Investigation of the Savonius‐type Magnus Wind Turbine ________________
convection and viscous diffusion [33] but the certain centrifugal instabilities could occur (see Figure 4)[26]. Conclusions emerged from most of the papers agree about at least two important aspects about the rotating cylinder flow modeling:
Special attention should be paid on definition of the outer boundary conditions, since they are very hard to model adequately. This comes due the Reynolds number dependent length scale ratio between cylinder diameter and viscous diffusion length [26], therefore stream function ψ needs some kind of enhanced boundary condition.
Forces acting upon the cylinder suffer from temporal instabilities in flow evolution in early flow development stages, and cyclical behavior in developed stage of the flow. Therefore, solving of the unsteady, time dependent 2D Navier‐Stokes equations is necessary with sufficiently small time steps to catch temporal instabilities (see Figure 3).
Figure 3. Time histories of lift and drag coefficient for 2D and 3D flow for Re=200 and λ=5 [26]
10

Investigation of the Savonius‐type Magnus Wind Turbine ________________
In spite of the fact that hundreds of papers have covered problematics of flow around rotating cylinder, previous brief overview was necessary only in order to give basic idea about this extreme complexity of the phenomena. Most relevant conclusions for the running study of Magnus wind turbine are summed up in the experimental work of Tokumaru and Dimotakis [38] and numerical approach by Mittal [26]. Studies proved a strong dependence between aspect ratio of cylinders (ratio of spanwise length to diameter) and lift coefficient. The larger the aspect ratio, the lift values are closer to the theoretical ones for a 2D flow (see Figure 3). Also the ʺslip‐wallʺ case which corresponds to the cylinder with end plates (Figure 4 top), shows reduction of flow separation behind the cylinder comparing to the ʺno‐slip wall caseʺ (Figure 4, second from the top) for the same values of AR. As a result, drastic drop of the drag and increase of the lift coefficient was noticed (see Figure 3).
Figure 4. Isosurfaces of the spanwise velocity for various AR of cylinder in the 3D flow for
Re=200 and λ=5 [26]
An analysis undertaken for investigation of Savonius‐type Magnus wind turbine includes rotational lift study, but itʹs rather simpler. One of the reasons lies in a fact that rotational rate (later introduced as a tip speed ratio of the Savonius rotor) is very close to
11

Investigation of the Savonius‐type Magnus Wind Turbine ________________
unity; therefore supercritical rotations can never be reached under normal circumstances. This is in a same time, a main disadvantage of the concept presented in this study and will be explained more detailed in the following chapters. However, recent conclusions are to large extent applicable for lower rotational rates. The contemporary design of the Magnus cylinders and Savonius rotors is mainly influenced by the results of mentioned studies.
1.1.2 Short Historical Note One of the first and most famous use of the Magnus effect happened in early 1920ʹs, when a German engineer Anton Flettner patented what became known subsequently as the Flettner rotor for a ship propulsion system instead of the ships fitted with sails. Vessels named Buckau (later renamed to Baden‐Baden) and Barbara (see Figure 5) were yielding considerable dynamic stability due the low center of gravity caused by the position of the diesel engines that were powering the cylinders. However, Magnus force created was insufficient to put this concept into the common use.
Figure 5. Ship Buckau: rotating cyliders utilized to create Magnus propulsion force [37]. 9th of May 1926, after sailing across Atlantic, ship entered New York harbor.
Nowadays, rotating cylinders are playing important role in industrial fluid dynamics investigations as an active vortex suppression devices against flow‐induced vibrations. They act by disrupting the formation of an organized 2D vortex shedding structures in order to prevent resonance that could occur if the shedding rate corresponds to natural frequency of the structure in a flow [14].
12

Investigation of the Savonius‐type Magnus Wind Turbine ________________
1.2 Savonius Rotor Outline
1.2.1 Summary of Investigations on Savonius Rotor Not that much literature has been published about an experimental and numerical analysis of the Savonius rotor and itʹs utilization. However, a development of Savonius rotor is closely related to the investigation and utilization of Magnus effect. Finnish engineer, Sigurd. J. Savonius noticed that it was possible to harness the wind so as to maintain the Flettner cylinder (Chapter 1.1.2) rotating and in that way to eliminate the need for a Diesel engine used for the cylinder rotation [34]. Idea was to simply split the rotor in half and displace sideways two semi‐cylindrical surfaces (paddles) along the cut plane. After the ʺSʺ rotor was officially introduced in the 1928 [32], relatively small number of papers occurred since that time. Bach [4] investigated possibility for implementation of a new possible blade shapes, and until mid 1960ʹs when a more serious experimental work in terms of utilization took place, no serious effort has been done in improving the design of the Savonius rotor. As a drag‐driven type machine with low efficiency, this concept didnʹt succeed in drawing too much attention. In the 1970ʹs, following the renewed interest in wind energy Sandia National Laboratories launched a series of experiments, Blackwell, Sheldahl, Feltz [5], with the purpose of investigating a torque characteristics of 2 and 3 bucketed Savonius configurations. A function of these tests was to make a correction for a severe blockage factors that most of the previous wind tunnel tests were not immune to. During the 1980ʹs detailed analysis of the Savonius rotor experimental aerodynamics was done by Ushiyama and Nagai [39] where dynamic and static torque measurements were taken together with the starting and power characteristics for a various Savonius geometrical parameters. The unsteady flow field around the Savonius rotor at the maximum power performance was also studied by Fujisawa [15] using a smoke‐wire flow visualization and a hot‐wire anemometer measurements. In a passed two decades numerical investigation found itʹs place in investigation of the Savonius rotor aerodynamics. Modi and Fernando [11] used a discrete vortex method for prediction of the performance of a Savonius turbine for both stationary and rotating cases. Similar investigation followed by Fujisawa [16] and recently very comprehensive 3D flow analysis around a Savonius and Bach‐type turbine was taken by Ishimatsu, Kage and Okubayashi [19]. Also, effort was made by Cochran, Banks and Taylor [9] to create a correlation between computational, reduced scaled and the real size model in order to determine a Savonius turbine power performance characteristic and efficiency in a cost effective way.
13

Investigation of the Savonius‐type Magnus Wind Turbine ________________
1.2.2 Some Characteristics of the Savonius Rotor Not particularly big, but a constant interest in Savonius wind turbine is kept until nowadays. A reason for this lies in miscellaneous advantages that Savonius rotor offers:
Simple, easy to build and a low cost design, Very high starting torque that gives them advantage of low cut‐in wind speeds, Proper design enables operation even at the high wind speeds (when most of the
high speed HAWT must be stopped for safety reasons), Using a recently developed L‐σ criterion [25] it was shown that Savonius rotor is
more resistant to mechanical stress then any high speed HAWT, i.e. for a same stress value, power per unit surface is higher then for the high‐speed HAWT,
Ability to operate regardless of the wind direction, Low noise level.
On the other hand, Savonius rotor suffers from at least several serious disadvantages: Slow rotational rate in a terms that rotational speed of the rotor is the same order
of magnitude as a wind velocity, Wind and load fluctuation cause changes in the output voltage and the
frequency, hence trying to follow a low‐cost advantage, this systems are not to be connected to the public electrical grid,
Savonius rotor if large in size, must be installed close to the ground, Greater material expenditure per square meter of surface used for powering the
VAWT in comparison to HAWT installations [30], Low efficiency and power coefficient CP due the poor aerodynamical properties
of the paddles which are mostly driven by the difference of the drag forces (see Figure 6).
Indeed, Savonius original prediction of 31% efficiency in a wind tunnel and 37% efficiency on the open field was overestimated. As Savonius himself stated, Betzʹs prediction of roughly 20% efficiency was more likely to be correct. Some sources and recent researches on that field indicate that former high efficiency of 30% or more can actually be obtained with carefully chosen design, but no additional or a certainly widespread conformation was found on this issue [20]. Most of the presented disadvantages are pointing clearly to implausibility of developing large VAWT systems and wind farms. However, most of these disadvantages are vanishing if we consider use of the small Savonius wind rotors instead. In fact, until nowadays, small Savonius rotors have found their place in the industry. They are widely used as a centrifugal ventilators, air‐turbines, flow‐meters or a turbines for harnessing the tidal power. In wind power industry for reasons given above, their utilization is
14

Investigation of the Savonius‐type Magnus Wind Turbine ________________
limited, so they are used as low cost water pumping devices, irrigation devices or for a local household electricity generation i.e. a battery charging. Also, a high starting torque of the Savonius rotor is used as a compensation for poor starting performance of the Darrieus wind turbine, so it is a common practice to install Savonius turbine on the main shaft of the ʺeggbeaterʺ rotor.
Figure 6. Performance of the conventional wind conversion systems given as efficiency vs. tip speed ratio [24]
1.2.3 Operating Principle Operating principle of the Savonius or so called ʺSʺ rotor (see Figure 7) is rather simple and is very similar to the one observed on simple cup anemometers. Drag force created by cup or semi‐cylinder like surfaces (paddles) produces the torque on the main holding shaft thus creating power that could be utilized for multiple purposes. In the case of a Savonius rotor, it is shown that a geometrical characteristics such as a separation gap between paddles, overlap ratio and aspect ratio are found to be a most important for optimum performance of the rotor [39]. We therefore define those parameters through the following relations:
Aspect ratio: S
S
DH
AR = ; Overlap ratio: CD
aOL = ; Separation gap: CD
bGP −= ;
15

Investigation of the Savonius‐type Magnus Wind Turbine ________________
a) b)
Figure 7. Various Savonius rotors: a) Chowchilla, California [2], b) EMAT Ltd, England commercial model [10]
Figure 8. Basic geometrical features of Savonius rotor
In the equations, DC is a diameter of the semi‐cylinder (paddle) and DS is the overall diameter of the Savonius rotor. After adopting some convention we say that positive value of overlap ratio OL indicates that there is an overlap between contours of semi‐cylinders. On the other hand, as can be see from numerical definition above, positive separation gap GP means that contour of one paddleʹs surface doesnʹt penetrate a diameter cross‐sectional plane of the other semi‐cylinder. Therefore, a rotor presented on Figure 8.a can be described with a positive overlap and a zero gap and the one on Figure 8.b with a negative gap.
16

Investigation of the Savonius‐type Magnus Wind Turbine ________________
The relevant data important for a Savonius performance evaluation are a rotor static torque, power and torque coefficients and starting characteristics function i.e. a rotational speed of the rotor. Numerous experiments showed that the optimum performance in terms of the power efficiency is obtained for AR ≈ 4, OL = 20 ‐ 25% and GP = 0 – (‐5)%.
0 0.5 1 1.50
0.05
0.1
0.15
0.2
0.25
Tip Speed Ratio λs
Cp
No Plates ExperimentFittedWith Plates ExperimentFitted
Figure 9. Tip plate effect on Savonius rotor performance [39]
Also, confirming results valid for a rotating cylinders (Chapter 1.1.1) use of a tip plates have shown to improve an overall characteristic of rotor significantly (see Figure 8.c). Effect of a tip plates not so distinguished for low tip speed ratios of the Savonius rotor (low rotational speed regimes) was found to be indispensable for a tip speed ratios λS > 0.5. Increase of about 25% in a peak power efficiency was noticed for a range of a tip speed ratios that was found to be significantly expanded in a first place (see Figure 9). Diameter of the tip plate is about 10% larger then diameter of the Savonius rotor D in case of optimum performance, i.e.
PD1.1≈SP DD .
1.3 Idea Behind Savonius‐type Magnus Wind Turbine Evolution from a classical HAWT concept to the one which is the subject of our investigation is represented on Figure 10. Idea developed by Kozlov and Bychkov [22] was to replace an airfoils (see Figure 10.a) with a rotating cylinders (see Figure 10.b) in order create the lift force utilizing a Magnus effect. A six‐bladed prototype developed at Institute of Theoretical and Applied Mechanics from Novosibirsk, Russia and 5 bladed
17

Investigation of the Savonius‐type Magnus Wind Turbine ________________
12kW rated power commercial model developed by Akita Magnus Association [1], Japan were both proved to be operational. A certain amount of electrical power is constantly needed to facilitate the cylinders. Indeed, at least two sources indicate relation between a power losses to run the cylinder and the cylinder drag.
a)
b)
c)
Figure 10. Lift generating device on the wind turbines: a) airfoil, b) rotating cylinder, c) Savonius rotor
18

Investigation of the Savonius‐type Magnus Wind Turbine ________________
Goldstein [13] suggests that power to run cylinder could be expressed as an equivalent of 20% increase of the drag for stationary cylinder. However, in more explicit way, regarding the lift of the blunt bodies, Hoerner [18] states that power to rotate the cylinder in 2D flow due to the aerodynamic forces can be estimated from the equation:
DNUCP Daero πρ 2510762.4 ⋅×= − ; [W] [1.1]
where CD is the skin friction drag of the rotating cylinder for corresponding Reynolds number case, U is the tangential rotational speed of the cylinder, D is the cylinder diameter and N is the cylinder rpm. The value obtained presents a power needed for cylinder of unity length, so a rescaling is necessary to get the power to run the cylinder of an arbitrary length. However this expression was found to substantially reduce power requirements since electromotor losses and unavoidable friction in bearings and transmission system should also be accounted for. As a result, needed power to run the cylinders can be considerably bigger. Therefore we have general expression for power needed from electro motors:
ontransmissibearingsmotor
aeromotor
PP
ηηη= ; [1.2]
This expression will largely depend not only on the motor choice and type, but also from type and condition of bearings and transmission system. For the purposes of illustration, Table 1 contains approximated and extrapolated values for the power needed to run the cylinders at 500 rpm, for the model made by Kozlov and Bychkov at SB‐RAS, Akita turbine and the rotating cylinder model tested by Reid [29]. Values are given as the power in Watts, scaled per one cylinder and unity length. Also, two Reynolds number values were given based on cylinder diameter and the blade length together with their ratio Re λ,
Case Re d Re L Re λ P [W] SB‐RAS [22] 3.5 x 10⁴ 1.2 x 10⁵ 3.4 17 Reid [29] 4.4 x 10⁴ 5.9 x 10⁵ 13.4 6 Akita Turbine[1] 7.8 x 10⁴ 1.8 x 10⁶ 23.1 ~ 20
Table 1. Power requirements for running the cylinder at 500rpm
What should be noted here is that discrepancy for SB‐RAS results should be accounted for a transmission losses for six rotating cylinders that are powered by a motor. In case of a Reid experiment, only one, a doubly bearing supported cylinder was tested.
19

Investigation of the Savonius‐type Magnus Wind Turbine ________________
Also what comes as an important conclusion is that aspect ratio of the rotating cylinders should be high enough in order that turbine could support itself with the sufficient power for the cylinders. Indeed, only Akita model that is holding a very high aspect ratio of the cylinder blades is capable of running in an autonomous regime. For the reasons of confidentiality only can be said that the overall power requirements for running the cylinders are roughly between 10‐15% of the power generated by the wind turbine. Also should be taken into account that cylinders are equipped with the spiral superstructures and tip plates so power efficiency of such arrangement is bigger then it would be for a bare cylinder case [22], [1]. The purpose of this study is to bring an attempt to create Magnus effect powered wind turbine that would utilize Savonius rotors instead of the cylinders (see Figure 10.c). Major advantages of this setup would be:
No external power is needed to run Savonius cylinders, Simplicity of construction due the lack of electro motors and transmission system, Cost and weight reduction, Further simplified maintenance.
Figure 11. Local velocities and forces on Savonius rotor
Exploiting self‐starting characteristic of the Savonius rotor, the central idea is to utilize a drag force of the semi‐cylinders for creating a Magnus lift over the rotating surface. As can be seen from a Figure 11, created lift due the rotation is normal to the relative
20

Investigation of the Savonius‐type Magnus Wind Turbine ________________
velocity vector Vrel, seen by the Savonius rotor section which depends on both, wind velocity and rotational speed of the rotor. Vector sum is defined through the flow angle φ that in the case of neglecting induction factors can be defined over an inverse tangent function of the Magnus rotor tip speed ratio:
MM
wind
MM
wind
rot
VR
VV
λλωφ 1
111
tan1cotcotcot −
−−− ==⎟⎟⎠
⎞⎜⎜⎝
⎛=⎟⎟
⎠
⎞⎜⎜⎝
⎛= ; [1.3]
Tangential component of the created force Ft, would generate the torque on the main shaft of the turbine. Since Magnus lift depends on the rotational speed of the cylinder i.e. tip speed ratio (see Chapter 1.1) what comes as a conclusion is that we are interested in exploiting the speed characteristic of Savonius rotor, not itʹs torque and power characteristic. However, previous parameters are not always in a perfect correlation. The experiments run by Ushiyama and Nagai [39] showed that for certain separation gap values of the Savonius rotor and an overlap ratio of the Bach‐type rotor, best rpm performance in idling regime is not corresponding with the highest CQ and CP values. As an example, for the later Bach‐type rotor, overlap of 50% between semi‐structures yields the superior rpm performance comparing to the other, smaller overlap configurations, but power efficiency is about 16% smaller then for the case with 10% overlap. Higher rpm can be explained simply by applying the conservation of momentum theory. Bigger overlap holds smaller moment of inertia value therefore higher rpm can be obtained.
1.4 Plan of Investigations Investigations of the Savonius‐type Magnus rotor includes several studies of different aspects of the rotor. First, static torque of the different Savonius rotors as a measure of self‐starting characteristic is investigated numerically using commercially available CFD tools. On the basis of those results, most successful configurations were used for creating the practical rotor design. A brief analysis was made regarding the choice of materials and properties of the prototypes to be tested. An experimental analysis included a torque and power measurements of the Magnus rotor powered by Savonius blades in the wind tunnel for the various wind speeds and number of blades. A results were compared in order to find the most promising design in terms of the highest power and torque coefficient.
21

Investigation of the Savonius‐type Magnus Wind Turbine ________________
Power characteristic and noticed behavior of the turbine, imposed a supplementary investigation of the mechanical and modal properties of the Savonius blades since it was found that they yield a significant impact on the Magnus rotor performance.
22

Investigation of the Savonius‐type Magnus Wind Turbine ________________
2. Determination of the Static Torque
2.1 Definition Before starting any experimental investigation, one should at least intuitively determine basic parameters that would define the design of the Magnus turbine. As already seen, most important of them is a cross‐section design of the Savonius blade that plays an important role in defining the behavior of the rotor, therefore contributes to the lift characteristic of the device. One of the criteria needed to establish a good choice among different profile configurations used to power up a Savonius rotor would certainly be an assessment of the static or starting torque. For a Savonius rotor, static torque corresponds to a maximum value of the torque when device is blocked i.e. without ability to rotate. All other torque values for full operating range of rotor speeds or tip speed ratios will be lower then this value. Therefore we can state that static torque represents a property, an ability of the externally powered machine (in this case a wind turbine or rotor) to start itself. A Savonius rotor as stated in previous chapter has an advantage that yields a very high value of static torque.
2.2 Numerical Study To find the best starting characteristic, finite element based Navier‐Stokes code such as ANSYS FLOTRAN was utilized for simulating the flow around the blade rotor. Problem was treated as a stationary, two‐dimensional; the rotor cross‐section was placed into computational domain and pressure distribution and resulting moments were found.
2.3 Geometry Description For the purpose of finding the optimum design, some of the most representative rotor cross‐sections from previously reviewed literature (Chapter 1.2.1) were taken into consideration for rotor design. All rotors are yielding the same DS=0.06 m diameter measured as the distance between the rotor outer edges which corresponds to the span of the rotor along x‐axis (see Figure 12). A first profile (see Figure 12.a) proposed by Bach [4], was taken as one of the most successful solutions for high torque and rpm performance, which was confirmed later by Ushiyama [39] and Ishimatsu [19]. Geometrical features for Bach profile were influenced by the set‐up suggested by the later author.
23

Investigation of the Savonius‐type Magnus Wind Turbine ________________
a) b)
c) d)
e)
Figure 12. Various rotor configurations: a) Bach, b) Benesh, c) Modi, d) Savonius OL=0.21, e) Savonius OL=0.67
Second profile presented by Rahai [28] is based on an investigation of A.H. Benesh where profile that combines a lift and a drag characteristics, is introduced in order to improve a rotor characteristics. However, according to the author, lift contribution to overall performance is limited only in a certain range of angles of attack from 0° ÷ 20° and 180° ÷ 200°. As Figure 12.b shows, Benesh profile camber is approximated by the following set of equations:
( 22 2 xpx
pmy −= ) ; for 3.00 ≤≤ x ; [2.1]
( )( )( )2
2 2211
xpxpp
my −+−−
= ; for 13.0 ≤≤ x ; [2.2]
24

Investigation of the Savonius‐type Magnus Wind Turbine ________________
Profile applied in our case yields small thickness but for x ≥ 0.3, constant instead of the tapered thickness was applied. A third profile proposed by Modi, Fernando and Roth [27] was yielding an outstanding power performance, however the authors contributed such results to the too high blockage factor during the wind tunnel testing (B = 16.4%). A major geometrical parameters are considered to be profile arc angle θ, and the ratio between linear part of profile and the arc radius p/q (see Figure 12.c). The optimum design is considered to be for θ = 135° and p/q = 0.2. The fourth and the fifth profile are typical Savonius configurations with semi‐circle displaced cross‐sections described more thoroughly in works of Ushiyama [39] and Blackwell [5]. They are yielding overlap of 21% (see Figure 12.d) and 67% (see Figure 12.e) respectively.
2.4 Flow Description The flow was solved for 6m/s wind velocity case and the standard atmosphere parameters for pressure, temperature and viscosity. In order to investigate torque for different flow angles, velocity is given through itʹs components in x and y directions applied on the domain boundaries. Since the all models are yielding rotational symmetry, the flow was modeled for the angles in range between 0° ÷ 180°. Reynolds number based on the rotor diameter for flow speed of 6m/s is:
24000´1.5x1006.06Re 25- ≈
⋅==
smmsmDV Sfree
ν; [2.3]
Taking into account the complex geometry and the value of Reynolds number, it comes as a conclusion that turbulent flow instead of laminar one has to be considered.
2.5 Numerical Method Flow will be treated as viscous and solved using the Navier‐Stokes set of equations [3]:
( ) ( )x
xe
xexx
yxxxx Ty
Vyx
Vx
RxPg
yVV
xVV
tV
+⎟⎟⎠
⎞⎜⎜⎝
⎛∂∂
∂∂
+⎟⎠⎞
⎜⎝⎛
∂∂
∂∂
++∂∂
−=∂
∂+
∂∂
+∂
∂μμρ
ρρρ; [2.4]
( ) ( )
yy
ey
eyyyxyyy T
yV
yxV
xR
yPg
xVV
yVV
tV
+⎟⎟⎠
⎞⎜⎜⎝
⎛∂
∂
∂∂
+⎟⎟⎠
⎞⎜⎜⎝
⎛∂
∂
∂∂
++∂∂
−=∂
∂+
∂
∂+
∂
∂μμρ
ρρρ; [2.5]
25

Investigation of the Savonius‐type Magnus Wind Turbine ________________
also from the law of mass conservation comes the continuity equation:
( ) ( )0=
∂
∂+
∂∂
+∂∂
yV
xV
tyx ρρρ
; [2.6]
The “g” terms are gravity accelerations and “R” terms represent any source terms. Both are to be neglected in following simulations. The “T” terms are viscous loss terms, which are eliminated in the incompressible, constant property case, but in compressible flow case, are not.
2.6 Turbulence Model
Turbulence model implemented for all simulations is RNG (Re‐Normalized Group) model, which is considered to be convergence stable and effective where the geometry has a strong curvature [3]. Savonius rotor cross‐section computational domain leaves space for such considerations.
By definition, RNG model is a k‐ε type of model derived from the instantaneous Navier‐Stokes equations, that uses technique called ʺrenormalization group methodsʺ to derive the equations for the turbulence kinetic energy and the turbulence dissipation rate [12].
The basic method is a simple iterative procedure to eliminate the smaller eddies and the replacement of their mean effect on the remaining larger eddies by increasing the viscosity. Similar to other techniques, this is another way to damp out the smaller eddies. The resulting equation is rescaled through an iterative procedure until two successive iterations match closely.
Standard k‐ε model yields turbulent kinetic and dissipation equations:
( ) ( )
⎟⎟⎠
⎞⎜⎜⎝
⎛∂∂
+∂∂
+
+−Φ+⎟⎟⎠
⎞⎜⎜⎝
⎛∂∂
∂∂
+⎟⎟⎠
⎞⎜⎜⎝
⎛∂∂
∂∂
=∂
∂+
∂∂
+∂∂
yTg
xTg
C
yk
yxk
xykV
xkV
tk
yxt
t
tk
t
k
tyx
σβμ
ρεμσμ
σμρρρ
4
[2.7]
and
( ) ( )
( )⎟⎟⎠
⎞⎜⎜⎝
⎛∂∂
+∂∂−
+
+−Φ+⎟⎟⎠
⎞⎜⎜⎝
⎛∂∂
∂∂
+⎟⎟⎠
⎞⎜⎜⎝
⎛∂∂
∂∂
=∂
∂+
∂∂
+∂∂
yTg
xTg
CC
kC
kC
yyxxyV
xV
t
yxt
t
tk
t
k
tyx
σβμ
ερεμεσμε
σμερερρε
μ
ε
3
2
21
1 [2.8]
26

Investigation of the Savonius‐type Magnus Wind Turbine ________________
where k is a turbulent energy term and ε is a viscous dissipation term. “C” terms represent constants and σt is a turbulent Prandtl (Schmidt) Number. Turbulent viscosity μt is calculated as:
ερμ μ
2kCt = [2.9]
where Cμ is also a constant.
RNG model deals with the differential equation for turbulent viscosity [12]:
νν
νεμρ
ν
ˆ1ˆˆ
72.13
2
dC
kd+−
=⎟⎟⎠
⎞⎜⎜⎝
⎛ [2.10]
where μμν /ˆ e= , and Cν ≈ 100.
From equations [2.9] and [2.10] using a renormalization procedure we obtain Cμ = 0.0845. Also, C1ε constant is given as a function of one of the invariants:
31 1
142.1
βηηηη
ε +
⎟⎟⎠
⎞⎜⎜⎝
⎛−
−= ∞C [2.11]
Values of the constants used for RNG model are given in a Table 2:
Value Default β∞ 0.12 C1 1.42 C2 1.68 Cμ 0.085 σk 0.72 σε 0.72 η∞ 4.38
Table 2. Values of constants for RNG turbulence model
27

Investigation of the Savonius‐type Magnus Wind Turbine ________________
2.7 Domain Size and Mesh Configuration
Figure 13. Example of computational domain of the 2D flow around modeled rotors
A mesh was formed on an operational 2D domain taking into account distances from modeled rotors that are embedded in the middle of the domain. Coordinate center of the domain corresponds with the center of mass and rotation for all profiles, in terms to ease finding the static (pitching) moments. As can be seen from the Figure 13, on a basis of modeling the flow around cylinder [35], circular computational domain was chosen with itʹs diameter 100 times bigger then diameter of the rotor models. In another words, domain yields a distance of fifty rotor diameters around the rotor. A circular shape makes a good candidate to represent the far field boundary since it has no discontinuities in slope, enabling the partial continuity of a smooth mesh in the interior of the domain. One should notice that outside domain was formed using the semi‐free quadrilateral mesh with forced cell size gradients (decreasing spacing ratio) in diameter direction. Since aerodynamic properties of the rotor should cover functional range of the flow directions (0 ‐ 180°) using the velocity components of the flow as a part of the outer boundary conditions, a grid was formed in a way that gradual change in a cell size should remain almost same regardless of the flow direction. All discontinuities on the domain are due the complexity of the rotor geometries and special attention such as a forced meshing technique has to be applied in the close vicinity of the rotors (see Figure
28
Investigation of the Savonius‐type Magnus Wind Turbine ________________
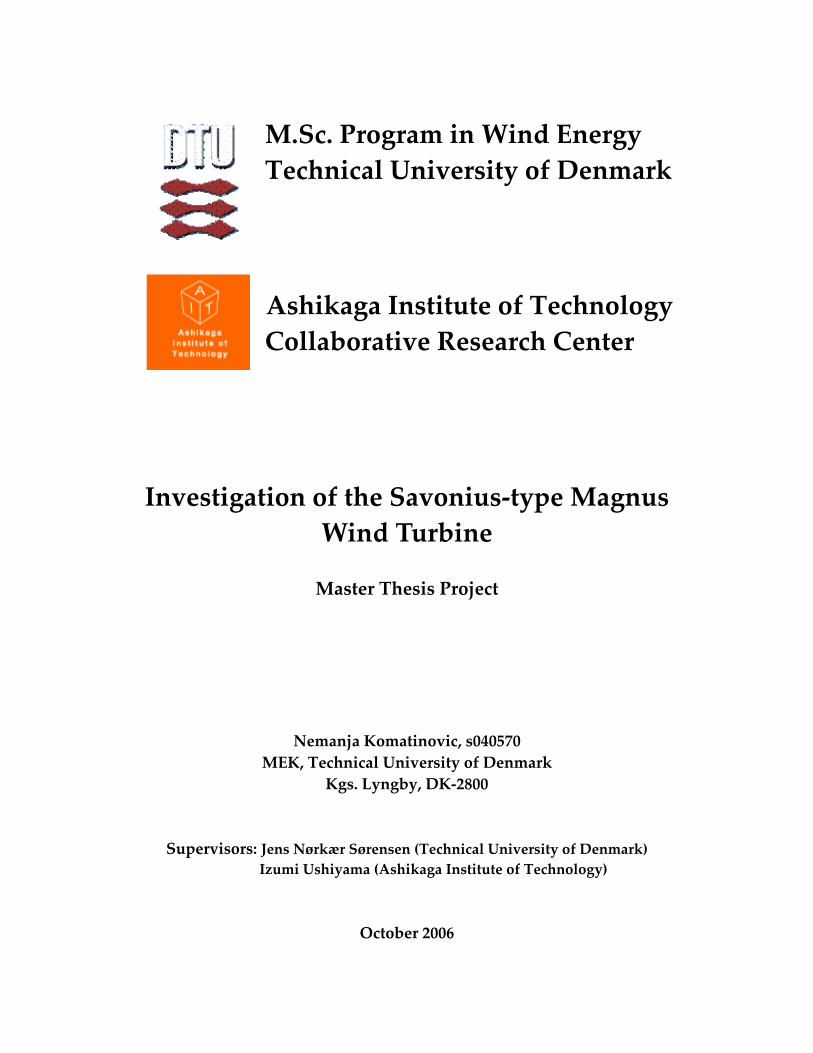
14). Quadrilateral grid cells were also used for modeling the forced mesh because they can be stretched easily to account for different size gradients in different directions [3]. Some characteristics of the mesh are given in Table 3, with the pressure convergence termination criteria as one of the main parameters for evaluating the grid quality.
Rotor type No. of elements
No. of nodes
No. of nodes on the rotor
wall
Pressure termination criteria
Bach Type 9765 9961 81 1x10‐7
Benesh Type 7638 7792 121 1x10‐7Modi Type 7761 7917 121 1x10‐7Savonius OL=0.67 6043 6189 65 1x10‐7
Savonius OL=0.21 8853 9012 65 1x10‐6
Table 3. Grid parameters and termination criteria
The gradients normal to the rotor wall are greater than ones tangent to the surface. Consequently, the cells near the surface have been modeled with the high grid aspect ratios (see Figure 15). Such biasing of the grid is useful, so the boundary layer can be properly modeled.
a)
29

Investigation of the Savonius‐type Magnus Wind Turbine ________________
b)
c)
d)
30

Investigation of the Savonius‐type Magnus Wind Turbine ________________
e)
Figure 14. Meshing of the various rotor configurations: a) Bach, b) Benesh, c) Savonius OL=0.67, d) Modi, e) Savonius OL=0.21
Figure 15. Boundary layer adequate grid on Bach type rotor wall
31

Investigation of the Savonius‐type Magnus Wind Turbine ________________
0 0.1 0.2 0.3 0.4 0.5 0.6 0.7 0.8 0.9 10
1
2
3
4
5
6
7
Distance along the profile (x/c)
Y+
Bach Profile
Back Profile - Windward SideBack Profile - Leeward SideFront Profile - Windward SideFront Profile - Leeward Side
0 0.1 0.2 0.3 0.4 0.5 0.6 0.7 0.8 0.9 10
0.5
1
1.5
2
2.5
3
3.5
4
4.5
Distance along the profile (x/c)
Y+
Benesh Profile
Leeward SideWindward Side
a) b)
0 0.1 0.2 0.3 0.4 0.5 0.6 0.7 0.8 0.9 10
0.5
1
1.5
2
2.5
3
3.5
Distance along the profile (x/c)
Y+
Modi Profile
Leeward SideWindward Side
0 0.1 0.2 0.3 0.4 0.5 0.6 0.7 0.8 0.9 10
1
2
3
4
5
6
7
Distance along the profile (x/c)
Y+
Savonius OL=0.67 Profile
Back Profile - Windward SideBack Profile - Leeward SideFront Profile - Windward SideFront Profile - Leeward Side
c) d)
0 0.1 0.2 0.3 0.4 0.5 0.6 0.7 0.8 0.9 10
1
2
3
4
5
6
7
Distance along the profile (x/c)
Y+
Savonius OL=0.21 Profile
Back Profile - Windward SideBack Profile - Leeward SideFront Profile - Windward SideFront Profile - Leeward Side
e)
Figure 16. Y+ distribution along the walls of various profiles for Re = 2.4 x 10⁴ : a) Bach, b) Benesh, c) Modi, d) Savonius OL=0.67, e) Savonius OL=0.21
In order to model the boundary layer in the approved manner, valid range of Y+ values was taken into account so that the node on the first cell‐layer could be put on
32

Investigation of the Savonius‐type Magnus Wind Turbine ________________
appropriate distance away from the wall. The needed distance is practically independent from the mesh, and belongs only to the nature of the flow (in first instants the velocity). Following the procedure from [7], the value of smallest node distance from the wall for the adjacent cells is given as function of the operating Reynolds number, reference length and desired value of Y+. For Y+ = 3 which is considered to be reasonably small value, we come up with the value of dwall ≈ 0.12 mm which is in an agreement with node distances taken for meshing the first cell‐layer. Also, a rule of thumb was used, and the growth ratio of cell size in the boundary layer is set up to be about 1.2 ‐ 1.25 (see Figure 15). Values of Y+ for the first mesh cell are given of Figure 16. They represent the readings from all flow‐adjacent nodes on both, windward and leeward side of the profile walls, and in the case of Bach and Savonius‐type rotors, they are given for both semi‐structure profiles.
2.8 Boundary Conditions Domainʹs outer boundary conditions were defined as the Dirichlet‐type conditions where velocity and pressure loads are given. In this case, coupling of pressure and velocity values for a domainʹs outer boundaries gives a so called ʺpressure far fieldʺ boundary condition that simulates a free‐stream conditions at infinity. For this reason, to effectively approximate true infinite‐extent conditions, we placed the far‐field boundary far enough from the rotor models. A ʺno‐slipʺ boundary condition was applied on the all contour lines of the rotors tested. It represents a stationary wall case, where a fluid layer adjacent to the wall suffers no motion, therefore has both velocity components set to zero.
2.9 Solver Algorithm FLOTRAN distinguishes between two different algorithm settings. They both belong to the class of the Semi‐Implicit Method for Pressure Linked Equations (SIMPLE). SIMPLEF (segregated pressure‐velocity coupled algorithm) uses Tri‐Diagonal Matrix Algorithm (TDMA) solver. Nevertheless the main disadvantage is that even when exact solutions are obtained on those individual equations for pressure, velocity, energy, turbulence and momentum, the overall rate of convergence will not improve. This is consequence of the weak coupling between the pressure and the momentum equations
33

Investigation of the Savonius‐type Magnus Wind Turbine ________________
[3]. Other problem is connected to the relaxation factors that can in this case, cause large instabilities in the solution if they became to large so values above 0.5 for pressure are not recommended. Therefore a rate of convergence is slower. On the other hand, the overall rate of convergence of the SIMPLEN (enhanced segregated algorithm), can be improved considerably when more exact solutions are obtained for each individual equation. More stabile solution causes faster convergence and possibility to increase relaxation factors up to 0.8 for momentum equation for instance.
Φnew = (1 ‐ RELX) Φprevious + RELX Φcalculated [2.12]
Therefore in order to obtain faster convergence rate, SIMPLEN algorithm was used for all rotor cross‐sections. Due the fact that SIMPLEN algorithm is very sensitive on any grid inconsistency, one can be used as a test for grid quality. If we disregard initial instabilities, convergence of the pressure equations showed monotone decrease behavior. Therefore it is once more confirmed that mesh around the cross‐section was properly modeled. Table 4. contains number of iterations based for reaching the 10‐6 convergence in vicinity of the major flow angles.
Number of iterations for 10‐6 pressure termination criteria Rotor type
0° 45° 90° 135° 180°
Bach Type 1750 980 1520 2500 2640 Benesh Type 1620 1550 1970 1640 1650 Modi Type 1310 2600 1270 1370 1390 Savonius OL=0.67 510 480 520 730 500
Savonius OL=0.21 1290 1910 2200 2630 2870
Table 4. Number of iterations for various rotors and flow angles
As can be seen, Savonius rotor with OL=0.67 yields much better convergence then rest of configurations mainly due the successive grid adjustment and refinement procedure. However the results for the improved grid held significant change neither in the flow picture nor in the results for the torque. A solver permits choice between the steady and transient state analysis, but due the nature of our work and also processor and computational time restrictions, steady‐type of analysis was deployed.
34

Investigation of the Savonius‐type Magnus Wind Turbine ________________
2.10 Post‐processing The postprocessor tool computes a force quantities integrated for chosen nodal results over a defined surface. The total forces are simply the x and y components of sum of all the pressure and viscous forces.
( )∑ ⋅+= iFFF VISCPRESSTOTALXˆrr [2.13]
( )∑ ⋅+= jFFF VISCPRESSTOTALY
ˆrr [2.14]
A resulting moment Mz around the center of mass of the profile is simply calculated from the sum of moments created by the viscous and pressure forces taken for a domain contour. By applying the Stokes theorem we yield:
∫ ∫ ×+×=dS dS
VISCPRESSTOTAL dlFxdlFxMrrrr
[2.15]
where x is the position vector of the node element relative to center point, and dl is a line element along the boundary S, of magnitude dl. Torque coefficient therefore corresponds to moment coefficient for center point i.e. point of rotation:
22
21
S
TOTALQ
DU
MC
∞∞
=ρ
[2.16]
2.11 Results
2.11.1 Results Validation Before a further analysis, note will be made about validity of procedure. Results of the CFD analysis were confirmed by comparing them with the experimental and numerical results from Modi and Fernando [27] & [11] for what is in this study called Modi profile (see Figure 17). Following figures show the results for a pressure distribution and a torque respectively for a static case measurements and the flow angle of φ=30°. Pressure values on the front and the back side of the Modi‐Fernando profile were obtained using 46 pressure gauges mounted on the profile. In current simulation free stream velocity was set to be Vwind =6m/s. What easily can be noticed from Figure 17 is slight difference in designs due the existence of the overlap shift between leading and trailing paddle, where such gap is filled with central shaft. For current study, the major geometrical parameters, such as a
35

Investigation of the Savonius‐type Magnus Wind Turbine ________________
profile arc angle θ, and ratio between linear part of profile and the arc radius p/q are yielding optimum values as suggested.
Figure 17. Modi‐Fernando profile with the pressure taps setup [27]
Figure 18. Modi profile pressure distribution for φ=30° and Vwind =6m/s
On the other hand, these geometrical features will cause the differences when the results are compared. Since the actual dimensions of the Modi‐Fernando profile and shaft are not known, only general analysis will be made here.
36

Investigation of the Savonius‐type Magnus Wind Turbine ________________
Figure 19. Flowfield pressure distribution over the theoretical Modi profile for φ=30° and Vwind =6m/s
Figure 18 shows that numerically predicted pressure distribution from the current study for most of the domain is yielding a reasonable accuracy with the experimental results. The difference is noticeable for the pressure coefficient drops and also for point of separation location of the trailing paddle. Numerical result from FLOTRAN is presented on Figure 19, and clearly states low pressure zone located closer to the trailing edge then the one stated by Modi and Fernando which is according to the measurements positioned around 32nd pressure gauge. However, mismatch in location and magnitude of low pressure zone, can be attributed to the geometrical differences between two models. This difference is expressed not only in terms of the Reynolds number disparity, but due the fact that for the equivalent profile total length and rest of parameters (θ, p/q) left the same, a build‐in position angle of the both paddles due the existence of the shaft is not same. Both paddle edges close to the center of rotation will be slightly shifted up due the existence of the central structure. This causes shift in the low pressure zone in ʺmore downwindʺ direction on the leading paddle and ʺmore upwindʺ on the trailing paddle. Also, a high blockage factor reported during Modi‐Fernando experiments should be also taken into account. Figure 20 shows static torque values obtained numerically and experimentally by Modi and Fernando and compared with the current study simulation for a range of a flow angles. The effect of the central shaft is pronounced once again through the shift phenomena of the computed curves.
37
Investigation of the Savonius‐type Magnus Wind Turbine ________________
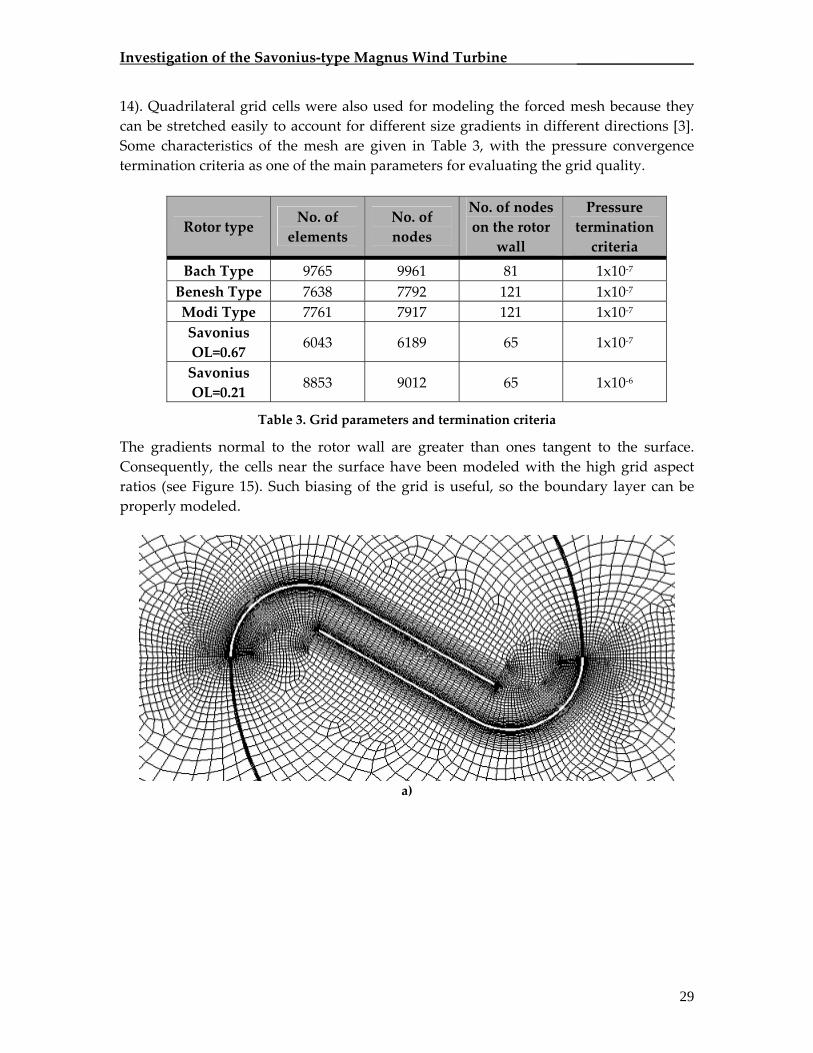
Figure 20. Static torque variation with flow angle for Modi profile
However, the current simulation obtains better agreement with experimental data in terms of the torque minimum, since for the high flow angles effect of the shaft is not so distinctive due the trailing paddle shadow effect. If we compare static torque values for previously examined φ=30° flow angle case, we come up with the reasonable match between those data. A relative error comparing numerical results with the experiment is given in a Table 5 below. A value of 6.6% represents a good agreement with the experimental data taking into account the differences between these two groups of measurements.
Static Torque Δ [%] Modi‐Fernando Experiment 0.48 / Modi‐Fernando Numerical 0.495 3.3 Current Analysis Numerical 0.51 6.6
Table 5. Static torque results relative error
2.11.2 Torque Analysis A summed results are presented on the Figure 21, where static torque is given as a function of the flow angle. It is noticeable that torque values are yielding the symmetry for flow angles higher then 180°. All profiles are characterized by rise of the positive values for the static torque in a range of angles from 0° up to 22 ‐ 45° where maximum
38

Investigation of the Savonius‐type Magnus Wind Turbine ________________
value is reached. Benesh profile holds the lowest maximum of nearly CQ ≈ 0.4 for approximately 27° comparing to the Bach profile which reaches CQ ≈ 0.58 for a flow angle of 45°. Modi and Savonius OL=0.21 are yielding maximum values of a static torque for approximately same flow angles as a Benesh profile, while Savonius OL=0.67 profile is obtaining maximum torque for roughly 40°. Characterized by similar slope (k ≈ ‐7.3 x 10‐3), static torque for all profiles is declining, reaching the range of negative torque values between 130° and 175°. Aside from the fact that both Savonius rotors are yielding moderate values of negative torque (CQ ≈ ‐0.05), Modi profile is represented by distinguishable negative torque of CQ≈ ‐0.2, while the Bach profile showed tendency of holding the changeable but constantly positive value, with CQmin ≈0.1. A torque for Benesh profile seems to vary around the zero, therefore showing highly stabile behavior for high flow angles which is not of our interest.
0 20 40 60 80 100 120 140 160 180-0.2
-0.1
0
0.1
0.2
0.3
0.4
0.5
0.6
Flow Angle φ [ ο ]
Sta
tic T
orqu
e C
oeffi
cien
t CQ
ModiSavonius OL=0.67BeneshSavonius OL=0.21Bach
Figure 21. Static torque of various blade profiles as a function of flow angle
Higher torque for Bach and Savonius type rotors is obtained because of the existence of separation gap between paddles. In this way, the airflow from the advancing paddle can enter the wake zone of the returning paddle and diminish or completely eliminate the existence of the vortex structure which is responsible for decreasing pressure therefore creating a wake suction zone.
39

Investigation of the Savonius‐type Magnus Wind Turbine ________________
a)
b)
c) Figure 22. Computed vector flow‐field around Savonius OL=0.21 rotor; a) 0° ‐ vortex structures inside both buckets, b) 16° ‐ pressure increase on the walls of the returning bucket, c) 32° ‐ central vortex structure outside of the bucket, with second vortex downwashed.
40

Investigation of the Savonius‐type Magnus Wind Turbine ________________
An example of such behavior is given on Figure 22 above, for a case of Savonius rotor with OL=0.21. A vector flow field is given for angles of 0°, 16° and 32°. Examination of the flow reveals for 0° case at least three large vortex structures around the rotor. One in center of the forwarding bucket and two in the returning bucket zone, where the upper one is created due the separation of the flow from the forwarding bucket concave surface. However, the pressure inside of the forwarding bucket is still bigger then in the returning one. The air passing the gap is yielding a small directional angle, therefore is unable to create a bigger moment around the rotation axis. When the flow angle is increased, the air flows at higher angle, ʺpushingʺ the vortex structure more outside the bucket. Also, secondary vortex due the separation from the bucket is also shifted more downstream. For a case of flow angle close to the optimum one (corresponding to our φ=32° case) the flow fully penetrates inside the paddle leaving no space for large vortices in the advancing paddle. Separated structure is sufficiently far convected from the rotor, while the bucket vortex is outside of the returning bucket. The highest impact on rotor behavior comes however from the high pressure field distributed along the inner side of the returning bucket.
Figure 23. Velocity plot around Savonius OL=0.21 rotor for φ=164°
In a same way, a negative starting characteristic is caused when the pressure on the trailing tip of the returning paddle exceeds the value inside the bucket which is possible for high flow angles. Maximum negative torque is calculated for flow angle of φ=164° and velocity plot around the rotor is given on Figure 23. A stagnation point corresponds
41

Investigation of the Savonius‐type Magnus Wind Turbine ________________
with the maximum value of the pressure coefficient and the small perpendicular distance from stagnation point to center of rotation explains moderate values of negative torque coefficient. Also an attention should be paid on two counter‐rotating vortex structures inside the both bucket areas. All comments made here are more or less valid for all the other profiles, in terms of the explaining the driving mechanism.
Figure 24. Pressure plot around Bach‐type rotor for φ=143°
Figure 25. Pressure plot around Bach‐type rotor for φ=161°
A note will be given as well regarding the Bach profile that showed the outstanding behavior in terms of positive static torque for full range of flow angles. Figure 24 gives
42
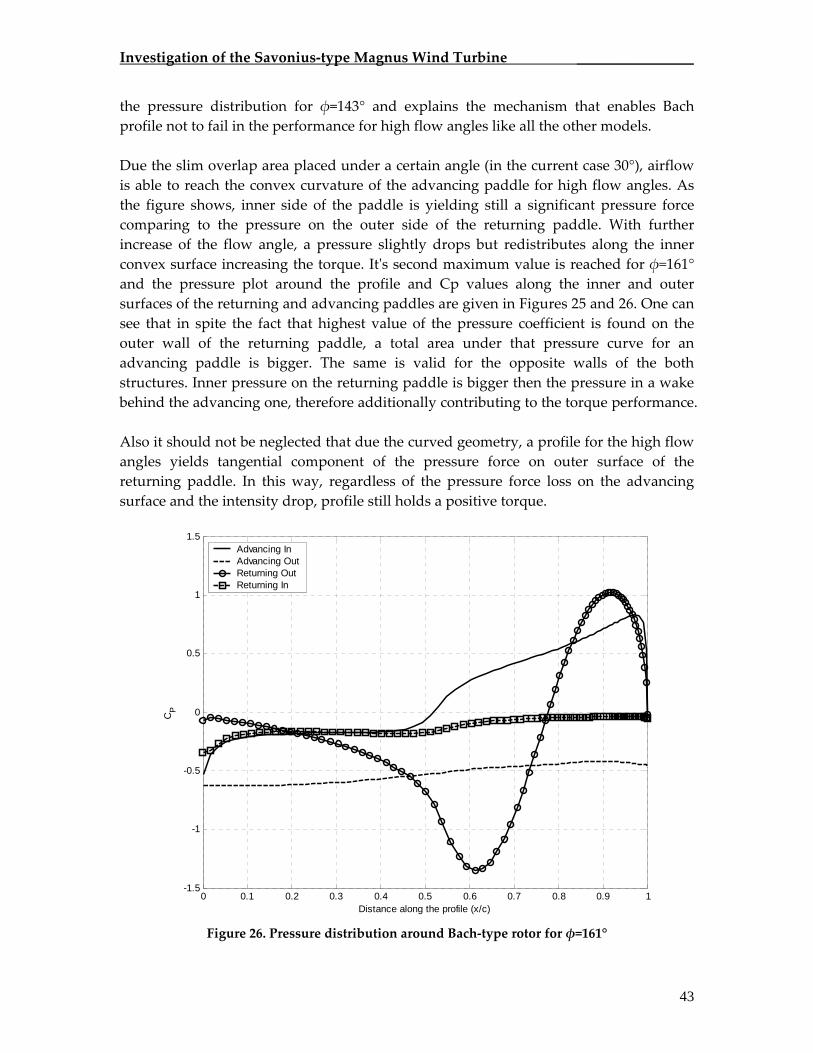
Investigation of the Savonius‐type Magnus Wind Turbine ________________
the pressure distribution for φ=143° and explains the mechanism that enables Bach profile not to fail in the performance for high flow angles like all the other models. Due the slim overlap area placed under a certain angle (in the current case 30°), airflow is able to reach the convex curvature of the advancing paddle for high flow angles. As the figure shows, inner side of the paddle is yielding still a significant pressure force comparing to the pressure on the outer side of the returning paddle. With further increase of the flow angle, a pressure slightly drops but redistributes along the inner convex surface increasing the torque. Itʹs second maximum value is reached for φ=161° and the pressure plot around the profile and Cp values along the inner and outer surfaces of the returning and advancing paddles are given in Figures 25 and 26. One can see that in spite the fact that highest value of the pressure coefficient is found on the outer wall of the returning paddle, a total area under that pressure curve for an advancing paddle is bigger. The same is valid for the opposite walls of the both structures. Inner pressure on the returning paddle is bigger then the pressure in a wake behind the advancing one, therefore additionally contributing to the torque performance. Also it should not be neglected that due the curved geometry, a profile for the high flow angles yields tangential component of the pressure force on outer surface of the returning paddle. In this way, regardless of the pressure force loss on the advancing surface and the intensity drop, profile still holds a positive torque.
0 0.1 0.2 0.3 0.4 0.5 0.6 0.7 0.8 0.9 1-1.5
-1
-0.5
0
0.5
1
1.5
Distance along the profile (x/c)
CP
Advancing InAdvancing OutReturning OutReturning In
Figure 26. Pressure distribution around Bach‐type rotor for φ=161°
43
Investigation of the Savonius‐type Magnus Wind Turbine ________________
3. Blade Design and Prototype
3.1 Design Objectives After the numerical investigation of the torque, a criterion was established for a choice of the appropriate design of the rotor blades in order to exploit combination of good performance and reasonable price. Following design objectives have been considered and they represent the datum for design evaluation and directions in selecting the suitable configuration.
Good mechanical performance in the terms of starting characteristics and high revolution number of blades. This parameters if fulfilled, guarantee self‐starting capability of the blade for low wind speeds, and satisfying torque and power performance of the turbine as well.
Low manufacturing cost of the blades is a crucial prerequisite for the successful
turbine implementation. Since the current research is focused on a small‐type Magnus turbine performance, a comparison should be made on the appropriate scale. Situation check reveals that a market price for 28ʹʹ (0.71m) carbon reinforced blade of the famous Southwest Air‐X type is in a range of USD 15‐20 per blade. This price can be easily explained by decreased expenditure due the mass production. This also means that our production costs should be also kept to a minimum.
Simplicity of construction is also a very important feature. Savonius rotors are
suffering from impossibility of changing their rpm number of rotation therefore they should be treated as a passive mechanisms. This attribute corresponds to the lack of pitch mechanism on most of the conventional small low‐power wind turbines. On the other hand this enables the much simpler construction and therefore is favorable in terms of the costs and maintenance.
Reliability and durability of the turbine are yielding high importance in the
future design. Once installed, the purpose of the wind system is to run for years without any major repairs aside from the annual checking and the regular maintenance procedure. A life expectancy of the system should be at least 10 years and during that time, it would be highly advisable that no serious failure or incident occurs. A maintenance costs should not exceed the benefit from installing the turbine.
Use of recycled parts should be also seriously considered as a strategy for cost‐
reduction policy. Simplicity of the Savonius rotor and drag based features do not
44

Investigation of the Savonius‐type Magnus Wind Turbine ________________
demand special construction and precise machining like in a case of the conventional wind turbine blades. Therefore scraped plastic or aluminum pipes, steel armature or car alternators could be utilized for designing the rotor.
Taking into account stated objectives, a two most promising designs have been taken into consideration for preliminary design of the blade; a classic Savonius profile because of the simplicity of the paddle design and Bach‐type profile for its superior torque and rpm characteristics. They will be tested for power performance. Choice of materials used for a blade manufacturing is based on an investigation and decisional matrix proposed by Menet [23], where design objectives above were implemented in a similar way.
Material
Price
Rigidity
Weight
Outside
Conditions
Temp.
Sensitivity
Assembly
Easiness
Total
Polyethylene High Density 4 4 5 2 5 0 20 Polypropylene 4 3 5 2 4 0 18 Polyvinyl Chloride (PVC) 5 5 2 4 4 5 25 Plexiglas 2 4 3 3 5 3 20 Shock Polystyrene 4 3 4 2 1 2 16 Acrylonitril Butadene Styrene 2 3 4 2 0 2 13 Acrylonitril Styrene 2 3 4 3 0 1 13 Aluminum 4 5 1 5 5 3 23
Table 6. Material decision matrix based on Savonius rotor research by Menet [23]
A decision matrix is based on a grade system from 0 to 5 where 0 is a grade given for extremely bad performance/behavior and 5 for excellent one. A matrix given in a Table 6 takes into account some important features that are necessary for a successful implementation of the turbine in the outdoor environment. Table shows that PVC and aluminum are showing the best outdoor performance with the highest price and weight to be taken into account. However this seems to be the best trade‐off at the moment especially on this stage of the experimental evaluation.
3.2 Prototype Description During investigation, a total of four prototypes were made; three Savonius and one Bach blade were tested. They were yielding an approximately the same lengths of the paddle blades, with the different overlap and rotor‐blade diameters. A sketches of
45

Investigation of the Savonius‐type Magnus Wind Turbine ________________
manufactured rotor blades with most important geometrical parameters are presented on Figures 27 ‐ 30 and most important blade features are given in a Table 6. As a supplement, Table 7 contains basic material properties used for further analysis. An examination of all cases reveals that two different conceptions were used for designing a rotational blade. A first three prototypes made of the PVC plastic, yield the central shaft and the two bearings mounted on the end‐plates of the Savonius rotor. On the other hand, a Bach prototype lacks a central shaft due the very small overlap space in between the buckets.
Name Profile Type
Paddle Length[mm]
OL DS
[mm]
Number of
bearings
Central Axis Shaft
Paddle Material
Prototype 01 Savonius 0.22 41 2 yes PVC Prototype 02 Savonius 0.63 60 2 yes PVC Prototype 03 Savonius 0.47 90 2 yes PVC Prototype 04 Bach
351
0.5 60 1 no Al
Table 7. Characteristics of tested blades
Material Density [kg/m3]
Young Modulus [N/m2]
Poisson Ratio
PVC 1400 3x10⁹ 0.4 Aluminum 2710 7x10¹⁰ 0.346
Steel 7860 2x10¹¹ 0.266
Table 8. Material properties
46

Investigation of the Savonius‐type Magnus Wind Turbine ________________
Figure 27. Prototype 01 isometric sketch with the cross‐section detail
47

Investigation of the Savonius‐type Magnus Wind Turbine ________________
Figure 28. Prototype 02 isometric sketch with the cross‐section detail
48

Investigation of the Savonius‐type Magnus Wind Turbine ________________
Figure 29. Prototype 03 isometric sketch with the cross‐section detail
49

Investigation of the Savonius‐type Magnus Wind Turbine ________________
Figure 30. Prototype 04 (Bach type blade) isometric sketch with the cross‐section detail
50

Investigation of the Savonius‐type Magnus Wind Turbine ________________
Placing the shaft in the slot would mean blockage of the airflow and loss of the major advantages of a Bach rotor. Since steel‐made shaft also adds additional stiffness to the blade, for Bach blade case PVC paddles wouldnʹt be appropriate, therefore, aluminum which is yielding a higher Young modulus of elasticity was used. Also, to ensure proper statically determined support of the blade, double row bearing pair was placed on the hub (see Figure 31). In this way, taking into account the lack of the shaft, weight of the rotor/blade was further reduced. Also, a placement of the bearing mechanism closer to the center of the rotation reduces potential peripheral mass problems and vibrations that could be caused due the miss‐balanced assembly. In general, overall mass of the Bach blade (Prototype 04) was reduced comparing to the mass of the Savonius blade of the corresponding diameter (Prototype 02). Comparison between total masses of the blades manufactured is given in the Table 8. As can be seen, a reduction of 54% in mass was obtained.
Figure 31. Hub/blade connection for Savonius blade (left) and Bach blade (right)
Prototype 01 02 03 04 Mass [kg]
0.390 0.480 0.575 0.220
Table 9. Mass properties of tested blades
51

Investigation of the Savonius‐type Magnus Wind Turbine ________________
4. Experimental Investigation
4.1 Experiment Setup and Facility Experiments took place in the Eiffel‐type, open‐circuit, low speed wind tunnel at the AIT (see Figure 32). Set of the operating wind velocities from 2 – 23 m/s is obtained by use of the 3m diameter centrifugal blower powered by the variable three‐phase 30 kW motor. The flow is controlled by changing the blower rotation from 2 – 250 rpm and monitored using the Betz‐type manometer placed in the undisturbed field, right before the test section. Due the size of the model and extremely high blockage ratio, opened test section setup was used with the leveled support structure (see Figure 33). Test apparatus with mounted wind turbine model was placed approximately 1m distance from 1050mm x 1050mm cross‐section (see Figure 34).
Figure 32. Sketch of the AIT 1.05x1.05m open‐circuit low speed wind tunnel
Wind turbine is coupled with the 400W/200V 50Hz 6pole induction motor/generator and for purposes of investigation of the different load conditions and the tip speed ratios of the rotor; a load is controlled using the 200W/100Ω rated breaking resistor connected with the inverter.
52
Investigation of the Savonius‐type Magnus Wind Turbine ________________
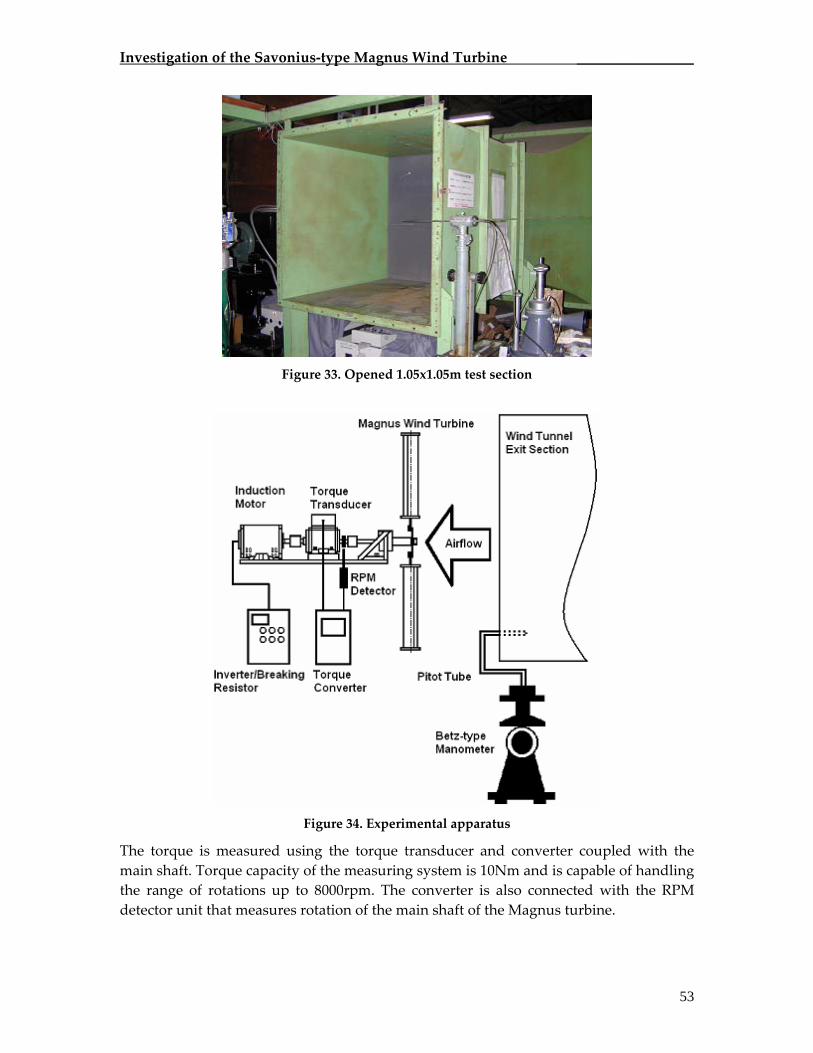
Figure 33. Opened 1.05x1.05m test section
Figure 34. Experimental apparatus
The torque is measured using the torque transducer and converter coupled with the main shaft. Torque capacity of the measuring system is 10Nm and is capable of handling the range of rotations up to 8000rpm. The converter is also connected with the RPM detector unit that measures rotation of the main shaft of the Magnus turbine.
53

Investigation of the Savonius‐type Magnus Wind Turbine ________________
4.2 Savonius Rotation Measurement In order to build a proper model for describing the behavior of Savonius‐type Magnus wind turbine, more detail analysis is needed about the loads on the Savonius and Bach blades used in these experiments. Since the lift and the drag forces that act upon the blade rotor are function of the angular velocity of the blade itself, measurement of the blade rpm was necessary. However the angular velocity of the Savonius and Bach blades were suspected to be different depending on the position of the rotor blade in the Magnus turbine rotational plane, therefore contributing to the fluctuation of the loads as well. For that purpose, a measurements of the rpm were performed for each of the rotational blades for Magnus turbine azimuthal angles θblade of 0°, 45°, 90°, 135° and 180° (see Figure 35).
Figure 35. Values of measurement azimuthal angles θblade
As can be seen from the figure, the uppermost position is taken as a zero, ʺnorthʺ value. A portable turn detector was used for the rpm measurements. After the blade was positioned at the desired angle, the rotation of the Magnus wheel was set to still condition and the measurement took place after some settling period of time so constant rotational speed of the blade could be reached. A procedure was repeated for each of the five azimuthal angles, for all the blades for the every prototype tested. The tests for other half of the rotor plane angles were not taken for the reasons of symmetry.
54

Investigation of the Savonius‐type Magnus Wind Turbine ________________
4.3 Full Model Test Procedure Testing the each prototype of Magnus wind turbine is done in order to obtain torque and power coefficients, CQ and CP as a function of the Magnus turbine tip speed ratio λM. After reaching the desired wind speed, turbine was released from the previous still condition and set into motion. The reasons for this hold/start procedure will be given later (Chapter 6). After constant rpm of the Magnus rotor was reached in the idling mode, generator load was activated using the inverter/breaking resistor circuit in a way that load was gradually increased from zero load condition, equivalent to idling mode, up to the highest possible load which corresponded to approximately 0.7 Hz rotating frequency of the rotor. The set of the high loads due the enormous resistive heat dissipation was not yielding any practical significance, but purpose was solely to model the efficiency in as large range of tip speed ratios as possible. The procedure was repeated for various wind speeds for cases of 2, 3, 4 and 5 blades that were consequently mounted on the hub plate. Since not all rotational blades were yielding the same performance for the particular wind speeds, selection criteria was to try to match the blades with rather similar rpm if possible for reasons of balanced load. If the difference in rpm between 2 blades for instance, is large, discrepancy in loads would cause the additional stresses on the main shaft of the turbine and that would influence a torque characteristic as well. In a case of increasing number of blades, that effect is a partially diminished by the fact that contribution of one blade on rotor performance is reduced, therefore shaft torsion stresses are lower.
Figure 36. Three blades test set‐up
55

Investigation of the Savonius‐type Magnus Wind Turbine ________________
5. Results 5.1 Rotor Blade Experimental Results In this chapter, the results will be given for blade number of revolution per minute as a function of the azimuthal position in the rotor plane, for a range of tested wind speeds. The results will cover all prototypes that were tested. A first two blade prototypes were fully tested for all 5 blades, and Prototypes 03 and 04 were presented on basis of three measurements in a former and one blade measurement in a later case. Reason for limited set of data comes from the destruction of some blades during the testing procedure since the measurements of the blade rpm took place after the Magnus torque tests and certain workout period in order to obtain better bearing performance. A reference rpm data are taken for 4, 6, 8 and 10 m/s regardless of the fact that some of the blade prototypes operate satisfactory for higher wind speeds and some showed much better cut‐in characteristic then the others.
0 20 40 60 80 100 120 140 160 180300
400
500
600
Azimuthal Position [°]
4m/s Wind Speed600
800
1000
6m/s Wind Speed1000
1500
Sav
oniu
s R
evol
utio
ns [r
pm]
8m/s Wind Speed1000
1500
2000
10m/s Wind Speed
2500
300012m/s Wind Speed Blade 11
Blade 12Blade 13Blade 14Blade 15
Figure 37. Prototype 01 ‐ blade rotation as a function of the wind speed and azimuthal angle
56

Investigation of the Savonius‐type Magnus Wind Turbine ________________
A Figure 37 represents the rotational data taken for the smallest, Prototype 01 case, and first thing that comes into attention is extremely bad starting characteristic of the blades, therefore the Magnus rotor itself. Only one blade was able to start at the 4 m/s wind speed and in order to start all five blades, a wind speed of approximately 6 m/s was necessary. It is properly suspected that this bad characteristic came from the fact that central shaft occupies the significant overlap space (see Figure 27), therefore neutralizing effect of the air flow extending to the returning paddle. The shaft influence will be examined later as a separate problem. One can notice the discrepancy between the rpm of the blades depending on the blade itself and the position of the blade in terms of the azimuthal angle with best revolution rate for the azimuth north position for all blades. A very bad aerodynamical performance of the Prototype 01, makes a blade more sensitive on the fluctuating bearing loading that is caused by the weight of the blade itself. A Prototype 02 blade brings drastic increase in the rpm rate (see Figure 38), not only due the increased size of the model, but also due the greater overlap ratio (63% comparing to the 22% of the prototype 1) and therefore a smaller contribution of the central shaft in a flow blockage.
0 20 40 60 80 100 120 140 160 180500
600
700
800
900
Savonius Position [°]
4m/s Wind Speed
8001000120014001600
6m/s Wind Speed160018002000220024002600
Sav
oniu
s R
evol
utio
ns [r
pm]
8m/s Wind Speed2000
2500
3000
350010m/s Wind Speed Blade 21
Blade 22Blade 23Blade 24Blade 25
Figure 38. Prototype 02 ‐ blade rotation as a function of the wind speed and azimuthal angle
57

Investigation of the Savonius‐type Magnus Wind Turbine ________________
Also it was observed that 4 from 5 blades tested, started revolving at approximately 3 m/s, therefore moving cut‐in characteristics toward more expected values for a small wind turbines. The rpm performance depends on an angular position of the blade again due the bearing load issue. Prototype 03 tested for a largest Savonius blade was made in a manner which was considered to be a reasonable match between an approximate optimum in overlap values (≈ 50%) and aspect ratio (≈ 4). A smaller values of the overlap ratio according to Ushiyama were yielding no significant RPM improvement of the rotor, and on a contrary could reduce it due the increase of the inertia moment. Also smaller overlap would increase a central shaft blockage effect. Starting characteristic of the blades was found to be similar as for a Prototype 02, and the blade revolution rate smaller then for previous prototype cases (see Figure 39). Bach rotor results were presented on Figure 40, and are based on results of measurements from one blade. Due the manufacturing problems, other blades were giving very tedious results that were not realistic in terms of explaining the rotational lift phenomena.
0 20 40 60 80 100 120 140 160 180200
400
600
Azimuthal Position [°]
4m/s Wind Speed600
800100012001400
6m/s Wind Speed1400
1600
1800
2000
Sav
oniu
s R
evol
utio
ns [r
pm]
8m/s Wind Speed
1800
2000
2200
2400
10m/s Wind Speed Blade 32Blade 33Blade 35
Figure 39. Prototype 03 ‐ blade rotation as a function of the wind speed and azimuthal angle (results from 3 blades)
58
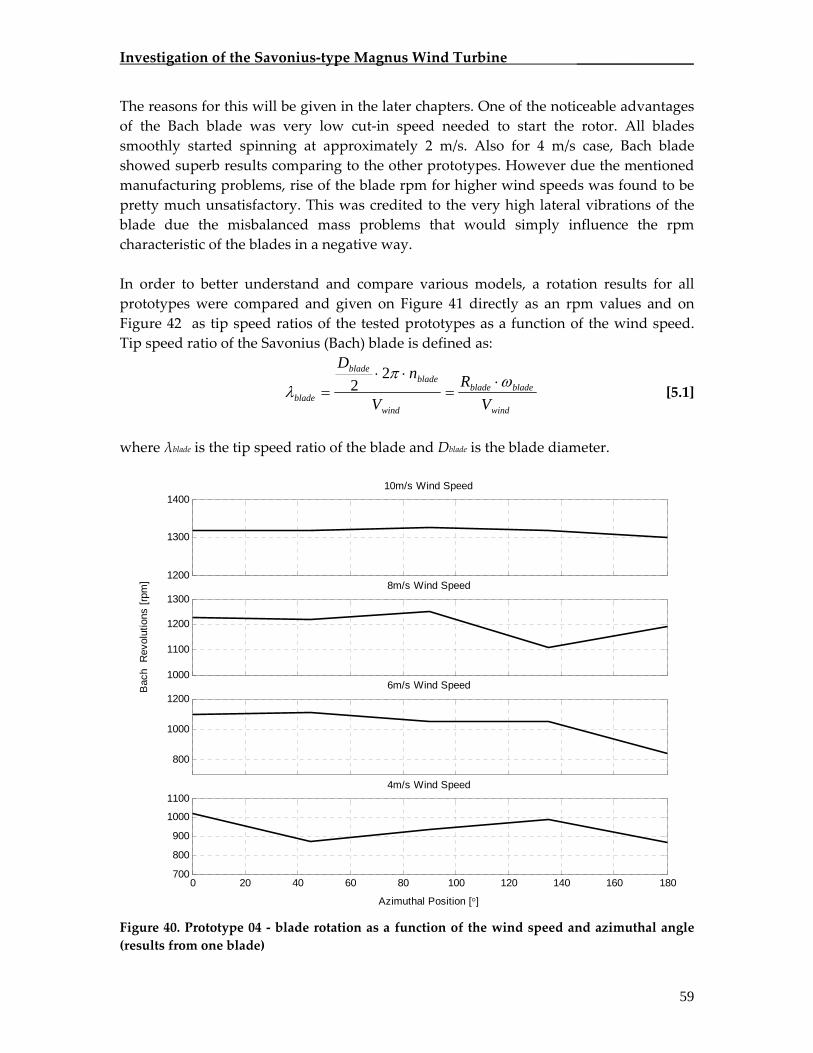
Investigation of the Savonius‐type Magnus Wind Turbine ________________
The reasons for this will be given in the later chapters. One of the noticeable advantages of the Bach blade was very low cut‐in speed needed to start the rotor. All blades smoothly started spinning at approximately 2 m/s. Also for 4 m/s case, Bach blade showed superb results comparing to the other prototypes. However due the mentioned manufacturing problems, rise of the blade rpm for higher wind speeds was found to be pretty much unsatisfactory. This was credited to the very high lateral vibrations of the blade due the misbalanced mass problems that would simply influence the rpm characteristic of the blades in a negative way. In order to better understand and compare various models, a rotation results for all prototypes were compared and given on Figure 41 directly as an rpm values and on Figure 42 as tip speed ratios of the tested prototypes as a function of the wind speed. Tip speed ratio of the Savonius (Bach) blade is defined as:
wind
bladeblade
wind
bladeblade
blade VR
V
nD
ωπλ
⋅=
⋅⋅=
22 [5.1]
where λblade is the tip speed ratio of the blade and Dblade is the blade diameter.
0 20 40 60 80 100 120 140 160 180700
800
900
1000
1100
Azimuthal Position [°]
4m/s Wind Speed
800
1000
12006m/s Wind Speed
1000
1100
1200
1300
Bac
h R
evol
utio
ns [r
pm] 8m/s Wind Speed
1200
1300
140010m/s Wind Speed
Figure 40. Prototype 04 ‐ blade rotation as a function of the wind speed and azimuthal angle (results from one blade)
59

Investigation of the Savonius‐type Magnus Wind Turbine ________________
3000
2500
2000
1500
1000
4 5 6 7 8 9 100
500
Wind Speed [m/s]
Bla
de R
evol
utio
ns [r
pm]
Prototype 01Prototype 02Prototype 03Prototype 04
k ≈ 360
Figure 41. RPM characteristic of tested prototypes
4 5 6 7 8 9 100.3
0.4
0.5
0.6
0.7
0.8
0.9
1
Wind Speed [m/s]
λ bla
de
Prototype 01Prototype 02Prototype 03Prototype 04
k ≈ 0.081
Figure 42. Tip speed ratio of the blades as a function of the wind speed
60

Investigation of the Savonius‐type Magnus Wind Turbine ________________
A single rpm value for the one wind speed is obtained as the mean of the all azimuthal rpm values and then averaged for the tested number of blades:
j
N
jiblade n
Nn ∑
=
=θ
θ 1_
1 [5.2]
where Nθ = 5 is a number of the azimuthal positions and ibladen _ mean for one blade.
And:
∑=
=bladesN
iiblade
bladesblade n
Nn
1_
1 [5.3]
where Nblades is a number of blades tested (1 ÷ 5) and bladen is a mean rpm for all blades. A both figures reveal a trend in increase of the rotational speed for the all prototypes. Red line represents a found linear fit only in terms of slope, while the starting rotation value for cut‐in speed (y‐axis slice) depends on the geometrical characteristics of the prototypes. A deviation from the fitted line practically characterizes the various set of problems in the blade functioning that are reducing performance, vibrations and bearing condition on a first place. If we adopt fitted line as a function that explains the theoretical behavior of the Savonius rotor, we see that the Bach profile characterized by the superb starting performance actually fails to hold such behavior due the manufacturing problems. Plots confirm the theory that tip speed ratio greater then one can not be obtained for Savonius type of rotor, therefore the measure of success of certain blade concept is the considered in terms how soon a blade will reach maximum tip speed ratio of one. Again Prototypes 02 and 03 seems to hold the best performance with Prototype 02 showing drop in the trend for wind speeds higher then 8 m/s. On the other hand, the Bach blade (Prototype 04) again shows the greatest potential for reaching a maximum tip speed ratio for wind speeds of roughly 7 m/s, but again the results are not as expected due the manufacturing and structural problems. This actually confirms the idea of using the electrically powered cylinders that would be able to achieve a higher rotational rates (greater then unity) thus being able to create a higher rotational lift. Since the blade prototype performance directly influences the power performance of the Magnus turbine, results for power and torque coefficient will be presented and grouped in a way that emphasizes important relations.
61

Investigation of the Savonius‐type Magnus Wind Turbine ________________
5.2 Magnus Experimental Results In this chapter, the results are given for torque and power coefficients as a function of the Magnusʹ turbine tip speed ratio. Since mechanical torque and rotor rpm were measured, other quantities were numerically derived from them in the following way:
wind
MM
wind
MM
M VR
V
nDωπ
λ ⋅=
⋅⋅=
22 [5.4]
rotmechmech QP ω⋅= [5.5]
where λM is the tip speed ratio of the rotor and DM is the Magnus rotor diameter. Replacing the basic definitions of the wind turbine power and torque [17], in expression 5.5, we yield:
MMMwindQMwindP RAVCAVC ωρρ ⋅⋅⋅⋅=⋅⋅ 23
21
21
[5.5]
therefore: MQP CC λ⋅= [5.6]
0 500 1000 1500 2000 2500 300050
100
150
200
250
300
350
400
Blade Rotation [rpm]
Mag
nus
Rot
atio
n [rp
m]
Prototype 01Prototype 02Prototype 03Prototype 04
Figure 43. Relation between blade and turbine rpm for idling case (2 blades). Marking points on lines represent wind speeds of 4,6, 8 and 10 m/s
62

Investigation of the Savonius‐type Magnus Wind Turbine ________________
Even without the generator load, it is possible to anticipate the performance of the manufactured prototypes just by observing the idling characteristic of the Magnus rotor. Regardless of the fact that rotor then suffers zero torque, a relation between the Magnus rotations clearly reflects the lift capabilities of the driving blades. Figure 43 shows the Magnus rotor revolutions as a function of rotation of the all blade prototypes for 2 blades case. Plot doesnʹt differentiate much for a case of 3, 4 and 5 blades, and it was found that the Magnus rotor suffers a maximum drop in the revolutions of approximately 9 ‐ 14% for the 5 blades case comparing to the current one. Clearly the best performance is shown for a Prototype 03 blade that is capable of developing same or higher Magnus idling rate for a smaller rpm and same wind speed. This clearly comes from the larger diameter of the Prototype 03 and the increased circulation around the blade which allows such behavior. A graph again confirms superior performance of the Bach blade but only for 4 m/s case; The Bach blade with the same diameter as a Prototype 02, develops 25% higher rpm rate and induces 50% higher idling rotational speed of the Magnus rotor. For this reasons, power and torque characteristic of all prototypes will be given in comparison to the results for a Prototype 03 model. Itʹs power and torque performance are presented as a function of the wind speed and number of blades on Figures 44 – 51. Subsequently power and torque results of the Prototype 03 are compared with other prototypes for a various wind speed cases, given in a manner that shows additional dependence of the number of blades. They are presented on Figures 52 ‐ 73. All figures show that apparently the tip speed ratio of the Prototype 03 powered Magnus turbine can not over exceed λM ≈ 1.4 and the limit is reducing when the number of rotor blades is increased. Also the maximum values of the power coefficient are obtained for the tip speed ratios of approximately λM = 0.65 ~ 0.8 (moving toward lower value for increase in the number of the blades) with exception of 4 m/s case that yields maximum at λM ≈ 0.6. Additional generator load decreases power coefficient as expected. The rise in a torque and power coefficient is directly proportional to the wind speed and the number of blades. A former one is a solely characteristic of this particular turbine and doesnʹt yield any similarity with classical HAWT systems. Power coefficient dependence on the wind speed can be attributed actually to the dependence of the Magnus rotor performance on the tip speed ratio of the Savonius blades. Therefore we have a relation between tip speed ratios of the Savonius and the Magnus wind turbine. In that manner, it is also possible to present the power and the torque curves on Figures 44 ‐ 73 as a function of the Savonius tip speed ratio instead of the wind speed (using the dependence from Figure 42).
63

Investigation of the Savonius‐type Magnus Wind Turbine ________________
0.2 0.4 0.6 0.8 1 1.2 1.4 1.60
0.005
0.01
0.015
0.02
0.025
0.03
0.035
Tip Speed Ratio λM
Pow
er C
oeffi
cien
t Cp
4 m/s6 m/s8 m/s10 m/s
Figure 44. Power coefficient of the Prototype 03 model as a function of Magnus tip‐speed ratio for 2 blades case
0.2 0.4 0.6 0.8 1 1.2 1.4 1.60
0.01
0.02
0.03
0.04
0.05
0.06
0.07
Tip Speed Ratio λM
Torq
ue C
oeffi
cien
t Cq
4 m/s6 m/s8 m/s10 m/s
Figure 45. Torque coefficient of the Prototype 03 model as a function of Magnus tip‐speed ratio for 2 blades case
64

Investigation of the Savonius‐type Magnus Wind Turbine ________________
0.2 0.4 0.6 0.8 1 1.2 1.4 1.60
0.005
0.01
0.015
0.02
0.025
0.03
0.035
0.04
0.045
0.05
Tip Speed Ratio λM
Pow
er C
oeffi
cien
t Cp
4 m/s6 m/s8 m/s10 m/s
Figure 46. Power coefficient of the Prototype 03 model as a function of Magnus tip‐speed ratio for 3 blades case
0.2 0.4 0.6 0.8 1 1.2 1.4 1.60
0.02
0.04
0.06
0.08
0.1
0.12
Tip Speed Ratio λM
Torq
ue C
oeffi
cien
t Cq
Huge Savonius - 3 Blades
4 m/s6 m/s8 m/s10 m/s
Figure 47. Torque coefficient of the Prototype 03 model as a function of Magnus tip‐speed ratio for 3 blades case
65

Investigation of the Savonius‐type Magnus Wind Turbine ________________
0.2 0.4 0.6 0.8 1 1.2 1.4 1.60
0.01
0.02
0.03
0.04
0.05
0.06
0.07
Tip Speed Ratio λM
Pow
er C
oeffi
cien
t Cp
4 m/s6 m/s8 m/s10 m/s
Figure 48. Power coefficient of the Prototype 03 model as a function of Magnus tip‐speed ratio for 4 blades case
0.2 0.4 0.6 0.8 1 1.2 1.4 1.60
0.02
0.04
0.06
0.08
0.1
0.12
Tip Speed Ratio λM
Torq
ue C
oeffi
cien
t Cq
4 m/s6 m/s8 m/s10 m/s
Figure 49. Torque coefficient of the Prototype 03 model as a function of Magnus tip‐speed ratio for 4 blades case
66

Investigation of the Savonius‐type Magnus Wind Turbine ________________
0.2 0.4 0.6 0.8 1 1.2 1.4 1.60
0.01
0.02
0.03
0.04
0.05
0.06
0.07
0.08
Tip Speed Ratio λM
Pow
er C
oeffi
cien
t Cp
4 m/s6 m/s8 m/s10 m/s
Figure 50. Power coefficient of the Prototype 03 model as a function of Magnus tip‐speed ratio for 5 blades case
0.2 0.4 0.6 0.8 1 1.2 1.4 1.60
0.02
0.04
0.06
0.08
0.1
0.12
0.14
0.16
Tip Speed Ratio λM
Torq
ue C
oeffi
cien
t Cq
4 m/s6 m/s8 m/s10 m/s
Figure 51. Torque coefficient of the Prototype 03 model as a function of Magnus tip‐speed ratio for 5 blades case
67
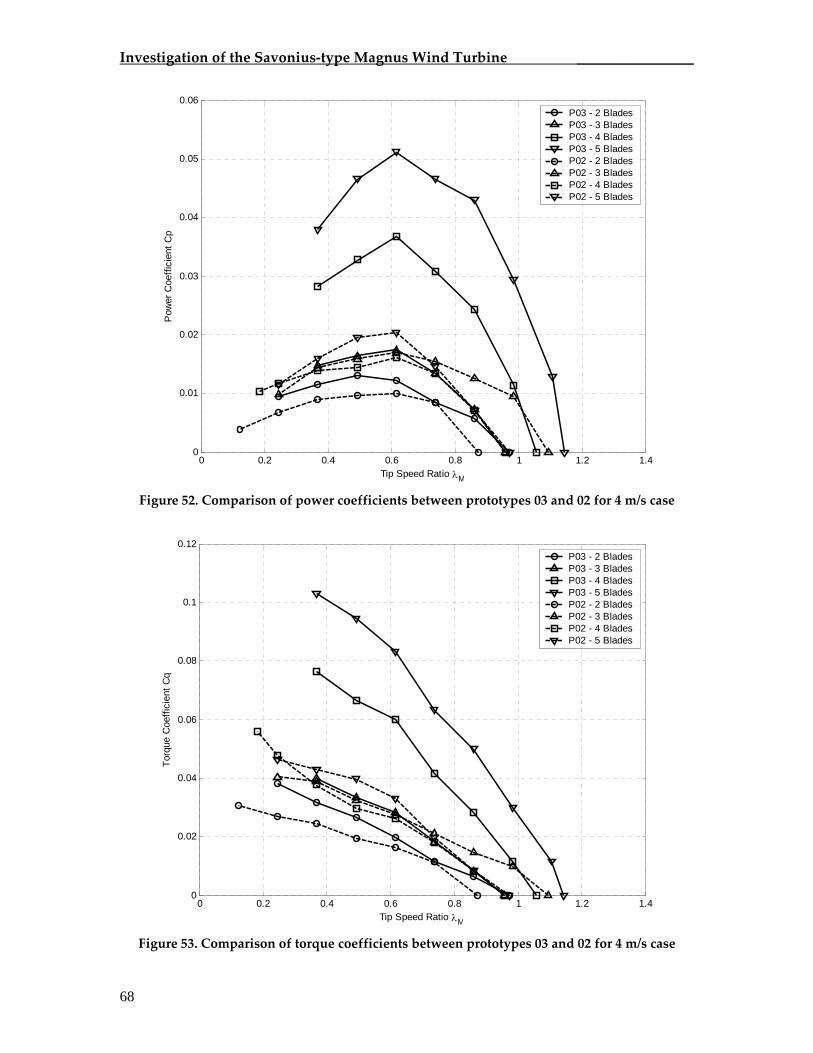
Investigation of the Savonius‐type Magnus Wind Turbine ________________
0 0.2 0.4 0.6 0.8 1 1.2 1.40
0.01
0.02
0.03
0.04
0.05
0.06
Tip Speed Ratio λM
Pow
er C
oeffi
cien
t Cp
P03 - 2 BladesP03 - 3 BladesP03 - 4 BladesP03 - 5 BladesP02 - 2 BladesP02 - 3 BladesP02 - 4 BladesP02 - 5 Blades
Figure 52. Comparison of power coefficients between prototypes 03 and 02 for 4 m/s case
0 0.2 0.4 0.6 0.8 1 1.2 1.40
0.02
0.04
0.06
0.08
0.1
0.12
Tip Speed Ratio λM
Torq
ue C
oeffi
cien
t Cq
P03 - 2 BladesP03 - 3 BladesP03 - 4 BladesP03 - 5 BladesP02 - 2 BladesP02 - 3 BladesP02 - 4 BladesP02 - 5 Blades
Figure 53. Comparison of torque coefficients between prototypes 03 and 02 for 4 m/s case
68

Investigation of the Savonius‐type Magnus Wind Turbine ________________
0.2 0.4 0.6 0.8 1 1.2 1.4 1.60
0.01
0.02
0.03
0.04
0.05
0.06
Tip Speed Ratio λM
Pow
er C
oeffi
cien
t Cp
P03 - 2 BladesP03 - 3 BladesP03 - 4 BladesP03 - 5 BladesP04 - 2 BladesP04 - 4 Blades
Figure 54. Comparison of power coefficients between prototypes 03 and 04 for 4 m/s case
0 0.2 0.4 0.6 0.8 1 1.2 1.40
0.02
0.04
0.06
0.08
0.1
0.12
Tip Speed Ratio λM
Torq
ue C
oeffi
cien
t Cq
P03 - 2 BladesP03 - 3 BladesP03 - 4 BladesP03 - 5 BladesP04 - 2 BladesP04 - 4 Blades
Figure 55. Comparison of torque coefficients between prototypes 03 and 04 for 4 m/s case
69

Investigation of the Savonius‐type Magnus Wind Turbine ________________
0 0.2 0.4 0.6 0.8 1 1.2 1.40
0.01
0.02
0.03
0.04
0.05
0.06
0.07
Tip Speed Ratio λM
Pow
er C
oeffi
cien
t Cp
P03 - 2 BladesP03 - 3 BladesP03 - 4 BladesP03 - 5 BladesP01 - 2 BladesP01 - 3 BladesP01 - 4 BladesP01 - 5 Blades
Figure 56. Comparison of power coefficients between prototypes 03 and 01 for 6 m/s case
0 0.2 0.4 0.6 0.8 1 1.2 1.40
0.02
0.04
0.06
0.08
0.1
0.12
0.14
0.16
Tip Speed Ratio λM
Torq
ue C
oeffi
cien
t Cq
P03 - 2 BladesP03 - 3 BladesP03 - 4 BladesP03 - 5 BladesP01 - 2 BladesP01 - 3 BladesP01 - 4 BladesP01 - 5 Blades
Figure 57. Comparison of torque coefficients between prototypes 03 and 01 for 6 m/s case
70

Investigation of the Savonius‐type Magnus Wind Turbine ________________
0 0.2 0.4 0.6 0.8 1 1.2 1.40
0.01
0.02
0.03
0.04
0.05
0.06
0.07
Tip Speed Ratio λM
Pow
er C
oeffi
cien
t Cp
P03 - 2 BladesP03 - 3 BladesP03 - 4 BladesP03 - 5 BladesP02 - 2 BladesP02 - 3 BladesP02 - 4 BladesP02 - 5 Blades
Figure 58. Comparison of power coefficients between prototypes 03 and 02 for 6 m/s case
0 0.2 0.4 0.6 0.8 1 1.2 1.40
0.02
0.04
0.06
0.08
0.1
0.12
0.14
0.16
Tip Speed Ratio λM
Torq
ue C
oeffi
cien
t Cq
P03 - 2 BladesP03 - 3 BladesP03 - 4 BladesP03 - 5 BladesP02 - 2 BladesP02 - 3 BladesP02 - 4 BladesP02 - 5 Blades
Figure 59. Comparison of torque coefficients between prototypes 03 and 02 for 6 m/s case
71

Investigation of the Savonius‐type Magnus Wind Turbine ________________
0.2 0.4 0.6 0.8 1 1.2 1.4 1.60
0.01
0.02
0.03
0.04
0.05
0.06
0.07
Tip Speed Ratio λM
Pow
er C
oeffi
cien
t Cp
P03 - 2 BladesP03 - 3 BladesP03 - 4 BladesP03 - 5 BladesP04 - 2 BladesP04 - 4 Blades
Figure 60. Comparison of power coefficients between prototypes 03 and 04 for 6 m/s case
0.2 0.4 0.6 0.8 1 1.2 1.4 1.60
0.02
0.04
0.06
0.08
0.1
0.12
0.14
0.16
Tip Speed Ratio λM
Torq
ue C
oeffi
cien
t Cq
P03 - 2 BladesP03 - 3 BladesP03 - 4 BladesP03 - 5 BladesP04 - 2 BladesP04 - 4 Blades
Figure 61. Comparison of torque coefficients between prototypes 03 and 04 for 6 m/s case
72

Investigation of the Savonius‐type Magnus Wind Turbine ________________
0 0.5 1 1.50
0.01
0.02
0.03
0.04
0.05
0.06
0.07
Tip Speed Ratio λM
Pow
er C
oeffi
cien
t Cp
P03 - 2 BladesP03 - 3 BladesP03 - 4 BladesP03 - 5 BladesP01 - 2 BladesP01 - 3 BladesP01 - 4 BladesP01 - 5 Blades
Figure 62. Comparison of power coefficients between prototypes 03 and 01 for 8 m/s case
0 0.5 1 1.50
0.02
0.04
0.06
0.08
0.1
0.12
0.14
0.16
Tip Speed Ratio λM
Torq
ue C
oeffi
cien
t Cq
P03 - 2 BladesP03 - 3 BladesP03 - 4 BladesP03 - 5 BladesP01 - 2 BladesP01 - 3 BladesP01 - 4 BladesP01 - 5 Blades
Figure 63. Comparison of torque coefficients between prototypes 03 and 01 for 8 m/s case
73

Investigation of the Savonius‐type Magnus Wind Turbine ________________
0 0.5 1 1.50
0.01
0.02
0.03
0.04
0.05
0.06
0.07
Tip Speed Ratio λM
Pow
er C
oeffi
cien
t Cp
P03 - 2 BladesP03 - 3 BladesP03 - 4 BladesP03 - 5 BladesP02 - 2 BladesP02 - 3 BladesP02 - 4 BladesP02 - 5 Blades
Figure 64. Comparison of power coefficients between prototypes 03 and 02 for 8 m/s case
0 0.5 1 1.50
0.02
0.04
0.06
0.08
0.1
0.12
0.14
0.16
Tip Speed Ratio λM
Torq
ue C
oeffi
cien
t Cq
P03 - 2 BladesP03 - 3 BladesP03 - 4 BladesP03 - 5 BladesP02 - 2 BladesP02 - 3 BladesP02 - 4 BladesP02 - 5 Blades
Figure 65. Comparison of torque coefficients between prototypes 03 and 02 for 8 m/s case
74

Investigation of the Savonius‐type Magnus Wind Turbine ________________
0.2 0.4 0.6 0.8 1 1.2 1.4 1.60
0.01
0.02
0.03
0.04
0.05
0.06
0.07
Tip Speed Ratio λM
Pow
er C
oeffi
cien
t Cp
P03 - 2 BladesP03 - 3 BladesP03 - 4 BladesP03 - 5 BladesP04 - 2 BladesP04 - 4 Blades
Figure 66. Comparison of power coefficients between prototypes 03 and 04 for 8 m/s case
0.2 0.4 0.6 0.8 1 1.2 1.4 1.60
0.02
0.04
0.06
0.08
0.1
0.12
0.14
0.16
Tip Speed Ratio λM
Torq
ue C
oeffi
cien
t Cq
P03 - 2 BladesP03 - 3 BladesP03 - 4 BladesP03 - 5 BladesP04 - 2 BladesP04 - 4 Blades
Figure 67. Comparison of torque coefficients between prototypes 03 and 04 for 8 m/s case
75

Investigation of the Savonius‐type Magnus Wind Turbine ________________
0 0.5 1 1.50
0.01
0.02
0.03
0.04
0.05
0.06
0.07
0.08
Tip Speed Ratio λM
Pow
er C
oeffi
cien
t Cp
P03 - 2 BladesP03 - 3 BladesP03 - 4 BladesP03 - 5 BladesP01 - 2 BladesP01 - 3 BladesP01 - 4 BladesP01 - 5 Blades
Figure 68. Comparison of power coefficients between prototypes 03 and 01 for 10 m/s case
0 0.5 1 1.50
0.02
0.04
0.06
0.08
0.1
0.12
0.14
Tip Speed Ratio λM
Torq
ue C
oeffi
cien
t Cq
P03 - 2 BladesP03 - 3 BladesP03 - 4 BladesP03 - 5 BladesP01 - 2 BladesP01 - 3 BladesP01 - 4 BladesP01 - 5 Blades
Figure 69. Comparison of torque coefficients between prototypes 03 and 01 for 10 m/s case
76

Investigation of the Savonius‐type Magnus Wind Turbine ________________
0 0.2 0.4 0.6 0.8 1 1.2 1.4 1.6 1.80
0.01
0.02
0.03
0.04
0.05
0.06
0.07
0.08
Tip Speed Ratio λM
Pow
er C
oeffi
cien
t Cp
P03 - 2 BladesP03 - 3 BladesP03 - 4 BladesP03 - 5 BladesP02 - 2 BladesP02 - 3 BladesP02 - 4 BladesP02 - 5 Blades
Figure 70. Comparison of power coefficients between prototypes 03 and 02 for 10 m/s case
0 0.2 0.4 0.6 0.8 1 1.2 1.4 1.6 1.80
0.02
0.04
0.06
0.08
0.1
0.12
0.14
0.16
Tip Speed Ratio λM
Torq
ue C
oeffi
cien
t Cq
P03 - 2 BladesP03 - 3 BladesP03 - 4 BladesP03 - 5 BladesP02 - 2 BladesP02 - 3 BladesP02 - 4 BladesP02 - 5 Blades
Figure 71. Comparison of torque coefficients between prototypes 03 and 02 for 10 m/s case
77

Investigation of the Savonius‐type Magnus Wind Turbine ________________
0.2 0.4 0.6 0.8 1 1.2 1.4 1.60
0.01
0.02
0.03
0.04
0.05
0.06
0.07
0.08
Tip Speed Ratio λM
Pow
er C
oeffi
cien
t Cp
P03 - 2 BladesP03 - 3 BladesP03 - 4 BladesP03 - 5 BladesP04 - 2 Blades
Figure 72. Comparison of power coefficients between prototypes 03 and 04 for 10 m/s case
0.2 0.4 0.6 0.8 1 1.2 1.4 1.60
0.02
0.04
0.06
0.08
0.1
0.12
0.14
Tip Speed Ratio λM
Torq
ue C
oeffi
cien
t Cq
P03 - 2 BladesP03 - 3 BladesP03 - 4 BladesP03 - 5 BladesP04 - 2 Blades
Figure 73. Comparison of torque coefficients between prototypes 03 and 04 for 10 m/s case
78

Investigation of the Savonius‐type Magnus Wind Turbine ________________
It can be noticed that torque and power do not yield a linear rise with wind speed and set of optimal values for the power coefficient at certain wind speed reduces since the parabola curve elongates and thus reduces the optimum performance zone. Hence, choice of the proper generator is very important. Following the practice for a small wind turbines, nominal wind velocity will be set to V = 10 m/s, and it can be used as a reference value for setting the possible load. Further plots reveal obvious inferiority of the Magnus rotors powered by other blade prototypes comparing to the Prototype 03 blade. Prototype 01 powered Magnus rotor again showed the poor quality due the combined role of gap shaft blockage and small blade diameter, while Prototype 02 powered model is yielding superior performance comparing to Prototype 03 only for a 10 m/s case in a range of the tip speed ratios higher then λM ≈ 0.82 (see Figures 70 and 71). In addition, the tip speed ratios for Prototype 02 based Magnus rotor are higher then for any other prototype and they reach up to λM = 1.8. Again, the tip speed ratio was found to be decreasing with number of blades and increasing for higher wind speeds. Prototype 04 obtains higher power efficiency then Prototype 03 model for a 4 m/s case in a range of tip speed ratios above approximately λM ≈ 0.6 for both, two and four blades cases (see Figures 54 and 55). Overall, a power performance of the Savonius‐based Magnus rotor is low. For the best case of Prototype 03 powered rotor with 5 blades, the power coefficient was approximately CP = 0.075 which is about 3 times smaller CP then for a typical Savonius rotor and about 6 times smaller then the power coefficient of the properly designed 3 bladed HAWT system. On the other hand, this study showed that such system is possible to build and that itʹs inferior performance actually corresponds with the overall low expenses for such device. In order to further reduce the costs, constant load generator and fixed rotor speed system could be used instead of the one with the controller for a variable speed regulation. In such case, generator should be optimized for some wind speed that was found to be appropriate for the desired location. Table 9 contains optimum tip speed ratio values (in terms of power coefficient) for maximum power output for tested range of wind speeds.
Wind Speed [m/s]
Optimum TSR
Rotor Rotation [rpm]
Mechanical Power [W]
4 0.62 50 1.3 6 0.74 90 6.3 8 0.74 120 14 10 0.69 140 29.9
Table 10. Magnus turbine shaft power for optimum values of tip speed ratio
79

Investigation of the Savonius‐type Magnus Wind Turbine ________________
6. Modal Analysis of the Blades During the wind tunnel tests, it was noticed that in a range of certain wind speeds, a power performance of the rotor was drastically dropping. The measured torque was showing highly unstable behavior together with the number of revolutions of the Magnus rotor. A significantly lower average values of the torque and sometimes a low values of the tip speed ratio were reason for concern and further investigation. The power curve in general was expected to be substantially higher for a given wind speed comparing to the other wind speed measurements, and some tests were proved to be unsuccessful. The examples of such behavior are given on Figure 43 below.
0.1 0.2 0.3 0.4 0.5 0.6 0.7 0.80
0.002
0.004
0.006
0.008
0.01
0.012
Tip Speed Ratio λM
Pow
er C
oeffi
cien
t Cp
Prototype 01 - 4 Blades
8 m/s Valid Test8 m/s Invalid Test
0 0.2 0.4 0.6 0.8 1 1.2 1.4 1.6 1.80
0.005
0.01
0.015
0.02
0.025
0.03
0.035
0.04
0.045
Tip Speed Ratio λM
Torq
ue C
oeffi
cien
t Cq
Prototype 02 - 3 Blades
10 m/s Valid Test10 m/s Invalid Test
a) b)
0.2 0.4 0.6 0.8 1 1.2 1.4 1.6 1.80
0.01
0.02
0.03
0.04
0.05
0.06
Tip Speed Ratio λM
Pow
er C
oeffi
cien
t Cp
Prototype 02 - 4 Blades
10 m/s Valid Test10 m/s Invalid Test
0.2 0.4 0.6 0.8 1 1.2 1.4 1.6 1.80
0.01
0.02
0.03
0.04
0.05
0.06
0.07
0.08
Tip Speed Ratio λ
Pow
er C
oeffi
cien
t Cp
Prototype 02 - 5 Blades
10 m/s Valid Test10 m/s Invalid Test
M
c) d)
Figure 74. Various cases of vibration influenced power performance
For this reason, like mentioned in Ch. 4.3, hold and start procedure was applied for every wind speed in order to determine the condition of the rotor before setting the rotor to idling state. A simple eye examination of the blocked rotor in some wind regimes, revealed a large amplitude lateral vibrations on the rotating Savonius blades that were suspected to correspond to the natural frequencies of the blades themselves.
80

Investigation of the Savonius‐type Magnus Wind Turbine ________________
Due the lack of the equipment, such as a FFT analyzer and data logger, it was impossible to do any experimental modal analysis of the prototype blades. Instead, a simpler and rather inaccurate eye‐check method analysis was done together with FEM modal analysis using ANSYS software.
Figure 75. Prototype 01 FEM model used for modal analysis
Figure 76. Prototype 02 FEM model used for modal analysis
A former one consisted of the simple observation of the blade on a blocked Magnus rotor while its rotational speed was decreasing after the sudden stop of the wind tunnel
81

Investigation of the Savonius‐type Magnus Wind Turbine ________________
fan. A portable turn‐detector was used to record rpm of the blades during the complete series of vibration event, from initialization over itʹs peak value to a settling state again. Beyond the doubt, such tests don’t hold sufficient accuracy for any serious analysis but its value is in the determination of the approximate range where resonance event can occur.
Figure 77. Prototype 03 FEM model used for modal analysis
Figure 78. Prototype 04 FEM model used for modal analysis
82
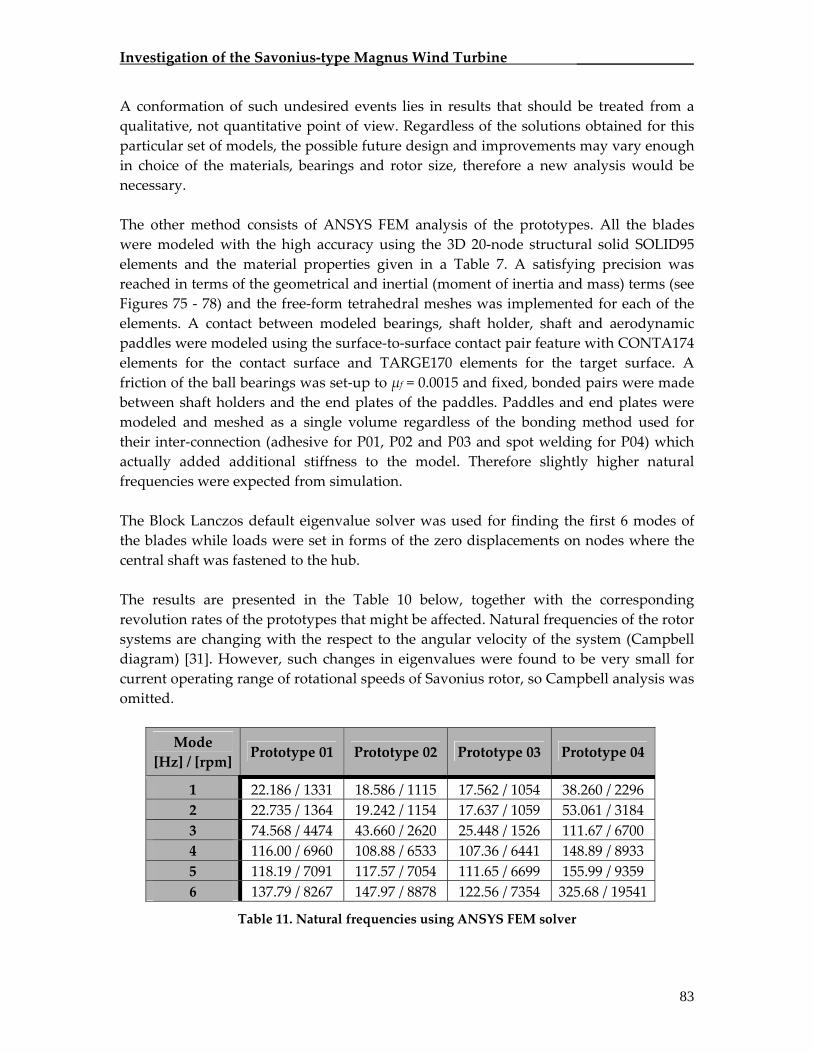
Investigation of the Savonius‐type Magnus Wind Turbine ________________
A conformation of such undesired events lies in results that should be treated from a qualitative, not quantitative point of view. Regardless of the solutions obtained for this particular set of models, the possible future design and improvements may vary enough in choice of the materials, bearings and rotor size, therefore a new analysis would be necessary. The other method consists of ANSYS FEM analysis of the prototypes. All the blades were modeled with the high accuracy using the 3D 20‐node structural solid SOLID95 elements and the material properties given in a Table 7. A satisfying precision was reached in terms of the geometrical and inertial (moment of inertia and mass) terms (see Figures 75 ‐ 78) and the free‐form tetrahedral meshes was implemented for each of the elements. A contact between modeled bearings, shaft holder, shaft and aerodynamic paddles were modeled using the surface‐to‐surface contact pair feature with CONTA174 elements for the contact surface and TARGE170 elements for the target surface. A friction of the ball bearings was set‐up to μf = 0.0015 and fixed, bonded pairs were made between shaft holders and the end plates of the paddles. Paddles and end plates were modeled and meshed as a single volume regardless of the bonding method used for their inter‐connection (adhesive for P01, P02 and P03 and spot welding for P04) which actually added additional stiffness to the model. Therefore slightly higher natural frequencies were expected from simulation. The Block Lanczos default eigenvalue solver was used for finding the first 6 modes of the blades while loads were set in forms of the zero displacements on nodes where the central shaft was fastened to the hub. The results are presented in the Table 10 below, together with the corresponding revolution rates of the prototypes that might be affected. Natural frequencies of the rotor systems are changing with the respect to the angular velocity of the system (Campbell diagram) [31]. However, such changes in eigenvalues were found to be very small for current operating range of rotational speeds of Savonius rotor, so Campbell analysis was omitted.
Mode [Hz] / [rpm] Prototype 01 Prototype 02 Prototype 03 Prototype 04
1 22.186 / 1331 18.586 / 1115 17.562 / 1054 38.260 / 2296 2 22.735 / 1364 19.242 / 1154 17.637 / 1059 53.061 / 3184 3 74.568 / 4474 43.660 / 2620 25.448 / 1526 111.67 / 6700 4 116.00 / 6960 108.88 / 6533 107.36 / 6441 148.89 / 8933 5 118.19 / 7091 117.57 / 7054 111.65 / 6699 155.99 / 9359 6 137.79 / 8267 147.97 / 8878 122.56 / 7354 325.68 / 19541
Table 11. Natural frequencies using ANSYS FEM solver
83
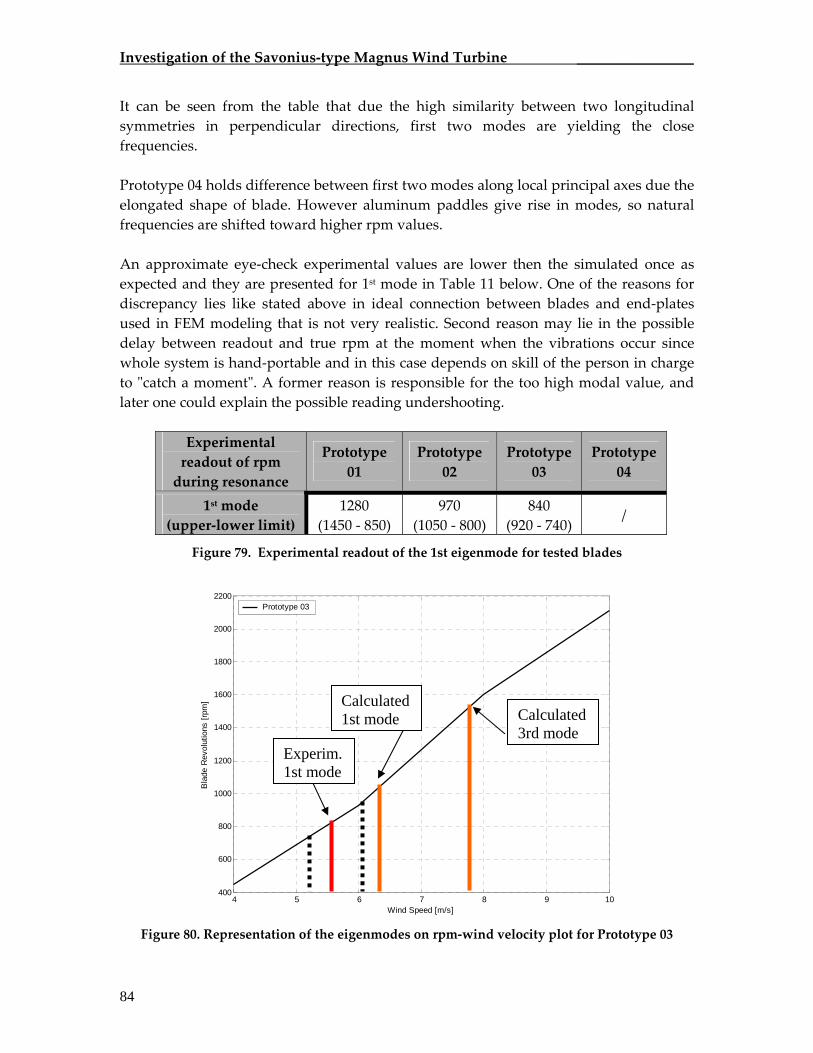
Investigation of the Savonius‐type Magnus Wind Turbine ________________
It can be seen from the table that due the high similarity between two longitudinal symmetries in perpendicular directions, first two modes are yielding the close frequencies. Prototype 04 holds difference between first two modes along local principal axes due the elongated shape of blade. However aluminum paddles give rise in modes, so natural frequencies are shifted toward higher rpm values. An approximate eye‐check experimental values are lower then the simulated once as expected and they are presented for 1st mode in Table 11 below. One of the reasons for discrepancy lies like stated above in ideal connection between blades and end‐plates used in FEM modeling that is not very realistic. Second reason may lie in the possible delay between readout and true rpm at the moment when the vibrations occur since whole system is hand‐portable and in this case depends on skill of the person in charge to ʺcatch a momentʺ. A former reason is responsible for the too high modal value, and later one could explain the possible reading undershooting.
Experimental readout of rpm during resonance
Prototype 01
Prototype 02
Prototype 03
Prototype 04
1st mode (upper‐lower limit)
1280 (1450 ‐ 850)
970 (1050 ‐ 800)
840 (920 ‐ 740)
/
Figure 79. Experimental readout of the 1st eigenmode for tested blades
4 5 6 7 8 9 10400
600
800
1000
1200
1400
1600
1800
2000
2200
Wind Speed [m/s]
Bla
de R
evol
utio
ns [r
pm]
Prototype 03
Experim. 1st mode
Calculated 1st mode Calculated
3rd mode
Figure 80. Representation of the eigenmodes on rpm‐wind velocity plot for Prototype 03
84

Investigation of the Savonius‐type Magnus Wind Turbine ________________
The fourth prototype wasnʹt tested for vibration analysis for the reason of large vibrations that were already occurring due the bad blade/tip‐plates mounting that caused the unbalanced load. Figure 80 shows the approximate zones of the Prototype 03 rotor modal frequencies influence on a rpm vs. wind speed plot. Both, experimental and calculated values are presented. Results for the blade revolutions confirm the validity of the simple experimental analysis since upper limit of blade vibrations actually well corresponds with the rise in a slope of the rpm trend line. For a 3rd mode, the numerical procedure based on a same criteria gives good prediction since around 1600rpm drop in blade revolutions was again observed which is reflected in decline of the rpm characteristic slope. Also should be emphasized that performance of each rotor of the same prototype is different and depends on individual settings and conditions of the blade itself (i.e. see Figure 39) therefore upper plot is presented for the averaged revolution rates of all measured blades. However, the results strongly imply that first and second eigenfrequency are characteristic for wind speeds around 6 m/s while the third mode corresponds to the 8 m/s case. Figures 81 – 86 show eigenshapes of the blade for all six modes. First and the second eigenmode are the bending modes corresponding to the flapwise and edgewise modes of the classic blade and main principle axes are not x and y axis. Third eigenmode is corresponding to the twisting of the Savonius blade while fourth and fifth modes are equivalent to phased and out‐of‐phase bulking of the paddles. Sixth mode is yielding a rather complex bending of the paddles with local bucking on the returning paddle.
85

Investigation of the Savonius‐type Magnus Wind Turbine ________________
Figure 81. First mode, f1st = 17.562 Hz
Figure 82. Second mode, f2nd = 17.637 Hz
Figure 83. Third mode, f3rd = 22.548 Hz
86

Investigation of the Savonius‐type Magnus Wind Turbine ________________
Figure 84. Fourth mode, f4th = 107.36 Hz Figure 85. Fifth mode, f5th = 111.65 Hz
Figure 86. Sixth mode, f6th = 122.56 Hz
87

Investigation of the Savonius‐type Magnus Wind Turbine ________________
7. Stress and Deformation Analysis A short analysis will be given here regarding the centrifugal bucking phenomenon that was found to have a significant impact on the Savonius based Magnus turbine performance. In the numerous cases was found that misuse of the adhesive materials between tip plates and the PVC blades lead to the abrupt break of the blades around 2500 ‐ 3000RPM at approx. 10‐12 m/s wind speeds. Due the high inertial loads, buckling of the blade stress increases in the zones where blade is connected to the tip plates and if the local stress is bigger then yielding value of the bonded contact, connection simply brakes apart (see Figure 87). In order to investigate such phenomena numerical simulation was invoked once more.
Figure 87. Prototype 03 blade destroyed at 12 m/s due the centrifugal buckling
Again, ANSYS calculation was made on a Prototype 03 model using a large displacement transient analysis in order to properly model geometric nonlinearity of the buckets. A typical rule of thumb states that if the out‐of‐plane deflection of some plate or shell is greater than half of itʹs thickness, then membrane forces start to become significant in resisting the applied load [6]. In ANSYS, this calls for activating a large displacement solution (a.k.a. geometric nonlinearity). Since the wall thickness was 6 mm and it was largely suspected that blade deformations might be bigger then 3 mm. A transient dynamic analysis is usually used to determine the dynamic response of a structure under the action of any general time‐dependent loads. This type of the analysis was used to determine the time‐varying displacements, strains, stresses, and forces in a structure since it good corresponds to combination of the static, transient and harmonic loads and specially when inertial loads are important like in the current study.
88

Investigation of the Savonius‐type Magnus Wind Turbine ________________
A basic equation of motion solved by a transient dynamic analysis in ANSYS is given in a form:
{ } { } { } ( )tFuKuDuM =++ &&& [7.1] where M, D, and K are mass, damping and stiffness matrix respectively and u , and u represent nodal acceleration, nodal velocity and nodal displacement vectors. On a right hand side force vector is given. Terms such as
&& u&
{ }uM && are used to account for inertial forces we deal with in this case. For this purpose, a Newmark time integration method was used as a default one. A tested prototype was modeled as a solely PVC blade with tip plates without any bearings and central shaft. As a load vector angular velocity of 314.16 rad/s was set which corresponds to the 3000RPM. Deformation vector sum of the blade displacement is given on Figure 88 below.
Figure 88. Deformation vector sum of the P03 blade for 3000RPM
As expected highest value of displacement is on the mid point of the edge of the advancing paddle and linear deformation in local x direction is calculated to be ux = 4.72 mm which seems to be a good match with observed buckling. Experimental data lack because of the difficulties to measure geometry deformation during the rotation due the lack of adequate equipment. A highest value of the total displacement is measured to be usum = 6.12 mm and itʹs located on the edge of returning paddle. This value includes the sum of all three directional displacements. Buckling of the structure is also noticeable in y‐direction (see Figure 89) together with the deformation of the tip‐plates.
89

Investigation of the Savonius‐type Magnus Wind Turbine ________________
Figure 89. Deformation of the blade and tip plates for P03 model
Tip plate deformations are not unexpected even in a case with mounted bearings, since the connection between plates and bearing is usually established with the small gap that enables higher rpm of the blades comparing to the case of direct contact between them. Also stress distribution of the blade is presented as a contour plot of the stress intensity (see Figure 90). Stress intensity σI is defined over principal stresses as a largest of absolute values of differences in the calculated nodes i.e.:
σI = max[(σ1 – σ2), (σ3 – σ1), (σ2 – σ3)] [7.2] where the principal stresses are defined over a stresses in x, y and z direction as:
0=−
−−
izzyzx
yziyyx
xzxyix
σσσσσσσσσσσσ
[7.3]
for i = 1,2,3. In order to establish criteria for predicting the onset of yield in ductile materials we derive von Mises or equivalent stress from the distortional energy density criterion. This criterion states that failure occurs when the energy of distortion reaches the same energy for yield/failure in uniaxial tension (or compression). The distortional strain energy is the energy associated with a change in the shape of a body. The calculated von Mises
90

Investigation of the Savonius‐type Magnus Wind Turbine ________________
stress is a combination of principal and yield stresses and it is expressed mathematically as:
( ) ( ) ([ ]213
232
221
2
21 σσσσσσσ −+−+−≥M )
Figure 90. Maximum values of principal and von Mises stresses on the rotating blade
Analysis confirms that the maximum values of the principal stresses and value of von Mises stress are located on the corner edges of the advancing blade (see Figure 90). Stress values are given in Pascal units with maximum value of the first principal stress
91

Investigation of the Savonius‐type Magnus Wind Turbine ________________
S1 = 66.7 Mpa, second one S2 = 27.3 MPa and third one S3 = 22 Mpa. Maximum equivalent stress value yields value of 46.2 Mpa. The principal stresses are ordered so that S1 is the most positive (tensile) and S3 is the most negative (compressive). This clearly proves sensitivity of this spot on tension stress in cases of inadequate contact strength between tip plates and the Savonius paddles. Numerous damaged cases and failures of high rotating Savonius blades in this study confirmed this analysis, since loosening of the bonded contact even before the destruction of the blade occurred on the spot shown by means of numerical analysis.
92

Investigation of the Savonius‐type Magnus Wind Turbine ________________
8. Future Investigations Regardless of the fact that the experimental analysis of the Savonius‐type Magnus wind turbine was performed, current study leaves open space for the possible model improvements and further investigations. Model improvement could include solution for problems such as an overstress of the adhesive bondage for wind speeds higher then 12 m/s and possible substitution of the materials or support structure in order to avoid the resonance due the low natural frequencies of the blades. Other solutions other then central shaft should be investigated as well, together with the possibility of bigger prototype investigations. Also Bach‐type blade should be given a special attention in terms that it beats the performance of the current configurations when properly manufactured. Itʹs performance at 4 m/s when the misbalance wasnʹt so distinguished showed quite promising behavior with strong intuition that it could possibly reach power efficiency over 0.1 for wind speeds higher then 10 m/s. In addition, choice of materials and delayed blade resonance for small wind speeds suggest the other significant advantages of this model. However production of the Bach blade is more complicated and more costly then exploitation of the PVC‐based Savonius rotor.
Figure 91. Bach‐type based Magnus rotor
Also lift and drag of the Savonius blades should be investigated for various wind speeds. Chauvin and Benghrib [8] suggest on basis of their investigations of aerodynamic coefficient of the OL = 0.43 Savonius rotor that for small values of tip speed ratio (λS < 0.25) lift coefficient is negative and drag is relatively constant in with slightly decreasing toward λS ≈ 1. Such analysis could be useful for possible build‐up of the blade element momentum theory for Magnus turbine.
93

Investigation of the Savonius‐type Magnus Wind Turbine ________________
9. Conclusions and Recommendations Current study showed that regardless of the small output power and efficiency, a Savonius based design is rather possible. Cheap manufacturing cost are what is the main advantage of this design together with itʹs obvious benefit as a small power generating system when compared with the classic Magnus wind turbines powered by the electro‐motors. Small, motor‐powered Magnus turbine wouldnʹt be able to generate the output power in a weak wind speed regimes. Other main disadvantages of the turbine are related to the low natural frequencies that are significantly influencing the power production and high stresses in a contact regions that are threatening to structural integrity of the mechanism. With improvements in material and the design of the blades such system could be implemented as a low‐cost battery charger or direct water pumping device for remote locations or Third‐world countries that are every day facing the drinking water problem. Utilization of other low‐cost components could make fully functional Magnus turbine design possible. A simple car alternators are representatives of cheap and highly reliable technologies that after minor modifications such as rewinding could be used as generators. Also, typical, largely available 12V car battery known for its slow discharge capabilities is an excellent choice as a storage facility of electrical power. Other advantage of car battery is that allows large number of charges and discharges which is highly suitable for wind energy purposes. Since the Savonius‐type Magnus wind turbine consists of the large number of rotational parts, special care should be taken on bearings that are used. Wind tunnel tests are not enough, not only in terms of natural turbulence and high load fluctuations, but also in terms of natural air‐pollution, dust and humidity that can significantly influence functioning of the turbine. Bearings should be additionally sealed and protected which might reduce blade rotor performance. Therefore, choice of the bearings for outdoor system should be driven by their durability and long life criteria. They should be able to work for at least couple of hundreds of hours since maintenance should be brought to a minimum. Main load criteria should include bending moments of the blades due the drag of the rotor in high speed regimes.
94

Investigation of the Savonius‐type Magnus Wind Turbine ________________
10. Bibliography [1] Akita Magnus Association Online Resource: www.akita21.com/magnus/
[2] Alternative Energy Online Resource: www.southcom.com.au/~windmill/
[3] ANSYS Release 9.0 Documentation and Tutorial, SAS IP, Inc., 2004.
[4] Bach, G. von, Untersuchen uber Savonius‐Rotoren und verwandte Stromungs maschinen, Forschung auf dem Gebiete des Ingenieurwesens, vol. 2, pages 218‐231, 1931.
[5] Blackwell, B., Sheldahl, R.E., Feltz L.V., Wind Tunnel Performance Data for Two‐ and Three‐Bucket Savonius Rotors, Sandia Laboratories, SAND76‐0131, 1977.
[6] Budgell, P., ANSYS Tips and ANSYS Tricks, Burlington, Ontario, CA, 1998, 1999.
[7] CFD Online Resource Network, Guidelines for Modeling Turbomachinery, http://www.cfd‐online.com/Wiki/Best_practise_ guidelines_for_turbomachinery_CFD
[8] Chauvin, A. and Benghrib, D., Drag and Lift Coefficients Evolution of a Savonius Rotor, Experiments in Fluids, vol. 8, pages 118‐120, 1989.
[9] Cochran, B.C., Banks, D., Taylor, S.J., A Three‐Tiered Approach for Designing and Evaluating Performance Characteristics of Novel WECS (Wind Energy Conversion Systems), AIAA‐2004‐1362 Paper, 2004.
[10] Encyclopedia of Alternative Energy & Sustainable Living, a resource of David Darling: www.daviddarling.info/encyclopedia/S/AE_Savonius_turbine.html
[11] Fernando, M.S.U.K. and Modi, V.J., A Numerical Analysis of the Unsteady Flow Past a Savonius Wind Turbine, Journal of Wind Engineering and Industrial Aerodynamics vol. 32, pages 303‐327, 1989.
[12] FLUENT 5 Tutorial Guide, Chapter 9, Turbulence Models, Fluent Inc., 1998.
[13] Fox, R.W. , McDonald, A.T, Pritchard, P.J, Introduction to Fluid Mechanics, John Wiley & Sons, Sixth edition, 2003.
[14] Fujisawa, N., Kawaji, Y. and Ikemoto, K., Feedback Control of Vortex Shedding from a Circular Cylinder by Rotational Oscillations, Journal of Fluids and Structures, vol. 15, pages 23‐37, 2001.
[15] Fujisawa, N., Shirai H., Experimental Investigation on the Unsteady Flow Field Around a Savonius Rotor at the Maximum Power Performance, Wind Engineering, vol. 11, Issue 4, pages 195‐206, 1987.
95

Investigation of the Savonius‐type Magnus Wind Turbine ________________
[16] Fujisawa, N., Velocity Measurements and Numerical Calculations of Flow Fields in and around Savonius Rotors, Journal of Wind Engineering and Industrial Aerodynamics vol. 59, pages 39‐50, 1996.
[17] Hansen, Martin O.L., Aerodynamics of Wind Turbines, James & James, London, UK, 2003.
[18] Hoerner, S.F., Borst, H.V., Fluid‐Dynamic Lift, Practical Information on Aerodynamic and Hydrodynamic Lift, Published by L.A. Hoerner, Second Edition, 1985.
[19] Ishimatsu, K., Kage, K. and Okubayashi, T., Simulation of the Flow Around Cross Flow Turbine With End Plates, Japan Society of Computational Fluid Dynamics, 14th JSCFD Symposium, C06‐2, 2006.
[20] Johnson, G.L., Wind Energy Systems, Prentice‐Hall, Electronic Edition, 2001.
[21] Kang, Sangmo and Choi, Haecheon, Laminar Flow Past a Rotating Circular Cylinder, Physics of Fluids, vol. 11, No. 11, pages 3312‐2231, November, 1999.
[22] Kozlov, V. and Bychkov, N., Magnus Wind Turbine, Experimental Results of the Model Testing, Institute of Theoretical and Applied Mechanics SB RAS, 2005.
[23] Menet, J.L., A Double‐step Savonius Rotor for Local Production of Electricity: A Design Study, Renewable Energy vol. 29, pages 1843‐1862, 2004.
[24] Menet, J.L., Bourabaa, N., Increase in the Savonius Rotor Efficiency via a Parametric Investigation, European Wind Energy Conference , Proceedings, London, 22‐24 November, 2004.
[25] Menet, J.L., Valdes, L.C., Menart, B., A Comparative Calculation of the Wind Turbines Capacities on a Basis of the L‐σ Criterion, Renewable Energy vol. 22, pages 491‐506, 2001.
[26] Mittal, S., Three‐Dimensional Instabilities in Flow Past a Rotating Cylinder, Journal of Applied Mechanics, vol. 71, pages 89‐95, January, 2004.
[27] Modi, V.J., Fernando, M.S.U.K., and Roth, N.J., Aerodynamics of the Savonius Rotor: Experiments and Analysis, Energy Conversion Engineering Conference, IECEC‐90 vol. 5, pages 213‐218, 1990.
[28] Rahai, H., Development of Optimum Design Configuration and Performance for Vertical Axis Wind Turbine, Feasibility Analysis and Final Energy Innovations, Small Grant Program Report, California State University, 2005.
96

Investigation of the Savonius‐type Magnus Wind Turbine ________________
[29] Reid, E.G., Tests of Rotating Cylinders, Langley Memorial Aeronautical Laboratory, NACA TN‐209 Report, December, 1924.
[30] Riegler, Hannes, HAWT versus VAWT, ROPATEC AG, Business Innovation Center, REFOCUS, July/August, 2003.
[31] Santos, Ferreira Ilmar, Vibrations in Rotating Machinery, Technical University of Denmark, Lecture Notes, 2005.
[32] Savonius, S.J., The Wing Rotor in Theory and Practice, Savonius Co, Finland, 1928.
[33] Sengupta, Tapan K. and Talla, Srikanth B., Robins‐Magnus Effect: A Continuing Saga, Current Science, vol. 86, No. 7, 10 April, 2004.
[34] Shikha, Bhatti, T.S. and Kothari, D.P., Early Development of Modern Vertical and Horizontal Axis Wind Turbines: A Review, Wind Engineering vol. 29, No.3, pages 287‐299, May 2005.
[35] Stojkovic, D., Breuer M. and Durst, F., Effect of High Rotation Rates on the Laminar Flow Around a Circular Cylinder, Physics of Fluids, vol. 14, No.9, September, 2002.
[36] Tang, T and Ingham D.B., A Numerical Investigation Into the Steady Flow Past a Rotating Cylinder at Low and Intermediate Reynolds Numbers, Journal of Computational Physics, vol. 87, No. 91, 1990.
[37] The Center for the Study of Technology and Society ‐ http://www.tecsoc.org
[38] Tokumaru, P.T. and Dimotakis, P.E., The Lift of a Cylinder Executing Rotary Motions in a Uniform Flow, Journal of Fluid Mechanics, vol. 255, pages 1‐10, 1993.
[39] Ushiyama, I. and Nagai, H., Optimum Design Configurations and Performance of Savonius Rotors, Wind Engineering vol. 12, No. 1, pages 59‐75, 1988.
97

Investigation of the Savonius‐type Magnus Wind Turbine ________________
Appendix A: List of Figures Figure 1. Inviscid irrotational flow past a cylinder a) zero rotation, b) subcritical rotation, c)
critical rotation, d) supercritical rotation ...................................................................................... 8
Figure 2. Computed wake behind the rotating cylinder for Re=100 and λ=1 [35] ......................... 9
Figure 3. Time histories of lift and drag coefficient for 2D and 3D flow for Re=200 and λ=5 [26]
............................................................................................................................................................ 10
Figure 4. Isosurfaces of the spanwise velocity for various AR of cylinder in the 3D flow for
Re=200 and λ=5 [26]......................................................................................................................... 11
Figure 5. Ship Buckau: rotating cyliders utilized to create Magnus propulsion force [37]. 9th of
May 1926, after sailing across Atlantic, ship entered New York harbor.............................. 12
Figure 6. Performance of the conventional wind conversion systems given as efficiency vs. tip
speed ratio [24]................................................................................................................................. 15
Figure 7. Various Savonius rotors: a) Chowchilla, California [2], b) EMAT Ltd, England
commercial model [10] ................................................................................................................... 16
Figure 8. Basic geometrical features of Savonius rotor..................................................................... 16
Figure 9. Tip plate effect on Savonius rotor performance [39] ......................................................... 17
Figure 10. Lift generating device on the wind turbines: a) airfoil, b) rotating cylinder, c)
Savonius rotor.................................................................................................................................. 18
Figure 11. Local velocities and forces on Savonius rotor................................................................... 20
Figure 12. Various rotor configurations: a) Bach, b) Benesh, c) Modi, d) Savonius OL=0.21, e)
Savonius OL=0.67............................................................................................................................ 24
Figure 13. Example of computational domain of the 2D flow around modeled rotors ............... 28
Figure 14. Meshing of the various rotor configurations: a) Bach, b) Benesh, c) Savonius OL=0.67,
d) Modi, e) Savonius OL=0.21....................................................................................................... 31
Figure 15. Boundary layer adequate grid on Bach type rotor wall .................................................. 31
Figure 16. Y+ distribution along the walls of various profiles for Re = 2.4 x 10⁴ : a) Bach, b)
Benesh, c) Modi, d) Savonius OL=0.67, e) Savonius OL=0.21 ................................................. 32
Figure 17. Modi‐Fernando profile with the pressure taps setup [27] .............................................. 36
Figure 18. Modi profile pressure distribution for φ=30° and Vwind =6m/s....................................... 36
98

Investigation of the Savonius‐type Magnus Wind Turbine ________________
Figure 19. Flowfield pressure distribution over the theoretical Modi profile for φ=30° and Vwind
=6m/s.................................................................................................................................................. 37
Figure 20. Static torque variation with flow angle for Modi profile............................................... 38
Figure 21. Static torque of various blade profiles as a function of flow angle.............................. 39
Figure 22. Computed vector flow‐field around Savonius OL=0.21 rotor; a) 0° ‐ vortex structures
inside both buckets, b) 16° ‐ pressure increase on the walls of the returning bucket, c) 32°
‐ central vortex structure outside of the bucket, with second vortex downwashed............ 40
Figure 23. Velocity plot around Savonius OL=0.21 rotor for φ=164°............................................... 41
Figure 24. Pressure plot around Bach‐type rotor for φ=143°............................................................. 42
Figure 25. Pressure plot around Bach‐type rotor for φ=161°............................................................. 42
Figure 26. Pressure distribution around Bach‐type rotor for φ=161° .............................................. 43
Figure 27. Prototype 01 isometric sketch with the cross‐section detail........................................... 47
Figure 28. Prototype 02 isometric sketch with the cross‐section detail........................................... 48
Figure 29. Prototype 03 isometric sketch with the cross‐section detail........................................... 49
Figure 30. Prototype 04 (Bach type blade) isometric sketch with the cross‐section detail .......... 50
Figure 31. Hub/blade connection for Savonius blade (left) and Bach blade (right)..................... 51
Figure 32. Sketch of the AIT 1.05x1.05m open‐circuit low speed wind tunnel ............................. 52
Figure 33. Opened 1.05x1.05m test section ........................................................................................... 53
Figure 34. Experimental apparatus ........................................................................................................ 53
Figure 35. Values of measurement azimuthal angles θblade ............................................................... 54
Figure 36. Three blades test set‐up ........................................................................................................ 55
Figure 37. Prototype 01 ‐ blade rotation as a function of the wind speed and azimuthal angle 56
Figure 38. Prototype 02 ‐ blade rotation as a function of the wind speed and azimuthal angle 57
Figure 39. Prototype 03 ‐ blade rotation as a function of the wind speed and azimuthal angle
(results from 3 blades).................................................................................................................... 58
Figure 40. Prototype 04 ‐ blade rotation as a function of the wind speed and azimuthal angle
(results from one blade)................................................................................................................. 59
Figure 41. RPM characteristic of tested prototypes ............................................................................ 60
Figure 42. Tip speed ratio of the blades as a function of the wind speed...................................... 60
Figure 43. Relation between blade and turbine rpm for idling case (2 blades). Marking points
on lines represent wind speeds of 4,6, 8 and 10 m/s ................................................................. 62
99

Investigation of the Savonius‐type Magnus Wind Turbine ________________
Figure 44. Power coefficient of the Prototype 03 model as a function of Magnus tip‐speed ratio
for 2 blades case............................................................................................................................... 64
Figure 45. Torque coefficient of the Prototype 03 model as a function of Magnus tip‐speed
ratio for 2 blades case ..................................................................................................................... 64
Figure 46. Power coefficient of the Prototype 03 model as a function of Magnus tip‐speed ratio
for 3 blades case............................................................................................................................... 65
Figure 47. Torque coefficient of the Prototype 03 model as a function of Magnus tip‐speed
ratio for 3 blades case ..................................................................................................................... 65
Figure 48. Power coefficient of the Prototype 03 model as a function of Magnus tip‐speed ratio
for 4 blades case............................................................................................................................... 66
Figure 49. Torque coefficient of the Prototype 03 model as a function of Magnus tip‐speed
ratio for 4 blades case ..................................................................................................................... 66
Figure 50. Power coefficient of the Prototype 03 model as a function of Magnus tip‐speed ratio
for 5 blades case............................................................................................................................... 67
Figure 51. Torque coefficient of the Prototype 03 model as a function of Magnus tip‐speed
ratio for 5 blades case ..................................................................................................................... 67
Figure 52. Comparison of power coefficients between prototypes 03 and 02 for 4 m/s case ...... 68
Figure 53. Comparison of torque coefficients between prototypes 03 and 02 for 4 m/s case...... 68
Figure 54. Comparison of power coefficients between prototypes 03 and 04 for 4 m/s case ...... 69
Figure 55. Comparison of torque coefficients between prototypes 03 and 04 for 4 m/s case...... 69
Figure 56. Comparison of power coefficients between prototypes 03 and 01 for 6 m/s case ...... 70
Figure 57. Comparison of torque coefficients between prototypes 03 and 01 for 6 m/s case...... 70
Figure 58. Comparison of power coefficients between prototypes 03 and 02 for 6 m/s case ...... 71
Figure 59. Comparison of torque coefficients between prototypes 03 and 02 for 6 m/s case...... 71
Figure 60. Comparison of power coefficients between prototypes 03 and 04 for 6 m/s case ...... 72
Figure 61. Comparison of torque coefficients between prototypes 03 and 04 for 6 m/s case...... 72
Figure 62. Comparison of power coefficients between prototypes 03 and 01 for 8 m/s case ...... 73
Figure 63. Comparison of torque coefficients between prototypes 03 and 01 for 8 m/s case...... 73
Figure 64. Comparison of power coefficients between prototypes 03 and 02 for 8 m/s case ...... 74
Figure 65. Comparison of torque coefficients between prototypes 03 and 02 for 8 m/s case...... 74
Figure 66. Comparison of power coefficients between prototypes 03 and 04 for 8 m/s case ...... 75
Figure 67. Comparison of torque coefficients between prototypes 03 and 04 for 8 m/s case...... 75
100

Investigation of the Savonius‐type Magnus Wind Turbine ________________
Figure 68. Comparison of power coefficients between prototypes 03 and 01 for 10 m/s case .... 76
Figure 69. Comparison of torque coefficients between prototypes 03 and 01 for 10 m/s case.... 76
Figure 70. Comparison of power coefficients between prototypes 03 and 02 for 10 m/s case .... 77
Figure 71. Comparison of torque coefficients between prototypes 03 and 02 for 10 m/s case.... 77
Figure 72. Comparison of power coefficients between prototypes 03 and 04 for 10 m/s case .... 78
Figure 73. Comparison of torque coefficients between prototypes 03 and 04 for 10 m/s case.... 78
Figure 74. Various cases of vibration influenced power performance ........................................... 80
Figure 75. Prototype 01 FEM model used for modal analysis .......................................................... 81
Figure 76. Prototype 02 FEM model used for modal analysis .......................................................... 81
Figure 77. Prototype 03 FEM model used for modal analysis .......................................................... 82
Figure 78. Prototype 04 FEM model used for modal analysis .......................................................... 82
Figure 79. Experimental readout of the 1st eigenmode for tested blades...................................... 84
Figure 80. Representation of the eigenmodes on rpm‐wind velocity plot for Prototype 03 ....... 84
Figure 81. First mode, f1st = 17.562 Hz ................................................................................................... 86
Figure 82. Second mode, f2nd = 17.637 Hz .............................................................................................. 86
Figure 83. Third mode, f3rd = 22.548 Hz.................................................................................................. 86
Figure 84. Fourth mode, f4th = 107.36 Hz Figure 85. Fifth mode, f5th = 111.65 Hz........................ 87
Figure 86. Sixth mode, f6th = 122.56 Hz................................................................................................... 87
Figure 87. Prototype 03 blade destroyed at 12 m/s due the centrifugal buckling ......................... 88
Figure 88. Deformation vector sum of the P03 blade for 3000RPM................................................. 89
Figure 89. Deformation of the blade and tip plates for P03 model ................................................. 90
Figure 90. Maximum values of principal and von Mises stresses on the rotating blade ............ 91
Figure 91. Bach‐type based Magnus rotor ............................................................................................ 93
101

Investigation of the Savonius‐type Magnus Wind Turbine ________________
Appendix B: List of Tables Table 1. Power requirements for running the cylinder at 500rpm .................................................. 19
Table 2. Values of constants for RNG turbulence model ................................................................. 27
Table 3. Grid parameters and termination criteria............................................................................. 29
Table 4. Number of iterations for various rotors and flow angles .................................................. 34
Table 5. Static torque results relative error.......................................................................................... 38
Table 6. Material decision matrix based on Savonius rotor research by Menet [23].................... 45
Table 7. Characteristics of tested blades .............................................................................................. 46
Table 8. Material properties.................................................................................................................... 46
Table 9. Mass properties of tested blades ............................................................................................ 51
Table 10. Magnus turbine shaft power for optimum values of tip speed ratio ............................ 79
Table 11. Natural frequencies using ANSYS FEM solver................................................................. 83
102