Embed Size (px)
Citation preview
Erasmus University Rotterdam
MSc in Maritime Economics and Logistics
2011/2012
The economic impact of Port of Giurgiulesti
development on the Republic of Moldova
by
Nicolae Potorac
Copyright © Nicolae Potorac

ii

iii
Acknowledgements
I am delighted to thank those who made the process of writing this thesis possible. I would like to express my deepest appreciation and gratitude to my supervisor Mr. Martijn van der Horst who led me all the way through the completion of this paper. I owe my most honest gratitude to my family who always supported me in any decisions I took and never doubted my abilities. They provided me with more than I have ever needed and always motivated me along every path I chose.
Last but not least, I would like to thank my dear friends Artiom, Alexander, Yusuf, Oguz, Uncle Jeff and Benson who made this year unforgettable. Special thanks to my good old friend Victor, who always came up with great advices and never hesitated to provide his help.

iv
v
Abstract
The quality and the cost of the transportation services have always been one of the
main determinants of economic growth. This is especially applicable for the maritime
transportation as it detains a large share of the global transported goods. The transport
infrastructure and the quality of it are seen as one of the main determinants of the
economic growth for a nation. The inadequacy or the transport infrastructure may lead
to high cost encountered by the shippers, and this in turn may have a depressing effect
for the economic development of a country by reducing the total trade. This is especially
applicable for developing countries which are trying to strengthen their economic
position. This paper will investigate the economic impact of the Port of Giurgiulesti on
the economy of the Republic of Moldova. The country has ambitious economic
development plans, and the Port of Giurgiulesti is one of the pillars supporting the
model of a prosperous development. The port, being established only five years ago
has a lot of operational issues. With the help of the Global Simulation Model, this paper
investigates the effect of reducing the bottlenecks present in the Port of Giurgiulesti on
the economy of the Republic of Moldova. In order to create an ample prospect several
scenarios have been run. By this it was possible to construct a comprehensive
framework which helped to determine the impact of the reduction in the level of the
bottlenecks on the performance of the Port of Giurgiulesti, as well as assessing its
contribution share to the state economy.

vi
vii
Table of Contents Acknowledgements ........................................................................................................................iii
Abstract .......................................................................................................................................... v
List of figures .................................................................................................................................. ix
List of tables ................................................................................................................................... xi
1. Introduction ........................................................................................................................... 1
1.1 Research question and research objectives ......................................................................... 3
1.2 Structure of the thesis and methodology overview ............................................................ 5
1.3 Overview of Moldova’s current economic situation ............................................................ 5
1.4 Moldavian Transport Sector ............................................................................................... 13
2. Economic Impact of Ports on Regional and National: a literature review ........................... 27
2.1 Early port impact Studies ................................................................................................... 27
2.2 Port Impact Studies using Input-Output models ............................................................... 29
2.3 Port Impact Studies using Equilibrium Models .................................................................. 30
2.4 The Global Simulation Model ............................................................................................. 32
2.5 Advantages of the Global Simulation Model and other equilibrium models .................... 33
3. Trade Restrictive Measures.................................................................................................. 35
3.1 Non-tariff barriers .............................................................................................................. 35
3.2 Port specific Bottlenecks .................................................................................................... 39
4. Methodology ........................................................................................................................ 45
4.1 The Global Simulation Model ............................................................................................. 45
4.2 Data Collection and Data Issues ......................................................................................... 48
5. Analysis of the results and Recommendation ...................................................................... 57
5.1 Baseline scenario ................................................................................................................ 57
5.2 Realistic Scenario ............................................................................................................... 58
5.3 Moderate Scenario ............................................................................................................. 58
5.4 Aspire Scenario ................................................................................................................... 59
5.5 Summary of the Results ..................................................................................................... 60
6. Conclusions .......................................................................................................................... 61
6.1 Regulatory and Managerial Recommendations ................................................................. 63
viii
6.2 Limitations and future direction of research ..................................................................... 64
Bibliography ................................................................................................................................. 67
Appendix ...................................................................................................................................... 71
Appendix 1: Trade figures under each scenario ...................................................................... 71
Appendix 2: Interviews ............................................................................................................ 73
ix
List of figures
Figure 1.1 Geographical position of Republic of Moldova ............................................................. 2
Figure 1.2 The interrelation between Trade Facilitation and Economic Development. ................ 3
Figure 1.3.1 Inflation in the medium term outlook ....................................................................... 7
Figure 1.4.1 Moldova Rail and Road network .............................................................................. 18
Figure 1.4.2 Port of Giurgiulesti ................................................................................................... 20
Figure 1.4.3 Transportation of goods by modes of transport ...................................................... 24
Figure 4.1 The Global Simulation Model ...................................................................................... 46

x
xi
List of tables
Table 1.3.2 Republic of Moldova major trading partners 2010 ................................................... 10
Table 1.3.3 Republic of Moldova Major trading partners 2000 ................................................... 11
Table 4.1 Data sources ................................................................................................................. 48
Table 4.2 Tariff rates* on the Industrial trade (2010,%)** .......................................................... 49
Table 4.3 Percentage of extra costs encountered by companies in their transportation process
due to bottlenecks. ...................................................................................................................... 50
Table 4.4.1 Initial tariff rates* on industrial trade(2010,%)** ..................................................... 52
Table 4.4.2 Restrictiveness of bottlenecks and NTMs* (2010, tarrificated,%)** ........................ 53
Table 4.4.3 New Restrictiveness Index* under 25% cut in the level of the bottlenecks** ......... 54
Table 4.4.4 New Restrictiveness Index* under 50% cut in the level of the bottlenecks** ......... 55
Table 4.4.5 New Restrictiveness Index* under the full elimination of the bottlenecks** .......... 55
Table 4.5 Summary and specifications of the scenarios ............................................................. 56
Table 5.1 Welfare decomposition under the Baseline Scenario (in 1000 USD) ........................... 57
Table 5.2 Welfare decomposition under the Realistic Scenario (in 1000 USD) ........................... 58
Table 5.3 Welfare decomposition under the Moderate Scenario in (1000 USD) ........................ 58
Table 5.4 Welfare decomposition under the Aspire Scenario ..................................................... 59
Table 5.5.1 Welfare decomposition under each scenario ........................................................... 60

xii
1
1. Introduction
After being inaugurated with a great deal of enthusiasm five years ago, the Port of Giurgiulesti did not fulfill the great expectations of the authorities and the investors, its true potential being unexploited to the full extent. It did not become the republics main gate of trade and the planned industrial production in the free economic zone surrounding the port is still an important issue on the agenda of the authorities. The main cause that stagnates the development of the port and the choice of it as a primary trade channel is a set of constraints that the companies encounter around this infrastructure node. The bottlenecks encountered around add a lot to the transportation cost of the imported and exported goods and influence the preference of the companies to choose other modes of transportation or use other ports of call in the Black Sea Region. Fiodor Iacovlenco, the director of the Moldavian leather articles factory “Zorile” and the president of the Industrial Association, which assures up to 25% of the total exports of the country, declared in his interview for Adevarul the following: “We would like to transport our goods through the Port of Giurgiulesti, however we need proper conditions for doing that, the road that connects the port and the capital is in a very poor condition, there are a lot of other bottlenecks that add up to our transportation costs, more than that the port logistics is not developed.” Also, he mentioned that the firms are in need of faster and more efficient transportation and customs services as they can last for days. As a result, the main problem of the Port of Giurgiulesti is the fact that it is not regarded as a primary gate of import/export. The reluctance of the companies to use this channel for shipping their goods stems in the extra costs generated by the bottlenecks around the port, which significantly adds to their costs.
Although, both the authorities and the port operators are constantly working on improving the situation, there is no study available to the general public that would indicate what is the actual economic impact of the port on the general welfare of the country. Moreover, although the issue of the existence of bottlenecks around the port is well known, there is no study that would indicate what would be the net welfare effect of eliminating the bottlenecks. The quality and the cost of the transportation services are one of the main determinants of economic growth. This is especially applicable to the maritime transportation as the vast majority of the goods are transported by sea. The transport infrastructure and the quality of it is seen as one of the main determinants of the economic growth for a nation. The inadequacy or the transport infrastructure may lead to high cost encountered by the shippers, and this in turn may have a depressing effect for the economic development of a country by reducing the total trade. Greater transport costs can also lead to lower levels of foreign investment, a lower savings ratio, abridged exports of services, impose barriers for technological and knowledge development, and reduced employment rate (Radelet and Sachs, 1998).In this sense there is also econometric evidence that proves that during the first wave of globalization declining transportation costs played an important role in the rapid economic growth worldwide (Estevade-ordal, Frantz, and Taylor, 2003).
2
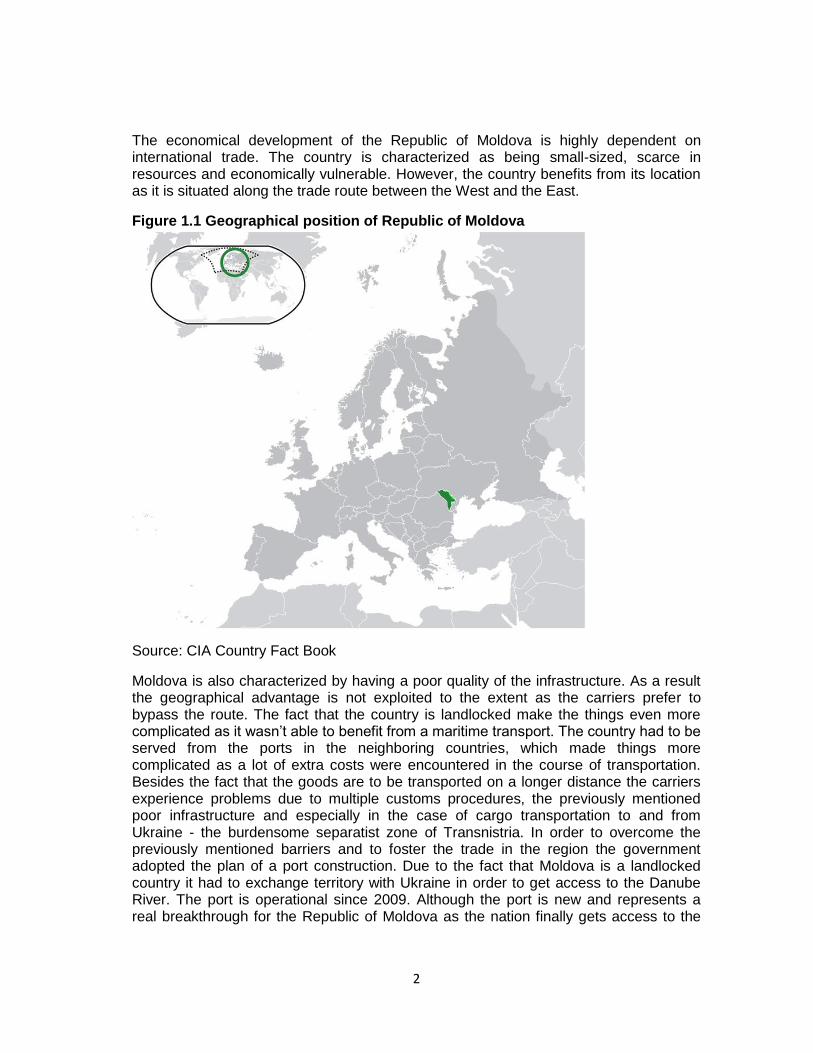
The economical development of the Republic of Moldova is highly dependent on international trade. The country is characterized as being small-sized, scarce in resources and economically vulnerable. However, the country benefits from its location as it is situated along the trade route between the West and the East.
Figure 1.1 Geographical position of Republic of Moldova
Source: CIA Country Fact Book
Moldova is also characterized by having a poor quality of the infrastructure. As a result the geographical advantage is not exploited to the extent as the carriers prefer to bypass the route. The fact that the country is landlocked make the things even more complicated as it wasn‟t able to benefit from a maritime transport. The country had to be served from the ports in the neighboring countries, which made things more complicated as a lot of extra costs were encountered in the course of transportation. Besides the fact that the goods are to be transported on a longer distance the carriers experience problems due to multiple customs procedures, the previously mentioned poor infrastructure and especially in the case of cargo transportation to and from Ukraine - the burdensome separatist zone of Transnistria. In order to overcome the previously mentioned barriers and to foster the trade in the region the government adopted the plan of a port construction. Due to the fact that Moldova is a landlocked country it had to exchange territory with Ukraine in order to get access to the Danube River. The port is operational since 2009. Although the port is new and represents a real breakthrough for the Republic of Moldova as the nation finally gets access to the
3
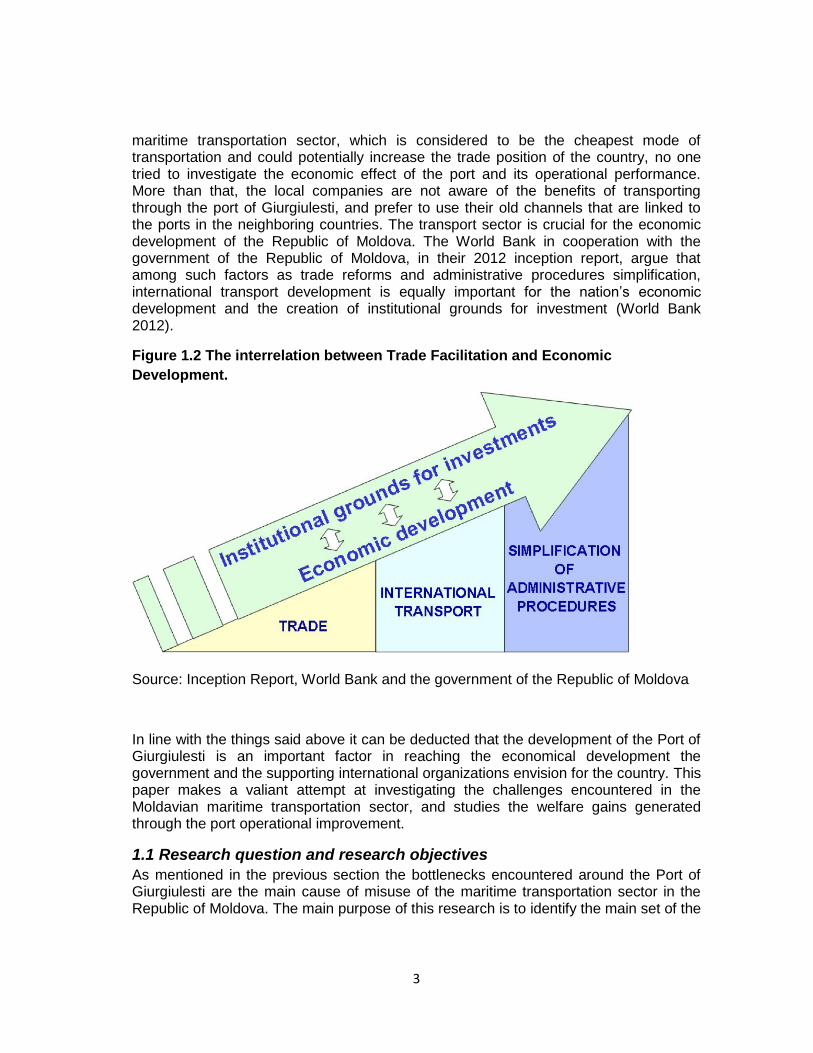
maritime transportation sector, which is considered to be the cheapest mode of transportation and could potentially increase the trade position of the country, no one tried to investigate the economic effect of the port and its operational performance. More than that, the local companies are not aware of the benefits of transporting through the port of Giurgiulesti, and prefer to use their old channels that are linked to the ports in the neighboring countries. The transport sector is crucial for the economic development of the Republic of Moldova. The World Bank in cooperation with the government of the Republic of Moldova, in their 2012 inception report, argue that among such factors as trade reforms and administrative procedures simplification, international transport development is equally important for the nation‟s economic development and the creation of institutional grounds for investment (World Bank 2012).
Figure 1.2 The interrelation between Trade Facilitation and Economic
Development.
Source: Inception Report, World Bank and the government of the Republic of Moldova
In line with the things said above it can be deducted that the development of the Port of Giurgiulesti is an important factor in reaching the economical development the government and the supporting international organizations envision for the country. This paper makes a valiant attempt at investigating the challenges encountered in the Moldavian maritime transportation sector, and studies the welfare gains generated through the port operational improvement.
1.1 Research question and research objectives
As mentioned in the previous section the bottlenecks encountered around the Port of Giurgiulesti are the main cause of misuse of the maritime transportation sector in the Republic of Moldova. The main purpose of this research is to identify the main set of the
4
bottlenecks and investigate the economic impact created as a result of removing the bottlenecks in the port of Giurgiulesti and the port related infrastructure.
The research question of this study will therefore be:
What will be the economic impact of addressing the bottlenecks in the port of Giurgiulesti and the related infrastructure in terms of welfare gains?
In order to provide an answer to the main question the following sub-questions will be investigated:
1. What are the current economic situation and the main characteristics of the transport sector of the Republic of Moldova?
o What is the current economic situation in terms of: international trade, main trading partners and future economic outlook?
o What are the main characteristics of the Moldavian transport sector according to the type of transportation?
2. How to measure the economic effects of ports?
o What is the best methodology to be employed in order to analyze the net welfare effect of the bottlenecks?
3. What are the trade restrictive measures encountered by the port users?
o What are the specific Moldavian Non-tariff Measures? And how are they to be quantified?
o What are the transportation bottlenecks encountered in the Port of Giurgiulesti?
o What are the main bottlenecks and to what extent they impede trade?
4. What is the potential result of reducing the bottlenecks in terms of welfare gains?
o What scenarios should be employed in order to find the suitable reduction level?
The ongoing discussion about port infrastructure and development is not a simple illustration of the positive or negative impacts on the national welfare; on the contrary it has to serve as a policy proving ground for the authorities. A port impact study has to highlight the future directions of the research as well provide an illustration of what policies to be implemented at a certain point of time. As the port of Giurgiulesti did not receive that much research attention it is believed that this paper will put the foundation of the future research and by illustrating the benefits of port operational improvement will draw the attention to the need of policy implementation.
5
1.2 Structure of the thesis and methodology overview
The basis o this thesis will be a combination of qualitative and quantitative research, where primary data concerning the bottlenecks and their quantification will be derived from interviews with port customers, and in the later chapters will be combined with secondary macroeconomic data. However, first of all an introduction will be made to the Moldavian economic overview as well as analyzing the Moldavia‟s transport sector with an emphasis on the maritime industry. The role of this chapter is to identify what are Moldova‟s main trading partners, the current economic situation, as well as providing an overview into the transport sector. Following the introductory chapters the paper will continue with a literature overview of the previous works on the topic of port impacts, and will identify the best methodology to be employed in order to assess the economic impact of reducing the bottlenecks in the Port of Giurgiulesti. After that, the paper will give an analysis of the two main components of the model: Moldova‟s Non-Tariff Measures and the bottlenecks. An overview will be made regarding the NTM‟s that are encountered in the process of trade with Republic of Moldova. More than that, this chapter will indicate how the NTM‟s are quantified. The bottlenecks chapter will provide an overview of the challenges that are encountered by the port users. Based on the interviews with the port users the bottlenecks will be first identified and then quantified. The methodology chapter will introduce the Global Simulation Model, specifying the advantages of using a partial equilibrium model and introduce the data sources required for performing the model. Furthermore the methodology chapter will introduce the four scenarios that will be used in studying the welfare impact generated by different levels of reduction in the bottlenecks encountered in the process of transportation through the port of Giurgiulesti, as well as explaining the assumptions and motivations behind every scenario. Right after the methodology has been defined, the paper will continue with the results section. The results will be presented in monetary terms of consumer surplus, producer surplus, tariff revenues or losses and net welfare in general. The research will conclude with an overview of the study, will provide future research directions, possible recommendations will be presented, as well as indicating what were the main limitations during the research process.
1.3 Overview of Moldova’s current economic situation
Historically, the political and economical situation of the republic of Moldova has been influences by its neighboring countries as well as the occupational precedents that were quite a common thing in the South-East region. Moldova is a land locked country in the Black Sea region bordering Romania on the western side and Ukraine in the North-East. Moldova is currently rated as the poorest country in Europe and until a couple of years ago was among the few nations in the world that were governed by a communist regime. The communist government was preceded by a period of political unrest and turmoil, as for three straight years the political parties could not decide on a common president. Quite recent the political chaos ended and a common president was finally elected. The first significant change in the economical orientation for the nation occurred when it declared independence from the Soviet Union in 1991. The transition from a planned economy to a market system was characterized by a couple of definitive stages. The first step for an economic development was the liberalization of trade,
6
prices and the enterprises. The second stage involved the privatization of previously state owned enterprises, the introduction of a new and stable currency (Leu) as well as establishing a national security market. All along the development path international organizations like the World Bank and the International Monetary Fund we providing all the critical help and support in achieving the economic goals. The republic has seen a serious economic growth up until 1995, when the reforms effect was diminishing. The things got worse when the currency crisis struck in 1998, which had a devastating effect on the Moldavian economy as the land privatization slowed and the government instantly surrendered to external debt. Only two years later the crisis ameliorated and the economy finally began to recover. The 2001 elections provided the government with a stronger reform-oriented mandate, which facilitated a more coherent and reform-oriented economic policy (Bodewig 2007). The Republic of Moldova's economic growth is primarily consumption-driven; therefore investment rates are characterized by a slow growth.
Overview of Moldova’s main economic indicators
The global crisis had a major effect on the nation‟s economy contracting the GDP by 6%. In the same time the amount of investments and remittances decreased by about 30% on average. Also, as a result of the global economic recession a sharp reduction in external financing was encountered, creating a severe financing gap.
In 2010, the IMF agreed to provide financial assistance of approximately USD 560 million (EUR 420 million), spread over three years. More than that 90 million EUR of EU macro-financial assistance supplemented this. In 2010 the Moldovan economy began to recover (EUROPEAN COMMISSION 2011). As a result of this financial aid the Real GDP grew by 6.9%, together with private consumption and investment, which started to rise again. A stable recovery was noticed as well on the sectorial base, as the performance of the agricultural, industrial and service sectors improved.
Exports rebounded strongly but were outpaced by imports, meaning that the persistently high trade balance expanded by about 2% of GDP. The increase was offset by a rise in remittances and labor income and the current account deficit decreased slightly from 8.5 %of GDP in 2009 to 8,3% of GDP in 2010. Foreign direct investment inflows are estimated to have risen to 3.5% of GDP from 2.3% % in 2009 (European Commission 2011).
Being supported by bilateral and multilateral assistance the nation increased its official reserves as well as increasing the long-term external borrowing. IMF played and still plays an important role for the nation by supporting the macro-economic stability and by monitoring the government‟s reform agenda.
7
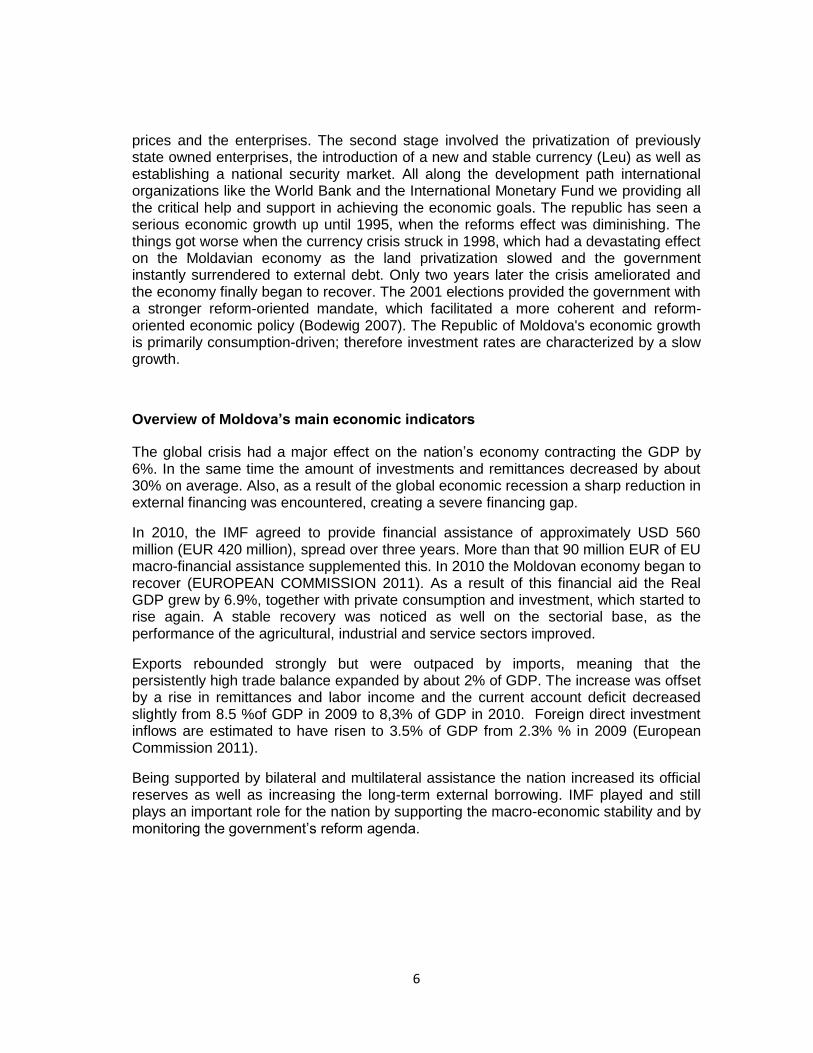
Figure 1.3.1 Inflation in the medium term outlook
Source: Country Intelligence Report
As a result of a sudden decrease through 2009, inflation edged up again through 2010, while credit and domestic demand remained subdued. In particular, inflation was driven up by increases in food prices and energy tariffs, the depreciation of the leu, and higher excise rates. The Consumer Price Index rose to 7.41% in 2010 (period average). In response to mounting inflationary pressures, the National Bank of Moldova (NBM) reversed the trend of monetary easing by raising the base-lending rate twice in the first quarter of 2010, up to 7% and further to 8% in January 2011. The National Bank of Moldova (NBM) adopted a more explicit policy of inflation targeting, with a target of 5% ±1,5 percentage point for the end of 2012. The NBM‟s policies have started to be gauged in quarterly Monetary Policy Reports, the first of which was published in February 2010 (European Commission 2011).
The main focus of the authorities is to provide macroeconomic stability and financial consolidation, and in doing so they place a strong focus on the monetary policy. In 2010 the country‟s deficit was reduced to 2.5% of the GDP, compared to the previous year‟s 6.3%. The main drivers for such a reduction were: regulatory increase in taxation contributing to a substantial growth in the revenue, cuts in general public services and reduced debt servicing costs. The budget of the country was augmented also by increases in the VAT levels for gas, higher excise duties on luxury cars, alcoholic beverages, tobacco products and perfumes.
Substantial emigration (close to 400 000 Moldovans were estimated to be working abroad in November 2004) has resulted in a strong and growing influx of worker‟s remittances – four times and a half since 2001. According to official NBM statistics, the overall level in 2005 is estimated at US$ 900 million, which represents close to 30% of Moldovan GDP. Remittances are therefore a key feature of economic development and
8
social life and have contributed directly to diminishing poverty. Remittances are also a major revenue item in Moldova‟s current account; their growth compensates – and makes possible – huge trade deficits run by Moldova. Moldova‟s imports are now more than double its exports and the trade deficit was close to 40% of GDP in 2005. Understandably, economic growth and public finances are at the same time highly vulnerable due to their heavy reliance on remittances to cut trade deficits (Emerging Markets monitor 2006). The number of emigrants started growing exponentially since the ascension of Romania to European Union, as a very large part of the population is in the possession of a Romanian passport. As a result, remittances are, and will remain a major source of income for the national budget. The influx of foreign exchange helps stoking the domestic demand.
The Republic of Moldova's economic challenges are rooted both in internal and international factors. International organizations like WTO and NATO rate Moldova‟s economy as small and open. As a result, the country is highly vulnerable to external shocks; one of the most illustrative examples is the 1998 Russian currency crisis. The economical situation in the country had to suffer from a lack of political consensus as well as the fact that the short term oriented coalitions often failed to produce and implement concrete and coherent structural reforms. Most difficult in this sense is to choose the right partnership orientation, as it is possesses a double edge sword type of problem. By choosing to cooperate with EU, the country automatically ceases the option of close cooperation with the Russian Federation. The Republic of Moldova, however, is now seeking a closer partnership with the EU and the West in general and as a result is complicating its relations with Russia, which has supported it politically, economically and financially. The republic of Moldova is also known for its “frozen conflict” with Transnistria, which is separatist conflicting zone. The main issue with the conflict zone is that most of the heavy industry centers of the Republic of Moldova were historically situated on the territory of Transnistria, plus the fact that shippers of goods are trying to avoid the zone when importing or exporting due to the fact that they are exposed to double customs check that significantly adds to their transportation costs.
Economic structure: Key sectors and trade partners
Agriculture:
Agriculture represents the most vital sector in the Moldovan economy, and the country remains highly reliant on the size of its yearly crop. The dependence on agriculture however is diminishing as the share of agriculture in nominal gross value added has gradually declined in recent years. After peaking at 29% in 2000, it had fallen to 10% in 2009 before rising back to 14% the following year (Country Intelligence Report 2012). The wine industry, together with the tobacco industry is a key source of the total export revenue. Before 1991 Moldova played an important role in the provision on the Soviet Union with agricultural products, the nation produced around 40% of the annual tobacco harvest of the entire Union. The Chisinau Tobacco factory has an annual capacity of 9.1 billion cigarettes. Not regarding the previous strong position in CIS, the Moldavian tobacco industry is now in an urgent need of restructuring. Moldova is also known as a
9
leading producer of grapes and rose oil. Other important crops include wheat, maize, vegetables (tomatoes, potatoes), sugar beets, and fruit. In addition, pig raising and milk production are significant livelihoods (Republic of Moldova Chamber of Commerce an Industry).
Wine and Spirits:
Throughout the time Moldova was widely renowned for its wines. Wine is still a major source of export income for Moldova, and has also attracted comparatively large amounts of foreign investment. Moldova grows as many as 500–600 types of grapes. Most are French grapes, such as Cabernet Sauvignon, Malbec, and Pinot, however, there are also some local varieties, such as Rkacitely and Victoria. Although Moldova exports wine to many Asian and Western markets, Russia has been by far the largest consumer of Moldovan wine, mainly due to the fact that the Moldavian wines are known to the Russian consumers, as well a the fact that they were present on the market since the Soviet Union. Moldova also produces significant quantities of brandy and liqueurs. Moldova's production of wine and spirits has dropped substantially since 2005, influenced by Russia's temporary ban on imports. Wine producers have been under further pressure since July 2010, as Russia renewed its wine import ban. In 2010, alcohol accounted for 11% of Moldovan exports (Country Intelligence Report 2012).
Food processing:
Food processing is the largest industrial branch of the republic, and, despite the poor performance it demonstrated in the recent years it still accounted for about 40% of the total industrial output of the country. Main export goods from this category are: fruits and vegetables, dairy products, sugar and frozen juices.
Textiles and clothing: After food products, textiles and clothing rank as another of Moldova‟s largest manufacturing branches, accounting for about 10% of total industrial production in 2010(Country Intelligence Report 2012). Important Moldovan products in this category include knitwear and carpets. The competitiveness of the branch is mainly characterized by highly skilled labor who‟s wages are by far lower than the European levels.
Republic of Moldova main trade partners
Moldova‟s export base is characterized by a relatively thin margin, both in terms of
products and markets. The country, in comparison to the other neighbors, did not
demonstrate a success in reorienting its trade flows from the former Soviet Union, and
more precisely from Russia. However, Moldova has made some progress in reorienting
since 2005, main reason being partly due to the impact of Russia's 2006 blockade
against Moldovan wine, which contributed to a severe decrease in the percentage of
exports for both the food sector and for Russia. Before the Russian ban, the Republic of
10
Moldova's main export partners were the Russian Federation (39%), the EU (26.7%),
Romania (11.4%), Ukraine (7.1%) and Belarus (5.2%). The EU accounts for 36% of
imports, Ukraine (22%), the Russian Federation (13%), Romania (7%) and Belarus
(3.6%) (UNCTAD statistics 2004). There has been a certain redirection of trade. In
2006, for example, the Russian Federation was still the leading importer of Moldovan
goods (17.3%), followed by Romania (14.8%), Italy (12.2%), Ukraine (12.2%) and
Germany (7%). The Republic of Moldova imported goods from Ukraine (19.2%), the
Russian Federation (15.5%), Romania (12.8%), Germany (8%) and Italy (7.3%). With
Romania's accession to the EU in January 2007, the EU as a whole became the
Republic of Moldova's main trading partner with a share of 56.1% of exports, and 44.4%
of imports, as opposed to 31.7% of exports and 39% of imports from the CIS
(Economist Intelligence Unit).
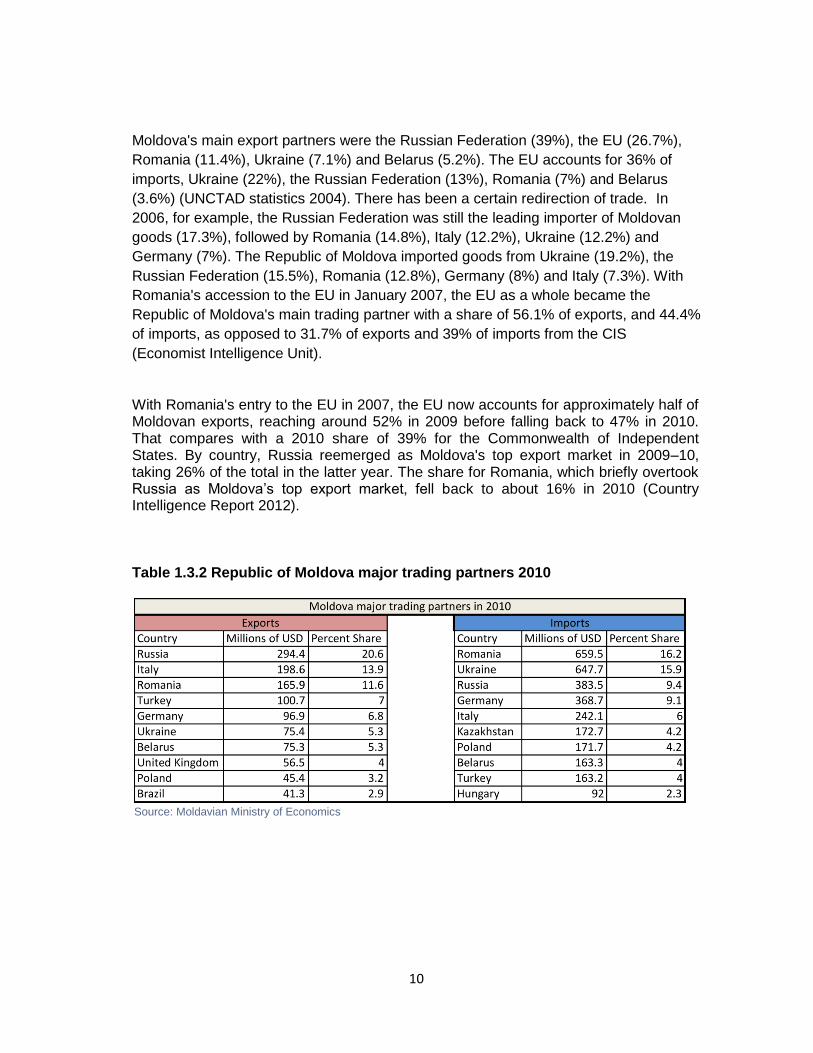
With Romania's entry to the EU in 2007, the EU now accounts for approximately half of Moldovan exports, reaching around 52% in 2009 before falling back to 47% in 2010. That compares with a 2010 share of 39% for the Commonwealth of Independent States. By country, Russia reemerged as Moldova's top export market in 2009–10, taking 26% of the total in the latter year. The share for Romania, which briefly overtook Russia as Moldova‟s top export market, fell back to about 16% in 2010 (Country Intelligence Report 2012).
Table 1.3.2 Republic of Moldova major trading partners 2010
Source: Moldavian Ministry of Economics
11
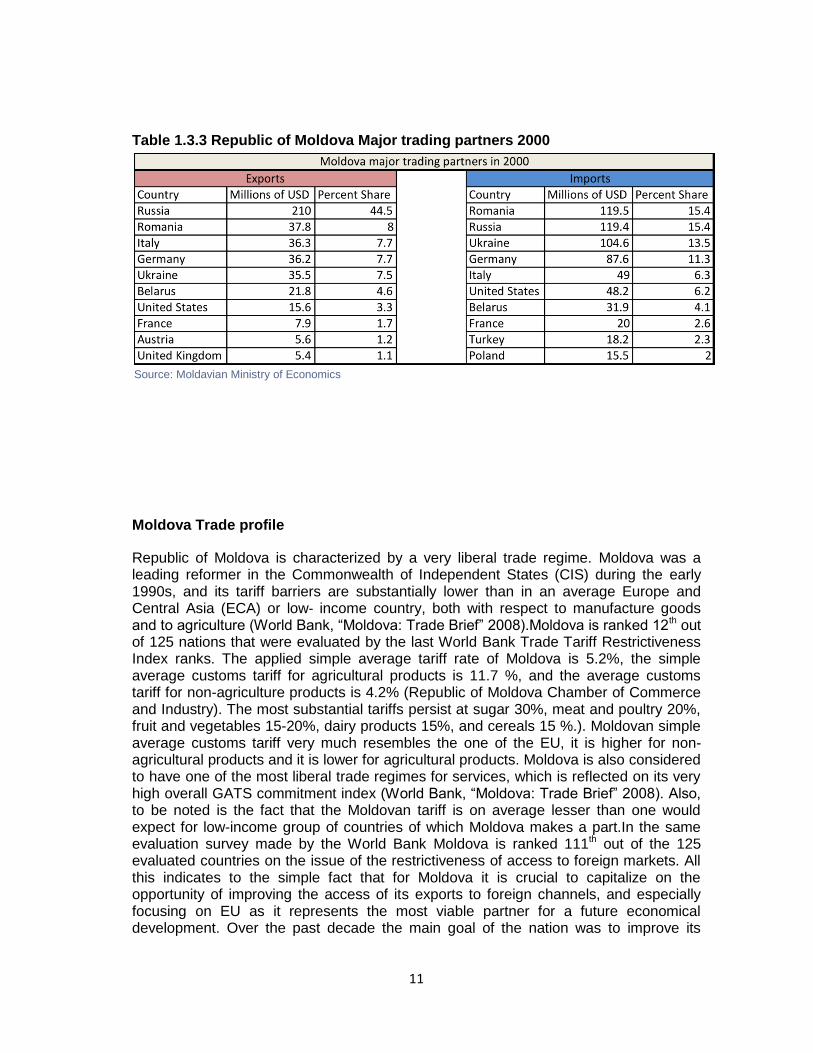
Table 1.3.3 Republic of Moldova Major trading partners 2000
Source: Moldavian Ministry of Economics
Moldova Trade profile
Republic of Moldova is characterized by a very liberal trade regime. Moldova was a leading reformer in the Commonwealth of Independent States (CIS) during the early 1990s, and its tariff barriers are substantially lower than in an average Europe and Central Asia (ECA) or low‐ income country, both with respect to manufacture goods and to agriculture (World Bank, “Moldova: Trade Brief” 2008).Moldova is ranked 12th out of 125 nations that were evaluated by the last World Bank Trade Tariff Restrictiveness Index ranks. The applied simple average tariff rate of Moldova is 5.2%, the simple average customs tariff for agricultural products is 11.7 %, and the average customs tariff for non-agriculture products is 4.2% (Republic of Moldova Chamber of Commerce and Industry). The most substantial tariffs persist at sugar 30%, meat and poultry 20%, fruit and vegetables 15-20%, dairy products 15%, and cereals 15 %.). Moldovan simple average customs tariff very much resembles the one of the EU, it is higher for non-agricultural products and it is lower for agricultural products. Moldova is also considered to have one of the most liberal trade regimes for services, which is reflected on its very high overall GATS commitment index (World Bank, “Moldova: Trade Brief” 2008). Also, to be noted is the fact that the Moldovan tariff is on average lesser than one would expect for low-income group of countries of which Moldova makes a part.In the same evaluation survey made by the World Bank Moldova is ranked 111th out of the 125 evaluated countries on the issue of the restrictiveness of access to foreign markets. All this indicates to the simple fact that for Moldova it is crucial to capitalize on the opportunity of improving the access of its exports to foreign channels, and especially focusing on EU as it represents the most viable partner for a future economical development. Over the past decade the main goal of the nation was to improve its
12
negative trade balance by means of promoting its national exports and not by import substitution. In order to achieve this goal Moldova has made all the efforts to keep its markets open for trade partners, as well as liberalizing its trade regimes so that it can improve the export capacity, and in the same time focus on the production of high-end products.
At the moment Moldova has concluded bilateral Free Trade Agreements with 9 countries of the Commonwealth of the Independent States (CIS): Armenia, Azerbaijan, Belarus, Kazakhstan, Kyrgyzstan, Russia, Turkmenistan, Ukraine and Uzbekistan. Moldova also had trade agreements with Romanian and Bulgaria, which were dismantled in the wake of two countries‟ EU accession. It has to be mentioned that despite abolishing the free trade agreements with these two countries, Moldovan exports to these destinations kept growing rapidly in 2007-2008 (Expert Group 2008).
Moldova is also part of multilateral Central European Free Trade Agreement (CEFTA- 2) and including Albania, Bosnia and Herzegovina, Croatia, Macedonia, Serbia and Montenegro. By 2004 Moldova managed to sign bilateral free trade agreements under the Stability Pact initiative with 7 countries: Bosnia and Herzegovina, Albania, Croatia, Macedonia, Serbia and Montenegro, Bulgaria and Romania. By December 2006 the previous bilateral FTAs in the South-eastern Europe were integrated into a single regional initiative, a new CEFTA. In June 2007 Moldova has joined the Memorandum of Understanding for Liberalization and Facilitation of Trade in Southeast Europe. Presently Moldova is active part of the ongoing process of establishing the free trade area of CEFTA scheduled to end by 2010 (Expert Group 2008).
Moldova is also a member of the GUAM Agreement on Establishment of Free Trade Area signed in 2002 between Georgia, Ukraine, Azerbaijan and Moldova. The main purpose of the agreement is to reduce the limitations in mutual trade, mainly eliminating the customs duties and other taxes having equivalent effect. Although there has been a close cooperation on various aspects among the members of the signed agreement, the members did not succeed in establishing a free trade agreement, main reason for that being the divergences in the political orientation.
Right after the collapse of the Soviet Union, the former soviet states started an initiative of creating an economic unit. The first multilateral trade agreement was signed in 1994 between Azerbaijan, Armenia, Belarus, Georgia, Moldova, Kazakhstan, Russia, Ukraine, Uzbekistan, Tajikistan and Kyrgyzstan. The purpose of this signatory agreement was to prepare all the countries in creating an economic unit. For most of the members it represented a preparatory stage, where they had to gradually reduce the customs duties, taxes and other barriers that could impede the trade among these nations. Although it represented a great initiative at that time, it never came into force mainly due to the fact that Russia being an aspirational trade partner for most of the countries that signed the agreement jeopardized the process of integration by not ratifying the agreement.
Although Moldova is making an effort of maintaining and improving its trade relationships with the Commonwealth Independent States, its main trade policy focus is on the European Union. In 1999 Moldova gained the Generalized System of Preferences benefits from EU.
13
The Republic of Moldova has been a beneficiary of the EU Generalized System of Preferences (GSP) since July 1st, 1999. Under this regime the Moldovan exports to EU enjoyed partial or total exemption from customs tariffs and this treatment does not stand solely for EU, but for Norway, Switzerland and United States. In 2006 the EU extended Moldova‟s GSP to a new scheme GSP+, implying the fact that it now includes a wider scope of products than under the previous scheme. At the moment Moldova benefits of Autonomous Trade Preferences arranged one-sidedly by UE starting 1st March 2008, in accordance with the EC Regulation no.55 from 21.01.2008, revisions to the EC Regulation no.980/2005 and the Decision no. 2005/924 of the Commission (Republic of Moldova Chamber of commerce and Industry).Under the new regime Moldova‟s exports also benefit from a tariff preferential treatment from Norway, Switzerland, Turkey, Japan and United States.
The import tariff policy of Moldova is in accordance with its WTO tariff commitments; in particular the MFN applied rates shall not exceed the bounded tariffs listed in the WTO Schedule CLI – Moldova (WTO/ACC/MOL/37/Add.1). As mentioned before, the Moldovan customs tariff is very low by any international standards. More than 50% of the tariff lines are free of any customs duty. Presently there are 3 types of applied customs duties: ad valorem, non-ad valorem/specific and combined rates, with the general trend being to move to more ad-valorem tariffs (Expert Group 2008). Moldova applies destination principle of value added taxation, meaning that it does not discriminate between the locally produced goods and the imported ones, as they are both subjects to VAT (Value-added Tax).
1.4 Moldavian Transport Sector
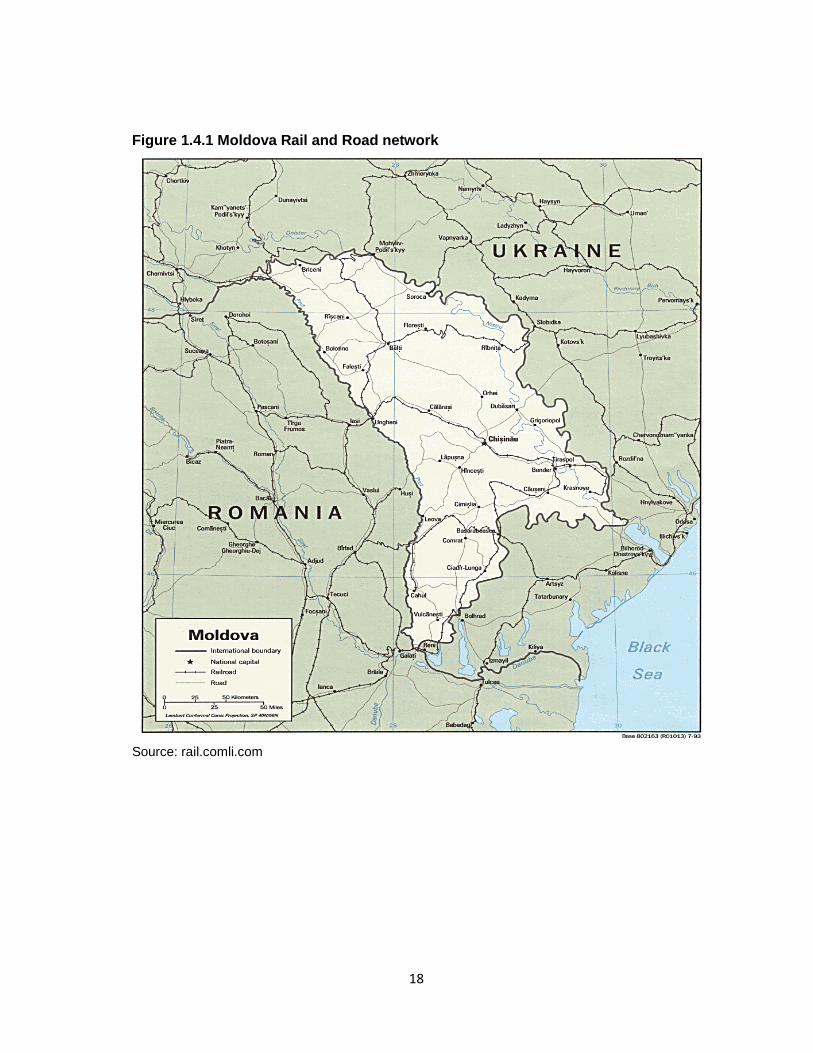
The Republic of Moldova is situated in the Eastern Europe, surrounded by Romania and Ukraine, and this is believed to be of a great importance as it represents a gateway between the CIS countries and Western Europe. Moldova also represents an important link in the Pan European Corridor IX, namely Moscow-Kiev-Bucharest. The trade corridor crosses the country from East to West, passing through the capital city Chisinau. Also, a special spotlight felt over the country when Romania joined the European Union as it now represents a bordering state with the economic union. In line with these developments the Republic of Moldova has a great potential of establishing itself as a transport hub for the region.
However, since the country gained independence it was not able to fulfill its transport potential and did not make use of its favorable geographical situation, main reason for that being the poor transport infrastructure. The main goal of both the Government‟s Interim Poverty Reduction Strategy and the Bank‟s Country Assistance Strategy is sustainable economic growth. The foundation of this pillar can only be a sound and solid infrastructure. While infrastructure and in particular transport cannot claim to be a cost-effective policy instrument for the redistribution of welfare to the poor, it reduces absolute poverty mainly by increasing economic efficiency-by lowering costs and prices and enhancing opportunities (World Bank 2002). Efficiency improvements in the
14
transport infrastructure can create a comparative advantage for a country‟s trade and economic performance in general. More than that, scarce resources can be freed up, and this, in turn will lead to improvement of the traditional sectors, as they will become more competitive. In support of this argument is Roberts (2002) who distinguishes five principles of partnership between economics and transportation. Firstly, the author argues that in order to spur the economic development infrastructure is a crucial factor, especially for a country in the course of development. Secondly, the costs encountered by the economical entities are determined by the access to the infrastructure and its location. In addition to that, the author argues that the same type of infrastructure can be used for different purposes and can serve different communities (For example: cargo and passenger transport) and therefore generate efficiency. Fourth, there is constant need of monitoring the status of the transport infrastructure. Only in this way industrial and commercial needs can be met. Lastly, the author argues that infrastructure investments should have a long-term outlook, as it is a cycle procedure. The last issue mentioned, is of a great importance as in the case of the Republic of Moldova recently built roads are not maintained in the course until they quality becomes alerting.
As mentioned in the economic overview section, after the independence, there was a steep decline in the economic activity as a result of not being a part of the Soviet Union anymore, a not having a primary market for exports. In line with the economical developments the demand for transportation declined as well, with no signs of financing and management of the transportation sector. As a result, the existing infrastructure was poorly maintained, as well as the fact that there were no projects to add new infrastructure that would meet the changing trade patterns. Due to all the factors mentioned above transport infrastructure became a serious impediment for expanding trade. Although many efforts are made at improving the transport infrastructure, this is still a major concern for the Moldavian authorities as well as for the International Institutions that are looking forward for the development of the country.
Agriculture, as mentioned before, is the aorta of the Moldavian economy and exports. The sector has to suffer a lot from the fact that a solid transport infrastructure is missing. The farmers are highly reliant on it, and therefore it is a huge impediment for them to gain competitive advantage. As a result, the main goal of the country‟s Agriculture Strategy is to improve market access for farmers, thus increasing their competitiveness.
This section of the paper is going to provide a short overview of the Moldavian transport sector with an emphasis on the maritime transport as the road and rail transport are not in the focus of this research.
Railway Transport
The railway transport currently holds the lion‟s share in the transport of goods. The current operational length of the Moldavian network is 1004 km long, including industrial branch lines. It consists of 866 km single line and 138 km double line tracks which are connecting to the major transport links in Romania and Ukraine. However the transportation to Ukraine is difficult as most of the train routes pass through the
15
separatist region of Transnistria whose customs bodies often create troubles for the transportation of the freight. There are almost no electrified fields at the moment, thus all the trains are operating on fuel, except a recently introduced passenger track that connects central and northern parts of the country. At the moment there are 159 operational stations serving both the commercial and the passenger needs.
The operator of the railway system is the state owned company CFM (CaileFerate Moldova or English: Moldavian Railways). Due to the economical difficulties that the country was facing after it gained the independence CFM went on the path of bankruptcy. In 1999 both the Government Authorities and the operator felt the need of a restructuring process that would adapt the Moldavian railways to the economic conditions at that time. The main goal of the restructuring plan was to help CFM transition from the “production” strategy which was persistent at that time to a “market” strategy. All along the restructuring plan creation and implementation CFM was assisted by NEI Consortium (NEI B.V., DE-Consult, ARRC, VTT), and the entire initiative was financed by the EU under TACIS (World Bank, 2002.Moldova: Transport Strategy). The restructuring process was supposed to be implemented according to the following phases:
Phase 1: (short term 1999-2000). The main goal of this stage was to split passenger and freight services into self-contained business units, eliminate the cross-subsidies between units, merger structural units, close the non-profitable lines, improve performance and reduce the costs to the minimum allowed. Also, during this stage a special body of control was created by the government, who would closely monitor the implementation of the process.
Phase 2: (medium term). During this phase a special emphasis had to be placed on the acknowledgement of competition, gaining a degree of freedom from subsidies and further focus on commercialization.
Phase 3: Completion of the restructuring process and privatization.
The restructuring process was quite a success as CFM starting being profitable and improved a lot the state of the railways. Based on the results of 2001 Moldova was named the best freight carrier of the Central and Eastern Europe by the European Transport Forum.
Although the restructuring plan represented a giant leap, there are still many things to be improved in order to achieve the European level. The main drawback of the plan is the fact that it concentrates on technical matters while disregarding the critical questions of reorganization and financial recovery. Also, one of the main problems is the issue the lack of Moldovan maintenance and repair enterprises that would provide services and spare parts for the carriages and locomotives. As a result these have to be imported from Russia or Ukraine, and this in turn results in volatile inventory of spare parts. Another issue of this sector is the fact that Moldova falls behind on the ratio of the density of the railways per country‟s are. On this chapter the indicators pretty much resemble the ones from South-East Europe, but falls far behind the level of the Central and Western counterparties (Expert Group 2008).
16
Road Transport Industry
The Moldavian road network expands on a length of 16800 kilometers. Both on the kilometers per 1000 population and kilometers per square kilometers of territory ratios, Moldova falls far behind the same indicators of the neighboring countries. Nevertheless, Moldavian road system connects the vast majority of the settlements. The strategic design of the highways is considered to be fair with the exception of some highways that were build during the soviet era, that were built for strategic and military purposes rather than economic purposes. The share of the highways in the entire road system is of 30%, while the remaining 70% are rural and regional roads. Moldova, compare to the other countries in the region perform performs badly on the chapter of the quality and standards of the road. The main reason for that being lack of funds for investment in the infrastructure as well as corruption. The low investment rate in the infrastructure over the period of 1990 to 2007 lead to a massive deterioration of road transport networks. A 2007 Constraint Analysis performed by the consulting company Expert Group indicates that about 90% of the Moldavian roads, according to the European standards, are considered to be in an emergency condition. The unavailability of country‟s own funds for maintenance of the roads leads to a further deterioration of the road transport system. Moldova‟s own available resources do not cover the annual investment needs, it allows only a partial maintenance, which is not enough to enhance the competitive advantage of the local firms and become a regional transportation hub.
The funds allocated for the development and maintenance of the Moldavia road networks in 2004 – 2007 amounted around USD 30 million (Moldavian Transport and Infrastructure Ministry).The amount suffices only to maintain the quality of some selected national roads, and not that much with regards to local ones, which play an important role for the development of the economy. In order to better illustrate the situation a comparison will be made with Romania. For example, Romania obtained a subsidy via the European Union structural funds for the rehabilitation of the national road in value of 4 billions of Euros, funds which will be used in the construction of 1300 kilometers of new highways until 2013. This amount represents up to 8-10% of the country‟s GDP, a quite characteristic indicator for the region. Meanwhile, Moldova has an infrastructure investment rate of less than 3%, which significantly lower than the one in the region. This lead to the fact that in the period of 1998 to 2005 Moldova constructed only 85 kilometers of new highways (Expert Group 2007).
In line with the facts stated above, a conclusion can be drawn of the issue that Moldova is in a need to overcome the financing problem, a lot of hope is placed on the international donor organizations like the World Bank and other bilateral partners like EU. This issue has to be addressed in a quick fashion as the unavailability of the funds leads to a further deterioration of the roads. If there are no funds available for the investment in the infrastructure Moldova bears the risk of further being overlooked as a transport corridor, as well as diminish the development of the agricultural sector.
A 2002 Social Assessment Survey conducted by the World Bank indicated that the second most important impediment for the development of the agricultural industry is
17
the condition of the roads. Farmers from the Central and Southern parts of the country are not able to commercialize a large share of their merchandize due to the inability to access the wholesalers in a short timeframe. A huge problem is the transportation of the goods on rural roads during the rainy season; this often leads to total isolation for the period.
The World Bank identifies the following issues that are faced by the transportation companies in addition to poor quality of the roads: 1. the limited number of permits made available for transiting neighboring countries; 2. the difficulties to obtain permits for triangular routes (origin and destination in foreign countries); 3.the complex and costly procedures for access to the road transport market, with licenses that have to be renewed annually; 4.unwarranted licensing requirements for national transport, trailers and semi trailers; and 5.the inadequate road infrastructure (World Bank, 2002.Moldova: Transport Strategy).
18
Figure 1.4.1 Moldova Rail and Road network
Source: rail.comli.com
19
Maritime transport sector
Port of Giurgiulesti
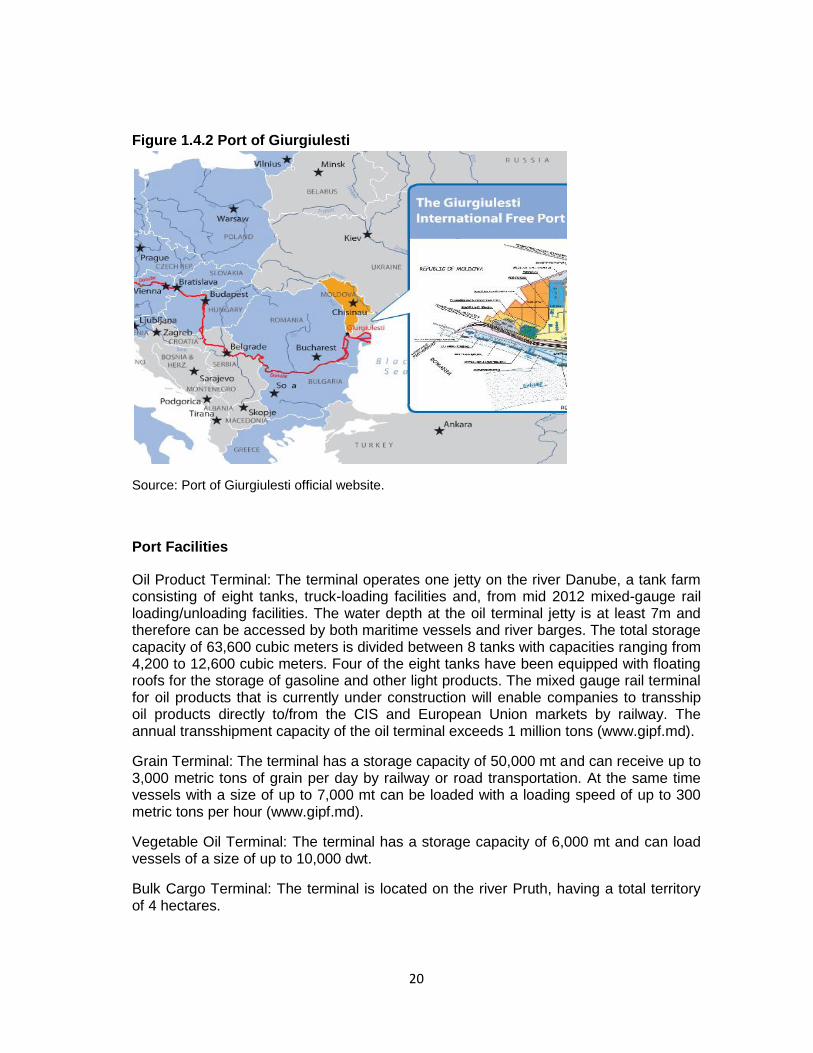
As mentioned in the previous sections Moldova is a landlocked country. Up until a couple of years the maritime/fluvial transport had a very small share of the total transport of goods, namely less than 1%. This was influenced mainly by the fact that the water transport was possible only on two rivers, Nistru and Prut, which naturally have a small draught. As a result of geographical limitations encountered on the inland waterways the shippers disregard this method of transportation. In line with the economical development strategy, the Moldavian authorities understood the need and the importance of developing the maritime transport sector. As a result the Moldavian government decided to build a port that would service the local economy as well as the neighboring regions, the plan of the port construction was adopted in 2001. Due to the landlocked status of the country the authorities decided to construct the port on the Danube River. However, at that moment, the country did not have any access to the Danube River either. The access to the river cost the authorities a lot of trouble as the country had to cease a piece of territory to Ukraine. The process involved a lot of political and economical issues as a national road passed through the ceased territory The land on which the port is situated is owned and leased by the government for a period of 30 years to the Danube Logistics SRL, a Moldavian limited liability company who is also the main investor in the Port of Giurgiulesti. Danube Logistics‟ shareholders are the Dutch company Danube Logistics Holding BV and the European Bank for Reconstruction and Development. Proximity to Moldova‟s borders with Ukraine and Romania gives the port a strategic advantage. It is the only port in Moldova, which has the capacity to adapt sea-going vessels as it has a natural draught of 7 meters. Another advantage of the port is its access to EU and CIS road, rail, river and sea, thus having the great potential of becoming a logistics hub on the national level, as well as for the Black Sea region in general.
20
Figure 1.4.2 Port of Giurgiulesti
Source: Port of Giurgiulesti official website.
Port Facilities
Oil Product Terminal: The terminal operates one jetty on the river Danube, a tank farm consisting of eight tanks, truck-loading facilities and, from mid 2012 mixed-gauge rail loading/unloading facilities. The water depth at the oil terminal jetty is at least 7m and therefore can be accessed by both maritime vessels and river barges. The total storage capacity of 63,600 cubic meters is divided between 8 tanks with capacities ranging from 4,200 to 12,600 cubic meters. Four of the eight tanks have been equipped with floating roofs for the storage of gasoline and other light products. The mixed gauge rail terminal for oil products that is currently under construction will enable companies to transship oil products directly to/from the CIS and European Union markets by railway. The annual transshipment capacity of the oil terminal exceeds 1 million tons (www.gipf.md).
Grain Terminal: The terminal has a storage capacity of 50,000 mt and can receive up to 3,000 metric tons of grain per day by railway or road transportation. At the same time vessels with a size of up to 7,000 mt can be loaded with a loading speed of up to 300 metric tons per hour (www.gipf.md).
Vegetable Oil Terminal: The terminal has a storage capacity of 6,000 mt and can load vessels of a size of up to 10,000 dwt.
Bulk Cargo Terminal: The terminal is located on the river Pruth, having a total territory of 4 hectares.
21
Container and General Cargo Terminal: The container terminal is relatively new; it had started its operations in the beginning of 2012. The Container and General Cargo Terminal is operated by Danube Logistics. The terminal‟s open storage area of about 2 hectares is directly connected to the railway and has a total of 48 plug-in points for reefer containers. The equipment of the terminal consists of a 70-ton Sennebogen mobile harbor crane, a Kalmar reachstacker and two forklifts. The minimum water depth at the terminal is 5meters (www.gipf.md).
RORO Terminal: This terminal is not yet operating yet as the construction of it is expected to end in the third quarter of 2012.
Mixed-Gauge Rail Terminal: Being Moldova‟s first privately held mixed-gauge rail terminal, the facility will allow transport of goods by railway directly from/to Moldova, CIS and EU countries. The new rail terminal is planned to be completed in the third quarter of 2012 and will be able to transship liquid as well as dry cargo, including containerized cargo (www.gipf.md).
Initial Economic Impact
Giurgiulesti Free Economic and Trade Zone
In response to the slow economical growth, the Republic of Moldova has intensified efforts to attract investment to its Giurgiulesti Free Economic and Trade Zone. While this effort to promote the zone represents an important start, the zone clearly has a long way to go before it will be able to attract the type of investment envisioned by its supporters. Lack of infrastructure among other factors appears to be a severe hurdle to the development of the zone.
The need to create a Free Economic Zone in the Cahul County was addressed repeatedly at various local, national and international events. Thus the action plan to achieve socio-economic development program of the county Cahul for 2001-2005 approved by the County Council decision of 21.09.2000 nr.04/02-1 was expected to create free economic zone "Giurgiulesti" with the sub Cahul city. Need to consider opportunity to create a free economic zone within the industrial area of town Cahul was mentioned in the Government Decision nr.1021 of 28.09.2001 "On some measures of socio-economic recovery of County Cahul". Also creating a free economic zone at Giurgiulesti is one of the priority projects of the Euroregion Council "Lower Danube" of which Cahul County Council is a Member.
Comparative analyses of socio-economic indicators showed that the Cahul is among the underdeveloped counties in Moldova (Business Consulting Institute). This was conditioned by the economic downturn as well as the transition period after the Republic of Moldova gained independence from the Soviet Union. Other factors that influenced the stagnation of the region were: the agricultural specialization of the county, as well as the lack of appreciation of the geographical opportunities. The region
22
did not take advantage of being situated in the proximity of strong industrial centers of Romania (Galati) and Ukraine (Odessa-Reni) and the accessibility to the road and inland waterways infrastructure of these. Not to be disregarded is the fact that these industrial centers have a strong maritime base and play an important role in the Black Sea region.
In accordance with the development strategy adopted by the County Council of Cahul main directions of development were: the urbanization of Cahul County, as well as the development of the industrial potential based mainly on processing of local raw materials and agricultural development. That would allow export of fresh or frozen agricultural products. The main markets for this production are the European Union and CIS countries. Also, according to the strategic direction of development of the county, the launch of industrial production based on modern technologies characterized by high profitability and export destination was considered. However, In order to achieve this goal an investment in the infrastructure is required.
In order to develop the mentioned above branches (Industrial and Agricultural production) as well as reaching the goal of urbanization it is necessary to create a favorable investment climate in order to attract foreign capital. Free economic zones offer and constitute elements of local and national economic development as well as the stimulation of foreign direct investment (Pillai 2008). Free access of goods with preferential tax and customs regime are favorable conditions to attract domestic and foreign capital for industrial and infrastructure development, accompanied with the promotion of international trade.
The creation and establishment of the free economic zone "Giurgiulesti" contributed not only to recovery of local industrial enterprises, creation new jobs, but also contributed to the achievement of strategic investment projects of national interest, which will be a driving force for economic activation of the Republic of Moldova in South-Eastern Europe.
Establishment and kind of goals
The primary purposes of creating a free economic zone "Giurgiulesti" was to accelerate social and economic development and creation of a Cahul County transport hub, ensuring Moldova's trade links by river and sea with the countries of the Black Sea and the Danube. Basic goals will be achieved by only creating favorable conditions for attracting foreign and domestic investments aimed at:
• Resuscitation and technological modernization of existing enterprises, their orientation to produce high quality goods and competitive new foreign markets;
• Launch of new production, which are mainly export-oriented;
• Development of a multipurpose port and a railway freight stations;
23
• Creation and development of industrial and agricultural production;
• Increasing the export potential of local and national and foreign collections;
• Increase the number of jobs.
To achieve the goals and given the functional orientation in the free economic zone "Giurgiulesti", the authorities assure that the following type of activities are held and constantly gaining a vast amount of attention:
• Manufacture of industrial goods for export and import substitution;
• Port services;
• Shipping and rail services;
• Services for transshipment of cargo from ships to rail and vice versa;
• Insurance services for vessels registered in the area, passengers and cargo;
• Export-import operations, including storage, preservation, packaging, marking and other similar activities
• Water supply services and sewerage, electricity, natural gas, telecommunications and other support activities necessary for the activity in the free zone.
From the organizational point of view the Giurgiulesti FEZ is divided in two subzones Sub “Giurgiulesti and Sub “Cahul Industrial Park. Sub "Giurgiulesti" has mainly a functional orientation on storage, processing, transit and transportation of goods. In sub "Cahul Industrial Park" firms are mainly oriented on the production of goods for export. Although there is an organizational division among the units, and the fact that they are situated at a distance of 50 km, the subzones are maintaining close cooperation activities under the principles of all opportunity, flexibility, consistency and efficiency.
Economic and Social impact of establishing the area.
Economic and financial analysis of the functioning and development of free economic zone "Giurgiulesti" shows that income in the area will cover capital investments and operating costs, providing substantial profits for the residents of the area. The initial study in 2001 showed that the project will attract foreign and domestic investments worth 349.5 million dollars, which will lead to increased exports to over 80 million dollar annual increase budget revenues at all levels by an average of 10 million dollars (Business Consulting Institute 2001).
Number of employees working within the International Port, as of 10.01.2011 grew to 303 people, compared with 222 people as of 01/10/2010. Most employees were registered in the ICS "Danube Logistics" SRL (103 persons).Salary amount calculated
24
for the reporting period of 2011 was estimated at approximately 835.000 US dollars, with an average monthly wage of 540 US dollars (Ministry of Economics).
Total volume of investments in International Port for the entire period of its activity, as of October 1, 2011, was about. U.S. $ 51.4 million, of which 9 months 2011 have been invested approx. 4.4 million dollars. Investor General, ICS "Danube Logistics" Ltd, has invested U.S. $ 43.8 million, and SC "Trans Cargo Terminal" Ltd, which carried grain terminal construction and operation invested 7.2 million US dollars. Another 0.4 million U.S. dollars have been invested by the company ICS "Bulk Trans Logistics" LLC (Ministry of Economics).
From January to September 2011 within the International Port oil terminal 50,300 tons of oil production were imported, this is 1.2 times more than during January-September 2010. The general operator and investor reported that port services provided were of a value 1.2 million US dollars, which is roughly the same as in the previous year. Since the grain terminal started its operations in July 2009, 151.200 tons of grains were exported and 117.700 tones imported. The 2011 profit of the grain terminal, mainly derived from grain storage activities, were of 700.000 US dollars. The port also plays an important role in the replenishment of the national budget as
in late September 2011 residents have paid various taxes worth 10 million US dollar, by 47.3% more than the corresponding level in 2010, including 7 million excise, 450.000for customs procedures, 1.65 million and 225.000 VAT breakdown in the social insurance fund.
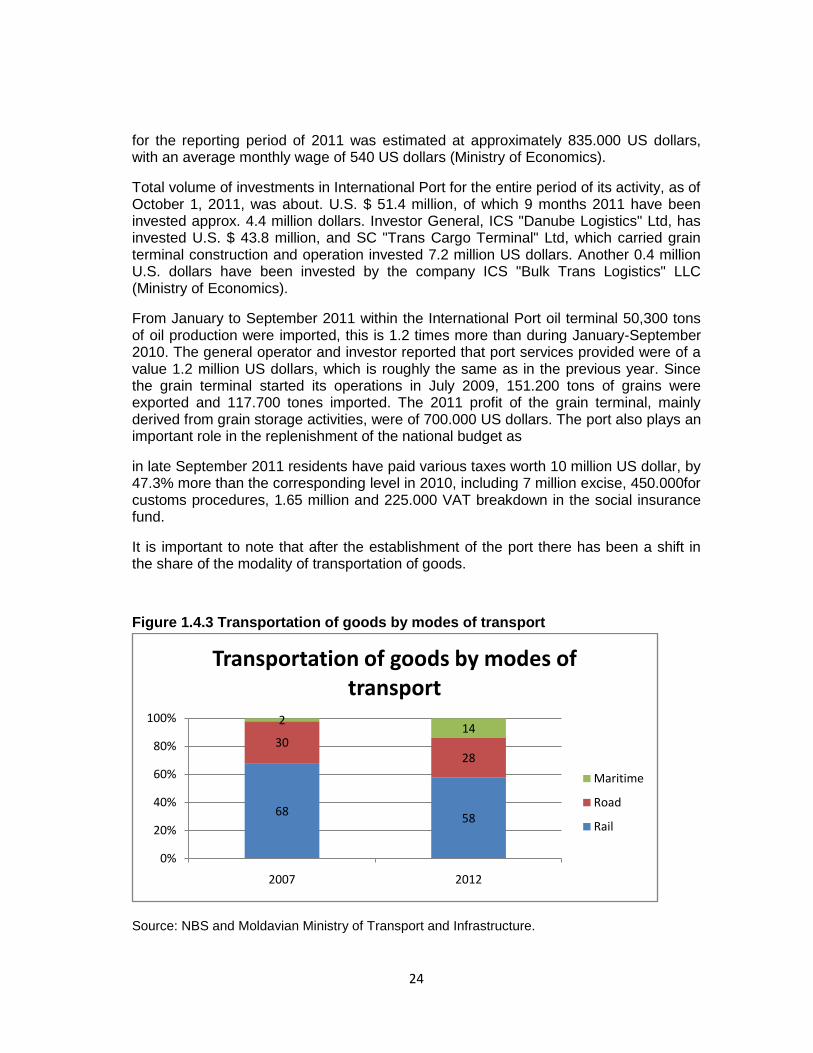
It is important to note that after the establishment of the port there has been a shift in the share of the modality of transportation of goods.
Figure 1.4.3 Transportation of goods by modes of transport
Source: NBS and Moldavian Ministry of Transport and Infrastructure.
6858
3028
214
0%
20%
40%
60%
80%
100%
2007 2012
Transportation of goods by modes of transport
Maritime
Road
Rail
25
Although there is a significant improvement for the maritime transport sector, it still lacks behind the other two modalities of transportation. Road and Rail transportation are still the most proffered methods of transport, main reason for that is the already established networks as well as the habit of the companies who are involved in trade across borders. However, as presented in the graph this is still a significant increase taking into account that the port is operating since 2009. Such a significant growth is mainly determined by the fact that the port operates facilities like the oil and grain terminal, which detain a significant share of the total Moldavian imports and exports.
Moldova‟s percentage of goods transported by sea is significantly lower compared to its European counterparts. For instance 34.7% of goods are transported by means of sea in Netherlands. The share of goods transported is influenced by a couple of factors. First, the port is relatively new and a lot of companies are not aware of the benefits of using this channel.
Secondly, companies are reluctant to switch from their established channels of transportation until they see a clear benefit in using something else. Lastly, due to the fact that the port is new and lacks some experience the shippers encounter a lot of barriers that hinders their operational competitiveness. The bottlenecks encountered around the port will be discussed in the later chapter as well as some possible solutions for their elimination.

26
27
2. Economic Impact of Ports on Regional and National: a literature
review
The main purpose of this section is to illustrate the previous work performed in order to
assess the economic impacts of ports on a region, and to identify what is the best
methodology to be employed in order to assess the economic impact of improving the
port performance, and most specifically removing the bottlenecks present around the
Port of Giurgiulesti. An economic impact study is aimed at analyzing the outcome in
terms of economic welfare of a specific project or a policy in a certain region. In the
case of this research the impact of the port of Giurgiulesti on the economy of the
Republic of Moldova is studied. The main purpose of an economic impact study is to
analyze whether there is a shift in the economic activity of the region as a result of new
project establishment. The results of such a study are most often presented in terms of
volume, output, revenue, costs, social benefits, employment and welfare in general.
Ports are not different in this aspect as the result of their economic impact studies can
be used for future providing future implications for the decision makers. An economic
analysis usually shows both positive and negative economic implications. Economic
impacts of a port can be classified in two categories: direct impacts and indirect
impacts. The direct impact studies mainly with the assessment of all port related sectors
and contingencies, as their welfare is directly related to the performance of the port.
The direct impacts also include the percentage share costs spared by the shippers and
the transportation companies as a result of choosing to execute the option of
transporting the cargo through the port. The transportation costs are considered in the
research context of the port economical impact due to the importance they play in the
decision making process of the port users. The indirect impact port studies are mainly
concerned of analyzing the expenditures caused by the direct impact activities.
2.1 Early port impact Studies
The academic research on the topic of port economic impact started long time ago,
approximately in the same time frame as the apparition of the containers. Anderson
(1964) was among the first scholars who studied the economic impact of a port on the
base of the port of Ensenada. The economic measures employed for the purpose of
this study were employment and wage. The economic effect was studied across the
following activities generated around the port: cargo handling, security, port
management, land transportation from the port, port construction and port related
industries. The main drawback of this specific research is the fact that the author did not
mention the motivation behind the selection of the specified criteria.
A different approach was taken in the analysis of the economic impact of the ports in
the Mississippi state (port of Warren, Adams and Washington). First of all the authors
compared the ports financial indicators to the other counties in the Mississippi region
and found no significant difference. The second step of the research was to analyze the
inbound and outbound cargo flows. It was discovered that the outbound cargo flows
28
were significantly higher than the inbound volume. As a result it was concluded that the
region was a self-sufficient one, the ports being responsive for this positive
development. After concluding this fact, the authors investigate what is the influence on
the economic sectors that are highly dependent on the port, and more precisely what is
the perfect industrial mix around the port. No evidence was found on this issue as the
industrial mix around the ports varied greatly (Armenakis et al. 1970). What is especially
interesting is the fact that Mississippi states and its port system was quite often used for
economic impact research. Conn et al (1966) investigated the impact of over-sea and
inland water transportation on the economy of the state. As a research sample the
authors took under consideration the firms in the region that benefit from water
transportation. Again, in order to estimate the impact they employed such measures as
wage payments, tax payments and employment. More than that, the study included the
activities of the water transportation in the state of Mississippi. In order to identify the
direct wage impact the employment figures were multiplied with overall wage figures.
As a result it was estimated that the government budget was refilled with 4.7 cents from
every dollar earned in terms of the wages paid out by the firms depending on the port
activity. This study also estimates the benefits generated by the port in terms of
transportation costs saved by the shippers. The savings are estimated only in terms of
goods transported on inland waterways. The costs savings were calculated on the basis
of comparing the barge transportation costs to rail transportation costs. After the cost
transportation costs were investigated, their impact on the real income in the state was
studied. It was estimated that the government receives 30 to 60 percent of the
transportation cost savings for imports or from transportation inside the state as an
increase in the real income.
Carew (1974) performed an analysis of the economic effects generated by the port of
Stockton on the Stockton economy. The author measured the impacts in terms of
overhead costs encountered by the companies and the wage payments distributed by
them. The scope of their study was extended on the port authority and the port tenants
only. An estimation was made on the total number of employees, this figure was then
multiplied to the average personal income in the Stockton region. The impact of the port
was calculated by assuming that 60% percent of the wage payments are coming from
thetenants expenditures and the other 40% are coming from the overhead costs. The
two figures were then compared and the difference represented the impact on the
region.
As time passed the maritime industry progressed a lot, and so did the research focus
towards the economic impact of ports. If in the studies presented before where
analyzing the welfare gains in simple terms, such as employment, government tax
revenue and wages distributed. With the rising complexity of the maritime industry the
scholars felt the need of further investigating this topic at a more detailed level. It was a
29
clear fact that a port does not only influence a region by increasing the welfare of the
directly related contingencies, but also has a direct effect on the unrelated parties.
Most of the time economic impact of the port sector is measured at an aggregate level
by indicators such as value added, employment and investment. Coppens et al. 2007
have made the effort to delineate the economic importance of a port for the regional as
well as for the national economy at a disaggregate level on the example of the port of
Antwerp. The research attempts to recognize, quantify and locate the mutual
relationships between the various port players themselves and between them and other
Belgian industries. The study included a sector analysis made by compiling a regional
input-output table, resorting to microeconomic data: a bottom-up approach. In order to
perform the research the main customers and suppliers of the port's key players or
stakeholders are identified. A geographical analysis can also be carried out by using
data at a disaggregate level. Each customer or supplier can be located by means of
their postcode. In so doing, the economic impact of the port is quantified, both
functionally and geographically. In the case of the port of Antwerp, the results show
important links between freight forwarders and agents. The geographical analysis
suggests the existence of major agglomerating effects in and around the port of
Antwerp, referred to as a major transshipment location point (Coppens et al 2007).
2.2 Port Impact Studies using Input-Output models
Over the years the methodology of port economic impact analysis has improved to the
extent that the academic research on this topic started employing partial and general
equilibrium models. The employment of the scientific literature for the evaluation of the
impact the ports have on economical development is very commonly referred as port
impact studies (PIS). The purpose of the port impact studies is to quantify the extent of
economic impacts in terms of added value created and employment generated and
distributed by the port. More than that, the port impact studies represent a solid basis
for investigating the port development and introduce significant arguments as to what is
the real importance of the port sector to the national economy from a macroeconomic
perspective. The port impact studies are often related to and supported in the process
of the investigation by general equilibrium models and Input-Output models (I-O).
Among the most prominent port impact studies are Warf and Cox (1989), Moon (1995),
Van der Linden (2001) and Kwak et al.(2005). For instance Warf and Cox (1989) adopt
Input-Output analysis to investigate the economic effects of maritime trade through the
Port of New York on the New York metropolis. Moreover, Moon (1995) confirms the
validity of the port Input-Output model as a predictive tool to provide information for the
future planning of ports in Korea. Van der Linden (2001) suggests that in order to
achieve flexibly, accuracy and completeness of a Input-Output and its results the
conventional model should include the following variables: accurate cost structure,
macroeconomic modeling that would be able to determine company-level responses
and expenditure effects, as well as including an inter-country framework. In order to
30
determine the significance of the maritime industry has with regards to Korean economy
in a short and long-run perspective, Kwak et al. (2005) follows the same research logic
as presented previously as the author uses the Input-Output model as well.
Unfortunately there is not that much of equilibrium modeling used in analyzing the port
impact on a national economy, at least not as abundant as the other typologies of
research. However, there are a couple of studies that exhibit relevant application of the
modeling. Doi et al. (2001) investigate the system-wide impact of an improvement in
port operational efficiency on the Japanese economy using a general equilibrium
model; P.E. Kent and A. Fox originate the cost of port incompetence and make use of
the Global Trade Analysis Project model to estimate the impact of port inefficiency on
trade and welfare. Rose (1995) points out to the fact that both the Input-Output and
general equilibrium models are very similar in their nature as they use similar data
requirements, they address the same type of questions and employ the same range of
applications for their economic impact analysis. Major improvements in the field of port
impact studies include the use of impact multipliers generated by input-output models
and efforts to ensure that the direct impact is not overestimated by the inclusion of
economic activity unrelated to the port.
2.3 Port Impact Studies using Equilibrium Models
Most recent studies have undergone a paradigm shift away from the Input-Output
analysis and towards the use of general equilibrium models (Burnettet al., 2007). The
paradigm shift could be attributed to the following reasons: First of all, the general
equilibrium models provides the benefit of having an explicit economic structure that
captures the interactions among various institutions that are both directly and indirectly
related to the port activity, such as the government, general households and production
sector. On the other hand, these interactions are commonly neglected in the Input-
Output model. Another main advantage of using general equilibrium models is the fact
that they employ non-linear functional forms and allow for factor substitution in
production. In contrast to general equilibrium models, the Input-Output models most
often use fixed coefficients to denote rigid production technology. Also, the Input-Output
is not capable of predicting or characterizing the response of individual institutions to
specific market signals. This mainly happens due to the fact that, in comparison to
general equilibrium models, the Input-Output only allows for the quantity or price to be
endogenous but not exogenous. A reason to shift to general equilibrium models is the
fact that the Input-Output models may lead to an overestimation of the economy wide
impacts generated by the maritime industry; main reason for that being the fact that the
model implicitly assumes a perfectly elastic supply of primary factors. McGregor et al.
(1996) argues that the associated results from the Input-Output analysis are very similar
to the long-run impacts in the general equilibrium analysis under neoclassical
assumptions. More than that, Rickman and Treyz (1993) indicate the fact that an Input-
Output model is a useful tool for providing insights for the policy makers in the long-run,
31
but performs poorly under short to medium-run time frame. Gillespie et al., 2001 are
also in support of this argument.
According to the Bureau of Transport Economics (2000), Input-Output analysis is
appropriate for Port Impact Studies that focuses on a small region. On the other hand, it
is more suitable to make use of a general equilibrium model in analyzing a national
economy or cases where there are effects on prices and production.
It is a well known fact that ports have been regarded as economic infrastructures and
catalysts for the economies they serve. Therefore, in order to derive economic benefits
from this economic infrastructure a constant improvement and development of the
sector is needed. In their paper, Lee et al 2012 measure South African economy-wide
impacts generated by the port developing by using a computable general equilibrium
investigation. The main goal of the paper is to understand the impacts of investments in
the port infrastructure, as well as understanding fluctuations in the freight costs, and
what is their actual impact on the national economy. The authors try to answer provide
an answer to their research by implementing two scenarios, the port investment and
freight rates reduction. The scenario results points out to the variable that has the
greatest impact on the South African maritime sector and economy in general. The
results support the economic significance of port development, as a means of
promoting growth, trade and employment, in South Africa.
The work of Sanchez et al (2003) examines the determinants of waterborne transport
costs, with special focus on the efficiency at port level in Latin America. The authors
indicate that the main purpose of this paper is (1) to generate statistically quantifiable
measures of port efficiency from a survey of Latin American common user ports, and
(2) to estimate a model of waterborne transport costs, including the previously
generated port efficiency measures as explanatory variables. For reasons of
incorporating various port efficiency measures the authors use a principal component
analysis (PCA) technique. According to the authors estimations the variables employed
in the model clarify a great proportion of the change in waterborne transport costs.
Concerning the issue of port efficiency, the outcome is particularly significant for one of
the port efficiency measures attained through PCA with an estimated elasticity
equivalent to that of distance. Additional explanatory variables such as monthly liner
service availability, distance, and the goods‟ value per ton prove to be statistically
significant in the context of the research. The results of the research are very
significant, especially for the policy makers as they demonstrate and measure the
relevance of the port efficiency. Furthermore, the paper illustrates that the port
efficiency variable is a determinant of a country‟s economic competitiveness, and
among the other relevant variables port efficiency can be easily influenced with a
proactive public policy.
32
The work of Sanchez et al (2003) not only has a great value for the port impact studies
but for this research as well. The authors confirm the purpose of this research by
mentioning the following: “International freight has an impact on trade similar to
customs tariffs or the exchange rate: a reduction in the costs of transport directly
stimulates exports and imports, just as an increase in the exchange rate (the rate at
which the national currency may be exchanged against another) makes exports more
competitive, and a reduction in national customs tariffs lowers the costs of imports.
Spurred by trade liberalization, customs tariffs have dropped to levels where in many
cases any additional reduction would now no longer have a significant impact. It is
perhaps for that reason that new and interesting studies have been published in recent
years analyzing the impact of transport costs on trade patterns and globalised
production.” The statement has a great value for the research in case as it proves the
fact that transportation costs can be in fact treated as tariffs. Compared to the previous
port impact studies which extensively use general equilibrium models, this research will
employ a partial equilibrium model that will study the effects on national welfare by
eliminating the trade impeding bottlenecks created around the port of Giurgiulesti.
2.4 The Global Simulation Model
The Global Simulation Model, GSIM Model, developed by Joseph Francois and Keith Hall, is a partial equilibrium model that analyses the tariffs and effect of trade policies on a global perspective. In our case it will analyze the port bottlenecks, which are regarded as non-trade tariffs. The model is based on the Armyngton-type product differentiation which assumes the following: “products traded internationally are differentiated according to their location of production. For the consumers of one state the products produced in a different state are a group of close but imperfect substitutes”. The latest and extended version of this partial equilibrium model was developed by Francois and illustrates an “analysis of Tariffs and Anti-Dumping Policy impacts on Prices, output, incomes and employment” (Francois, 2007). The main goal of implementing this model in this paper is to produce a simple and a flexible framework which will allow us to investigate the effect of reducing the bottlenecks encountered around the port of Giurgiulesti, illustrate the current situation, and pinpoint to future possible benefits. In line with Francois and Hall (2003), for the purpose of this model in the situation of the Port of Giurgiulesti the following assumptions are being made:
Imports should be imperfect substitutes for each other;
There is a fixed elasticity of substitution among products from different countries; and
Both the aggregate elasticity of demand and import supply should be constant. In order to run the model the following data is required: the domestic production of the countries, bilateral trade data of a specific commodity among the nations, average of the trade tariffs and the non-tariff measures in the add-valorem form.
33
The significance of this model lies on the fact that it can be used to measure the effects of any policy or circumstance that alters the price of a product, in our case the costs related to transportation by means of this specific infrastructure unit. The only thing that has to be done for the purpose of this study is to assume that the result of the introduced policy on the prices is the same produced by a hypothetical introduced tariff. As a result the model can provide the operational improvement related results. Moreover, the model provides the changes in the consumer surplus, the producer surplus and the government‟s tariff revenues. These variables are what we need in order to assess the economic impact of the port of Giurgiulesti, and indicate the benefit of addressing the challenges it faces at the moment.
2.5 Advantages of the Global Simulation Model and other equilibrium
models
There are two types of equilibrium models, the partial equilibrium model and the general equilibrium model. The theory behind the general equilibrium models was introduced by the French scientist Leon Warlas, as a result the CGE models are also known Walrasian equilibrium models. CGE models are a standard instrument of empirical analysis, and are extensively utilized to analyze the aggregate welfare and distributional impacts of policies whose effects may be transmitted through multiple markets, or contain menus of different tax, subsidy, quota or transfer instruments (Wing 2004). Most of the time economists regard the CGE models with a great matter of suspicion. The suspicion comes from the fact the results cannot be traced to the initial data base or input parameters, algebraic structure, or method of solution. However, the main criticism comes from the fact that in order to run a general equilibrium model you need large number of variables and parameters that are structurally complex, and all this leads to questionable assumptions of the result (Wing 2004). In the trade liberalization context Panagariya and Duttagupta (2001) express themselves in the following way: “Unearthing the features of CGE models that drive [their results] is often a time-consuming exercise. This is because their sheer size, facilitated by recent advances in computer technology, makes it difficult to pinpoint the precise source of a particular result. They often remain a black box. Indeed, frequently, authors are themselves unable to explain their results intuitively and, when pressed, resort to uninformative answers...”
On the other hand, partial equilibrium models employ sector specific approach, while assessing the market for a specific good only (Mas-Collel, 1995). The main advantage of the partial equilibrium and the reason why they are widely used by economist is the fact that they are fairly easy and transparent. Developed by Francois and Hall (2003), the global partial equilibrium represents a improved version of the simple partial equilibrium as it can asses multiple markets and regions. However, the more regions are added to the model, it becomes exponentially more complex. There are a couple of advantages for choosing the GSIM model over general equilibrium models: Firstly, the model is fairly flexible as you can intervene at any moment and the results are traceable to their initial sources. Secondly, the GSIM model allows us to investigate policy
34
changes at the disaggregated industry or sector specific level, while general equilibrium generates result on an aggregate level (Francois and Hall 2003). The main advantage of the GSIM model as mentioned before is the fact that it requires limited data inputs. The GSIM model provides results of welfare changes in a monetary value. It measures definite welfare impacts disaggregated on the producer, consumer and country level, as well as indicating the governmental gain or loss in terms of tariff revenue.
35
3. Trade Restrictive Measures
3.1 Non-tariff barriers
Defining the Non Tariff Measures and insights from literature
The initial functional definitions of NTM‟s (Non-Tariff Measures) mainly deal with the economic effects they generate. Baldwin (1970) defines a “non-tariff distortion” as “any measure (public or private) that causes internationally traded goods and services, or resources devoted to the production of these goods and services, to be allocated in such a way as to reduce potential real world income.” In the same manner, Lloyd (1996, p. 44) analyzes the concept of a regional “single market”. The author defines it as a single market as one in which the law of one price prevails, “allowing for transport and other transport costs which prevent perfect arbitrage,” as a result of “the removal of all border and non-border restrictions on commodity trade, and the harmonization of commodity taxes and other measures which affect access to markets.” In this notion, NTMs might be regarded as being comprised somewhere among the restrictions, taxes, and procedures preventing the law of one price from being instigated.
Although the definitions presented above are significant in terms of organizing the analytical thought and provide academic value for the scholars, they fail to depict the reality and therefore are considered rather impractical. From the practical point of view, what is really expected from the definitions of NTM‟s is operational value. A definition is operational, in the case of such measures, only when it indicates to which actors should be included and which ones should be excluded from the list. More than that, it should contain specific guidelines and indications for every actor included in the list in terms economic impact (Are they price-raising, trade-reducing, welfare-reducing etc.). Furthermore the approach of identifying and defining the NTMs can be improved by providing a depiction of whether the actor is a candidate or a potential restriction to trade. Ferrantito (2006) points out to the need of further classifying the measures that turn out to have an economic impact as “effective” or “binding” NTMs.
Preliminary research points out to the fact that by reducing the NTMs everyone is better off in terms of economic benefits, as there is substantial increase in the global trade. Andriamananjara, et al. (2004), takes into account only a limited set of NTMs, estimated that global gains from their elimination were on the order of USD 90 billion. Walkenhorst and Yasui (2005) obtained estimated global welfare gains of USD 40 billion from a 1% lowering of trade transactions costs. Furthermore, Wilson, Mann and Otsuki (2005) consider improvements in ports, customs, regulation, and service sector infrastructure which would raise countries with below-average performance halfway to the global median. Considering a variety of potential trade facilitation measures, they approximate that improvements would generate global increases in merchandise trade resulting in USD 377 billion, about a 9.7% increase in total trade.
A number of schemes have been proposed for the classification of NTMs, in conjunction with inventories of such measures. The widely used UN Conference on Trade and Development (UNCTAD) typology (1996) relies on self-notifications of
36
member countries. Categorization schemes such as Manifold and Donnelly (2005) are based on concerns about particular policies and practices which often arise originally in the business community but which find expression in government-prepared inventories of market access conditions in trading partners as well as the WTO‟s Trade Policy Review Mechanism (TPRM). Manifold and Donelly‟s framework is especially useful at giving a holistic impression of where are the NTM‟s rooting from.
Major Categories of Measures: Manifold and Donnelly (2005)
Anticompetitive practices / Competition policy
Corruption Customs procedures
Exports Government procurement Import licensing Import prohibitions Import quotas
Intellectual property rights
Investment-related measures
Sanitary and phytosanitary requirements
Services
Standards, testing, certification and labeling
State trading Taxes
Many researchers made the attempt to provide a unified framework of depicting and quantifying the non-tariff measures, but all we got is divergent opinion in the field as well as various methods of analyzing the NTM‟s (The „ Handicraft‟ price method, Price-based econometric methods, Quantity-based econometric methods and Simulation methods) (Ferrantito 2006).`As mentioned before NTM‟s are very difficult to quantify and require detailed attention, therefore the process of investigating them can be quite time consuming, especially accounting for the fact that there is no unified framework for assessing them. For this reasons, the quantification of the NTM‟s is going to be based on the research conducted by ECORYS 2009, which provides a quantification across different countries and sectors.
Moldova’s NTMs
According to the Customs Department order Moldova is a leader on the chapter of ease in doing business with, this together with the fact that, as mentioned before, the country has one of the most liberal customs tariffs in the region make Moldova one of the most attractive countries to engage in trade with. Although a lot of progress has been made in reforming the trade regulations and the customs service the nation still has to work
37
hard on these issues as many bureaucratic hurdles still persist (Expert Group 2007). Among these hurdles the most distinctive are: issues related to licensing, marking, labeling requirements, customs check procedures and infrastructural problems.
Customs clearance
According to the Moldavian customs regulations, the customs clearance has to be performed in the area of the legal registration of the applicant.
When requested, customer clearance is prepared at the expense of the requesting entity, with the customs body authorization in other places but also at times other than the office hours of the customs authority (Expert Group 2008). These kinds of barriers generate lots of logistical problems to both importers and exporters. The minimum import documentation requirements include: customs declaration, commercial invoice, sales contract, the certificate of origin, the certificate of conformity compliance, and transport documentation (Republic of Moldova Customs Service). In case that any of the before mentioned documents are missing the cargo that was under the clearance procedure is transferred to a specialized storage regime. A large number of importers often complain about these procedures as their inventory flow is often interrupted. More than that, the customs officers are authorized to perform expert evaluation of the cargo by requesting a sample of the imported good. According to Moldova‟s Customs Service such procedure are necessary in order to: determine the quality of the imported good, determine the origin of the goods, confirm that the cargo is in accordance with the declaration, and other security reasons. Most frequently, such evaluations may take up two hours. The customs body also requests the original contract with the manufacturer and do not recognize the purchase order or the dealer invoice which is in accordance with the common international practice. Requirements like these make the life of an importer very complicated as they have to perform a special documental preparation for the imports into Moldova, as well as the fact that it is very hard for them to keep track with the unsystematic and often changing regulations concerning the settlement of the disputes, regulation on the conclusion and execution of the transactions, certification compliance and customs procedures in general.
It might seem that the exporters are privileged by not paying any customs export tariffs. However, this is not the case as the exported goods are subject to export regulation, licensing and other internal regulatory tools. In this sense the exporter encounters the same hustle as the importer when preparing for an export transaction. The minimum set of documentation should contain the following: export- import contract, commercial invoice, transport documentation, the certificate of origin, the certificate of conformity compliance with national standards and the health certificate.
Licensing
Due to safety reasons export licenses are required for the same goods that require import licenses. Applying for an export license is not an easy process, especially in the
38
case of the alcoholic beverages. For instance, every bottle of wine which is to be exported is subject to the label called “state trademark”. And, in order to apply for such a label the exporter has to encounter again the bureaucratic hurdles of presenting the license of production of alcoholic drinks and the original contract with the importing party. Such measures have a direct effect on the restriction of wine export. This, in turn has a negative effect on the Moldavian wine industry as a whole, and can hinder its competitiveness.
Other important barrier to trade created by the licenses is their exposition to the traders. The traders often lack specific information on the exact range of goods covered by an import or export license. For example, contradictory and discriminatory application is encountered in the electronics sectors as there is no common nomenclature on the international trade classification that can be consulted before engaging into trade. The general opinion of the public is that these licenses and permit requirements are excessive in their nature and do not serve the interests any public interest, but only creates additional cost. This is a burden for the Small and Medium Enterprises (SME). This was demonstrated by the huge waves of protests against licensing throughout the year of 2007.
Other Non-Tariff Measures
As a WTO member, Moldova has committed that all fees and charges in connection with imports or exports shall be limited in amount to the approximate cost of services rendered and shall not represent an indirect protection to domestic products or a taxation of imports or exports for fiscal purpose. However an ad-valorem rate, the so called “environmental tax” (0,5-1% of the customs value) is charged for such imports like: Arabic gum, cigars, cigarillos, cigarettes and other manufactured tobacco, asbestos, oils and petroleum oils, as well for petroleum gases, fertilizers, coloring matters, pigments, paints and other chemical products (Expert Group 2008).
Agricultural sector, which is at the moment the most important sector of the country, has to suffer from regulatory barriers as well. Their competitiveness is hindered due to the fact that they have to apply for different regulatory bodies in order to import the vital inputs for the agricultural sector, even in the case when there is no home production of these. The farmers waste a lot of time and monetary resources (which often they cannot afford) in order to import the seeds and other agricultural inputs as they have to apply for an attestation and certification with Moldovan standards and shall comply with many sanitary and phytosanitary requirements. Almost the same thing I depicted in the industrial sector. Different regulatory measures and procedures reduce their competitiveness as they are not able to access the more advanced foreign technology. This happens mainly due to the fact that it is too expensive for them to bear the extra costs that are imposed by the customs clearance process and the conformity certification process.
Despite the fact that Moldova committed to reduce the range of imported products subject to mandatory certification of conformity, the list of goods approved by Government decision was twice larger than the one presented to the WTO members.
39
This is a real technical barrier to trade due to which importers bear large costs in terms of money and time. The issue of conformity assessment certificates is known as a very difficult process for foreign suppliers and the level of information transparency is very low (Expert Group 2008).There are other regulations that do not come in line with the country‟s commitment to the WTO, this refers to the interdiction of trade of: 1) chicken and other animal origin goods that are not packed, labeled, marked without data about the producer and authorized importer; and 2) animal origin products (other preparations) from frozen or refrigerated products (meat sausages and all range of them). These regulations are not scientifically based and seem to be in opposition with WTO common rules. These requirements should be revised and amended as soon as possible in terms of following up WTO commitments and recommendations (Expert Group 2008).
3.2 Port specific Bottlenecks
Identification and definition of Bottlenecks
It is a well-known fact that infrastructure and trade are inseparable factors. It can be argued as well that the better the infrastructure of a specific channel is, the higher the chance is that the trade will be effectuated via it. Enarsson (2006) identifies the following points of importance of infrastructure in logistics:
The infrastructure makes conditions and possibilities;
There must be co-ordination between the different modes of transport;
The infrastructure must be built on national perspective with international adaptation;
The limited resources demand concentrated directives and hard priorities;
As a result of the fact that the maritime transportation holds a large share of total transported goods, as well as the fact that it is the most cost effective mode of transportation, a port is one of the most important infrastructure units for a nation. A port enhances the nation‟s competitiveness by facilitating trade, reduce the cost of transportation of goods and increase the consumer welfare in general. However, running a port is a great art, and most of the time it comes with consequences that add up to the total cost of transportation. These consequences are called bottlenecks. Even the leaders in the port industry, such as the Port of Rotterdam faces bottlenecks that slows the movement of goods and add up to the logistical cost. One of the most illustrative examples being the congestion on the roads that led to the port.
40
The transport definition of a bottleneck is: „a section of a route with a carrying capacity substantially below that characterizing other sections of the same route’. However, in the context of our research Baltic Tangent gives a better definition: transport conditions leading to too long travel times and/or causing delays for freight or persons (Baltic Tangent, 2006). Delay for freight is probably the key word in this definition, as with delays in a transportation channel, in our case the port of Giurgiulesti, the likeability of trade by means of this channel is lower.
Infrastructure bottlenecks are very different in nature and come in different forms depending on the geographical region. The bottlenecks usually depend on the on the type of the infrastructure and the type of goods that flow through this specific unit. Baltic Tangent (2006) argue that the infrastructure bottlenecks can be categorized in terms in terms of technical, economic, political, or environmental shortcomings, leading to bad accessibility to the system (Baltic Tangent, 2006).
In order to identify the bottlenecks created around the port of Giurgiulesti interviews with three companies were conducted. All three companies are market leaders on the Moldavian market, and make extensive use of the maritime transport when importing goods (Supraten SA: market leader in the wholesale of construction materials, construction equipment and supplies, sanitary products and furniture. The company currently has 25% market share on the Moldavian market (Nicolai Tricolici, personal conversation); ELPO SRL: market leader in the wholesale of water, gas and electricity products. The company has a market share of 20% of the Moldavian market (Mircea Moraru, personal conversation); Trans Oil Group: major grain producing trading company specialized in grain and oil seed trade on the Black Sea). The purpose of the interviews were to identify the bottlenecks that are encountered by respondents in the port of Giurgiulesti, and later on give a quantification to each of them. After the interviews have been conducted it could be noticed that the bottlenecks present at the port could be grouped in several categories: internal, regulatory and external. Due to the fact that our model includes only such types of bottlenecks that can be reduced, the categories that were mentioned before are not in line with the ones produced by the Baltic Tangent. In addition it was observed that the three companies have identified almost the same set of bottlenecks, which are „undermining‟ their activities, both commercial and operational. Moreover the interviewed entities rank the obstacles in very similar ways. This can be observed later in the paper when the figures for the bottlenecks assessment will be presented. It is important to mention that although the companies analyzed have their core activities in different fields they meet the same barriers when transporting goods through the port of Giurgiulesti.
It has already been mentioned above that the group of identified bottlenecks were divided in three categories which are intended to depict each of the aspects influencing the flow of the goods through the port of Giurgiulesti. Let us firstly discuss each group in part.
41
Internal bottlenecks
This group of bottlenecks is meant to describe the obstacles that are created due to the lack of efficiency in the operations of the port itself. It should be considered that in this set of barriers enter only the ones which can be resolved by the port authority and the branch organizations which develop their business activity inside of the free economic zone of the port of Giurgiulesti. The influence of the external factors can be considered unimportant. The group of internal bottlenecks includes:
Congestion of the inland waterways- this problem is attributed to the internal group due to the fact that the berthing plans of the port are not optimized enough and the windows provided to the vessels are often exceeded which results into congestions and low berth productivity (According to the source from the port authority). If the congestion of the inland waterways would be at least partly resolved this would save a lot of time and would create additional revenues for the port authority.
Operational issues- this point includes such bottlenecks as inefficient usage of the equipment, lack of modern equipment, incorrectly structured port operations etc. It is clear that the majority of the issues linked to the inefficiency can be explained by the lack of experience from the part of the port authority and also low capital inflows into the port development programs. Nevertheless these problems have to be addressed as they create a huge barrier for the customers of the port of Giurgiulesti. For a „young‟ port like Giurgiulesti is, these kinds of operational bottlenecks are inevitable as the business model itself is not completely established- however such kind of barriers have to be removed as fast as possible in order to give the business unit the ability to function at the maximum possible capacity.
Poor communication and lack of IT systems- this is one of the core bottlenecks of the newly created port (according to the source from the port authority).In today‟s business environment IT systems play a very important role in both: support of the business operations and of the commercial activity. In order for the business unit to function all the bodies should be able to communicate very well between themselves as well as share the available information. The port of Giurgiulesti is yet in the very beginning of the development stage and problems brought up by the poor communication and lack of IT systems can be very harmful for the entire functionality of the harbor. The interviewed companies state that the low level of IT implementation by the port authority creates serious barriers for the trade flows. The transported goods are not easily traceable-an obstacle which brings up additional costs.
Security of the cargo is an issue that requires immediate solutions taken by the port authority of the Giurgiulesti harbor. According to Supraten (which often transports dangerous) the containers are not properly handled. Moreover the terminal operators do not respect the required protocol of IMO handling. This sometimes leads to serious accidents which undermine the terminal operations as well as the willingness of the clients to transport their goods by the means of
42
this infrastructure node. In addition the safety of the stored cargo is also a big problem. The storage conditions do not correspond to the required standards thus losses occur which bring additional costs to both the port authority and the client. The interviewed companies unanimously state that if the security issues at the port of Giurgiulesti would be addressed the cargo flow through the harbor would instantly and significantly increase.
Level of awareness - under this point it is meant that the port, due to its short existence, is not yet being used at the full capacity. This means that there are many companies which are not aware of the services offered by the harbor and due to the reduced marketing do not have any insight about the possibilities that might be offered by the usage of this transportation node. The port of Giurgiulesti has a weak marketing program which is a serious bottleneck in terms of wining business share from rail and road transportation means.
Regulatory Bottlenecks
In this part the obstacles created by the poor regulation will be brought up. For a „young‟ port like Giurgiulesti it is of a core importance to build the business model on a solid base of a good legal and regulatory policy. The significance of creation of a set of rules and obligations which should be strictly respected by both the port authority and the partner companies cannot be overestimated. Nevertheless the current legal system of the republic of Moldova has quite serious breaches especially when talking about the trade regulations.
For the port of Giurgiulesti 2 major regulatory obstacles have been detected:
Customs procedures- this issue has always been on the top of the discussion list. The custom procedures are extremely time consuming due to bureaucratic protocols thus goods cannot be cleared immediately at arrival or just prior their departure. Besides these the custom regulations are not including any clauses regarding the maritime freight as the port of Giurgiulesti is the first active port on the territory of the Republic of Moldova. It should be mentioned that the question about creation of a new protocol for the custom clearance of the cargo transported through the harbor has been already raised by the state government thus the situation might change in the near future. (MonitorulOficial 2012) The port authority of the Giurgilesti harbor states that under current regulation some important international marine carriers are not willing to ship goods to Moldova. By the application of new legislation this issue may be positively solved.
Corruption is one of the most serious obstacles for the open trade. According to the Transparency‟s International Corruption Index Moldova is ranked 112th out of 182 countries that were investigated. The current instability in the political and economic situation of the country creates a good environment for the corruption on all the levels of the state institutions. The interviewed companies mention that the corruption is a serious issue which brings up a large amount of additional costs as well as undermines the trade relationship with the partners
43
outside the country. Unfortunately it cannot be predicted when the adequate measures will be taken in order to eliminate the problem of bribery in the country.
External Bottlenecks
In this group it has been decided to include the factors which cannot be addressed by the port authority. Here are including factors like the general national infrastructure and also environmental and political factors which the port authority cannot influence or ignore.
Intermodal link is a problem of connectivity between the means of transportation. The general infrastructure of the country is very poorly organized and badly maintained. Thus it is not an easy task to load the cargo that arrives in the port on a train or truck as the transportation system is lacking hubs and nodes. Moreover the communication between the carrying agents is on a very bad level which creates additional costs for waiting and obviously increases the dwell time of the cargo in the port by this generating extra costs for the clients. This problem needs an immediate solution as the companies which conduct their flow of the goods through the port may be willing to switch to a different mode of transportation in order to avoid the losses. (Port authority) The best solution would be to attract capital investments in order to improve the infrastructure at least in the harbor area.
National road Chisinau-Cahul-Giurgilesti is an important transport aorta of the entire country. Moreover it has a vital significance for the „newly built‟ harbor as a major part of the import-export goods are carried on this route. The poor maintenance and the low quality of the above-mentioned road create multiple delays and represent a real bottleneck for the cargo flow. In some particular segments the route narrows down to one lane in each direction by this heavily diminishing the throughput capacity to unacceptable levels. Moreover this road is not only meant for cargo transportation but also for the traffic of passengers which worsens the situation even more. The biggest problem though is that at this point in time the Moldavian government does not take any measures for the enlargement and improvement of the road which may in future bring to even bigger problems with the transportation of cargo. This would result in serious inefficiencies by generating congestion and diminishing the strategic role of the route.
Political and economic instability is an obstacle which cannot be addressed by the port authority but has a serious negative impact on the entire business operation of the entity. This may be considered as one of the most important bottlenecks faced by the port authority as it undermines the commercial activities and is not influenced by the harbor management. The foreigner partners of the interviewed companies are sometimes „playing‟ to safe in order
44
to increase the security of their business operations and this does not always have positive results. (Trans-Oil 2012)
Environmental factors are the last but not least to mention. One should not forget that Giurgiulesti is an inland port and thus the access to it is limited by numerous natural barriers. The fact that in some areas the Danube narrows down or breaks in numerous arms creates congestion and navigation problems. Moreover the port authority has to perform continuous dredging activities in order to keep the river segment navigable and secure the access to all the berths. It is understandable that the environmental bottlenecks are almost impossible to eliminate thus the management of the port should maximize the efficiency based on the accessible methods.
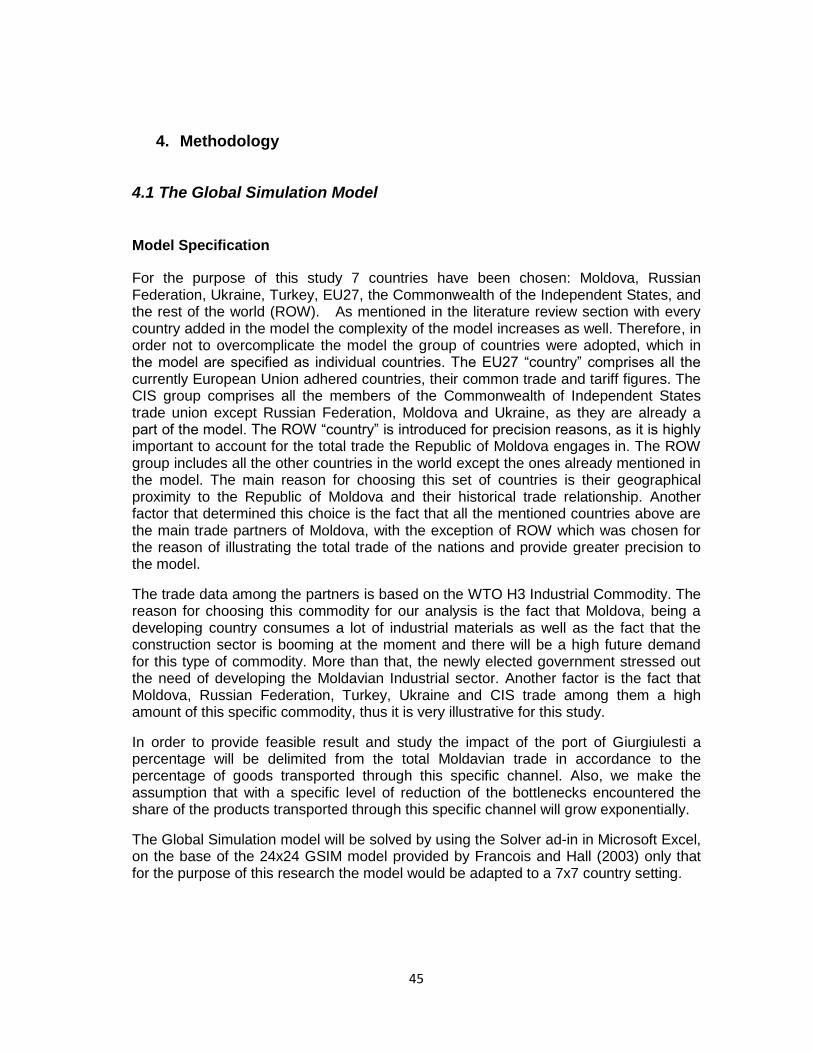
45
4. Methodology
4.1 The Global Simulation Model
Model Specification
For the purpose of this study 7 countries have been chosen: Moldova, Russian Federation, Ukraine, Turkey, EU27, the Commonwealth of the Independent States, and the rest of the world (ROW). As mentioned in the literature review section with every country added in the model the complexity of the model increases as well. Therefore, in order not to overcomplicate the model the group of countries were adopted, which in the model are specified as individual countries. The EU27 “country” comprises all the currently European Union adhered countries, their common trade and tariff figures. The CIS group comprises all the members of the Commonwealth of Independent States trade union except Russian Federation, Moldova and Ukraine, as they are already a part of the model. The ROW “country” is introduced for precision reasons, as it is highly important to account for the total trade the Republic of Moldova engages in. The ROW group includes all the other countries in the world except the ones already mentioned in the model. The main reason for choosing this set of countries is their geographical proximity to the Republic of Moldova and their historical trade relationship. Another factor that determined this choice is the fact that all the mentioned countries above are the main trade partners of Moldova, with the exception of ROW which was chosen for the reason of illustrating the total trade of the nations and provide greater precision to the model.
The trade data among the partners is based on the WTO H3 Industrial Commodity. The reason for choosing this commodity for our analysis is the fact that Moldova, being a developing country consumes a lot of industrial materials as well as the fact that the construction sector is booming at the moment and there will be a high future demand for this type of commodity. More than that, the newly elected government stressed out the need of developing the Moldavian Industrial sector. Another factor is the fact that Moldova, Russian Federation, Turkey, Ukraine and CIS trade among them a high amount of this specific commodity, thus it is very illustrative for this study.
In order to provide feasible result and study the impact of the port of Giurgiulesti a percentage will be delimited from the total Moldavian trade in accordance to the percentage of goods transported through this specific channel. Also, we make the assumption that with a specific level of reduction of the bottlenecks encountered the share of the products transported through this specific channel will grow exponentially.
The Global Simulation model will be solved by using the Solver ad-in in Microsoft Excel, on the base of the 24x24 GSIM model provided by Francois and Hall (2003) only that for the purpose of this research the model would be adapted to a 7x7 country setting.
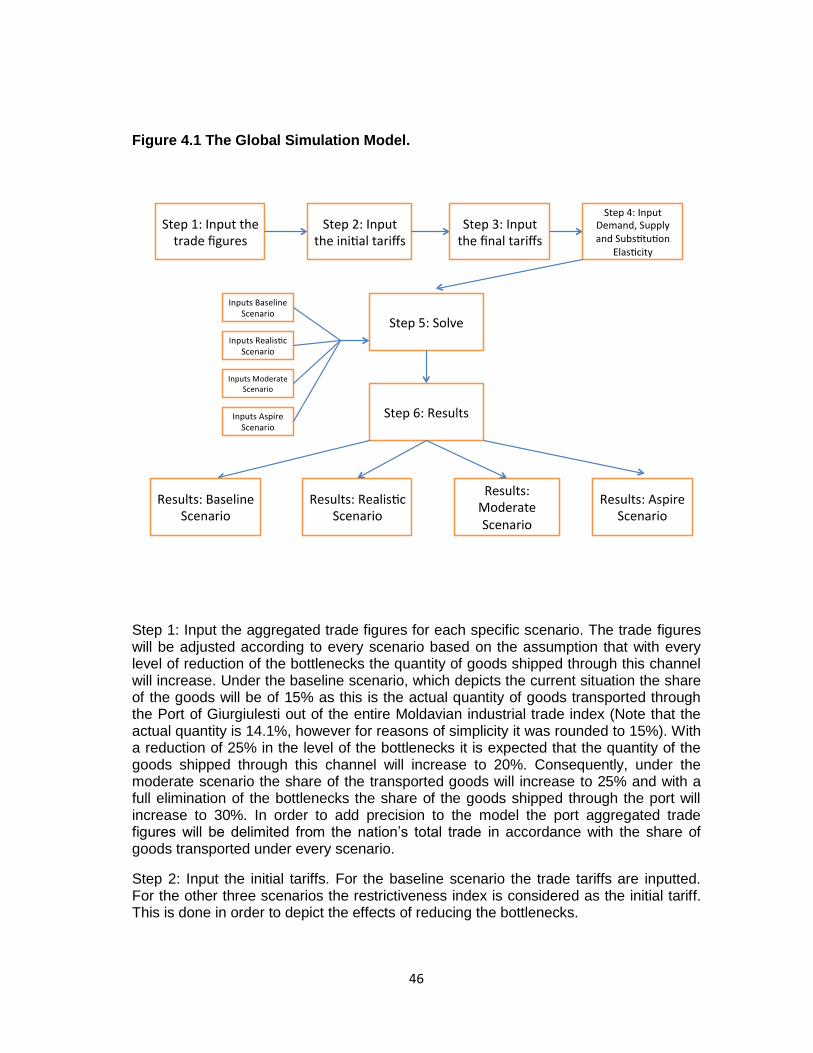
46
Figure 4.1 The Global Simulation Model.
Step 1: Input the aggregated trade figures for each specific scenario. The trade figures will be adjusted according to every scenario based on the assumption that with every level of reduction of the bottlenecks the quantity of goods shipped through this channel will increase. Under the baseline scenario, which depicts the current situation the share of the goods will be of 15% as this is the actual quantity of goods transported through the Port of Giurgiulesti out of the entire Moldavian industrial trade index (Note that the actual quantity is 14.1%, however for reasons of simplicity it was rounded to 15%). With a reduction of 25% in the level of the bottlenecks it is expected that the quantity of the goods shipped through this channel will increase to 20%. Consequently, under the moderate scenario the share of the transported goods will increase to 25% and with a full elimination of the bottlenecks the share of the goods shipped through the port will increase to 30%. In order to add precision to the model the port aggregated trade figures will be delimited from the nation‟s total trade in accordance with the share of goods transported under every scenario.
Step 2: Input the initial tariffs. For the baseline scenario the trade tariffs are inputted. For the other three scenarios the restrictiveness index is considered as the initial tariff. This is done in order to depict the effects of reducing the bottlenecks.
47
Step 3: Input the final tariffs. For the baseline scenario the final tariffs will represent the restrictiveness index, in this manner it will be possible to depict what is the actual welfare loss due to NTM‟s and bottlenecks. For the other three scenarios the final tariffs will be represented by the new restrictiveness index, which includes a reduced level of the bottlenecks in accordance with every scenario.
Step 4: The elasticity of Demand, Supply and Substitution are kept constant under every scenario as instead of running a single model we run 4 different ones.
Step 5: Solve the Model using the Solver Add-in.
Step 6: Interpret the results. The results will be presented in terms of Consumer surplus, Producer surplus, Tariff revenue and Net welfare gain.
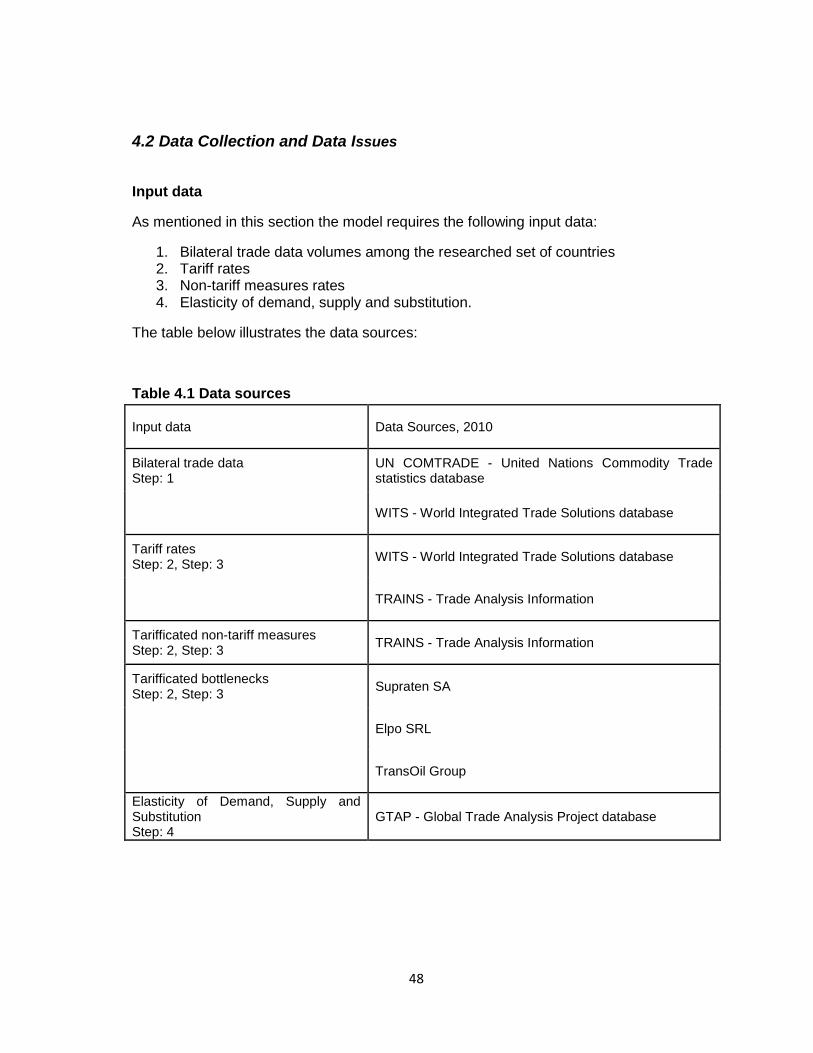
48
4.2 Data Collection and Data Issues
Input data
As mentioned in this section the model requires the following input data:
1. Bilateral trade data volumes among the researched set of countries 2. Tariff rates 3. Non-tariff measures rates 4. Elasticity of demand, supply and substitution.
The table below illustrates the data sources:
Table 4.1 Data sources
Input data Data Sources, 2010
Bilateral trade data Step: 1
UN COMTRADE - United Nations Commodity Trade statistics database
WITS - World Integrated Trade Solutions database
Tariff rates Step: 2, Step: 3
WITS - World Integrated Trade Solutions database
TRAINS - Trade Analysis Information
Tarifficated non-tariff measures Step: 2, Step: 3
TRAINS - Trade Analysis Information
Tarifficated bottlenecks Step: 2, Step: 3
Supraten SA
Elpo SRL
TransOil Group
Elasticity of Demand, Supply and Substitution Step: 4
GTAP - Global Trade Analysis Project database
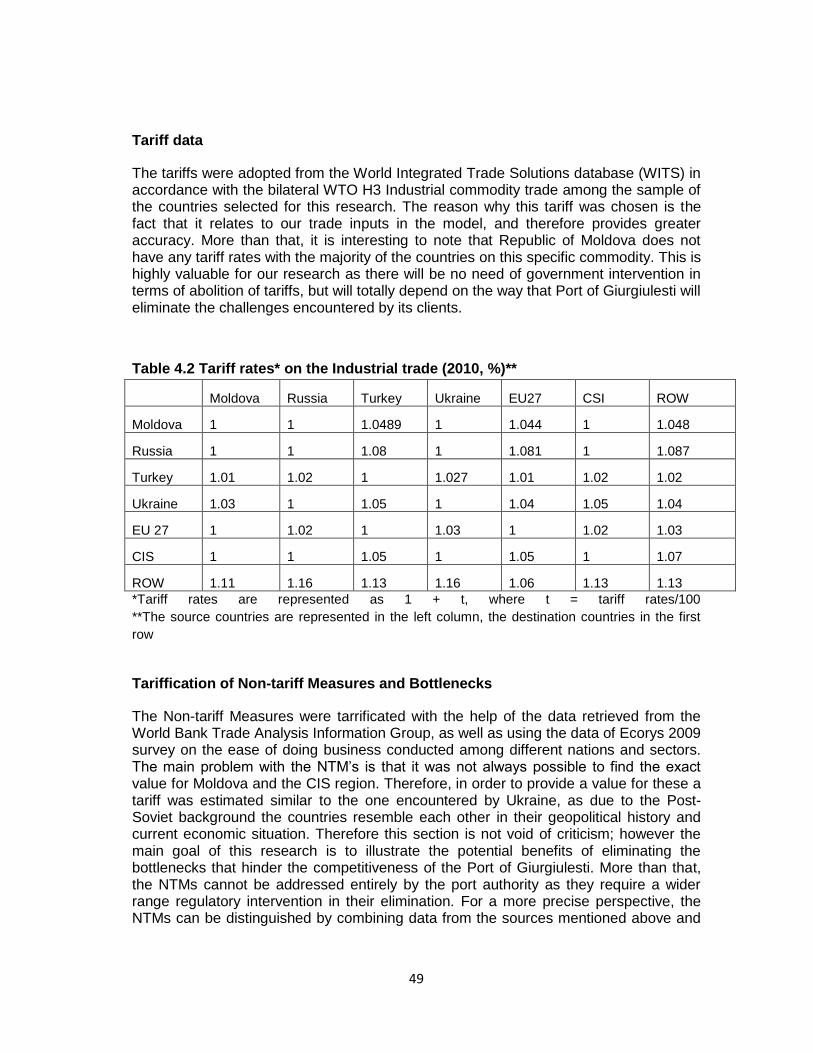
49
Tariff data
The tariffs were adopted from the World Integrated Trade Solutions database (WITS) in accordance with the bilateral WTO H3 Industrial commodity trade among the sample of the countries selected for this research. The reason why this tariff was chosen is the fact that it relates to our trade inputs in the model, and therefore provides greater accuracy. More than that, it is interesting to note that Republic of Moldova does not have any tariff rates with the majority of the countries on this specific commodity. This is highly valuable for our research as there will be no need of government intervention in terms of abolition of tariffs, but will totally depend on the way that Port of Giurgiulesti will eliminate the challenges encountered by its clients.
Table 4.2 Tariff rates* on the Industrial trade (2010, %)**
Moldova Russia Turkey Ukraine EU27 CSI ROW
Moldova 1 1 1.0489 1 1.044 1 1.048
Russia 1 1 1.08 1 1.081 1 1.087
Turkey 1.01 1.02 1 1.027 1.01 1.02 1.02
Ukraine 1.03 1 1.05 1 1.04 1.05 1.04
EU 27 1 1.02 1 1.03 1 1.02 1.03
CIS 1 1 1.05 1 1.05 1 1.07
ROW 1.11 1.16 1.13 1.16 1.06 1.13 1.13
*Tariff rates are represented as 1 + t, where t = tariff rates/100
**The source countries are represented in the left column, the destination countries in the first
row
Tariffication of Non-tariff Measures and Bottlenecks
The Non-tariff Measures were tarrificated with the help of the data retrieved from the World Bank Trade Analysis Information Group, as well as using the data of Ecorys 2009 survey on the ease of doing business conducted among different nations and sectors. The main problem with the NTM‟s is that it was not always possible to find the exact value for Moldova and the CIS region. Therefore, in order to provide a value for these a tariff was estimated similar to the one encountered by Ukraine, as due to the Post-Soviet background the countries resemble each other in their geopolitical history and current economic situation. Therefore this section is not void of criticism; however the main goal of this research is to illustrate the potential benefits of eliminating the bottlenecks that hinder the competitiveness of the Port of Giurgiulesti. More than that, the NTMs cannot be addressed entirely by the port authority as they require a wider range regulatory intervention in their elimination. For a more precise perspective, the NTMs can be distinguished by combining data from the sources mentioned above and
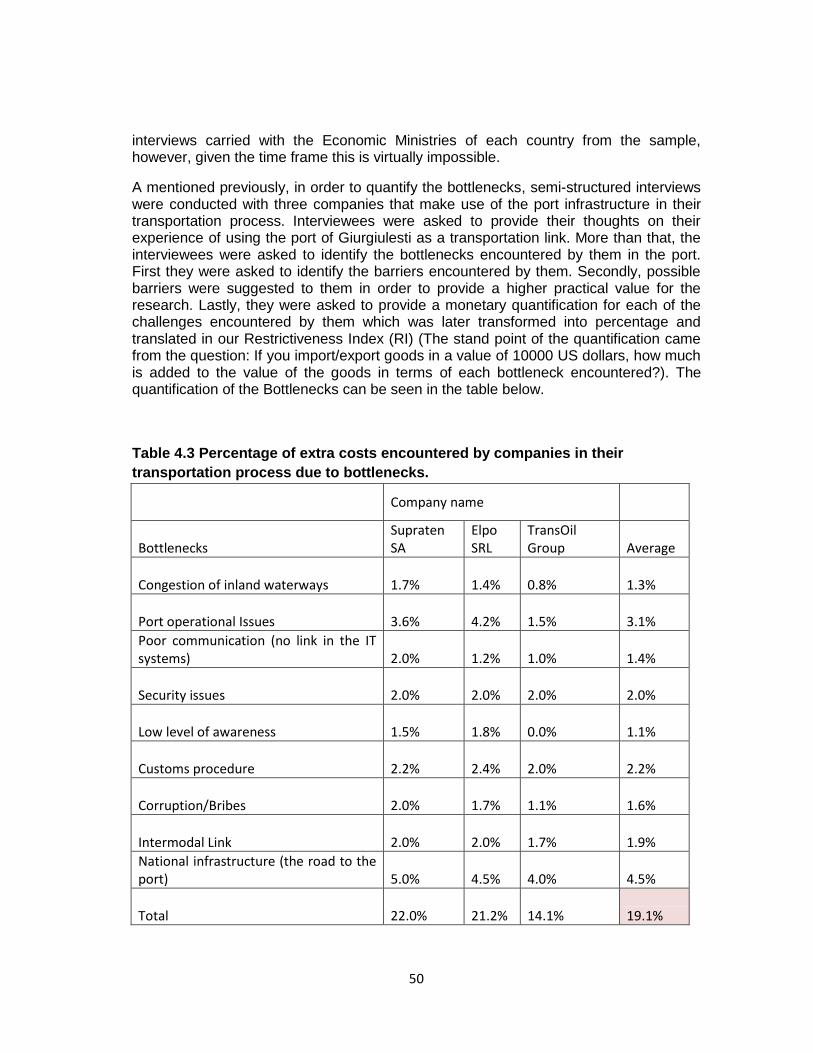
50
interviews carried with the Economic Ministries of each country from the sample, however, given the time frame this is virtually impossible.
A mentioned previously, in order to quantify the bottlenecks, semi-structured interviews were conducted with three companies that make use of the port infrastructure in their transportation process. Interviewees were asked to provide their thoughts on their experience of using the port of Giurgiulesti as a transportation link. More than that, the interviewees were asked to identify the bottlenecks encountered by them in the port. First they were asked to identify the barriers encountered by them. Secondly, possible barriers were suggested to them in order to provide a higher practical value for the research. Lastly, they were asked to provide a monetary quantification for each of the challenges encountered by them which was later transformed into percentage and translated in our Restrictiveness Index (RI) (The stand point of the quantification came from the question: If you import/export goods in a value of 10000 US dollars, how much is added to the value of the goods in terms of each bottleneck encountered?). The quantification of the Bottlenecks can be seen in the table below.
Table 4.3 Percentage of extra costs encountered by companies in their
transportation process due to bottlenecks.
Company name
Bottlenecks Supraten SA
Elpo SRL
TransOil Group Average
Congestion of inland waterways 1.7% 1.4% 0.8% 1.3%
Port operational Issues 3.6% 4.2% 1.5% 3.1%
Poor communication (no link in the IT systems) 2.0% 1.2% 1.0% 1.4%
Security issues 2.0% 2.0% 2.0% 2.0%
Low level of awareness 1.5% 1.8% 0.0% 1.1%
Customs procedure 2.2% 2.4% 2.0% 2.2%
Corruption/Bribes 2.0% 1.7% 1.1% 1.6%
Intermodal Link 2.0% 2.0% 1.7% 1.9%
National infrastructure (the road to the port) 5.0% 4.5% 4.0% 4.5%
Total 22.0% 21.2% 14.1% 19.1%
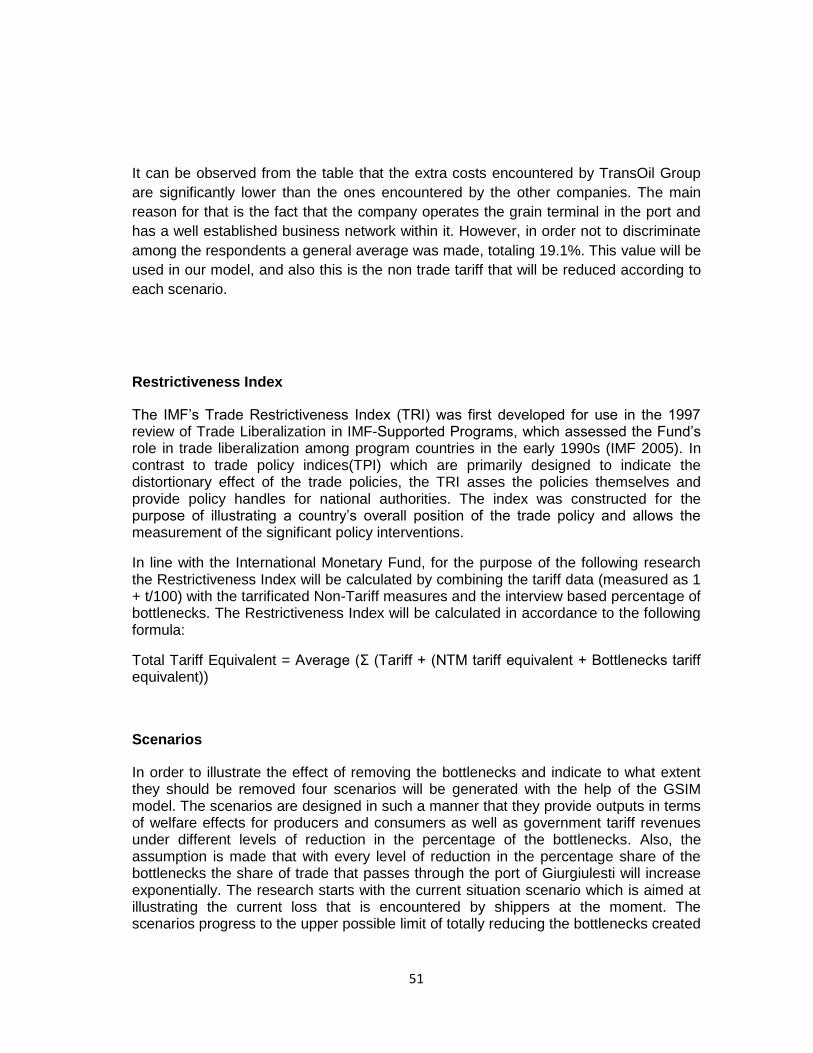
51
It can be observed from the table that the extra costs encountered by TransOil Group
are significantly lower than the ones encountered by the other companies. The main
reason for that is the fact that the company operates the grain terminal in the port and
has a well established business network within it. However, in order not to discriminate
among the respondents a general average was made, totaling 19.1%. This value will be
used in our model, and also this is the non trade tariff that will be reduced according to
each scenario.
Restrictiveness Index
The IMF‟s Trade Restrictiveness Index (TRI) was first developed for use in the 1997 review of Trade Liberalization in IMF-Supported Programs, which assessed the Fund‟s role in trade liberalization among program countries in the early 1990s (IMF 2005). In contrast to trade policy indices(TPI) which are primarily designed to indicate the distortionary effect of the trade policies, the TRI asses the policies themselves and provide policy handles for national authorities. The index was constructed for the purpose of illustrating a country‟s overall position of the trade policy and allows the measurement of the significant policy interventions.
In line with the International Monetary Fund, for the purpose of the following research the Restrictiveness Index will be calculated by combining the tariff data (measured as 1 + t/100) with the tarrificated Non-Tariff measures and the interview based percentage of bottlenecks. The Restrictiveness Index will be calculated in accordance to the following formula:
Total Tariff Equivalent = Average (Σ (Tariff + (NTM tariff equivalent + Bottlenecks tariff equivalent))
Scenarios
In order to illustrate the effect of removing the bottlenecks and indicate to what extent they should be removed four scenarios will be generated with the help of the GSIM model. The scenarios are designed in such a manner that they provide outputs in terms of welfare effects for producers and consumers as well as government tariff revenues under different levels of reduction in the percentage of the bottlenecks. Also, the assumption is made that with every level of reduction in the percentage share of the bottlenecks the share of trade that passes through the port of Giurgiulesti will increase exponentially. The research starts with the current situation scenario which is aimed at illustrating the current loss that is encountered by shippers at the moment. The scenarios progress to the upper possible limit of totally reducing the bottlenecks created
52
around the port. Reaching the total elimination of goals is very ambitious and highly unrealistic; however the purpose of it is to indicate to the potential welfare gains for the Republic of Moldova in case there were no bottlenecks at all. The four scenarios presented in this research will be: 1) Baseline scenario which will illustrate the current situation, 2) Realistic, which will indicate the potential welfare gains as a result of 25% reduction of the bottlenecks, 3) Moderate, which will indicate the potential welfare gains as a result of 50% reduction of the bottlenecks, 4) and lastly the brave scenario Aspire, that will indicate to the potential welfare gains as a result of a total reduction of the bottlenecks. For the purpose of this research no priority or weight is given to any of the individual bottlenecks as it is at the authorities discretion to choose which bottlenecks should be treated first or to what level they should be treated. It is certain that a reduction of any kind in the level of the bottlenecks will add up to the producers and consumers surplus. However, it is to be noted that certain bottlenecks need special attention, as mentioned before the customs procedures create a lot of trouble in the transportation process and therefore they have to be treated with a higher priority.
Baseline scenario – Current situation
The baseline scenario is the stand point of the entire research as it illustrates the extent of the effect of the bottlenecks on the welfare of the nation. The table below presents the tariff rates and the restrictiveness index of the sample of the countries.
Table 4.4.1 Initial tariff rates* on industrial trade(2010,%)**
Moldova Russia Turkey Ukraine EU27 CSI ROW
Moldova 1 1 1.0489 1 1.044 1 1.048
Russia 1 1 1.08 1 1.081 1 1.087
Turkey 1.01 1.02 1 1.027 1.01 1.02 1.02
Ukraine 1.03 1 1.05 1 1.04 1.05 1.04
EU 27 1 1.02 1 1.03 1 1.02 1.03
CIS 1 1 1.05 1 1.05 1 1.07
ROW 1.11 1.16 1.13 1.16 1.06 1.13 1.13 *Tariff rates are represented as 1 + t, where t= tariff rate/100
**The source countries are presented in the left column, while the destination countries are presented in the first row
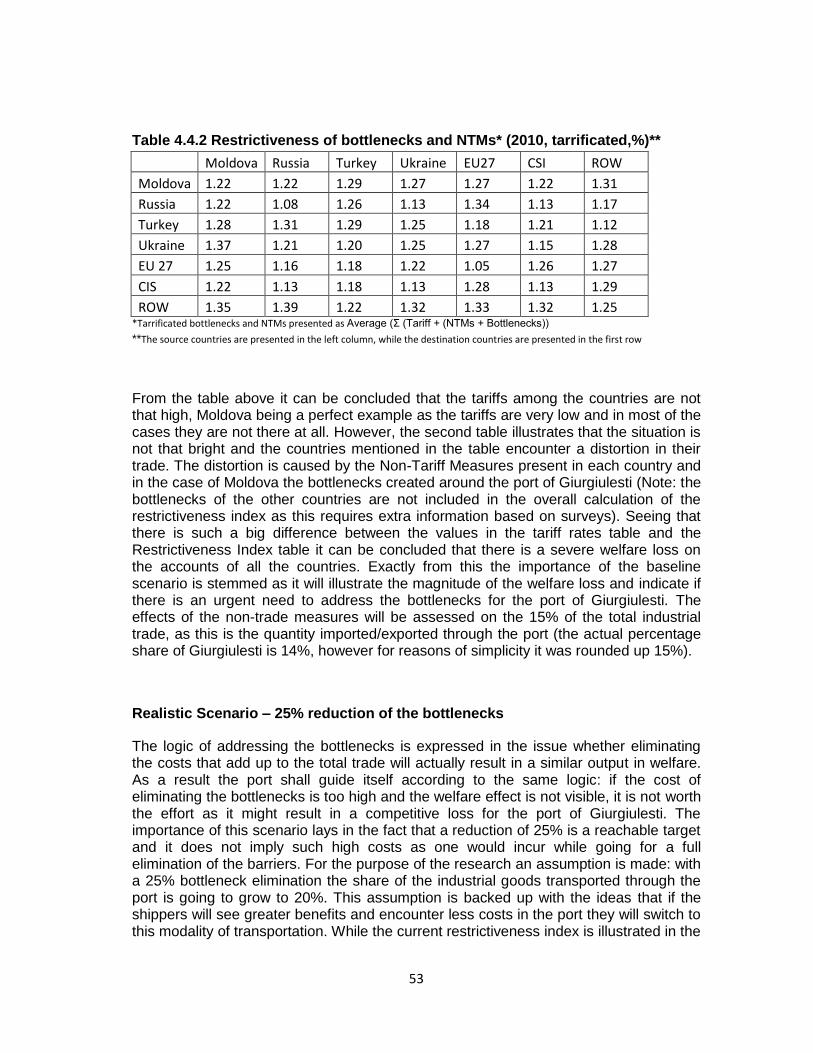
53
Table 4.4.2 Restrictiveness of bottlenecks and NTMs* (2010, tarrificated,%)**
Moldova Russia Turkey Ukraine EU27 CSI ROW
Moldova 1.22 1.22 1.29 1.27 1.27 1.22 1.31
Russia 1.22 1.08 1.26 1.13 1.34 1.13 1.17
Turkey 1.28 1.31 1.29 1.25 1.18 1.21 1.12
Ukraine 1.37 1.21 1.20 1.25 1.27 1.15 1.28
EU 27 1.25 1.16 1.18 1.22 1.05 1.26 1.27
CIS 1.22 1.13 1.18 1.13 1.28 1.13 1.29
ROW 1.35 1.39 1.22 1.32 1.33 1.32 1.25 *Tarrificated bottlenecks and NTMs presented as Average (Σ (Tariff + (NTMs + Bottlenecks))
**The source countries are presented in the left column, while the destination countries are presented in the first row
From the table above it can be concluded that the tariffs among the countries are not that high, Moldova being a perfect example as the tariffs are very low and in most of the cases they are not there at all. However, the second table illustrates that the situation is not that bright and the countries mentioned in the table encounter a distortion in their trade. The distortion is caused by the Non-Tariff Measures present in each country and in the case of Moldova the bottlenecks created around the port of Giurgiulesti (Note: the bottlenecks of the other countries are not included in the overall calculation of the restrictiveness index as this requires extra information based on surveys). Seeing that there is such a big difference between the values in the tariff rates table and the Restrictiveness Index table it can be concluded that there is a severe welfare loss on the accounts of all the countries. Exactly from this the importance of the baseline scenario is stemmed as it will illustrate the magnitude of the welfare loss and indicate if there is an urgent need to address the bottlenecks for the port of Giurgiulesti. The effects of the non-trade measures will be assessed on the 15% of the total industrial trade, as this is the quantity imported/exported through the port (the actual percentage share of Giurgiulesti is 14%, however for reasons of simplicity it was rounded up 15%).
Realistic Scenario – 25% reduction of the bottlenecks
The logic of addressing the bottlenecks is expressed in the issue whether eliminating the costs that add up to the total trade will actually result in a similar output in welfare. As a result the port shall guide itself according to the same logic: if the cost of eliminating the bottlenecks is too high and the welfare effect is not visible, it is not worth the effort as it might result in a competitive loss for the port of Giurgiulesti. The importance of this scenario lays in the fact that a reduction of 25% is a reachable target and it does not imply such high costs as one would incur while going for a full elimination of the barriers. For the purpose of the research an assumption is made: with a 25% bottleneck elimination the share of the industrial goods transported through the port is going to grow to 20%. This assumption is backed up with the ideas that if the shippers will see greater benefits and encounter less costs in the port they will switch to this modality of transportation. While the current restrictiveness index is illustrated in the
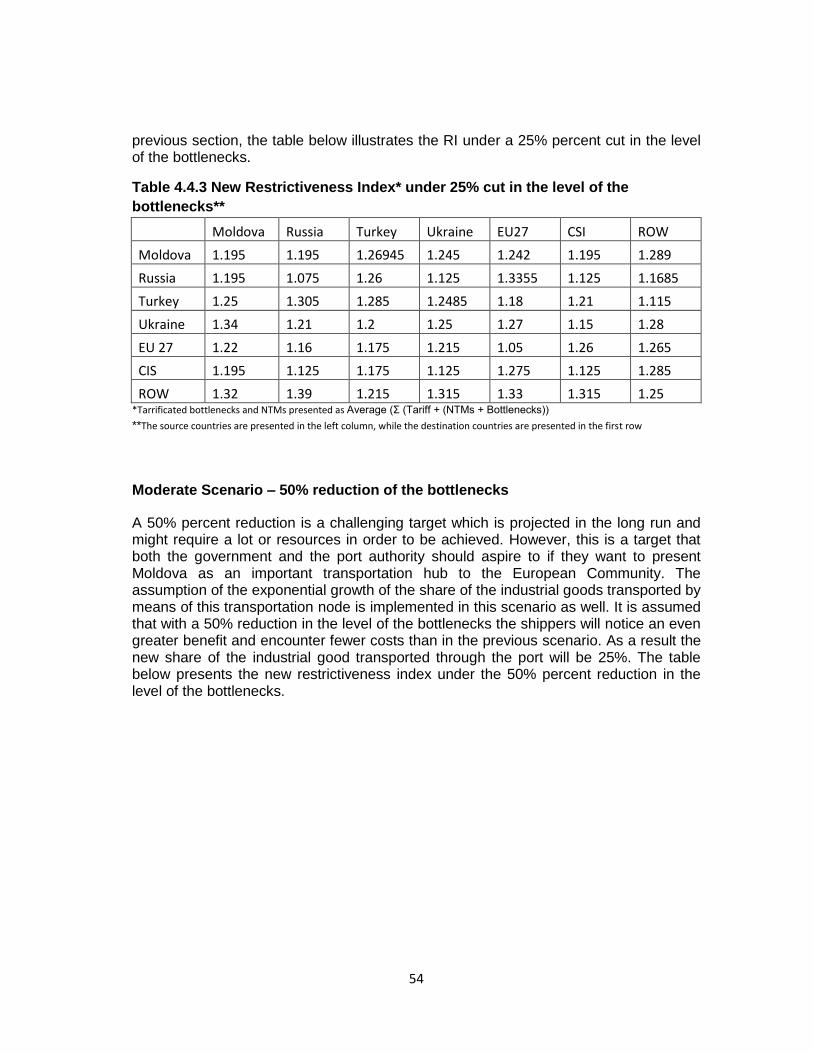
54
previous section, the table below illustrates the RI under a 25% percent cut in the level of the bottlenecks.
Table 4.4.3 New Restrictiveness Index* under 25% cut in the level of the
bottlenecks**
Moldova Russia Turkey Ukraine EU27 CSI ROW
Moldova 1.195 1.195 1.26945 1.245 1.242 1.195 1.289
Russia 1.195 1.075 1.26 1.125 1.3355 1.125 1.1685
Turkey 1.25 1.305 1.285 1.2485 1.18 1.21 1.115
Ukraine 1.34 1.21 1.2 1.25 1.27 1.15 1.28
EU 27 1.22 1.16 1.175 1.215 1.05 1.26 1.265
CIS 1.195 1.125 1.175 1.125 1.275 1.125 1.285
ROW 1.32 1.39 1.215 1.315 1.33 1.315 1.25 *Tarrificated bottlenecks and NTMs presented as Average (Σ (Tariff + (NTMs + Bottlenecks))
**The source countries are presented in the left column, while the destination countries are presented in the first row
Moderate Scenario – 50% reduction of the bottlenecks
A 50% percent reduction is a challenging target which is projected in the long run and might require a lot or resources in order to be achieved. However, this is a target that both the government and the port authority should aspire to if they want to present Moldova as an important transportation hub to the European Community. The assumption of the exponential growth of the share of the industrial goods transported by means of this transportation node is implemented in this scenario as well. It is assumed that with a 50% reduction in the level of the bottlenecks the shippers will notice an even greater benefit and encounter fewer costs than in the previous scenario. As a result the new share of the industrial good transported through the port will be 25%. The table below presents the new restrictiveness index under the 50% percent reduction in the level of the bottlenecks.
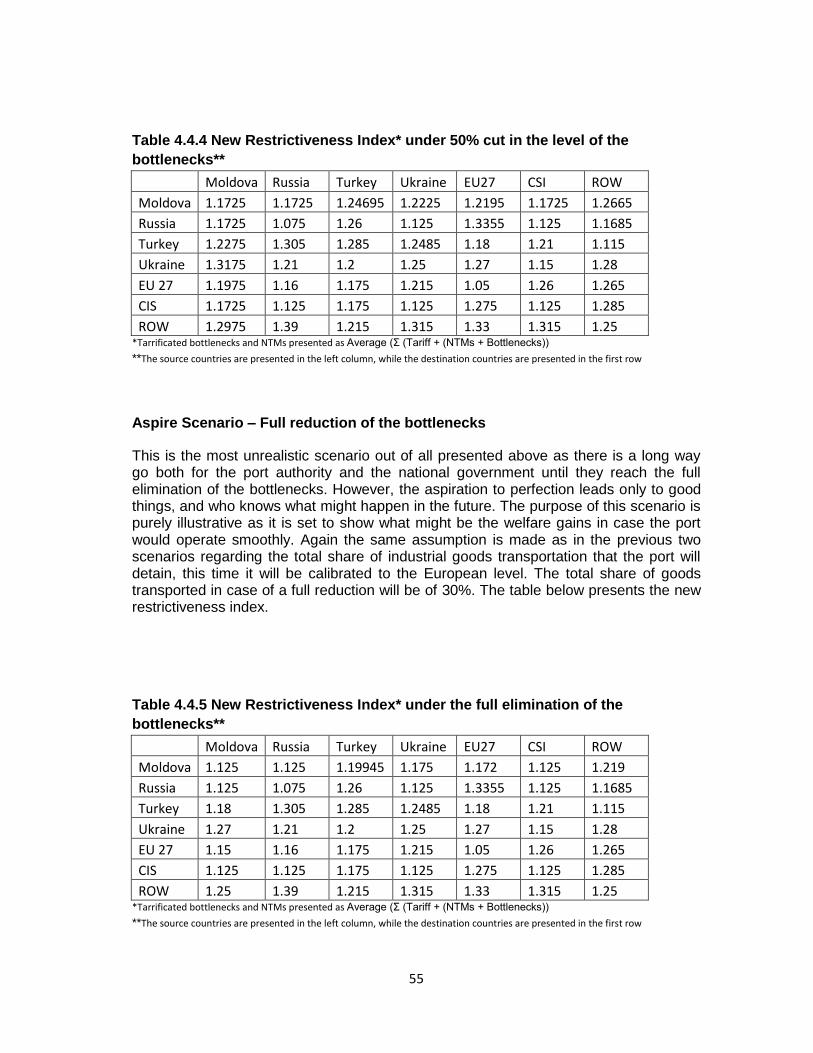
55
Table 4.4.4 New Restrictiveness Index* under 50% cut in the level of the
bottlenecks**
Moldova Russia Turkey Ukraine EU27 CSI ROW
Moldova 1.1725 1.1725 1.24695 1.2225 1.2195 1.1725 1.2665
Russia 1.1725 1.075 1.26 1.125 1.3355 1.125 1.1685
Turkey 1.2275 1.305 1.285 1.2485 1.18 1.21 1.115
Ukraine 1.3175 1.21 1.2 1.25 1.27 1.15 1.28
EU 27 1.1975 1.16 1.175 1.215 1.05 1.26 1.265
CIS 1.1725 1.125 1.175 1.125 1.275 1.125 1.285
ROW 1.2975 1.39 1.215 1.315 1.33 1.315 1.25 *Tarrificated bottlenecks and NTMs presented as Average (Σ (Tariff + (NTMs + Bottlenecks))
**The source countries are presented in the left column, while the destination countries are presented in the first row
Aspire Scenario – Full reduction of the bottlenecks
This is the most unrealistic scenario out of all presented above as there is a long way go both for the port authority and the national government until they reach the full elimination of the bottlenecks. However, the aspiration to perfection leads only to good things, and who knows what might happen in the future. The purpose of this scenario is purely illustrative as it is set to show what might be the welfare gains in case the port would operate smoothly. Again the same assumption is made as in the previous two scenarios regarding the total share of industrial goods transportation that the port will detain, this time it will be calibrated to the European level. The total share of goods transported in case of a full reduction will be of 30%. The table below presents the new restrictiveness index.
Table 4.4.5 New Restrictiveness Index* under the full elimination of the
bottlenecks**
Moldova Russia Turkey Ukraine EU27 CSI ROW
Moldova 1.125 1.125 1.19945 1.175 1.172 1.125 1.219
Russia 1.125 1.075 1.26 1.125 1.3355 1.125 1.1685
Turkey 1.18 1.305 1.285 1.2485 1.18 1.21 1.115
Ukraine 1.27 1.21 1.2 1.25 1.27 1.15 1.28
EU 27 1.15 1.16 1.175 1.215 1.05 1.26 1.265
CIS 1.125 1.125 1.175 1.125 1.275 1.125 1.285
ROW 1.25 1.39 1.215 1.315 1.33 1.315 1.25 *Tarrificated bottlenecks and NTMs presented as Average (Σ (Tariff + (NTMs + Bottlenecks))
**The source countries are presented in the left column, while the destination countries are presented in the first row
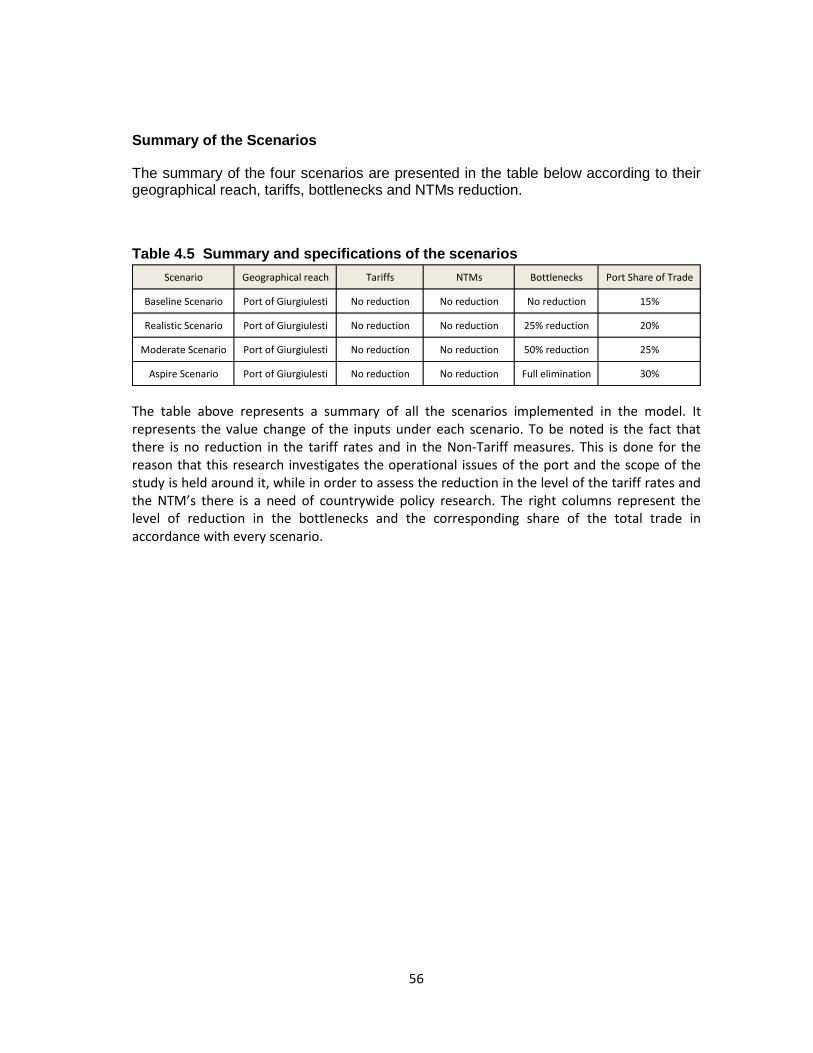
56
Summary of the Scenarios
The summary of the four scenarios are presented in the table below according to their geographical reach, tariffs, bottlenecks and NTMs reduction.
Table 4.5 Summary and specifications of the scenarios
The table above represents a summary of all the scenarios implemented in the model. It represents the value change of the inputs under each scenario. To be noted is the fact that there is no reduction in the tariff rates and in the Non-Tariff measures. This is done for the reason that this research investigates the operational issues of the port and the scope of the study is held around it, while in order to assess the reduction in the level of the tariff rates and the NTM’s there is a need of countrywide policy research. The right columns represent the level of reduction in the bottlenecks and the corresponding share of the total trade in accordance with every scenario.
Scenario Geographical reach Tariffs NTMs Bottlenecks Port Share of Trade
Baseline Scenario Port of Giurgiulesti No reduction No reduction No reduction 15%
Realistic Scenario Port of Giurgiulesti No reduction No reduction 25% reduction 20%
Moderate Scenario Port of Giurgiulesti No reduction No reduction 50% reduction 25%
Aspire Scenario Port of Giurgiulesti No reduction No reduction Full elimination 30%
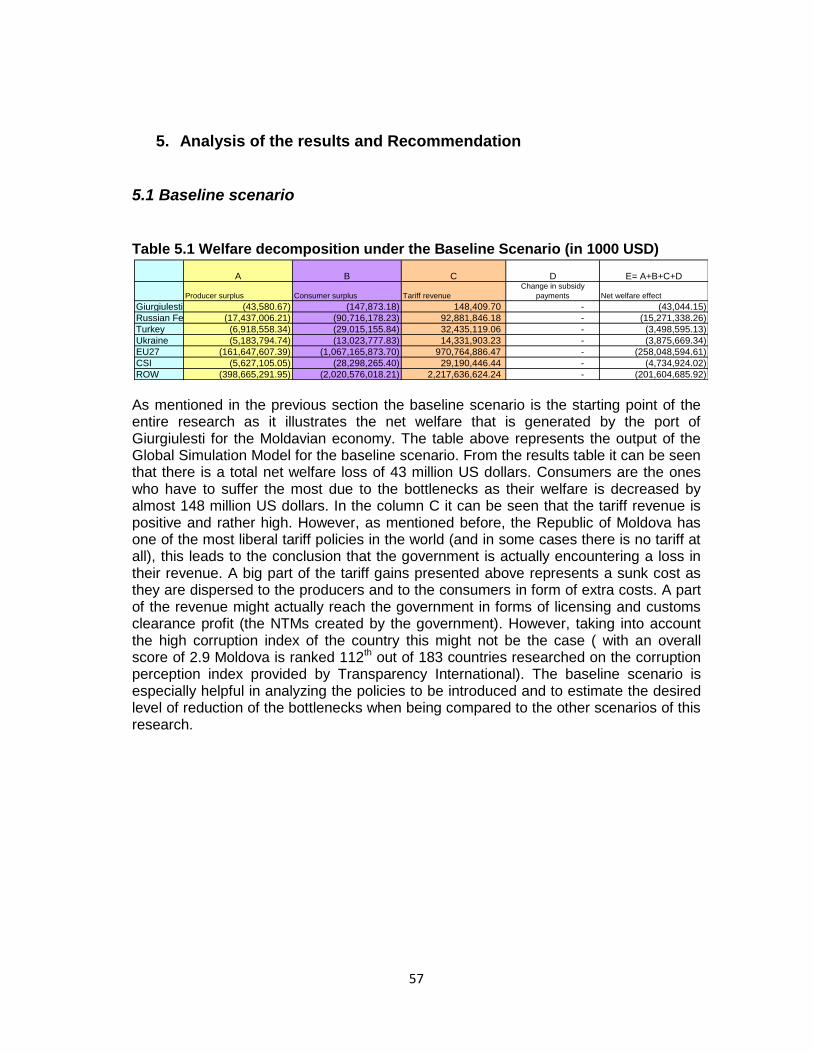
57
5. Analysis of the results and Recommendation
5.1 Baseline scenario
Table 5.1 Welfare decomposition under the Baseline Scenario (in 1000 USD)
As mentioned in the previous section the baseline scenario is the starting point of the entire research as it illustrates the net welfare that is generated by the port of Giurgiulesti for the Moldavian economy. The table above represents the output of the Global Simulation Model for the baseline scenario. From the results table it can be seen that there is a total net welfare loss of 43 million US dollars. Consumers are the ones who have to suffer the most due to the bottlenecks as their welfare is decreased by almost 148 million US dollars. In the column C it can be seen that the tariff revenue is positive and rather high. However, as mentioned before, the Republic of Moldova has one of the most liberal tariff policies in the world (and in some cases there is no tariff at all), this leads to the conclusion that the government is actually encountering a loss in their revenue. A big part of the tariff gains presented above represents a sunk cost as they are dispersed to the producers and to the consumers in form of extra costs. A part of the revenue might actually reach the government in forms of licensing and customs clearance profit (the NTMs created by the government). However, taking into account the high corruption index of the country this might not be the case ( with an overall score of 2.9 Moldova is ranked 112th out of 183 countries researched on the corruption perception index provided by Transparency International). The baseline scenario is especially helpful in analyzing the policies to be introduced and to estimate the desired level of reduction of the bottlenecks when being compared to the other scenarios of this research.
A B C D E= A+B+C+D
Producer surplus Consumer surplus Tariff revenue
Change in subsidy
payments Net welfare effect
Giurgiulesti MDA (43,580.67) (147,873.18) 148,409.70 - (43,044.15)
Russian Fed. (17,437,006.21) (90,716,178.23) 92,881,846.18 - (15,271,338.26)
Turkey (6,918,558.34) (29,015,155.84) 32,435,119.06 - (3,498,595.13)
Ukraine (5,183,794.74) (13,023,777.83) 14,331,903.23 - (3,875,669.34)
EU27 (161,647,607.39) (1,067,165,873.70) 970,764,886.47 - (258,048,594.61)
CSI (5,627,105.05) (28,298,265.40) 29,190,446.44 - (4,734,924.02)
ROW (398,665,291.95) (2,020,576,018.21) 2,217,636,624.24 - (201,604,685.92)
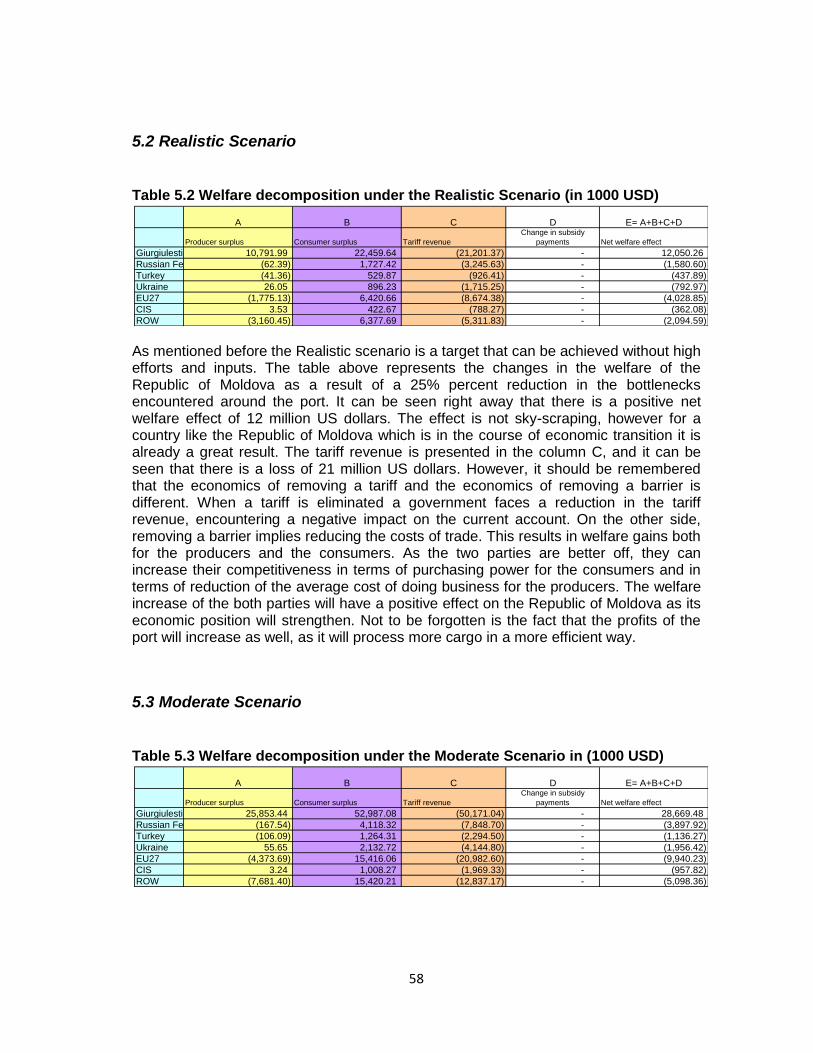
58
5.2 Realistic Scenario
Table 5.2 Welfare decomposition under the Realistic Scenario (in 1000 USD)
As mentioned before the Realistic scenario is a target that can be achieved without high efforts and inputs. The table above represents the changes in the welfare of the Republic of Moldova as a result of a 25% percent reduction in the bottlenecks encountered around the port. It can be seen right away that there is a positive net welfare effect of 12 million US dollars. The effect is not sky-scraping, however for a country like the Republic of Moldova which is in the course of economic transition it is already a great result. The tariff revenue is presented in the column C, and it can be seen that there is a loss of 21 million US dollars. However, it should be remembered that the economics of removing a tariff and the economics of removing a barrier is different. When a tariff is eliminated a government faces a reduction in the tariff revenue, encountering a negative impact on the current account. On the other side, removing a barrier implies reducing the costs of trade. This results in welfare gains both for the producers and the consumers. As the two parties are better off, they can increase their competitiveness in terms of purchasing power for the consumers and in terms of reduction of the average cost of doing business for the producers. The welfare increase of the both parties will have a positive effect on the Republic of Moldova as its economic position will strengthen. Not to be forgotten is the fact that the profits of the port will increase as well, as it will process more cargo in a more efficient way.
5.3 Moderate Scenario
Table 5.3 Welfare decomposition under the Moderate Scenario in (1000 USD)
A B C D E= A+B+C+D
Producer surplus Consumer surplus Tariff revenue
Change in subsidy
payments Net welfare effect
Giurgiulesti MDA 10,791.99 22,459.64 (21,201.37) - 12,050.26
Russian Fed. (62.39) 1,727.42 (3,245.63) - (1,580.60)
Turkey (41.36) 529.87 (926.41) - (437.89)
Ukraine 26.05 896.23 (1,715.25) - (792.97)
EU27 (1,775.13) 6,420.66 (8,674.38) - (4,028.85)
CIS 3.53 422.67 (788.27) - (362.08)
ROW (3,160.45) 6,377.69 (5,311.83) - (2,094.59)
A B C D E= A+B+C+D
Producer surplus Consumer surplus Tariff revenue
Change in subsidy
payments Net welfare effect
Giurgiulesti Mda 25,853.44 52,987.08 (50,171.04) - 28,669.48
Russian Fed. (167.54) 4,118.32 (7,848.70) - (3,897.92)
Turkey (106.09) 1,264.31 (2,294.50) - (1,136.27)
Ukraine 55.65 2,132.72 (4,144.80) - (1,956.42)
EU27 (4,373.69) 15,416.06 (20,982.60) - (9,940.23)
CIS 3.24 1,008.27 (1,969.33) - (957.82)
ROW (7,681.40) 15,420.21 (12,837.17) - (5,098.36)
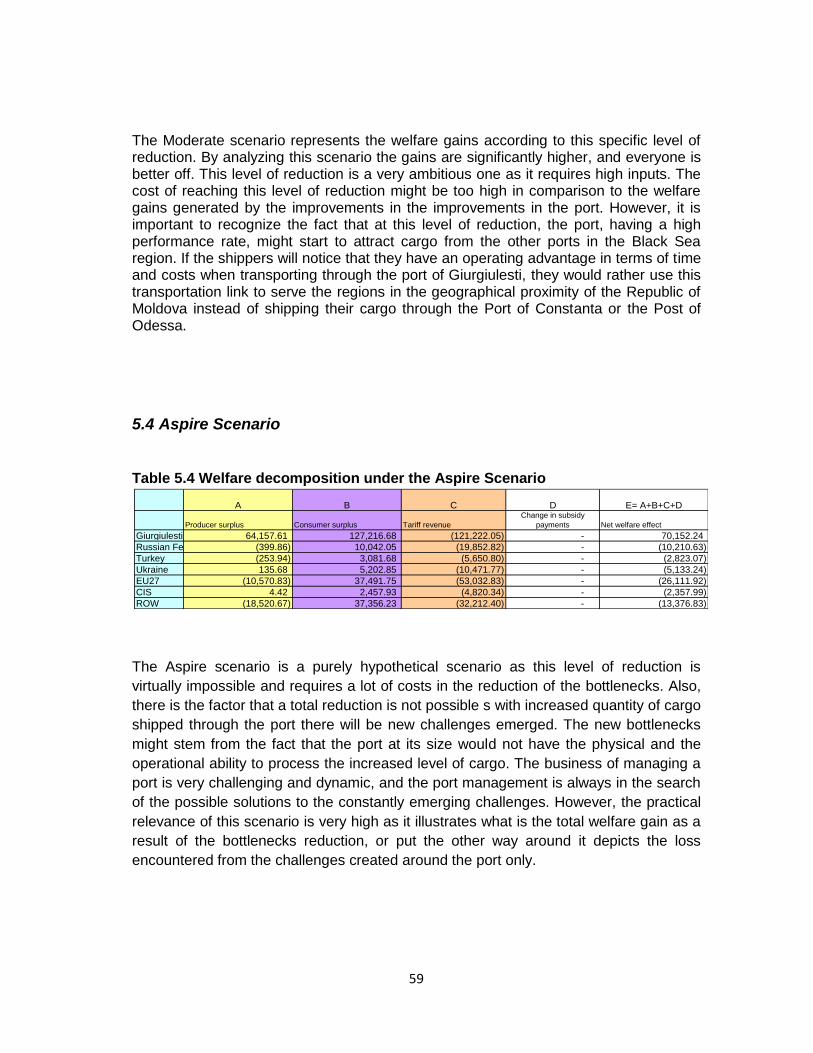
59
The Moderate scenario represents the welfare gains according to this specific level of reduction. By analyzing this scenario the gains are significantly higher, and everyone is better off. This level of reduction is a very ambitious one as it requires high inputs. The cost of reaching this level of reduction might be too high in comparison to the welfare gains generated by the improvements in the improvements in the port. However, it is important to recognize the fact that at this level of reduction, the port, having a high performance rate, might start to attract cargo from the other ports in the Black Sea region. If the shippers will notice that they have an operating advantage in terms of time and costs when transporting through the port of Giurgiulesti, they would rather use this transportation link to serve the regions in the geographical proximity of the Republic of Moldova instead of shipping their cargo through the Port of Constanta or the Post of Odessa.
5.4 Aspire Scenario
Table 5.4 Welfare decomposition under the Aspire Scenario
The Aspire scenario is a purely hypothetical scenario as this level of reduction is
virtually impossible and requires a lot of costs in the reduction of the bottlenecks. Also,
there is the factor that a total reduction is not possible s with increased quantity of cargo
shipped through the port there will be new challenges emerged. The new bottlenecks
might stem from the fact that the port at its size would not have the physical and the
operational ability to process the increased level of cargo. The business of managing a
port is very challenging and dynamic, and the port management is always in the search
of the possible solutions to the constantly emerging challenges. However, the practical
relevance of this scenario is very high as it illustrates what is the total welfare gain as a
result of the bottlenecks reduction, or put the other way around it depicts the loss
encountered from the challenges created around the port only.
A B C D E= A+B+C+D
Producer surplus Consumer surplus Tariff revenue
Change in subsidy
payments Net welfare effect
Giurgiulesti MDA 64,157.61 127,216.68 (121,222.05) - 70,152.24
Russian Fed. (399.86) 10,042.05 (19,852.82) - (10,210.63)
Turkey (253.94) 3,081.68 (5,650.80) - (2,823.07)
Ukraine 135.68 5,202.85 (10,471.77) - (5,133.24)
EU27 (10,570.83) 37,491.75 (53,032.83) - (26,111.92)
CIS 4.42 2,457.93 (4,820.34) - (2,357.99)
ROW (18,520.67) 37,356.23 (32,212.40) - (13,376.83)
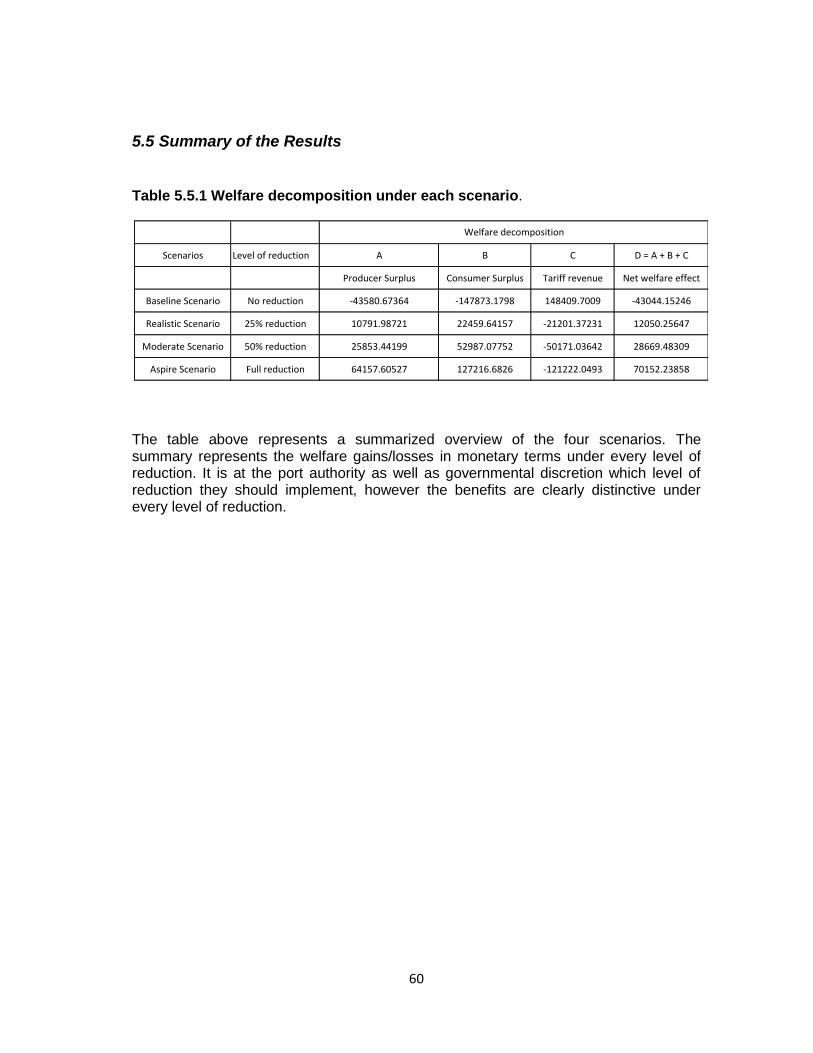
60
5.5 Summary of the Results
Table 5.5.1 Welfare decomposition under each scenario.
The table above represents a summarized overview of the four scenarios. The summary represents the welfare gains/losses in monetary terms under every level of reduction. It is at the port authority as well as governmental discretion which level of reduction they should implement, however the benefits are clearly distinctive under every level of reduction.
Scenarios Level of reduction A B C D = A + B + C
Producer Surplus Consumer Surplus Tariff revenue Net welfare effect
Baseline Scenario No reduction -43580.67364 -147873.1798 148409.7009 -43044.15246
Realistic Scenario 25% reduction 10791.98721 22459.64157 -21201.37231 12050.25647
Moderate Scenario 50% reduction 25853.44199 52987.07752 -50171.03642 28669.48309
Aspire Scenario Full reduction 64157.60527 127216.6826 -121222.0493 70152.23858
Welfare decomposition
61
6. Conclusions
This thesis covers only a few main aspects of current situation and the future possible economic impact of the port of Giurgiulesti on the economy of the Republic of Moldova. Despite the fact that this research does not cover the entire range of problems encountered in the process of maritime trade for the Republic of Moldova, it is highly believed that it will address the need of further research on the Port of Giurgiulesti in general as it is lacking at the moment.
The first part of this paper has an introductory role as it made an extensive overview of the current economic situation of the Republic of Moldova and its transport sector. It answers to the following sub-question: “What are the current economic situation and the main characteristics of the transport sector of the Republic of Moldova?” By providing an economic overview Moldova‟s main trading partners were identified, which at a later stage were used as a country set matrix for the GSIM model. Furthermore, in the context of Moldova‟s future economic development plans, the transport and its main challenges were presented. The role of this chapter was to present the strong link between the economic development and the transport sector, as well as the need to reform the transport infrastructure in order to achieve the envisioned goals. More than that, the overview of the transport sector helped at identifying potential bottlenecks such as: the road infrastructure that connects the port and the national road system, as well as the connectivity issue among the modes of transport.
The role of the second chapter was to provide an overview of the literature on the topic of Port Impact studies and to find the appropriate methodology to investigate the economic impact of removing the bottlenecks in the Port of Giurgiulesti an to answer to the second sub-question: “How to measure the economic effects of ports?”The review started with an outline of the early Port Impact Studies and the variables that were used in order to conduct these. Also, the Input-Output models were introduced by specifying the academic research employing them. Finally, the equilibrium models were introduced. The literature review provides an extensive overview of the equilibrium models by introducing the General Equilibrium Models and the Partial Equilibrium Models. Here it is argued that the equilibrium models are the best solution for investigating the impact of the port. The two models are compared in terms of data requirements, ease of performing them and the applicability to the case of the Port of Giurgiulesti. It was concluded that a Partial Equilibrium model is the right choice, as it does not require a lot of inputs, the results are traceable to the data sources, and is easier to construct than a General Equilibrium Model. Also, the motivation behind choosing the Global Simulation Model is displayed in this chapter as well as the description and the benefits of using this model.
The following chapter serves as an illustration of the trade restrictive measures encountered by the companies engaging in the transportation process through the Port of Giurgiulesti, namely the Non-Tariff Measures and the bottlenecks encountered around the port. The chapter answers to the third sub-question:“What are the trade restrictive measures encountered by the port users?” First, the NTM‟s are presented and quantified. The following step was to introduce the concept of a bottleneck, and identify the port specific challenges. Above all, it can be hoped that this research has confirmed the benefits of moving ahead of the current situation and answer the question
62
on the required level of barrier reduction. First of all, there was a need to assess the situation around the port and indentify whether the companies using this infrastructure unit in their transportation process encounter any bottlenecks. In order to explore the difficulties encountered in the process of maritime transportation, interviews were conducted with three companies that use this node of transportation. The interview results offer an effective starting point for a deeper exploration of the types of bottlenecks and their monetary quantification. Due to the fact that there were divergent ideas among the companies on the weights of the bottlenecks, a general average was made. As a result, the extra tariff was derived for further investigation of its effect. A timely consuming process was the data gathering. However, thanks to organizations like World Bank, World Integrated Trade Solutions, International Monetary Fund, and databases like GTAP and TRAINS who provide most of the data, the construction of the model was possible.
The research question, which was explored in the first part of this thesis, has thus far been a staple topic of the practical discussions concerning port of Giurgiulesti. Starting from this point the paper investigates the fourth sub-question presented in the introductory chapter: “What is the potential result of reducing the bottlenecks in terms of welfare gains?” The model was design to provide four scenarios illustrating the welfare gain or loss encountered due to the challenges face by the shippers. The first scenario was the foundation of the entire research as its main purpose was to indicate whether it is worth continuing with the research, as it illustrates whether the bottlenecks are creating an economic distortion worth studying. After the first scenario was simulated it was clear that there is a need of further investigation as the results were negative. The second scenario was designed in such a way that it represented a reachable goal. According 25% total bottleneck level of reduction scenario it is possible to conclude that even under the lowest reduction point a clear benefit is seen in terms of welfare gains on both the consumer and the producer account. In view of the results it can be concluded that an improvement is needed. The third scenario had the purpose of illustrating the benefits of a 50% bottleneck reduction. This is not necessarily a reduction that has to be done in the near future as might require high inputs. However, this scenario serves the role of proving the fact that there is always a need of improvement as higher benefits can be derived. The fourth scenario provides hypothetical results as it is not entirely clear if this level of reduction will ever be reached taking into account the current economic situation of the Republic of Moldova. However, the main purpose of this scenario was to depict the exact amount of welfare that is lost due to barriers that interrupt trade, and as illustrated in the results section, it might not be so high for a developed nation; however it represents a high gain for small and vulnerable economy.
Although the research does not cover the entire trade of the country it clearly answers to the research questions presented in the introduction. First of all it proves the existence of the challenges and specifies the extent to which it distorts trade. Despite the fact that it does not indicate the precise measures that have to be taken in order to eliminate them, it proves the motive of their elimination. The central question of the research is answered in terms of welfare gains and losses under each scenario. Even under a hypothetical slight reduction there will be positive changes in the welfare and the port output. What is most important is the fact that under every scenario the
63
government does not lose a lot in terms of tariff revenue as the tariff loses presented in the output tables are redistributed among the producers and the consumers in form of general welfare.
Although this research does not cover all the aspects of the maritime trade it serves well at indicating that there are problems, and their solution will have positive impacts both for the port and for the Moldavia in general. It is also highly anticipated that this research, although being not that extensive, will draw the attention of the interested parties to provide a greater deal of attention to issue in the case, and work together at providing an operational solution.
6.1 Regulatory and Managerial Recommendations
As it has been previously discussed there is a quite extensive set of bottlenecks which create obstacles for a normal operational and commercial activity in the port. The Giurgiulesti harbor is on an early stage of development as the project has only been initiated in the beginning of 2009 thus the earlier mentioned problems could not be eliminated yet. All the three groups of the analyzed bottlenecks have a serious impact on the ability of the port to operate and develop. The reduction of the barriers would certainly have a beneficial effect on the entire prosperity of the business entity as it would allow the port to handle much bigger amounts of cargo as well as reduce the waiting times.
The interviewed companies state that if the currently existing bottlenecks would be diminished the port would become much more attractive as a transportation node. According to Elpo SRL the additional costs created by the holdups are sometimes too high and thus the company has to use alternative transportation modes in order to cut the expenditures.
As discussed earlier the bottlenecks have been divided in three categories: internal, regulatory and external. Unfortunately the port authority can take measures only for influencing the internal set. But at the same time these barriers are the ones that have the greatest impact on the operability of the harbor. As an example the lack of the IT supporting systems can be taken. This issue lies entirely in the control of the port authority. The management of the harbor should give a very serious attention to this issue as the entire operationally of the port depends directly on it. The IT systems represent the core of the operations control and give the possibility to make much more précised projections as well as improve the security of the goods and personnel on the territory of the harbor.
Another serious problem which lowers quite consistently the handling capacity of the port is the problem with the operational equipment. The lack of equipment in the port does not permit use the capacity on the maximum level. An improvement in the quantity and of course the quality of the equipment and of the personnel training would boost the amounts of the cargo handled immediately. The interviewed firms unanimously state that if the problem with the operational inefficiencies would be solved the cargo flows through the port would increase in a very significant proportion. This would be beneficial for the both sides the port, as the handling capacity would increase, as well as for the
64
partner companies which would be able to raise the volumes of the traded goods through the harbor- a fact which would finally help to reduce the costs and improve the preciseness of the schedules.
It is also important to mention the significance of the port of Giurgiulesti as a transportation node for the Republic of Moldova is increasing day by day. Many of the local companies prefer to deliver the goods by sea as by this a large amount of costs can be cut. But due to some bottlenecks like the corruption and bad maintenance of the state infrastructure the volumes transfer through the port cannot exceed certain levels. The Moldavian government should draw the attention on creating certain state programs which would help to address the discussed issues. The fact that Giurgiulesti is a private port should not reduce the cooperation with the government body, as they both have a unanimous goal – creating a transportation hub around the port. The improvement agenda should start with the cooperation on improving the road infrastructure that leads to the port.
6.2 Limitations and future direction of research
There are more limitations encountered during this research and this section of the paper is going to present them. The port of Giurgiulesti is a new port, and no one yet made the effort of studying its significance for the Republic of Moldova. As a result there is not much analysis on the issue as well as the fact that there is almost no data available for the general public. Other issue encountered while writing this paper was the data availability. It is especially unfortunate that the NTM‟s data was not available and a more precise analysis was not performed. Also, as mentioned before only three companies were interviewed for the purpose of the quantification of the bottlenecks. If more companies would provide their opinion on the values of the bottlenecks the research would have a higher validity. However, this limitation is backed up with the fact that at the moment there are not that many companies operating in the port of Giurgiuleti as well as the fact that the time frame of the research was only two months which does not allow a wider scope for the research.
As for the future research it would be advised that scholars look into more detail in the source and the quantification of the NTM‟s in the Moldavian case, or at least investigate how these trade barriers can be delimited from the port. More than that an interesting topic for research would be to analyze the relationship between the port of Giurgiulesti and the Moldavian Government, and what are their strategies in achieving the desired result of becoming an important transportation hub. This is particularly interesting due to the fact that the Giurgiulesti is a private port, and it is not entirely clear at the moment if the long-run goals of the two parties involved in the decision process are aligned. Most important, in line with this research is to answer in the near future to the question of exactly how high will be the cost of improving the port performance on every level of reduction. Also, in order to provide valuable results other types of methodologies can be employed to study the subject in the matter. For example, a General Equilibrium model could be performed in order to assess the economic impact of the Port of Giurgiulesti, in that case results would be more extensive as they would cover a wider range of
65
elements. However, there is always an issue with the General Equilibrium model, they require a vast amount of inputs and therefore being very time consuming in the nature.

66
67
Bibliography
1. Anderson, G.K. (1964) The port of Ensenada: A report on economic development. San Diego state college.
2. Andriamananjara, S., et al. (2004) “The Effects of Non-Tariff Measures on Prices, Trade, and Welfare: CGE Implementation of Policy-Based Price Comparisons,” U.S. International Trade Commission Office of Economics. Working Paper EC2004-04-A, Washington, DC: USITC
3. Armenakis, A. A., Moore, H.J., Peden G.T. (1970)Inland Port Facilities and Economic Growth, Mississippi State University, Bureau of Business and Economic Research
Baltic Tangent (2006) Report on general infrastructure bottlenecks in the Baltic Tangent.
4. Bodewig, K. (2007) The Economic situation in Moldova. Committee Reports. 2007 Annual
sessions, NATO Parliamentary assembly.
5. BURNETT, P., CULTER, H. and THRESHER, R. (2007) The impact of tourism for a small city: A CGE approach,Journal of Regional Analysis and Policy.37: 233-242.
6. Carew, J.P. (1975) Port of Stockton: Phase 2: Economic Impact of the Port of Stockton on the Stockton Economy 1973-1974.
7. Conn, R.L., Flewellen, W.C., Penden, G.T. (1966) An Assesment of Major Benefits to Mississippi from waterborn commerce. Mississippi state University: Bureau of Business and
Economic Research.
8. Coppens, F., Lagneaux, F., Meersman, H., Sellekaerts, N. (2007) ECONOMIC IMPACT OF PORT ACTIVITY: A DISAGGREGATE ANALYSIS. The case of Antwerp.NATIONAL BANK OF BELGIUM.Working Papers – Policy documents.
9. 'Country Intelligence: Report: Moldova' (2012) Moldova Country Monitor.pp. 1-25, Business
Source Premier
10. Desalvo, J.S., (1994) Measuring the direct impacts of a port, Transportation Journal. 33(4),
pp. 33-33.
11. Doi, M., Tiwari, P., and Itoh, H. (2001) A computable general equilibrium analysis of efficiency improvements at Japanese ports,Review of Urban and Regional Development Studies.13: 187-206.
12. Enarsson, L. (2006), Future Logistics Challenges, First Edition, Copenhagen Business School.
13. EUROPEAN COMMISSION (2011) Implementation of the European Neighborhood Policy in
2010,Country report: Republic of Moldova. Brussels, 25/05/2011, SEC(2011) 643
14. Ferrantino, M. (2006) "Quantifying the Trade and Economic Effects of Non-Tariff Measures", OECD Trade Policy Working Papers.No. 28, OECD Publishing.
68
15. Gillespie, G., McGregor, P. G., SWALES, J. K. and Yin, Y. P. (2001) The displacement and multiplier effects of regional selective assistance: A computable general equilibrium analysis. Regional Studies, 35: 125-139.
16. International Monetary Fund (2005) Review of the IMF‟s Trade Restrictiveness Index. Policy Development and Review Department
17. Kuzeljevich, J., (2004) Breaking the bottleneck, Canadian Transportation Logistics. 107(10),
pp. 42-42,44.
18. Kwak, S. J., Yoo, S. H. and Chang, J. I. (2005) The role of the maritime industry in the Korean national economy: An input–output analysis. Marine Policy, 29: 371-383
19. Lakshmanan, T.R. (2011) 'The broader economic consequences of transport infrastructure investments', Journal Of Transport Geography. 19, 1, pp. 1-12
20. Lee T., LeeP.T, Chen T. (2012), ECONOMIC IMPACT ANALYSIS OF PORT DEVELOPMENT ON THE SOUTH AFRICAN ECONOMY. South African Journal of Economics. Vol. 80 issue 2
21. Manifold, D. and W. Donnelly (2005) “A Compilation from Multiple Sources of Reported Measures Which May Affect Trade,” in P. Dee and M. Ferrantino (eds.), Quantitative Measures for Assessing the Effect of Non-Tariff Measures and Trade Facilitation, Singapore: World
Scientific Ltd. for APEC, pp. 41-50.
22. Mas-Colell (1995) Microeconomic Theory,Revista de economiaaplicada.Número 9 (vol. iii),
1995, págs. 165 a 169.Oxford University Press.
23. McGregor, P. G., Swales, J. K. and Yin, Y. P. (1996) A long-run interpretation of regional input-output analysis,Journal of Regional Science. 36: 479-501
24. 'Moldova: Remittances Are The Key' (2006) Emerging Markets Monitor, 11, 42, p. 17, Business Source Premier, EBSCOhost
25. Moon, S. H. (1995) Port economic impact model (PIM) and its planning applications. Maritime Policy and Management, 22(4): 363-387.
26. Panagariya, A. and R. Duttagupta (2001) The “Gains” from Preferential Trade Liberalization
in the CGE Models: Where do they Come From? in S. Lahiri (ed.), Regionalism and
Globalization: Theory and Practice, London and New York: Routledge: 39-60.
27. Pillai, M (2008) 'Special Economic Zones of India: Controversial Paradigms of Economic Growth and Infrastructure Development', ICFAI Journal Of Infrastructure, 6, 4, pp. 74-84, Business Source Premier, EBSCOhost, viewed 15 August 2012.
28. Prohnitchi V., Popa A., Oprunenco A., Luecke M., Tekce M. (2009) A Free Trade Area between the Republic of Moldova and the European Union: Feasibility, Perspectives and Potential Impact. Independent Analytical Center Expert Group.
29. Ricardo J Sánchez (2003) Port Efficiency and International Trade: Port Efficiency as a Determinant of Maritime Transport Costs,Maritime Economics & Logistics. (2003) 5, 199–218.
30. Rickman, D. S. and Treyz, G. I. (1993) Alternative labor market closures in a regional model. Growth and Change, 24: 32-50
69
31. Rose, A. (1995). Input-output economics and computable general equilibrium models,Structural Change and Economic Dynamics. 6: 295-304
32. UNCTAD (United Nations Conference on Trade and Development) (1996), A Users‟ Manual for TRAINS (Trade Analysis and Information System). UNCTAD, Geneva.
33. Van der Linden, J. A. (2001) The economic impact study of maritime policy issues: Application to the German case,Maritime Policy and Management. 28(1): 33-54.
34. Warf, B. and Cox, J. (1989)The changing economic impacts of the port of New York,Maritime Policy and Management. 16(1): 3-11.
35. Walkenhorst, P. and T. Yasui (2005) “Benefits of Trade Facilitation: A Quantitative Assessment,” in P. Dee and M. Ferrantino (eds.), Quantitative Measures for Assessing the
36. Effect of Non-Tariff Measures and Trade Facilitation. Singapore: World Scientific Ltd. for
APEC, pp. 161-192
37. Wing I.S (2004) Computable General Equilibrium Models and Their Use in Economy-Wide Policy Analysis: Everything You Ever Wanted to Know (But Were Afraid to Ask). Computable General Equilibrium Models and Their Use in Economy-Wide Policy Analysis. Center for Energy & Environmental Studies and Department of Geography & Environment Boston University and Joint Program on the Science & Policy of Global Change Massachusetts Institute of Technology
38. Wilson, J., C. Mann, and T. Otsuki, (2005) “Assessing the Potential Benefit of Trade Facilitation: A Global Perspective,” in P. Dee and M. Ferrantino (eds.), Quantitative Measures for Assessing the Effect of Non-Tariff Measures and Trade Facilitation, Singapore: World Scientific
Ltd. for APEC, pp. 121-160.
39. World Bank, (2002) Moldova: Transport Strategy Update With Emphasis on the Road Sector, Europe and Central Asia Region, Energy and Infrastructure Unit,Transport Sector.
December 2002
40. WorldBank, “Moldova: Trade Brief”, http://info.worldbank.org/etools/wti/docs/wti2008/brief127.pdf
41. Transparency International official website. http://www.transparency.org/country#MDA
viewed on 8/19/12 at 05:00
42. Customs Department Order (OSV) no. 361/ 25.09.2007
43. Moldavian Customs department official website http://www.customs.gov.md/index.php?id=1260 viewed at 8/11/12 at 21:21
44. Moldavian Chamber of Commerce official website. http://chamber.md/
45. Moldavian Economic Chamber official website. http://www.mec.gov.md/rapoarte-portul-international-liber-giurgiulesti/ viewed on 15/08/2012 at 20:00
46. Port of Giurgiulesti official website. http://www.gifp.md/en/page/61/Terminalul-de-Produse-Cerealiere viewed on 15/08/2012 at 21:00

70
47. Eurostat:http://epp.eurostat.ec.europa.eu/statistics_explained/index.php/Freight_transport_statistics viewed on 15/08/2012 at 22:00
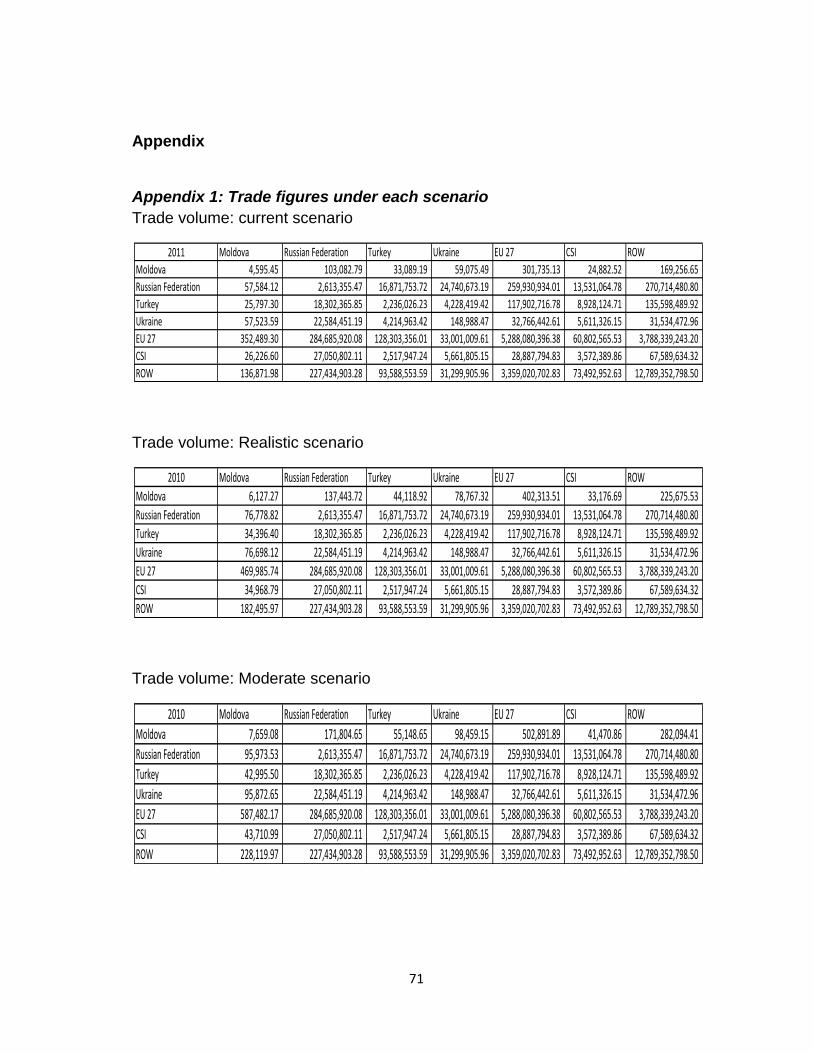
71
Appendix
Appendix 1: Trade figures under each scenario
Trade volume: current scenario
Trade volume: Realistic scenario
Trade volume: Moderate scenario
2011 Moldova Russian Federation Turkey Ukraine EU 27 CSI ROW
Moldova 4,595.45 103,082.79 33,089.19 59,075.49 301,735.13 24,882.52 169,256.65
Russian Federation 57,584.12 2,613,355.47 16,871,753.72 24,740,673.19 259,930,934.01 13,531,064.78 270,714,480.80
Turkey 25,797.30 18,302,365.85 2,236,026.23 4,228,419.42 117,902,716.78 8,928,124.71 135,598,489.92
Ukraine 57,523.59 22,584,451.19 4,214,963.42 148,988.47 32,766,442.61 5,611,326.15 31,534,472.96
EU 27 352,489.30 284,685,920.08 128,303,356.01 33,001,009.61 5,288,080,396.38 60,802,565.53 3,788,339,243.20
CSI 26,226.60 27,050,802.11 2,517,947.24 5,661,805.15 28,887,794.83 3,572,389.86 67,589,634.32
ROW 136,871.98 227,434,903.28 93,588,553.59 31,299,905.96 3,359,020,702.83 73,492,952.63 12,789,352,798.50
2010 Moldova Russian Federation Turkey Ukraine EU 27 CSI ROW
Moldova 6,127.27 137,443.72 44,118.92 78,767.32 402,313.51 33,176.69 225,675.53
Russian Federation 76,778.82 2,613,355.47 16,871,753.72 24,740,673.19 259,930,934.01 13,531,064.78 270,714,480.80
Turkey 34,396.40 18,302,365.85 2,236,026.23 4,228,419.42 117,902,716.78 8,928,124.71 135,598,489.92
Ukraine 76,698.12 22,584,451.19 4,214,963.42 148,988.47 32,766,442.61 5,611,326.15 31,534,472.96
EU 27 469,985.74 284,685,920.08 128,303,356.01 33,001,009.61 5,288,080,396.38 60,802,565.53 3,788,339,243.20
CSI 34,968.79 27,050,802.11 2,517,947.24 5,661,805.15 28,887,794.83 3,572,389.86 67,589,634.32
ROW 182,495.97 227,434,903.28 93,588,553.59 31,299,905.96 3,359,020,702.83 73,492,952.63 12,789,352,798.50
2010 Moldova Russian Federation Turkey Ukraine EU 27 CSI ROW
Moldova 7,659.08 171,804.65 55,148.65 98,459.15 502,891.89 41,470.86 282,094.41
Russian Federation 95,973.53 2,613,355.47 16,871,753.72 24,740,673.19 259,930,934.01 13,531,064.78 270,714,480.80
Turkey 42,995.50 18,302,365.85 2,236,026.23 4,228,419.42 117,902,716.78 8,928,124.71 135,598,489.92
Ukraine 95,872.65 22,584,451.19 4,214,963.42 148,988.47 32,766,442.61 5,611,326.15 31,534,472.96
EU 27 587,482.17 284,685,920.08 128,303,356.01 33,001,009.61 5,288,080,396.38 60,802,565.53 3,788,339,243.20
CSI 43,710.99 27,050,802.11 2,517,947.24 5,661,805.15 28,887,794.83 3,572,389.86 67,589,634.32
ROW 228,119.97 227,434,903.28 93,588,553.59 31,299,905.96 3,359,020,702.83 73,492,952.63 12,789,352,798.50
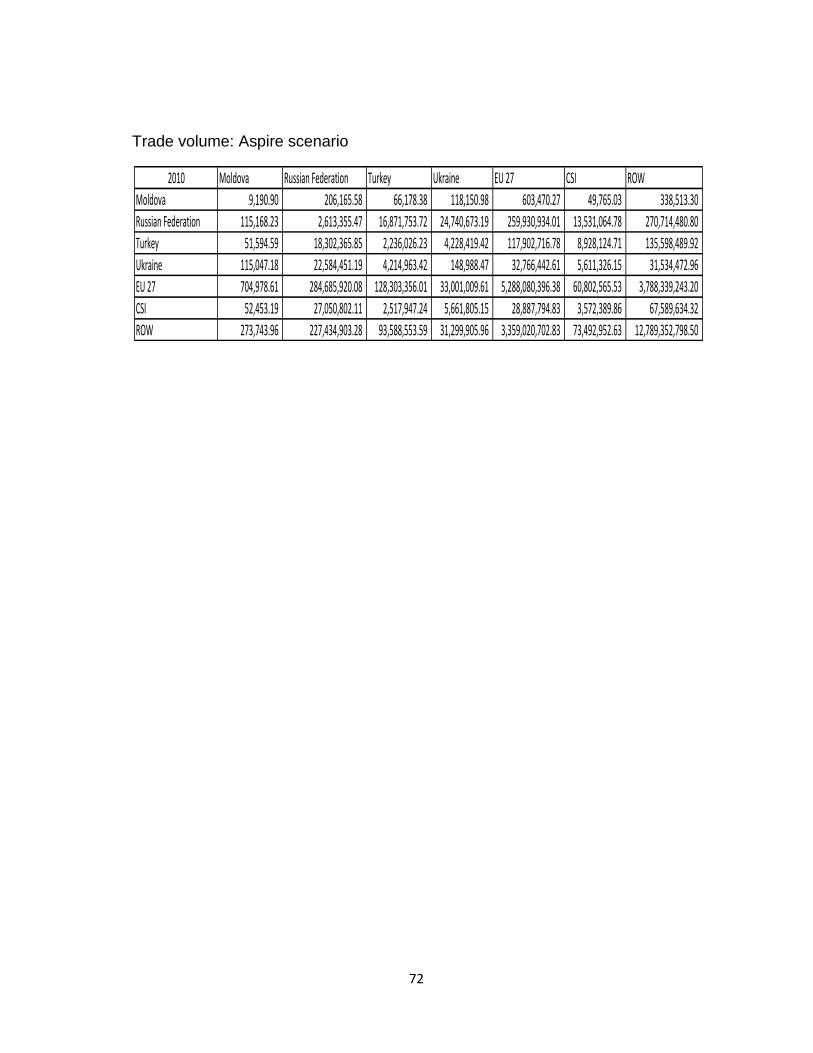
72
Trade volume: Aspire scenario
2010 Moldova Russian Federation Turkey Ukraine EU 27 CSI ROW
Moldova 9,190.90 206,165.58 66,178.38 118,150.98 603,470.27 49,765.03 338,513.30
Russian Federation 115,168.23 2,613,355.47 16,871,753.72 24,740,673.19 259,930,934.01 13,531,064.78 270,714,480.80
Turkey 51,594.59 18,302,365.85 2,236,026.23 4,228,419.42 117,902,716.78 8,928,124.71 135,598,489.92
Ukraine 115,047.18 22,584,451.19 4,214,963.42 148,988.47 32,766,442.61 5,611,326.15 31,534,472.96
EU 27 704,978.61 284,685,920.08 128,303,356.01 33,001,009.61 5,288,080,396.38 60,802,565.53 3,788,339,243.20
CSI 52,453.19 27,050,802.11 2,517,947.24 5,661,805.15 28,887,794.83 3,572,389.86 67,589,634.32
ROW 273,743.96 227,434,903.28 93,588,553.59 31,299,905.96 3,359,020,702.83 73,492,952.63 12,789,352,798.50
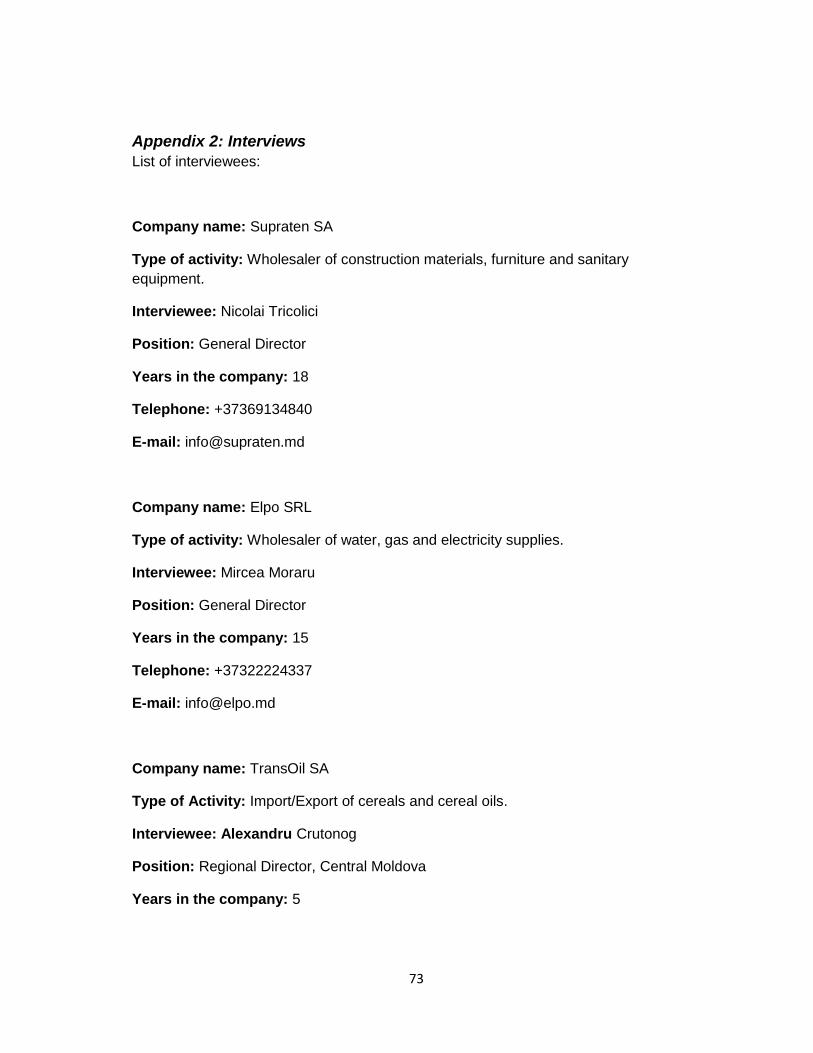
73
Appendix 2: Interviews
List of interviewees:
Company name: Supraten SA
Type of activity: Wholesaler of construction materials, furniture and sanitary
equipment.
Interviewee: Nicolai Tricolici
Position: General Director
Years in the company: 18
Telephone: +37369134840
E-mail: [email protected]
Company name: Elpo SRL
Type of activity: Wholesaler of water, gas and electricity supplies.
Interviewee: Mircea Moraru
Position: General Director
Years in the company: 15
Telephone: +37322224337
E-mail: [email protected]
Company name: TransOil SA
Type of Activity: Import/Export of cereals and cereal oils.
Interviewee: Alexandru Crutonog
Position: Regional Director, Central Moldova
Years in the company: 5
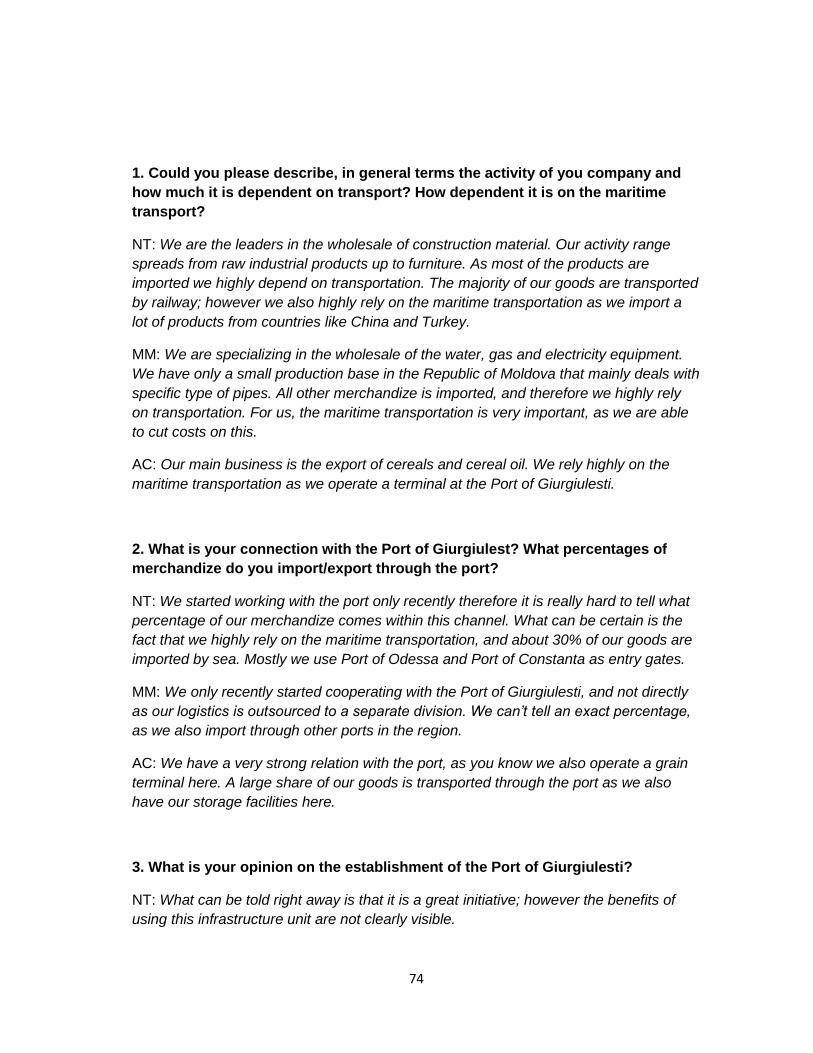
74
1. Could you please describe, in general terms the activity of you company and
how much it is dependent on transport? How dependent it is on the maritime
transport?
NT: We are the leaders in the wholesale of construction material. Our activity range
spreads from raw industrial products up to furniture. As most of the products are
imported we highly depend on transportation. The majority of our goods are transported
by railway; however we also highly rely on the maritime transportation as we import a
lot of products from countries like China and Turkey.
MM: We are specializing in the wholesale of the water, gas and electricity equipment.
We have only a small production base in the Republic of Moldova that mainly deals with
specific type of pipes. All other merchandize is imported, and therefore we highly rely
on transportation. For us, the maritime transportation is very important, as we are able
to cut costs on this.
AC: Our main business is the export of cereals and cereal oil. We rely highly on the
maritime transportation as we operate a terminal at the Port of Giurgiulesti.
2. What is your connection with the Port of Giurgiulest? What percentages of
merchandize do you import/export through the port?
NT: We started working with the port only recently therefore it is really hard to tell what
percentage of our merchandize comes within this channel. What can be certain is the
fact that we highly rely on the maritime transportation, and about 30% of our goods are
imported by sea. Mostly we use Port of Odessa and Port of Constanta as entry gates.
MM: We only recently started cooperating with the Port of Giurgiulesti, and not directly
as our logistics is outsourced to a separate division. We can’t tell an exact percentage,
as we also import through other ports in the region.
AC: We have a very strong relation with the port, as you know we also operate a grain
terminal here. A large share of our goods is transported through the port as we also
have our storage facilities here.
3. What is your opinion on the establishment of the Port of Giurgiulesti?
NT: What can be told right away is that it is a great initiative; however the benefits of
using this infrastructure unit are not clearly visible.
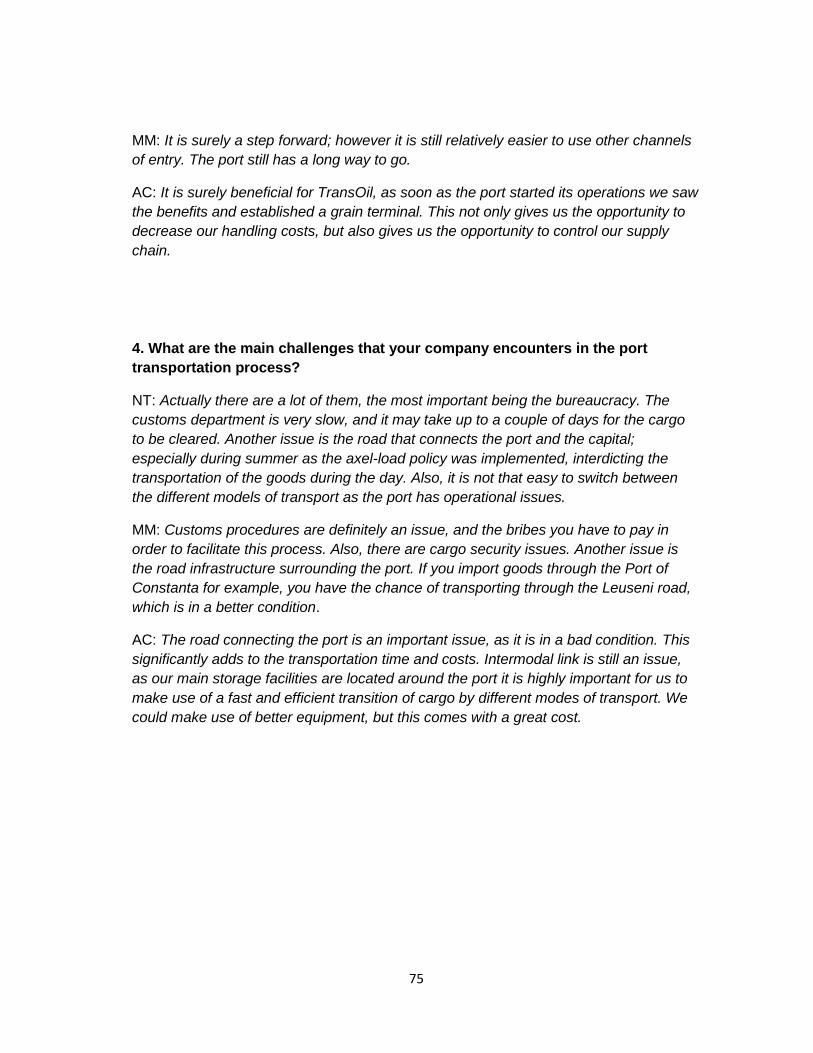
75
MM: It is surely a step forward; however it is still relatively easier to use other channels
of entry. The port still has a long way to go.
AC: It is surely beneficial for TransOil, as soon as the port started its operations we saw
the benefits and established a grain terminal. This not only gives us the opportunity to
decrease our handling costs, but also gives us the opportunity to control our supply
chain.
4. What are the main challenges that your company encounters in the port
transportation process?
NT: Actually there are a lot of them, the most important being the bureaucracy. The
customs department is very slow, and it may take up to a couple of days for the cargo
to be cleared. Another issue is the road that connects the port and the capital;
especially during summer as the axel-load policy was implemented, interdicting the
transportation of the goods during the day. Also, it is not that easy to switch between
the different models of transport as the port has operational issues.
MM: Customs procedures are definitely an issue, and the bribes you have to pay in
order to facilitate this process. Also, there are cargo security issues. Another issue is
the road infrastructure surrounding the port. If you import goods through the Port of
Constanta for example, you have the chance of transporting through the Leuseni road,
which is in a better condition.
AC: The road connecting the port is an important issue, as it is in a bad condition. This
significantly adds to the transportation time and costs. Intermodal link is still an issue,
as our main storage facilities are located around the port it is highly important for us to
make use of a fast and efficient transition of cargo by different modes of transport. We
could make use of better equipment, but this comes with a great cost.
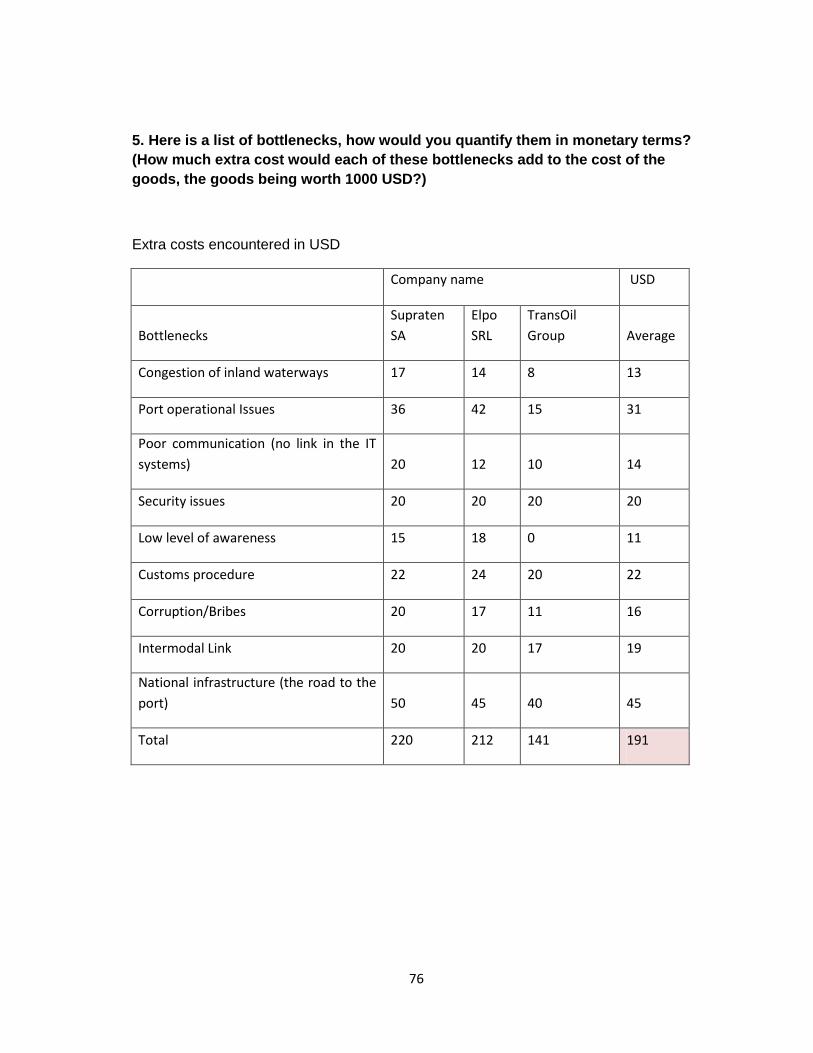
76
5. Here is a list of bottlenecks, how would you quantify them in monetary terms?
(How much extra cost would each of these bottlenecks add to the cost of the
goods, the goods being worth 1000 USD?)
Extra costs encountered in USD
Company name USD
Bottlenecks
Supraten
SA
Elpo
SRL
TransOil
Group Average
Congestion of inland waterways 17 14 8 13
Port operational Issues 36 42 15 31
Poor communication (no link in the IT
systems) 20 12 10 14
Security issues 20 20 20 20
Low level of awareness 15 18 0 11
Customs procedure 22 24 20 22
Corruption/Bribes 20 17 11 16
Intermodal Link 20 20 17 19
National infrastructure (the road to the
port) 50 45 40 45
Total 220 212 141 191
77
6. In your opinion, what measures should be taken in order to improve the port
transportation process.
NT: It is hard for me to say as I am not that knowledgeable in the maritime industry, but
one thing is certain: the customs process should be improved, and the road that
connects to the capital as well. Also, sometimes the terminal is not able to handle
dangerous cargo, as they do not have the proper equipment. I would suggest that some
new equipment might need to be implemented.
MM: Improving the customs procedure, improving the road infrastructure. Maybe it is
also worth implementing a common IT link with the companies that are cooperating, this
would reduce the time spent in clearance area. More than that, the port is young and
therefore it might be worth to use some outside expertise.
AC: It would be highly suggested that the Port Authority lobbies with the government on
the issue of reconstructing the road infrastructure surrounding the port. Also, in order to
reduce the congestion in the waterways, more modern methods of dredging activities
have to be performed.
7. If the situation in the port would improve, what would be the implications for
your company? Would it increase the volume of the goods transported through
this channel?
NT: Well, of course if the situation would improve we would use only this channel in
order to import our cargo. At the moment is not that easy either to import through the
Port of Constanta and the Port of Odessa either. By importing through these channels
you have to go for a double customs inspection, which is not that easy as well, but still
faster and cheaper.
MM: If the situation in the port would improve, we would be better off as well. This
would significantly reduce our transportation cost, as well as the fact that we will not
have to use other ports of entry from the neighboring countries. It is certain that we will
move our goods through the Port of Giurgiulesti, and I know many other companies
who would do the same thing.
AC: As we are highly dependent on the port, this would have a positive impact on our
company as well.
78
8. In your opinion what is the future development potential of the port? What is
your future vision regarding the port?
NT: We truly hope that the port is going to reach its true potential and everyone will
benefit out of it. As mentioned before, we would be happy to cooperate closely with the
port in the case the bottlenecks will be reduced.
MM: In a country like the Republic of Moldova it is really hard to assess the future
development, but we do hope that the port will reach its potential.
AC: We think that with common efforts of the Port Authority and the national
government the port will become an important infrastructure unit not only for Moldova,
but for the Black Sea region as well. As a part of the port system we are willing to do
everything that is in our powers to reach the established goals.