Embed Size (px)
Citation preview
Msc. eng. Magdalena German
Faculty of Civil Engineering
Cracow University of Technology
Budapest, 24.09.2011
Simulation of damage due to corrosion in RC cross-section
Presentation schemeOutline of the phenomenonCalculation procedure and corrosion initiation resultsDamage simulationExampleResultsConclusions
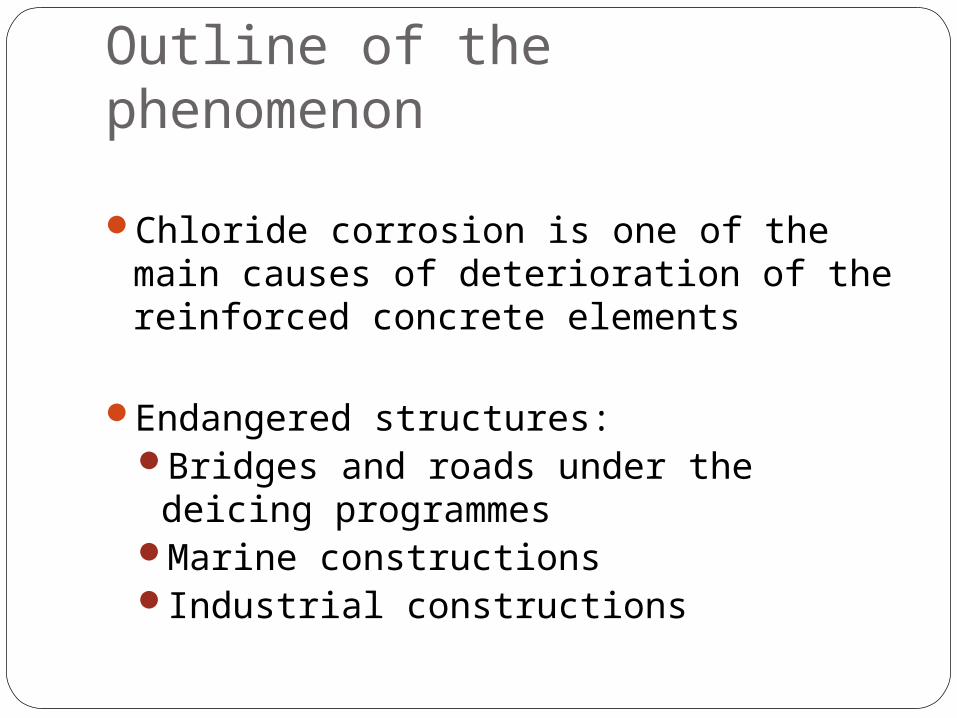
Outline of the phenomenon
Chloride corrosion is one of the main causes of deterioration of the reinforced concrete elements
Endangered structures:Bridges and roads under the deicing
programmes Marine constructionsIndustrial constructions
Outline of the phenomenon
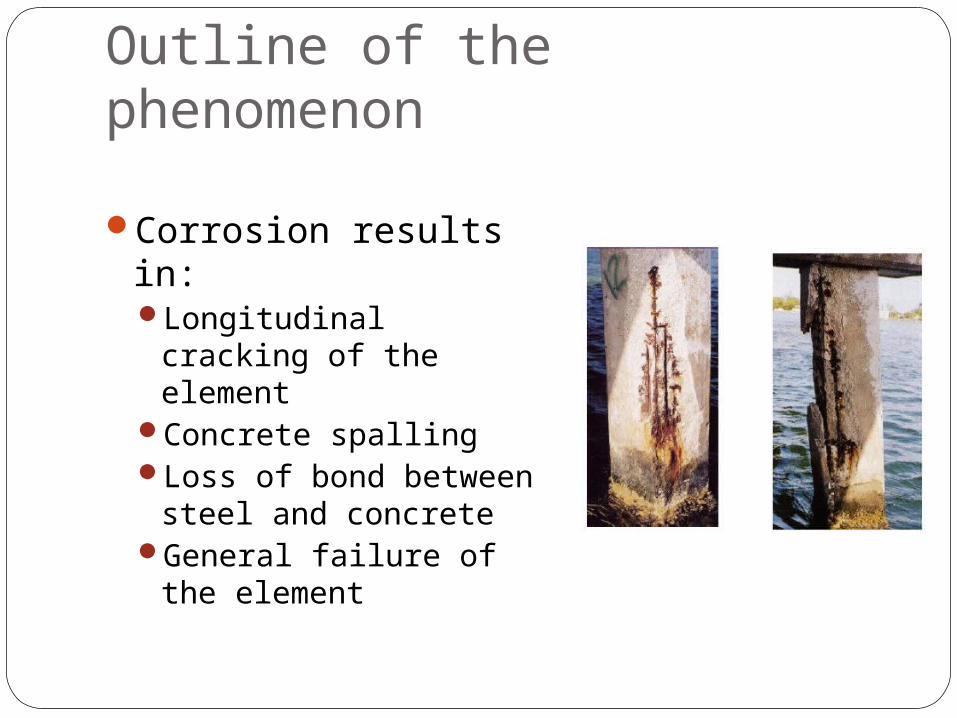
Corrosion results in:Longitudinal cracking of the
elementConcrete spallingLoss of bond between steel
and concreteGeneral failure of the
element
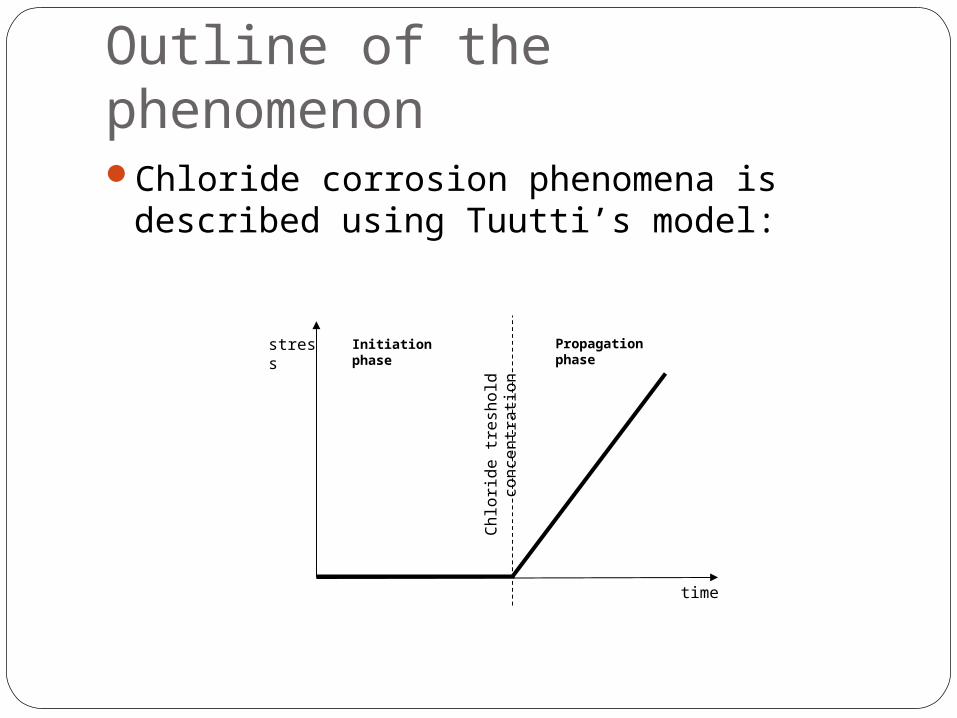
Outline of the phenomenonChloride corrosion phenomena is described using
Tuutti’s model:
Initiation phase Propagation phase
time
stress
Chl
orid
e tr
esho
ld c
once
ntra
tion
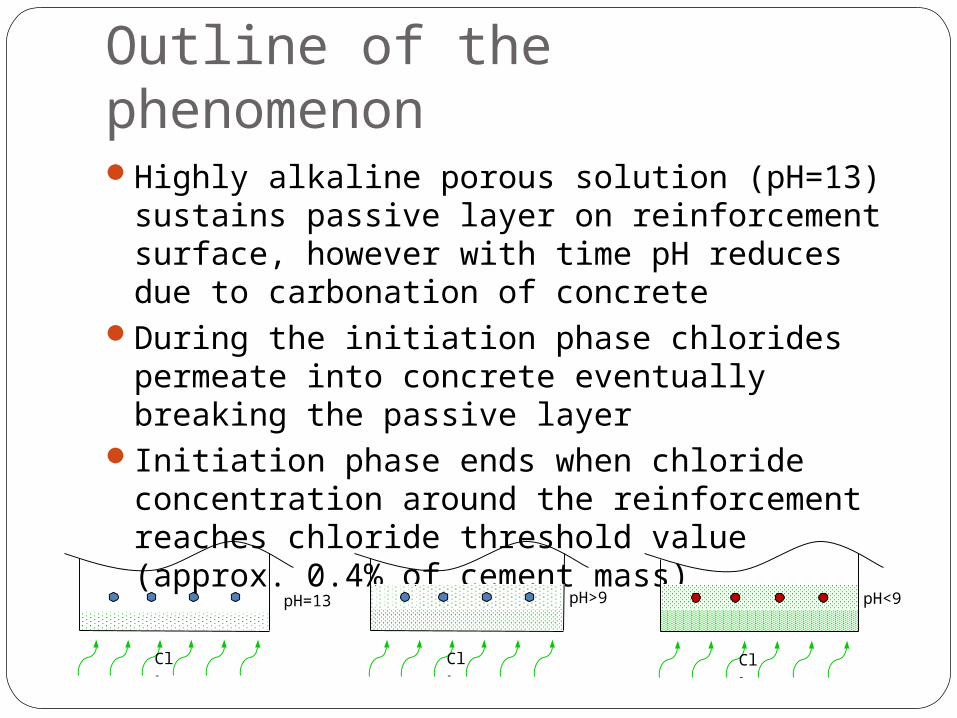
Outline of the phenomenonHighly alkaline porous solution (pH=13) sustains passive
layer on reinforcement surface, however with time pH reduces due to carbonation of concrete
During the initiation phase chlorides permeate into concrete eventually breaking the passive layer
Initiation phase ends when chloride concentration around the reinforcement reaches chloride threshold value (approx. 0.4% of cement mass)
Cl-
pH=13
Cl-
pH>9
Cl-
pH<9
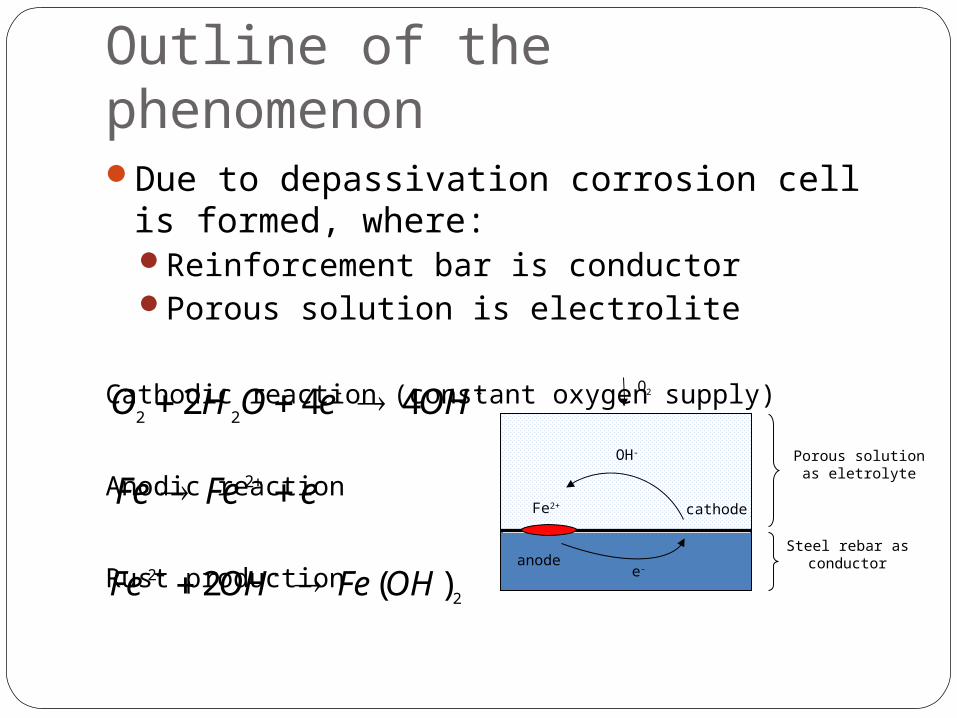
Outline of the phenomenonDue to depassivation corrosion cell is formed, where:
Reinforcement bar is conductorPorous solution is electrolite
Cathodic reaction (constant oxygen supply)
Anodic reaction
Rust production
OH-
anode
cathodeFe2+
O2
e-
Porous solution as eletrolyte
Steel rebar as conductor
eFeFe 2
OHeOHO 442 22
2
2 )(2 OHFeOHFe
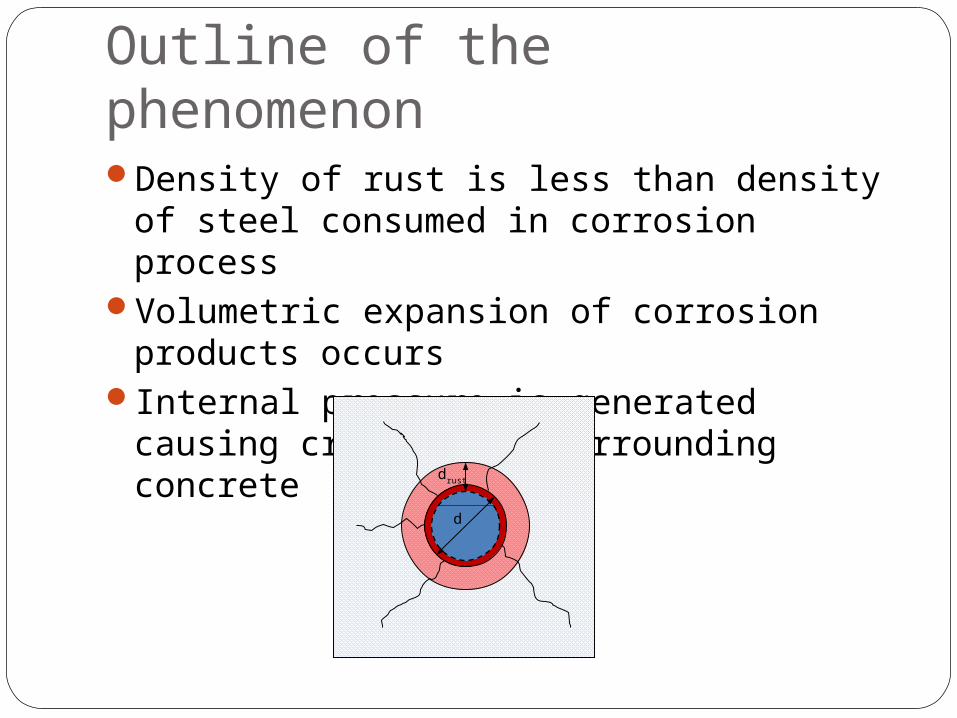
Outline of the phenomenonDensity of rust is less than density of steel consumed
in corrosion processVolumetric expansion of corrosion products occursInternal pressure is generated causing cracking of
surrounding concrete
d
drust
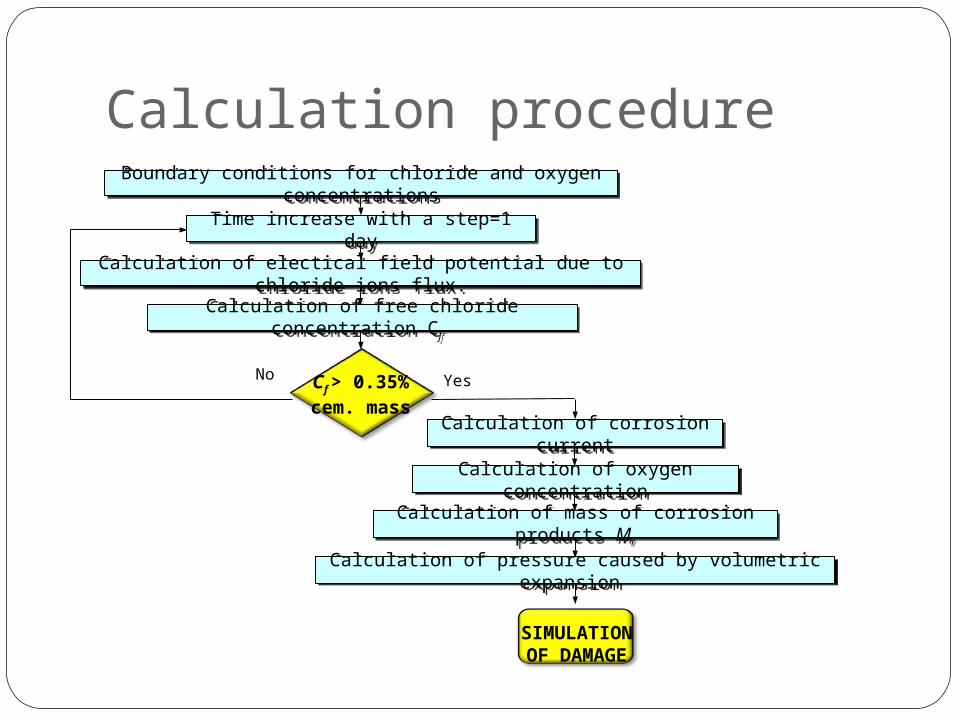
Time increase with a step=1 dayTime increase with a step=1 day
Calculation of electical field potential due to chloride ions flux.Calculation of electical field potential due to chloride ions flux.
Calculation of free chloride concentration Cf Calculation of free chloride concentration Cf
Cf > 0.35% cem. mass
No
Boundary conditions for chloride and oxygen concentrations
Boundary conditions for chloride and oxygen concentrations
Yes
Calculation of oxygen concentrationCalculation of oxygen concentration
Calculation of corrosion currentCalculation of corrosion current
Calculation of mass of corrosion products MrCalculation of mass of corrosion products Mr
Calculation of pressure caused by volumetric expansion Calculation of pressure caused by volumetric expansion
SIMULATION OF DAMAGE
Calculation procedure
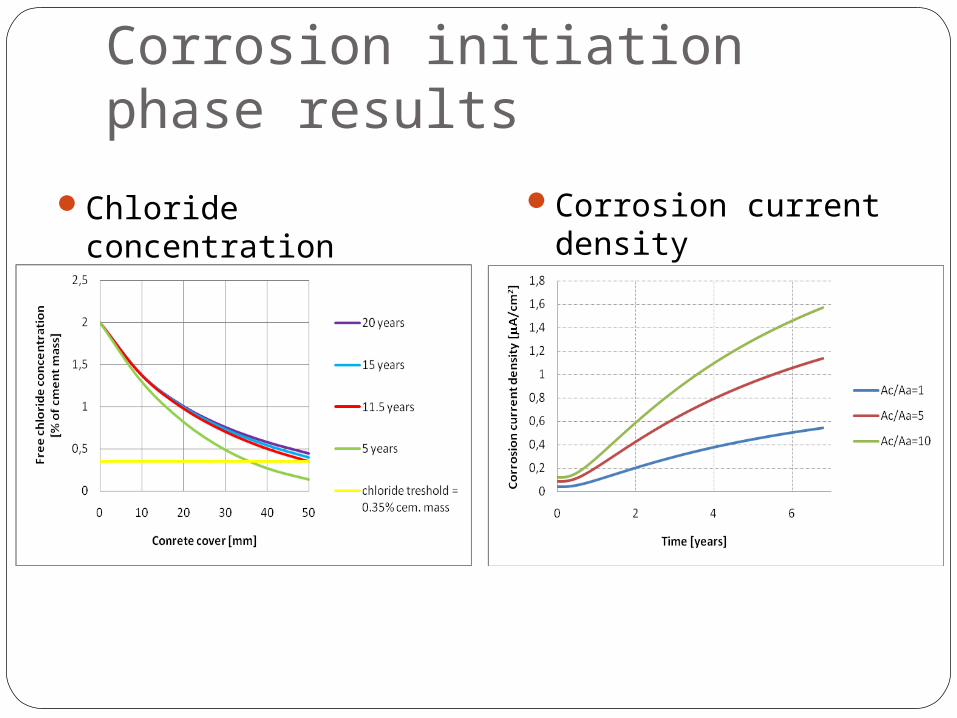
Corrosion initiation phase results
Chloride concentration Corrosion current density
SIMULATION OF DAMAGE
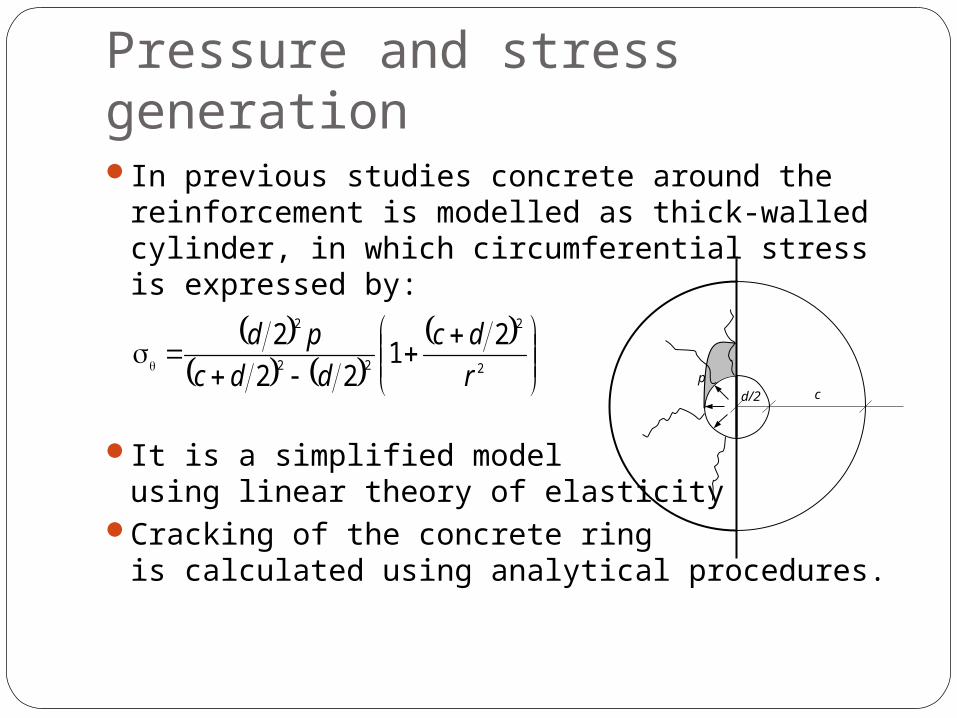
Pressure and stress generationIn previous studies concrete around the reinforcement
is modelled as thick-walled cylinder, in which circumferential stress is expressed by:
It is a simplified model using linear theory of elasticity
Cracking of the concrete ring is calculated using analytical procedures.
2
2
22
2 21
22
2
r
dc
ddc
pd
cd/2
p
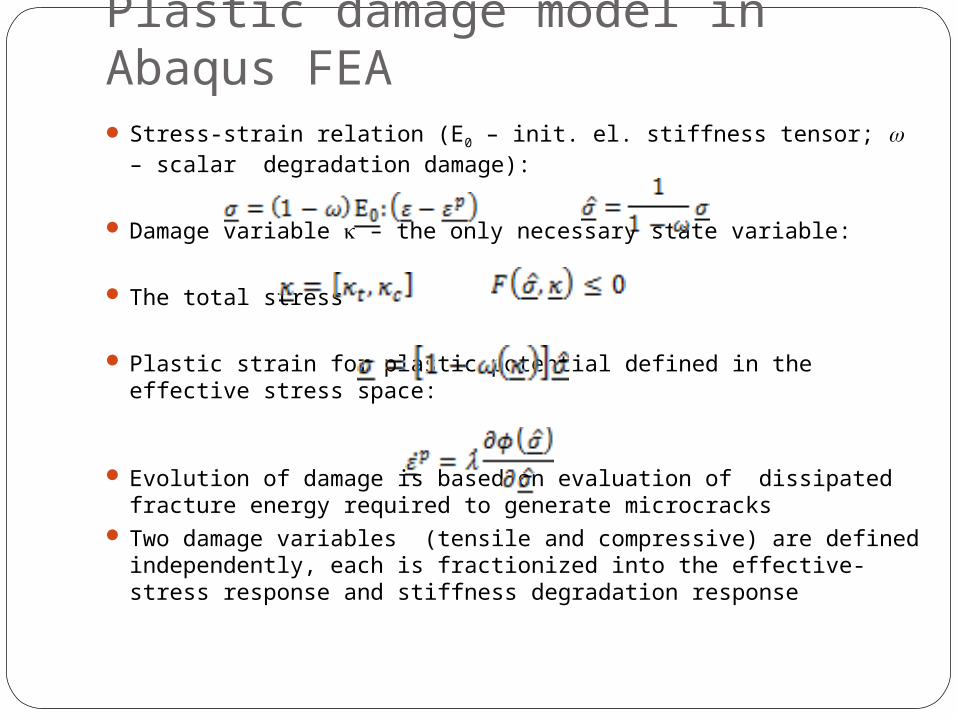
Plastic damage model in Abaqus FEA Stress-strain relation (E0 – init. el. stiffness tensor; – scalar degradation
damage):
Damage variable – the only necessary state variable:
The total stress
Plastic strain for plastic potential defined in the effective stress space:
Evolution of damage is based on evaluation of dissipated fracture energy required to generate microcracks
Two damage variables (tensile and compressive) are defined independently, each is fractionized into the effective-stress response and stiffness degradation response
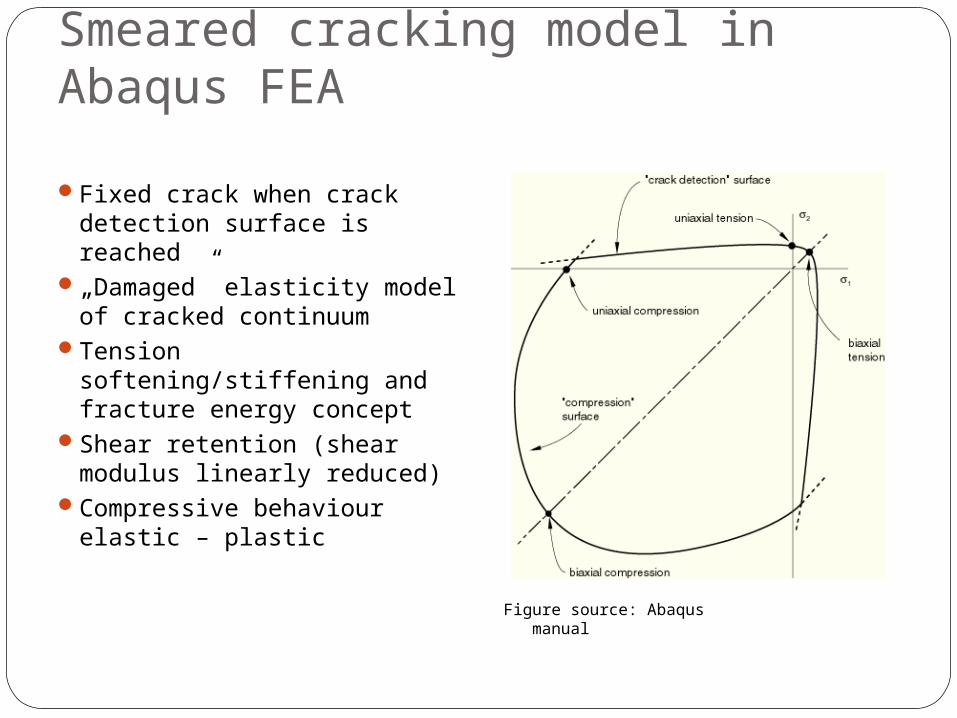
Smeared cracking model in Abaqus FEA
Fixed crack when crack detection surface is reached
„Damaged” elasticity model of cracked continuum
Tension softening/stiffening and fracture energy concept
Shear retention (shear modulus linearly reduced)
Compressive behaviour elastic – plastic
Figure source: Abaqus manual
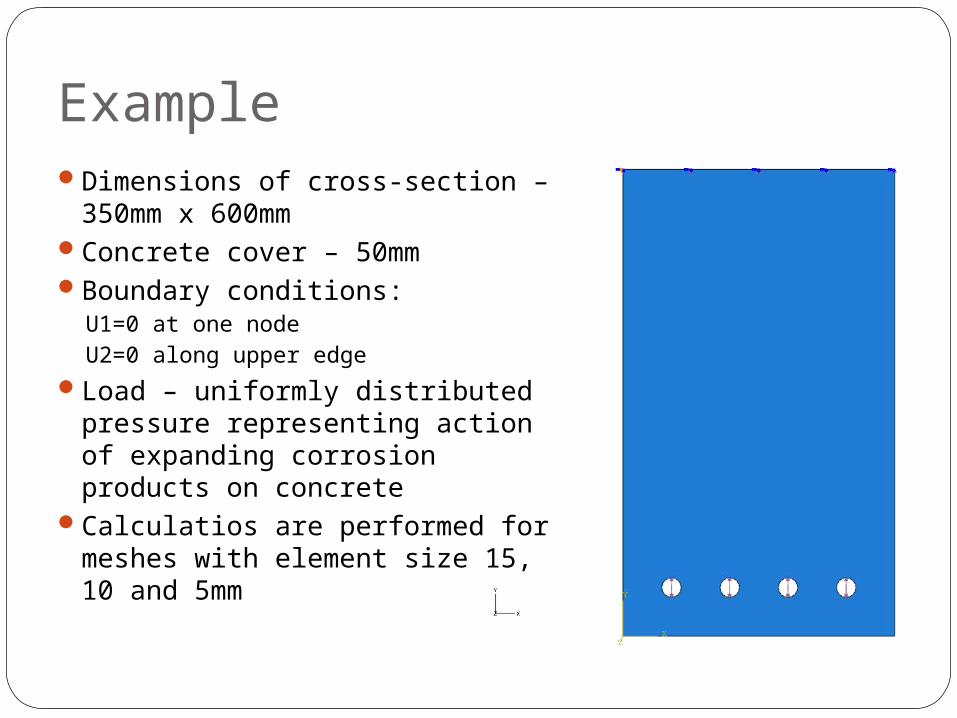
ExampleDimensions of cross-section –
350mm x 600mmConcrete cover – 50mmBoundary conditions:
U1=0 at one node
U2=0 along upper edge
Load – uniformly distributed pressure representing action of expanding corrosion products on concrete
Calculatios are performed for meshes with element size 15, 10 and 5mm
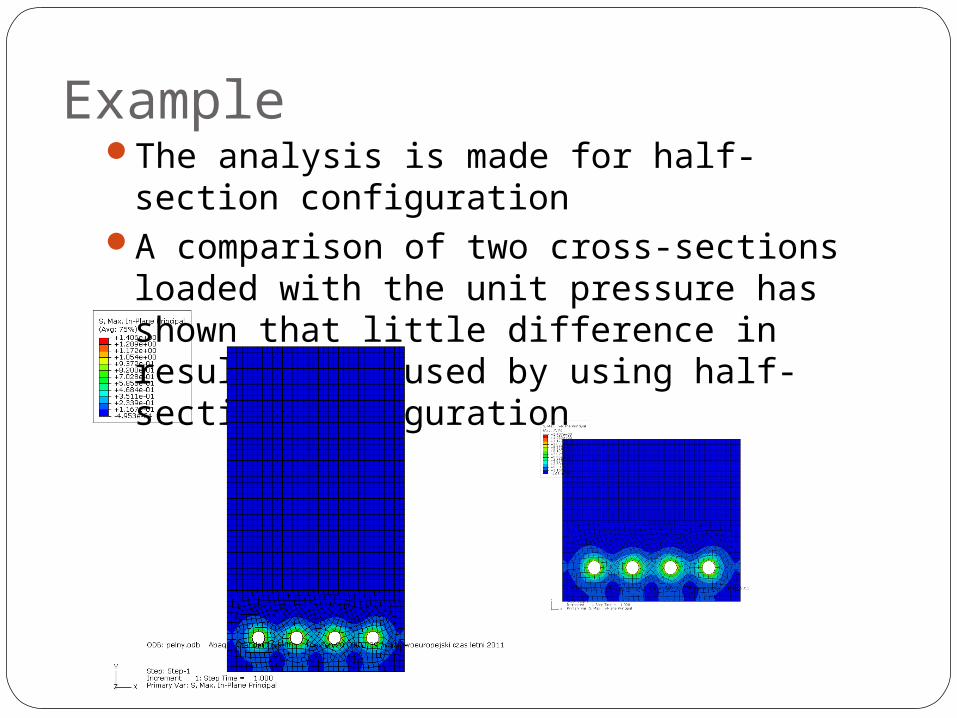
ExampleThe analysis is made for half-section configurationA comparison of two cross-sections loaded with the
unit pressure has shown that little difference in results is caused by using half-section configuration
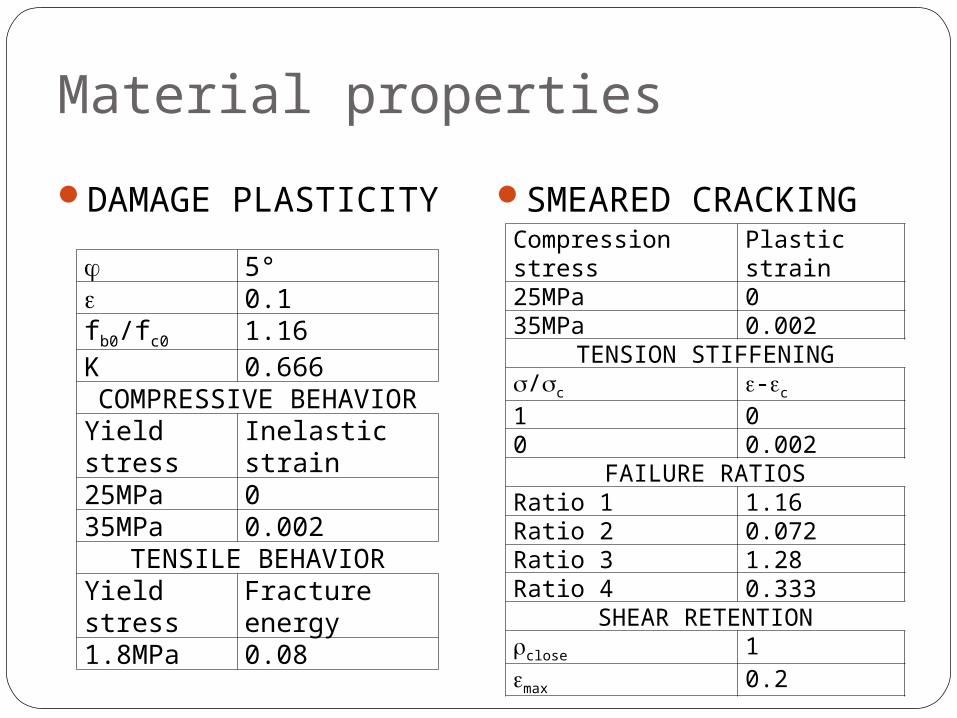
Material properties
DAMAGE PLASTICITY SMEARED CRACKING
5° 0.1fb0/fc0 1.16K 0.666COMPRESSIVE BEHAVIOR
Yield stress Inelastic strain25MPa 035MPa 0.002
TENSILE BEHAVIORYield stress Fracture energy1.8MPa 0.08
Compression stress Plastic strain25MPa 035MPa 0.002
TENSION STIFFENING/c -c
1 00 0.002
FAILURE RATIOSRatio 1 1.16Ratio 2 0.072Ratio 3 1.28Ratio 4 0.333
SHEAR RETENTIONclose 1max 0.2
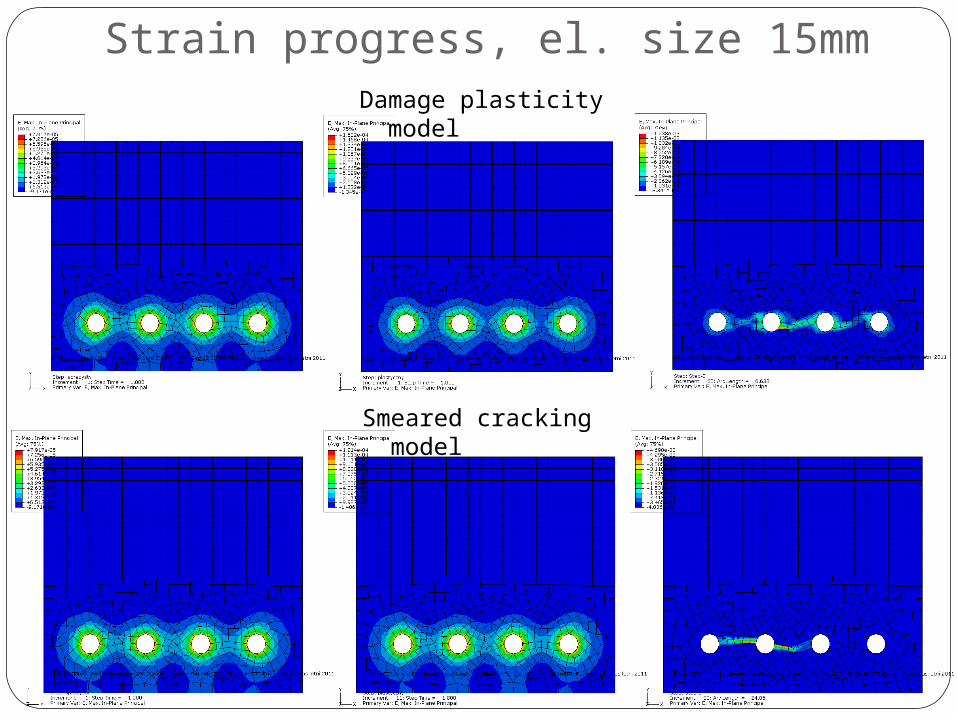
Strain progress, el. size 15mmDamage plasticity model
Smeared cracking model
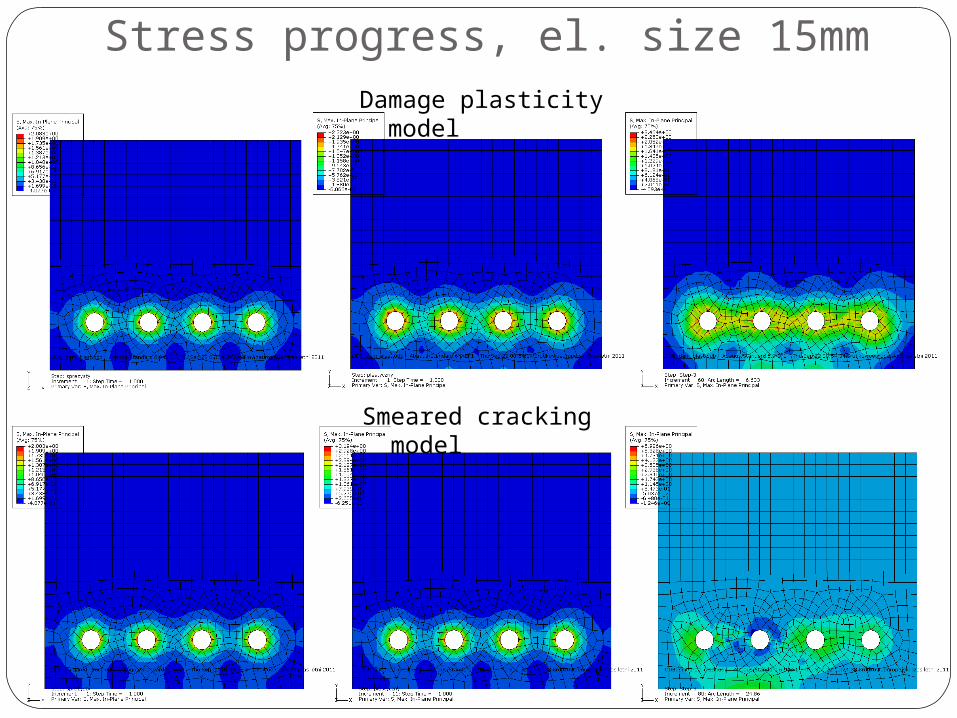
Stress progress, el. size 15mmDamage plasticity model
Smeared cracking model
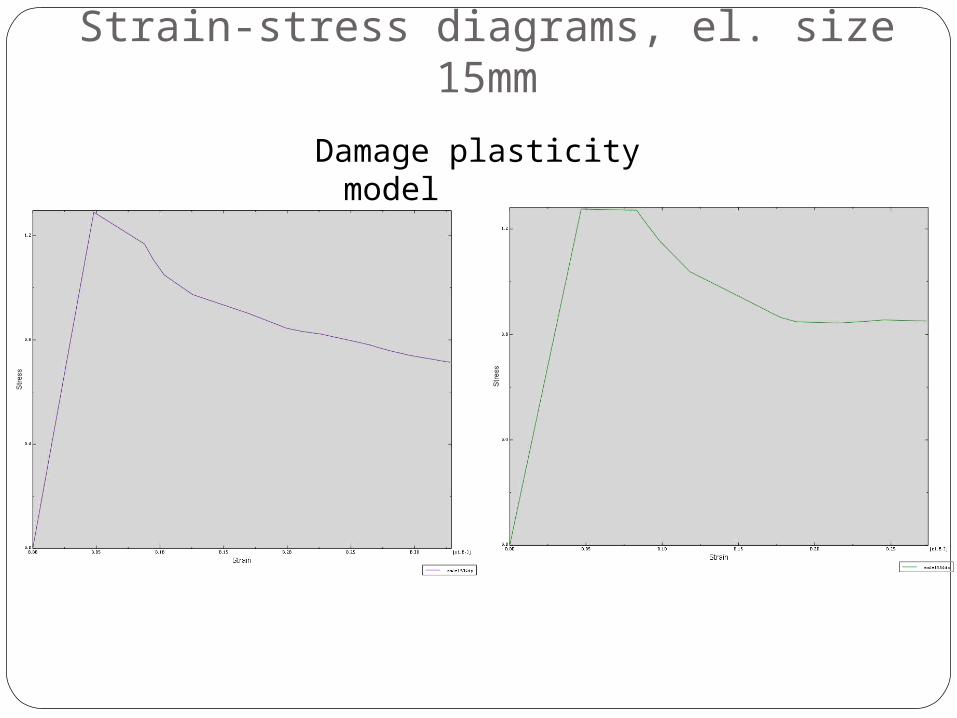
Strain-stress diagrams, el. size 15mm
Damage plasticity model
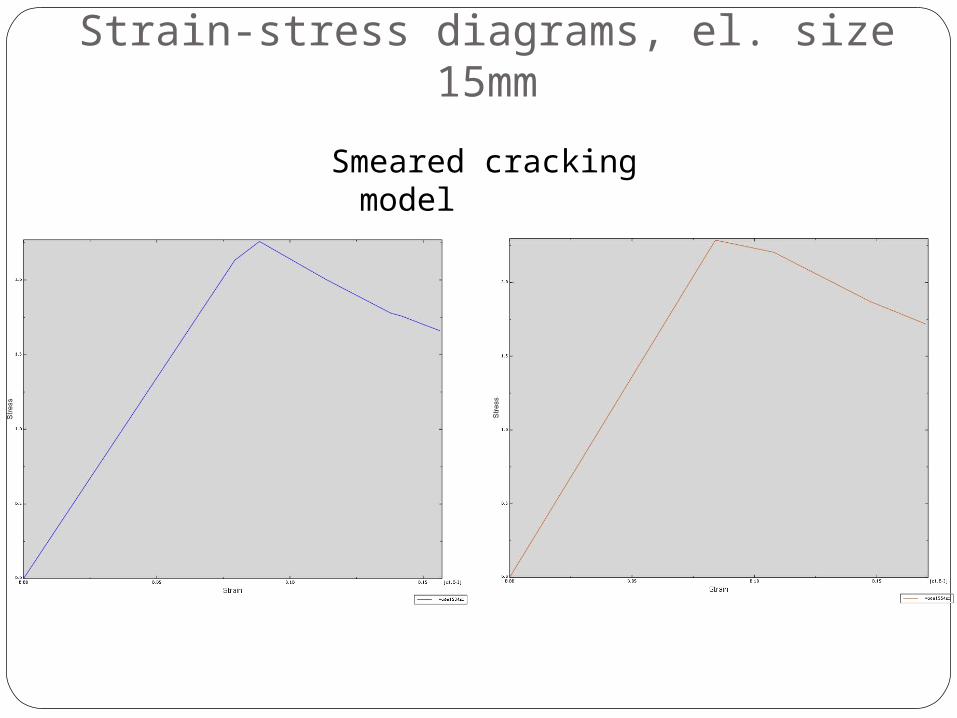
Strain-stress diagrams, el. size 15mm
Smeared cracking model
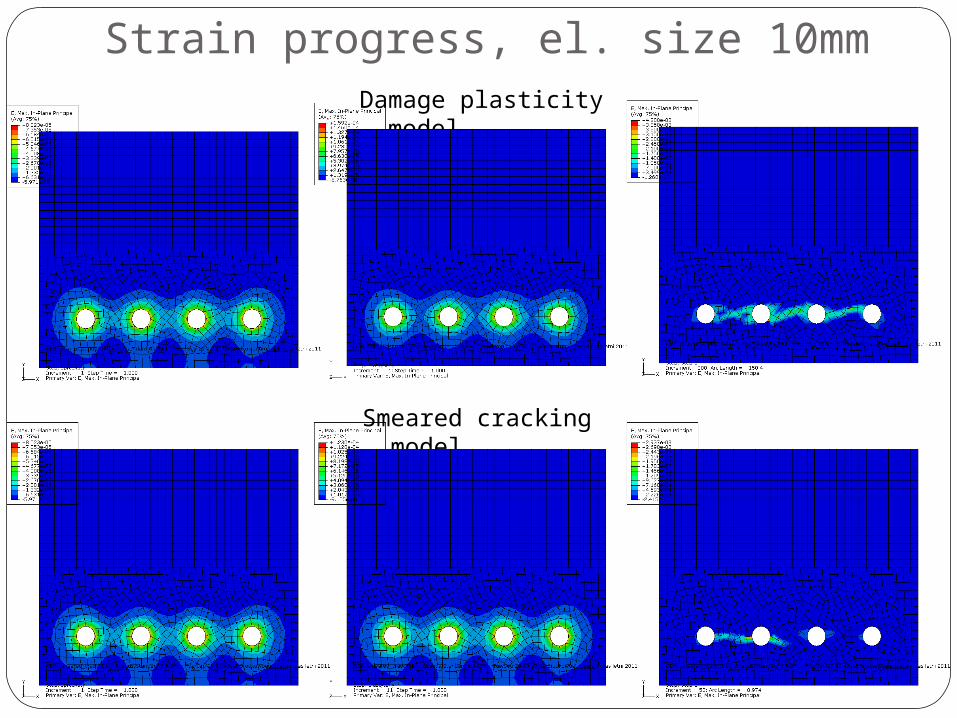
Strain progress, el. size 10mmDamage plasticity model
Smeared cracking model
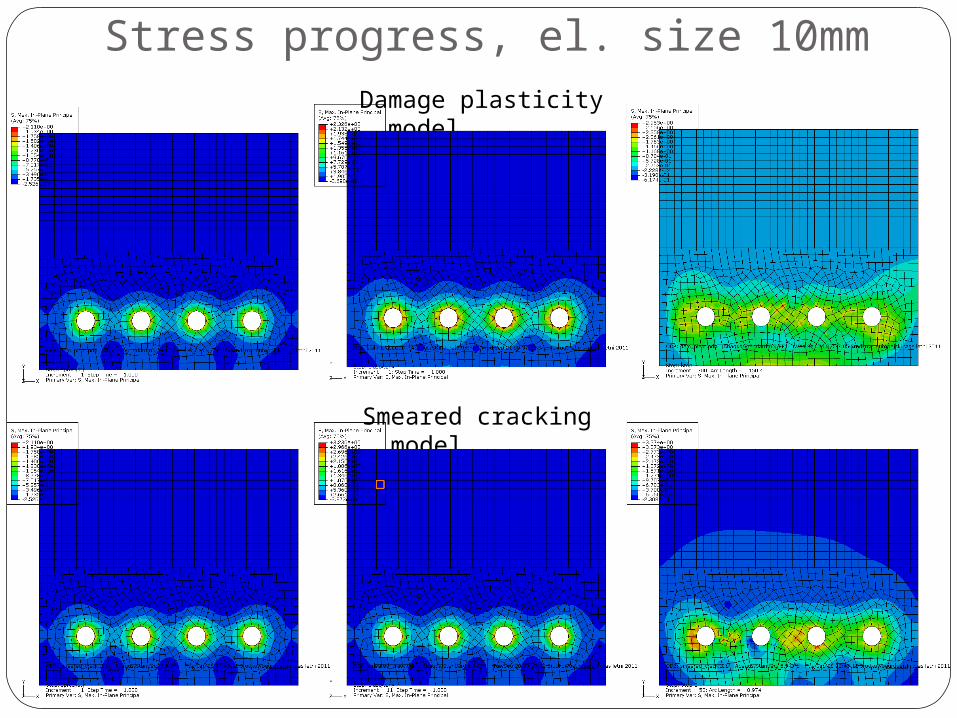
Stress progress, el. size 10mmDamage plasticity model
Smeared cracking model
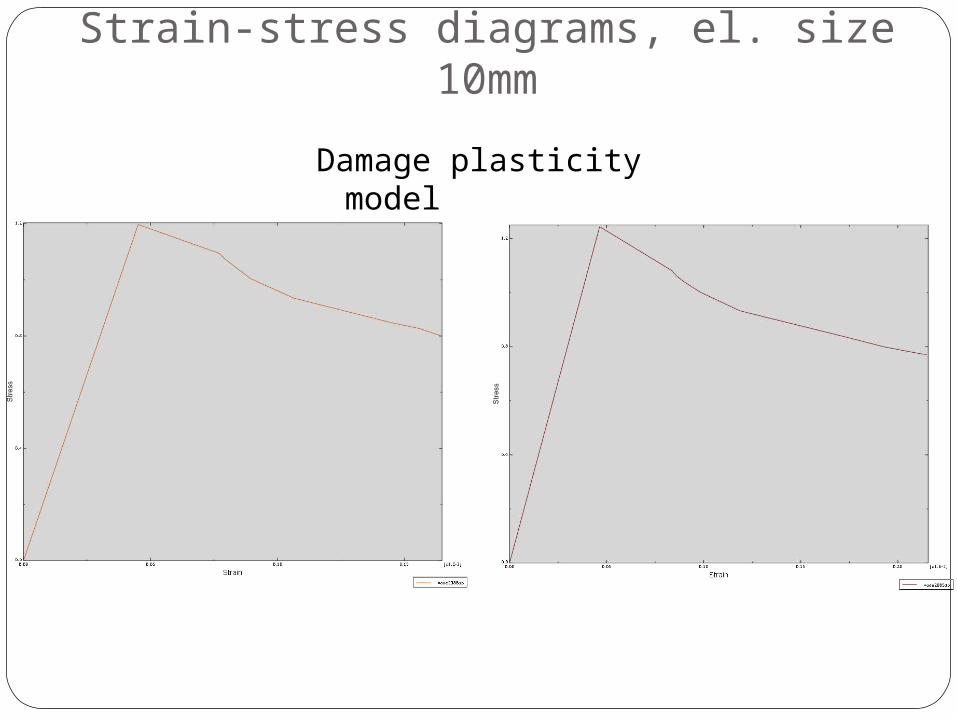
Strain-stress diagrams, el. size 10mm
Damage plasticity model
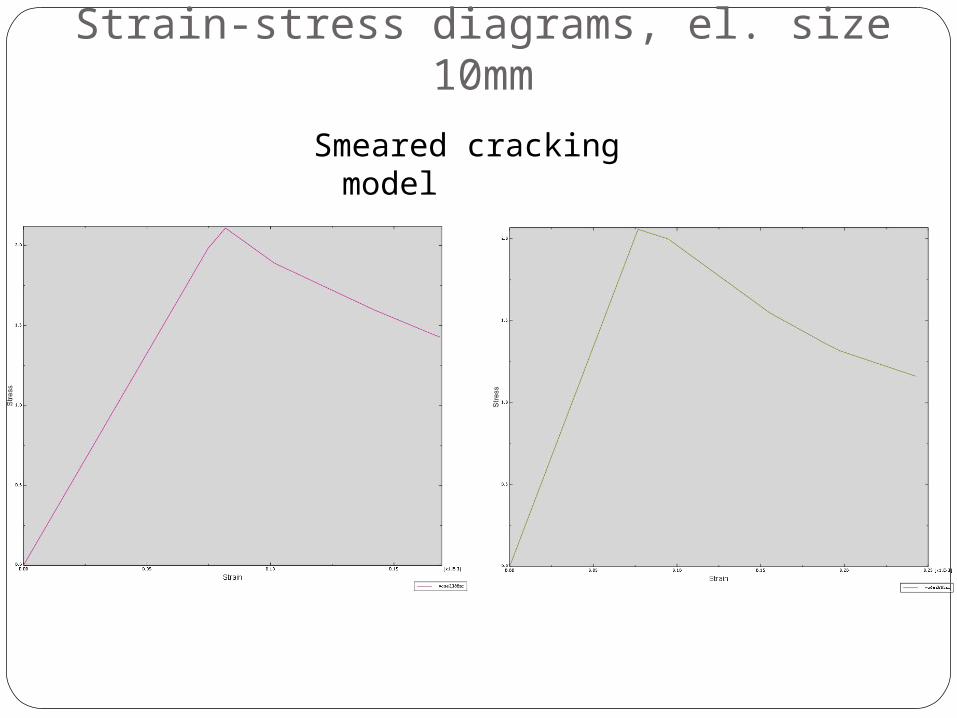
Strain-stress diagrams, el. size 10mm
Smeared cracking model
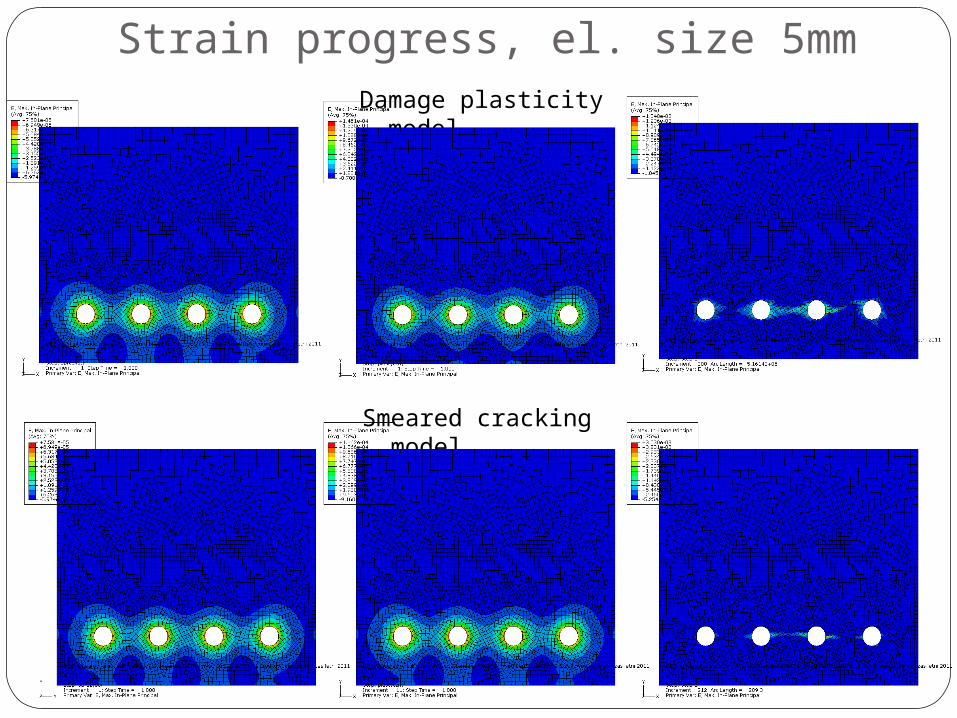
Strain progress, el. size 5mmDamage plasticity model
Smeared cracking model
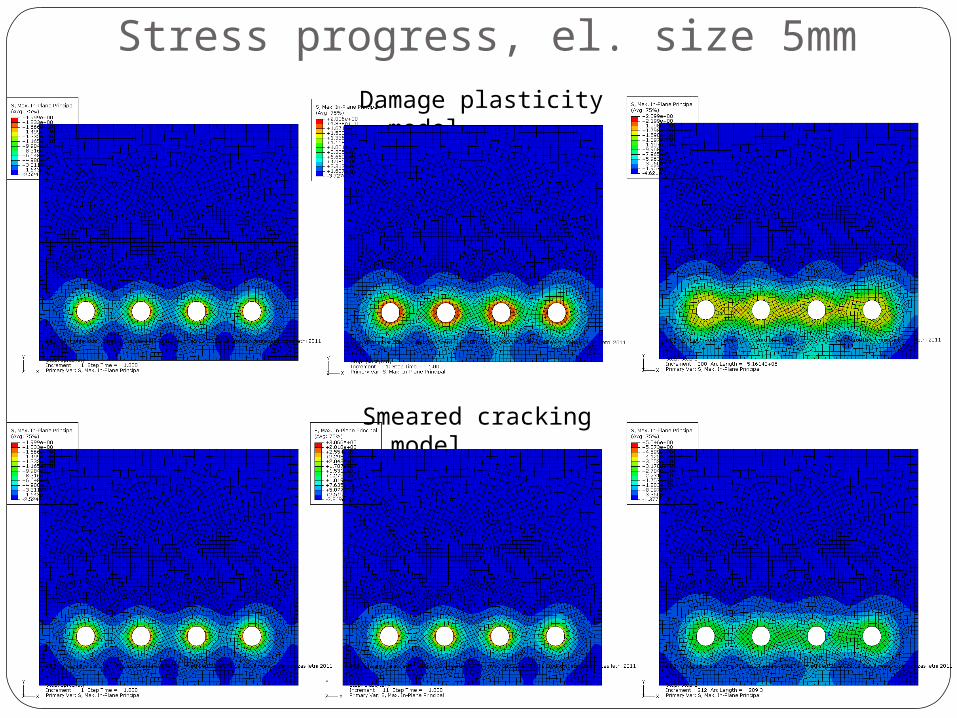
Stress progress, el. size 5mmDamage plasticity model
Smeared cracking model
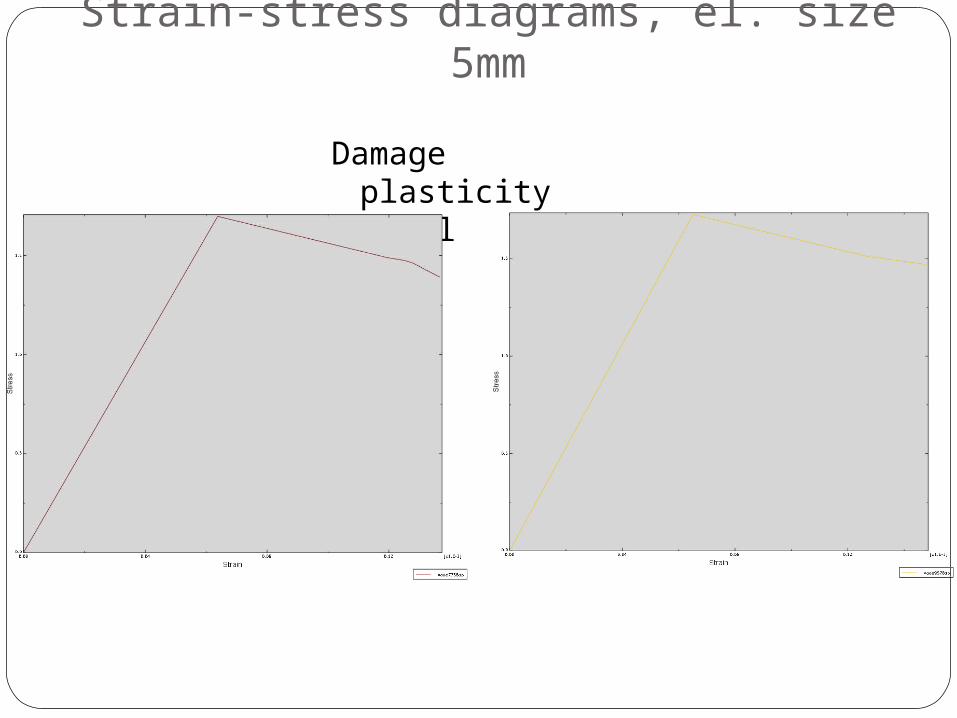
Strain-stress diagrams, el. size 5mm
Damage plasticity model
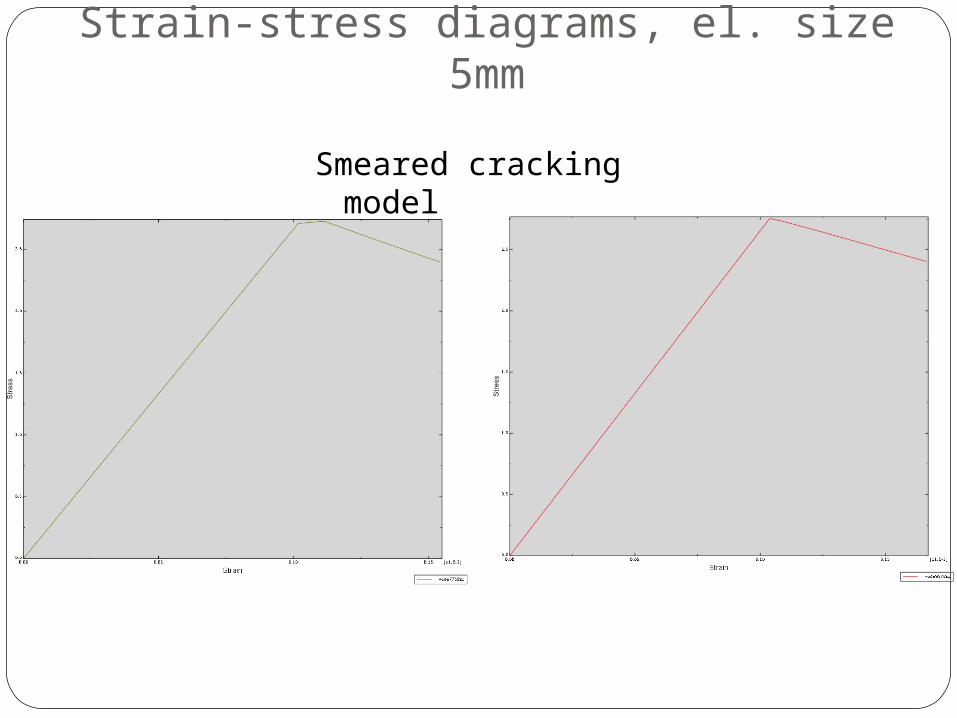
Strain-stress diagrams, el. size 5mm
Smeared cracking model
ConclusionsResults of FE simulation depend on mesh density. Size of
mesh defines the shape of damage
Simulation shows that concrete is more likely to crack between the rebars, when cover is still uncracked.
It suggest that, concrete can be uncracked at the surface, but there is loss of bonding between concrete and steel. It can be significant when element is additionally loaded.
Both used models give similar results, however there are differences between values of particular features
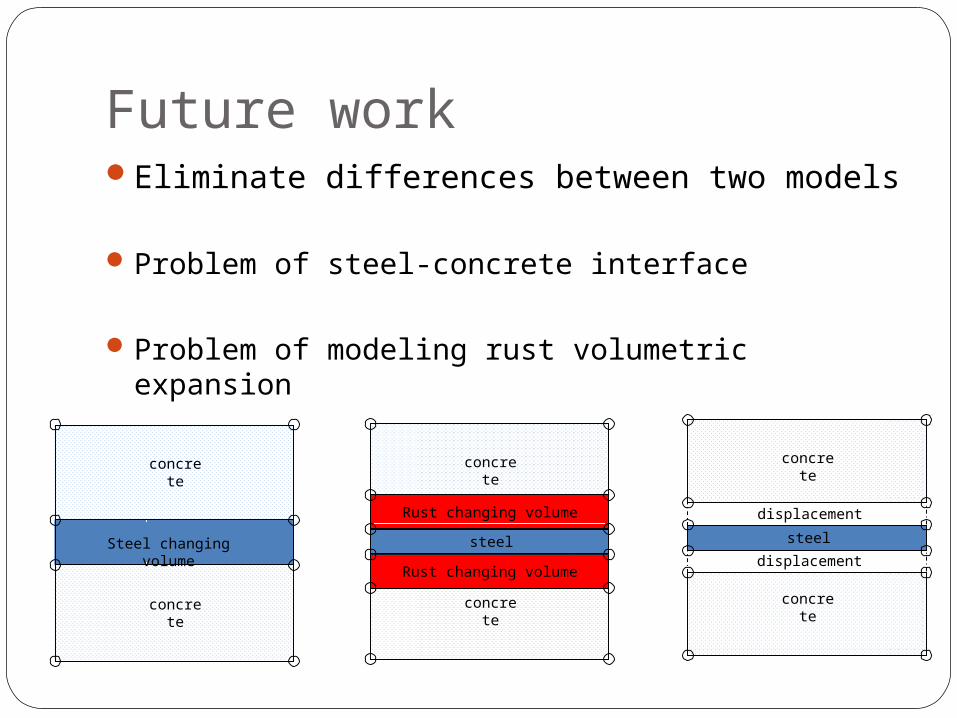
Future workEliminate differences between two models
Problem of steel-concrete interface
Problem of modeling rust volumetric expansion
concrete
concrete
Steel changing volume
concrete
concrete
Rust changing volume
steel
concrete
displacement
steel
concrete
Rust changing volumedisplacement