Embed Size (px)
Citation preview
Viability of Using DGT Passive Samplers to Measure Dissolved Trace Elements in Subtropical Freshwater
and Estuarine Environments
Master of ScienceThesis Defense by
Michael S. Tomlinson
Acknowledgments (mahalo nui loa!)➟ Thesis Committee:
➟ Eric De Carlo (Chair)➟ Fred Mackenzie➟ David Karl➟ Khalil Spencer
➟ The Team:➟ Scott Narod➟ Vincent Todd➟ Norine Yeung➟ Sam Saylor➟ Vincent Beltran
➟ Others:➟ Dan Hoover➟ Hao Zhang (Lancaster Univ.)➟ Nancy Koike➟ Kathy Kozuma
➟ Funding/Other Support:➟ NOAA Sea Grant➟ USEPA➟ Hawai�i DOH & DLNR➟ NSF (ICP-MS)➟ USGS
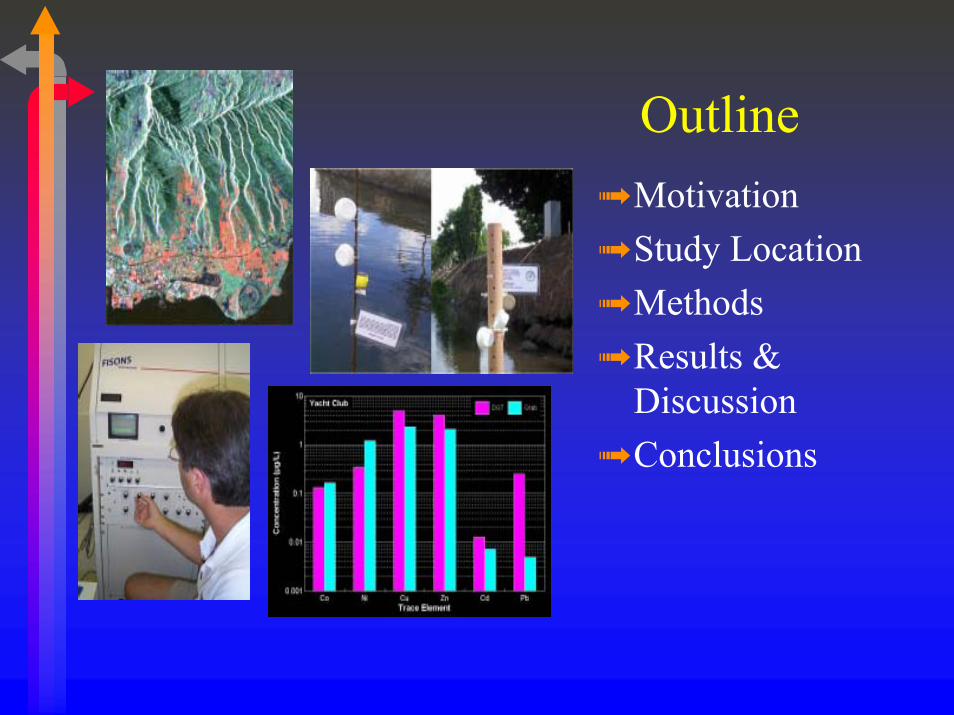
Outline➟ Motivation➟ Study Location➟ Methods➟ Results &
Discussion➟ Conclusions
➟ To quantify dissolved trace element inputs to aquatic habitats:➟ Methods time consuming and expensive➟ Ambiguous, definitions of dissolved vary➟ Discrete water samples are snapshots in time➟ Relation between sediment/tissue
concentrations difficult to relate to water column concentrations
➟ Often trace element concentrations <MDL
Motivation for the study
Nonpoint source pollution (after NPDES)➟ �Nonpoint source [NPS] pollution . . .
a significant factor in coastal water degradation� (U.S. Congress, 1990)
➟ �Stormwater linked to major coastal problems� (EPA, 1993)
➟ �May be greatest threat to marine ecosystems� (Clark, 1995)
➟ bioavailability can ultimately threaten human health through consumption of aquatic organisms
Why dissolved trace elements?
➟ Dissolved phases considered bioavailable
➟ �Bioavailability�the fraction of total contaminant in surrounding medium which is correlated with a quantitative biological response such as biomagnification� (EPA, 1992)
➟ Definition of �dissolved� is operational & varies with filter pore size (typically 0.2 to 1 µm)
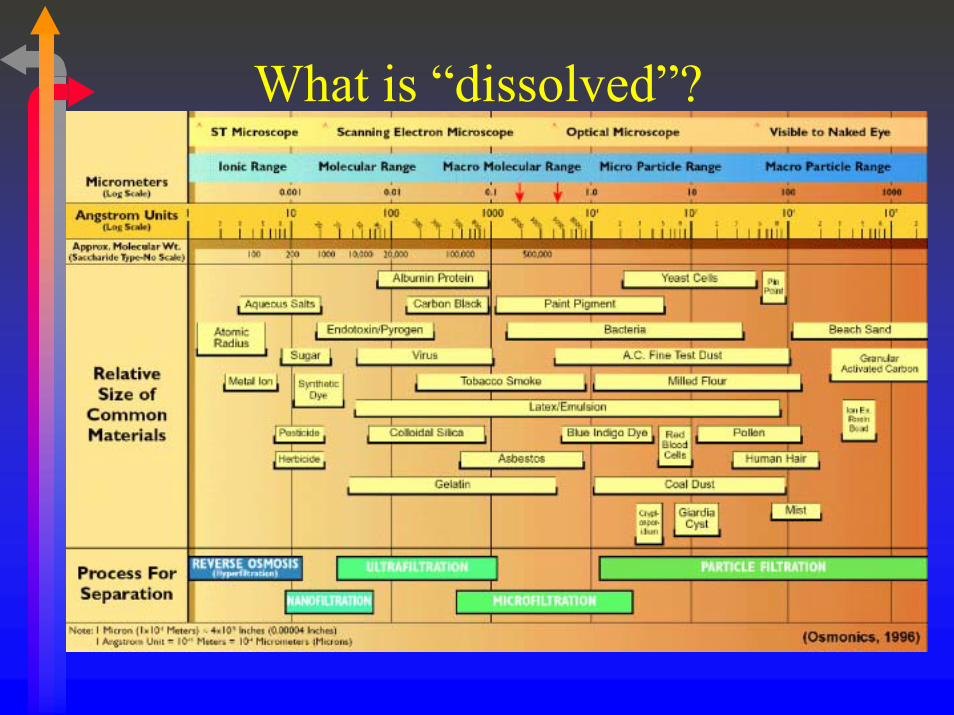
What is �dissolved�?
Measuring NPS pollution➟ Water column sampling
➟ Sediment sampling
➟ Bioaccumulation in resident & caged species (e.g., NS&T Mussel Watch)
➟ Passive samplers
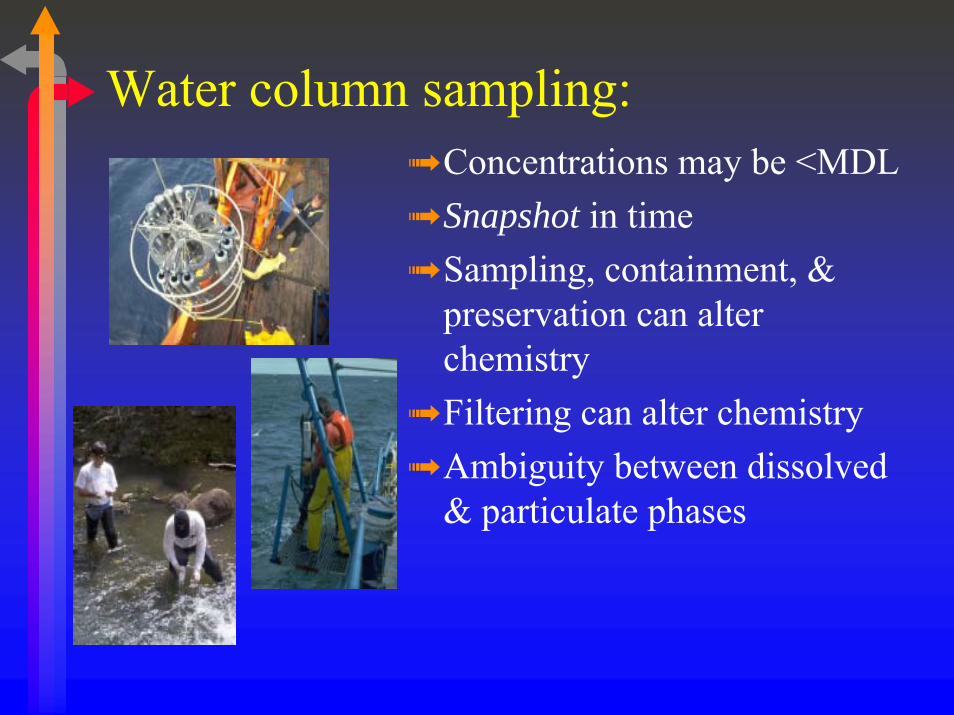
Water column sampling:➟ Concentrations may be <MDL➟ Snapshot in time➟ Sampling, containment, &
preservation can alter chemistry
➟ Filtering can alter chemistry➟ Ambiguity between dissolved
& particulate phases
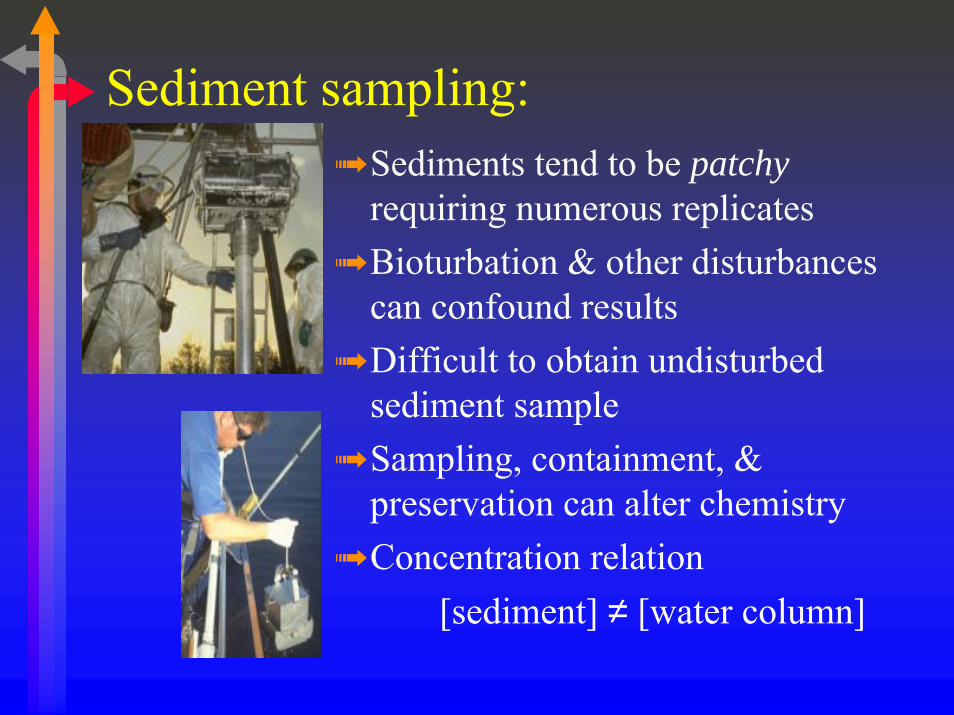
Sediment sampling:➟ Sediments tend to be patchy
requiring numerous replicates➟ Bioturbation & other disturbances
can confound results➟ Difficult to obtain undisturbed
sediment sample➟ Sampling, containment, &
preservation can alter chemistry➟ Concentration relation
[sediment] ≠ [water column]
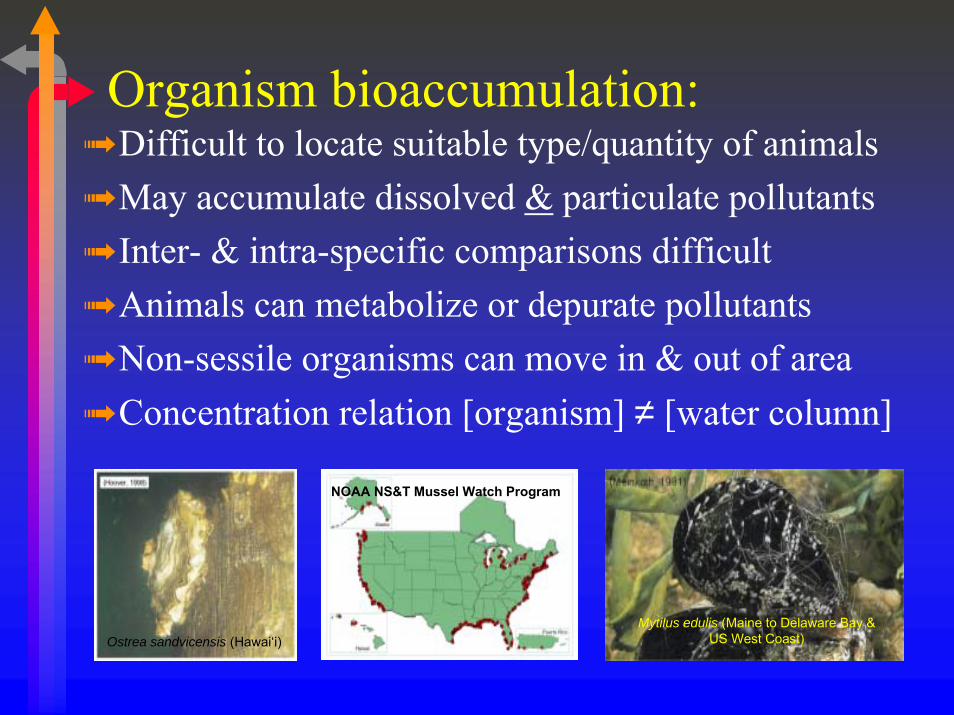
Organism bioaccumulation:➟ Difficult to locate suitable type/quantity of animals➟ May accumulate dissolved & particulate pollutants➟ Inter- & intra-specific comparisons difficult➟ Animals can metabolize or depurate pollutants➟ Non-sessile organisms can move in & out of area➟ Concentration relation [organism] ≠ [water column]
NOAA NS&T Mussel Watch Program
Ostrea sandvicensis (Hawai�i)Mytilus edulis (Maine to Delaware Bay &
US West Coast)
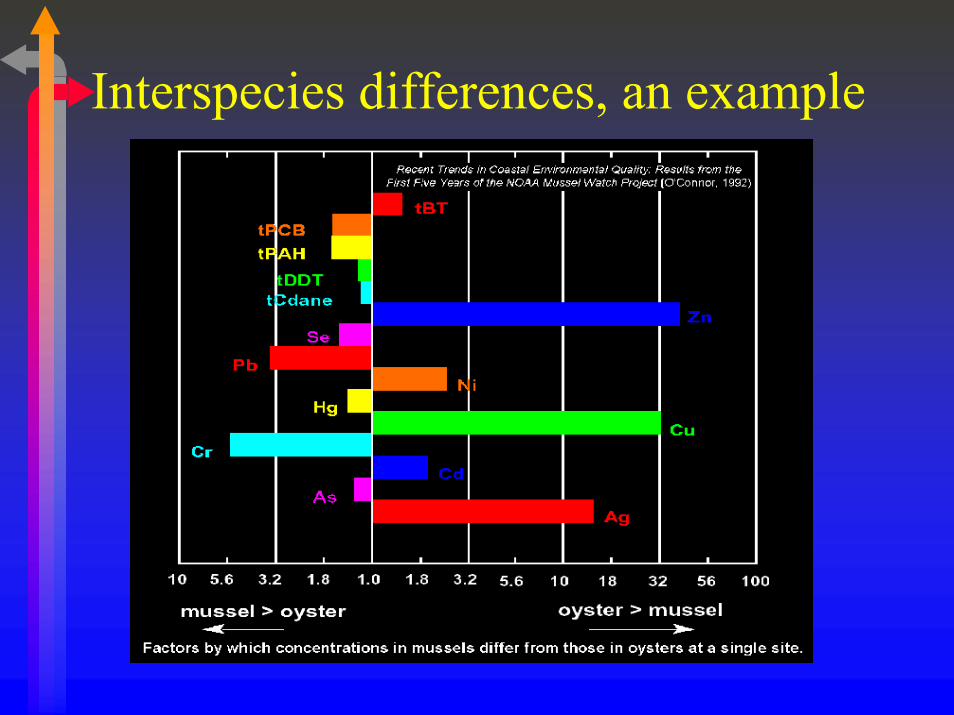
Interspecies differences, an example
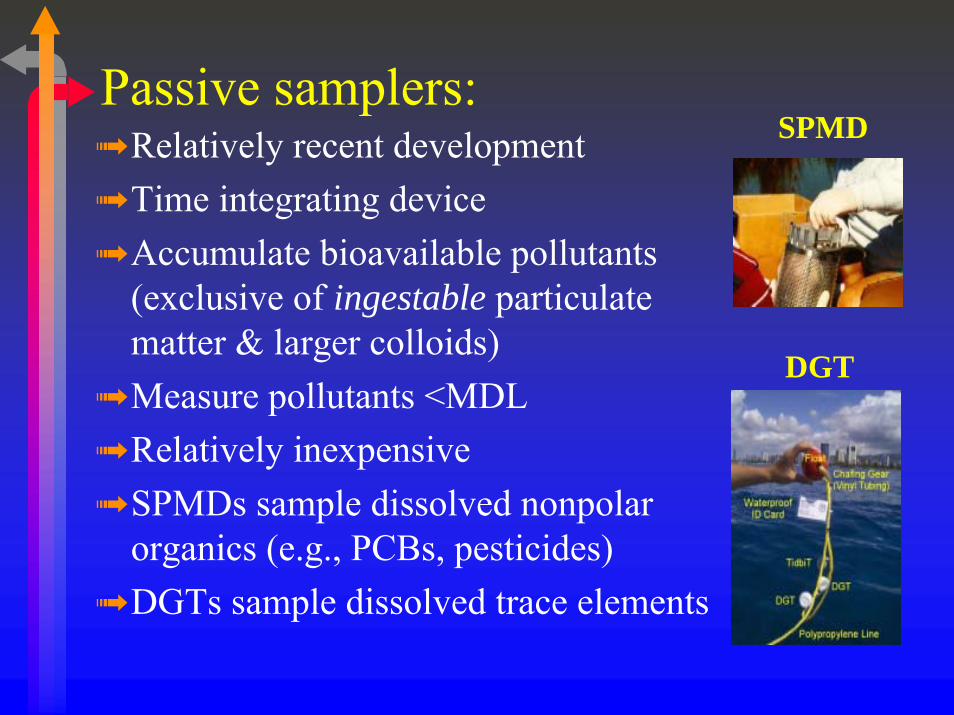
Passive samplers:➟ Relatively recent development➟ Time integrating device➟ Accumulate bioavailable pollutants
(exclusive of ingestable particulate matter & larger colloids)
➟ Measure pollutants <MDL➟ Relatively inexpensive➟ SPMDs sample dissolved nonpolar
organics (e.g., PCBs, pesticides)➟ DGTs sample dissolved trace elements
DGT
SPMD
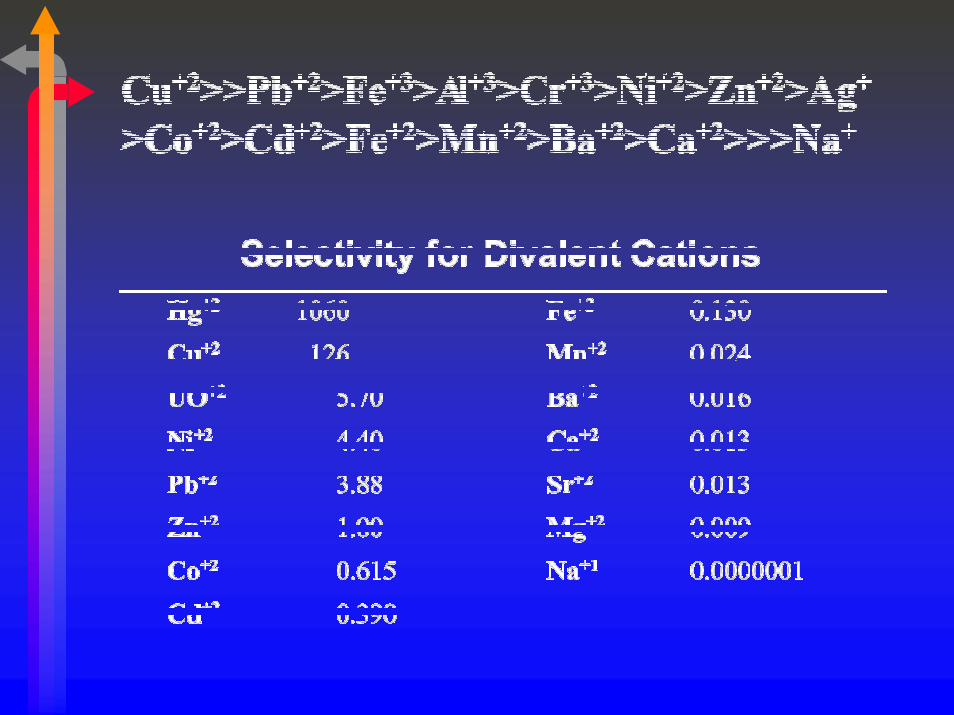
DGT (Diffusive Gradients in Thin-films)➟ Developed by Davison and Zhang (1994) of
Lancaster University➟ Measures dissolved Cd, Cr, Cu, Pb, Zn, Co, Ni,
Ag, Mn, Fe, Al➟ Work in saltwater, freshwater, sediments & soils➟ Consists of membrane filter, diffusive hydrogel,
resin gel, and housing (see diagram)➟ Effective pore size generally 0.002-0.005 µm
& no >0.020 µm (�standard� DGT)➟ Inexpensive (£10 or ~$17, March 2002)
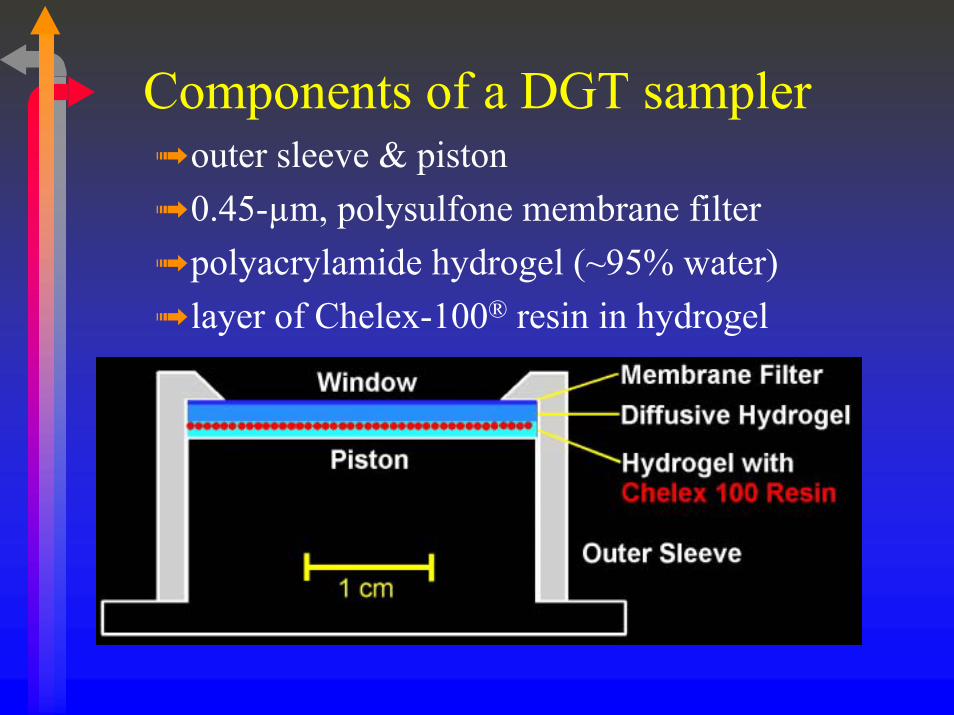
Components of a DGT sampler➟ outer sleeve & piston➟ 0.45-µm, polysulfone membrane filter➟ polyacrylamide hydrogel (~95% water)➟ layer of Chelex-100® resin in hydrogel
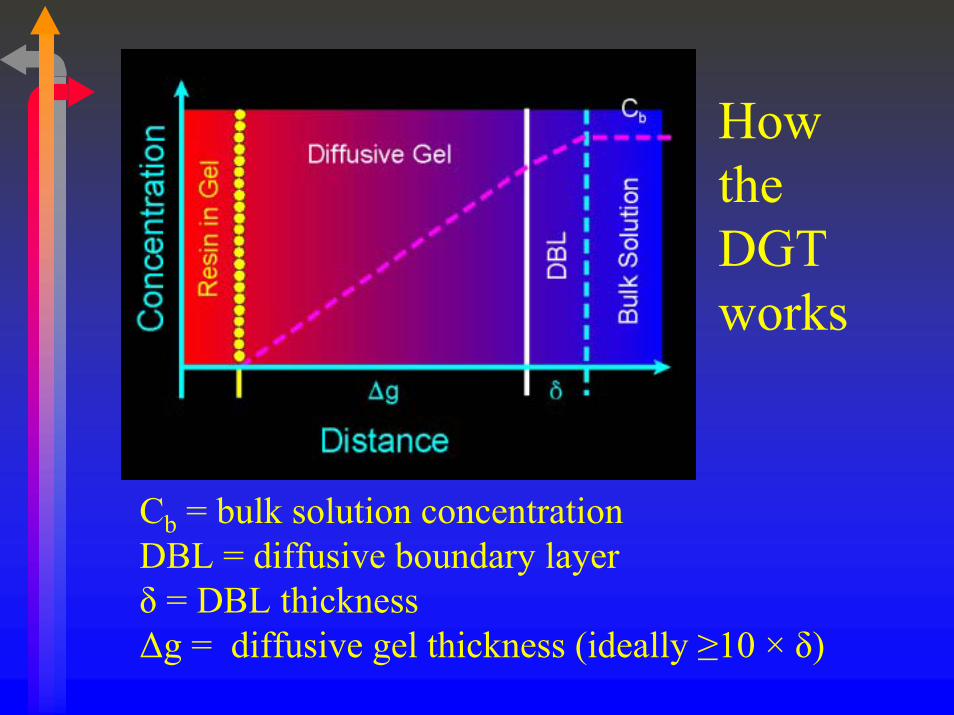
Cb = bulk solution concentrationDBL = diffusive boundary layerδ = DBL thickness∆g = diffusive gel thickness (ideally ≥10 × δ)
Howthe DGT works
DGT facts➟ Generally only labile trace elements measured➟ Temperature-related effects are predictable➟ Diffusion coefficient independent of ionic
strength of receiving water (must be >1 mM)➟ Operating pH range of 5-10 for most elements➟ Not affected by hydrodynamic conditions➟ MDL for DGT after 1 day deployment is <4 pM
(concentration factor of ~300 times)➟ Analysis involves batch leaching (typically with
80 % recovery) followed by AAS or ICP-MS
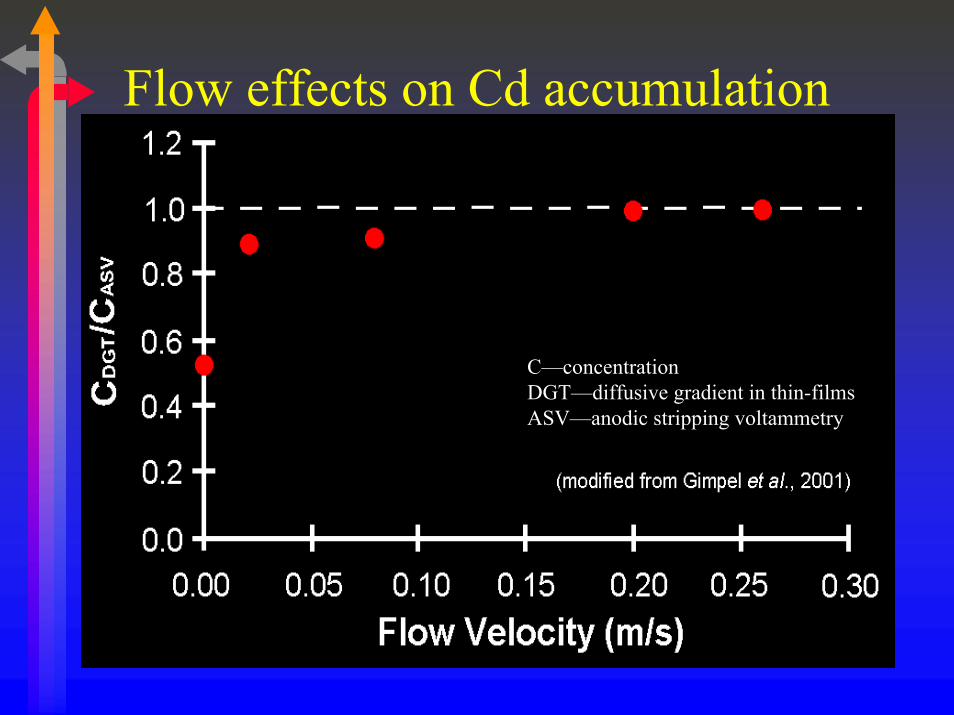
Flow effects on Cd accumulation
C�concentrationDGT�diffusive gradient in thin-filmsASV�anodic stripping voltammetry
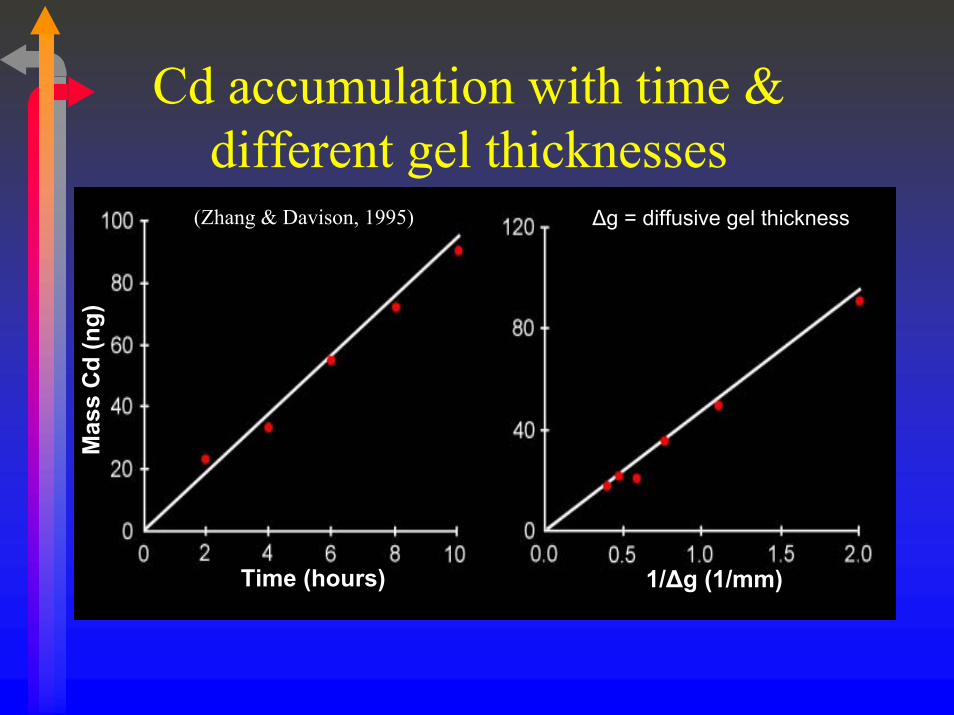
Cd accumulation with time &different gel thicknesses
Time (hours) 1/∆g (1/mm)
∆g = diffusive gel thickness
Mas
s C
d (n
g)
(Zhang & Davison, 1995)
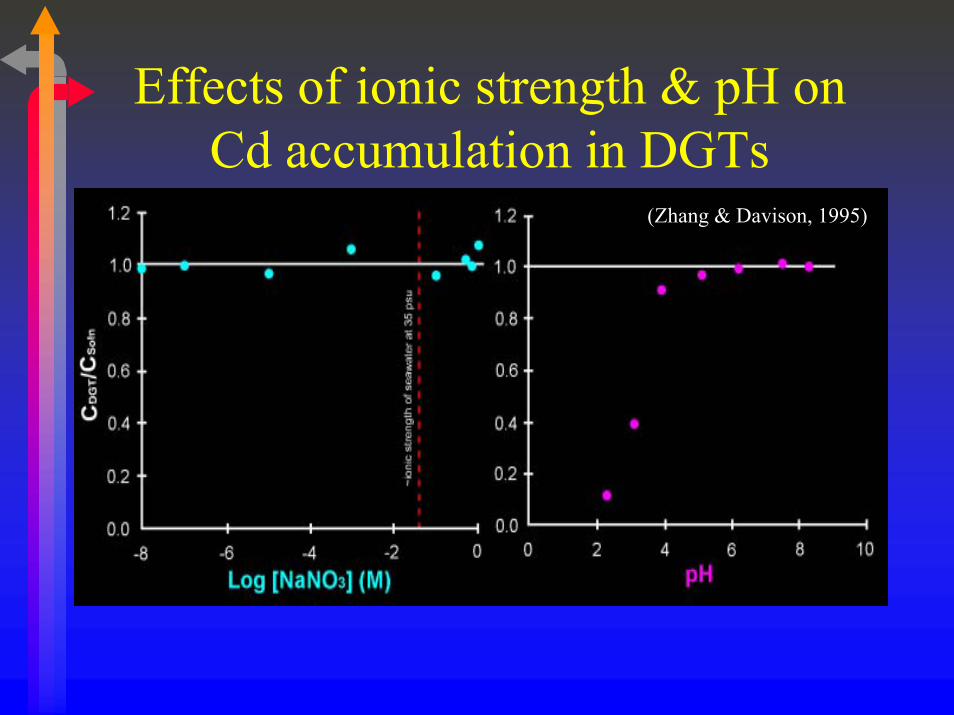
Effects of ionic strength & pH on Cd accumulation in DGTs
(Zhang & Davison, 1995)
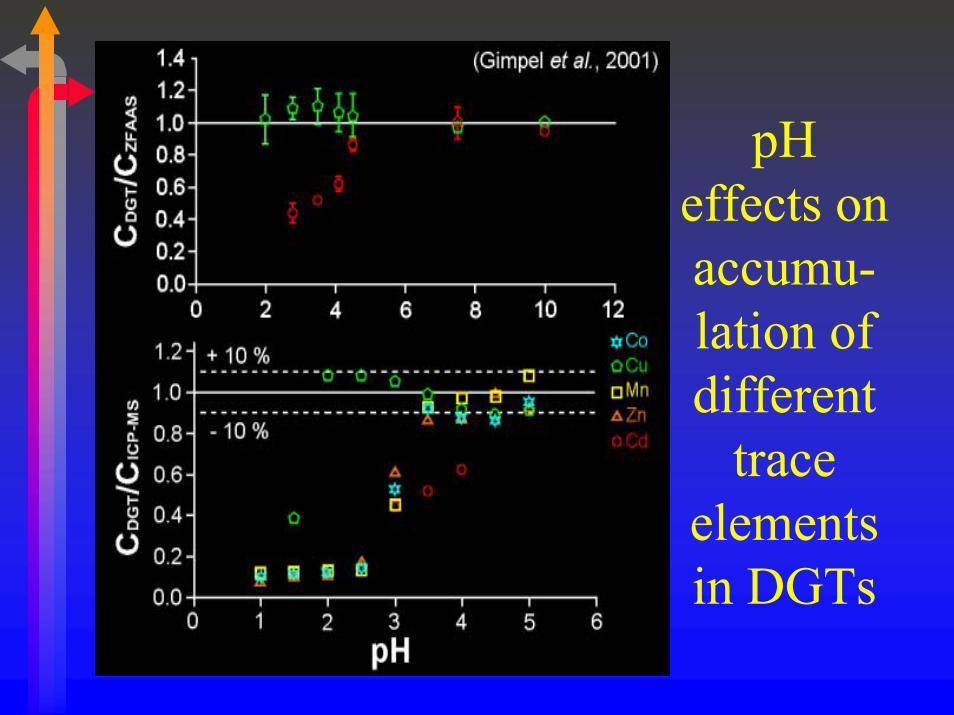
pH effects on accumu-lation of different
trace elements in DGTs
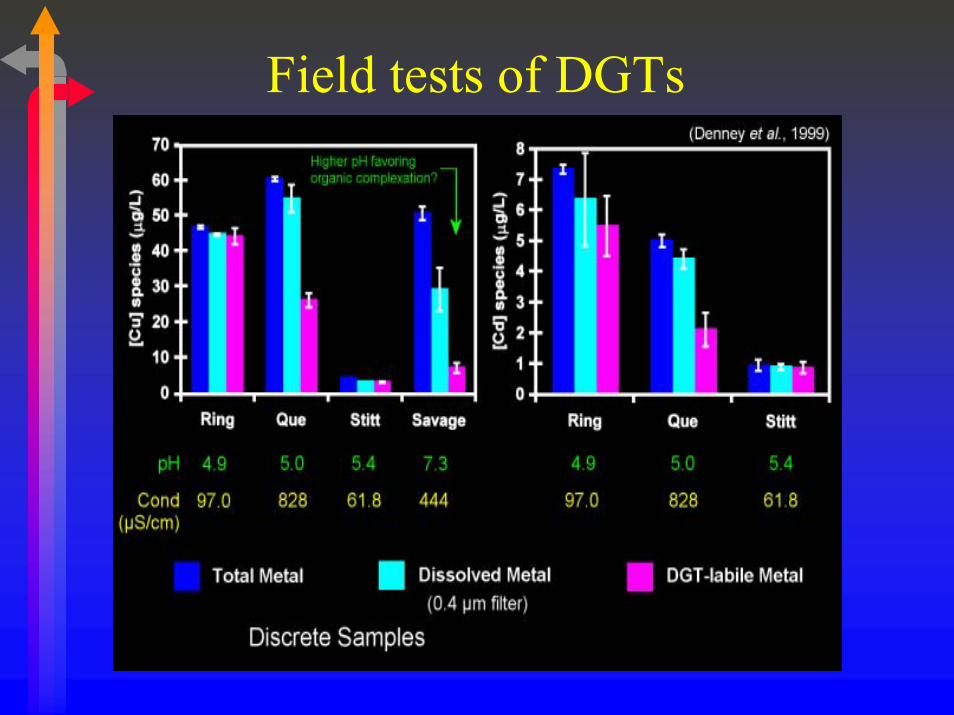
Field tests of DGTs
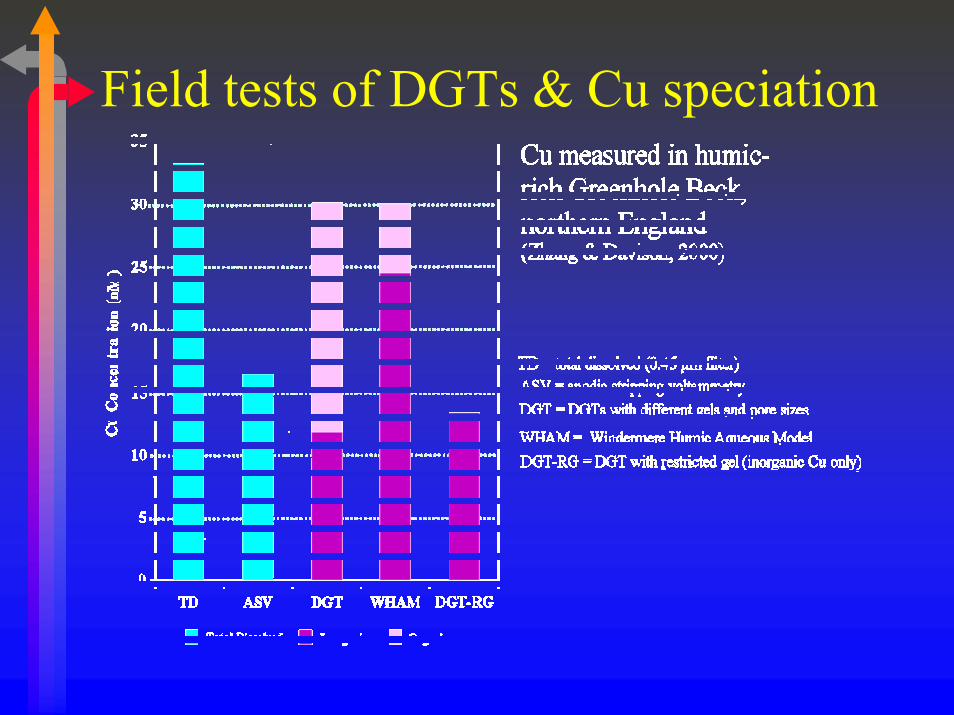
Field tests of DGTs & Cu speciation
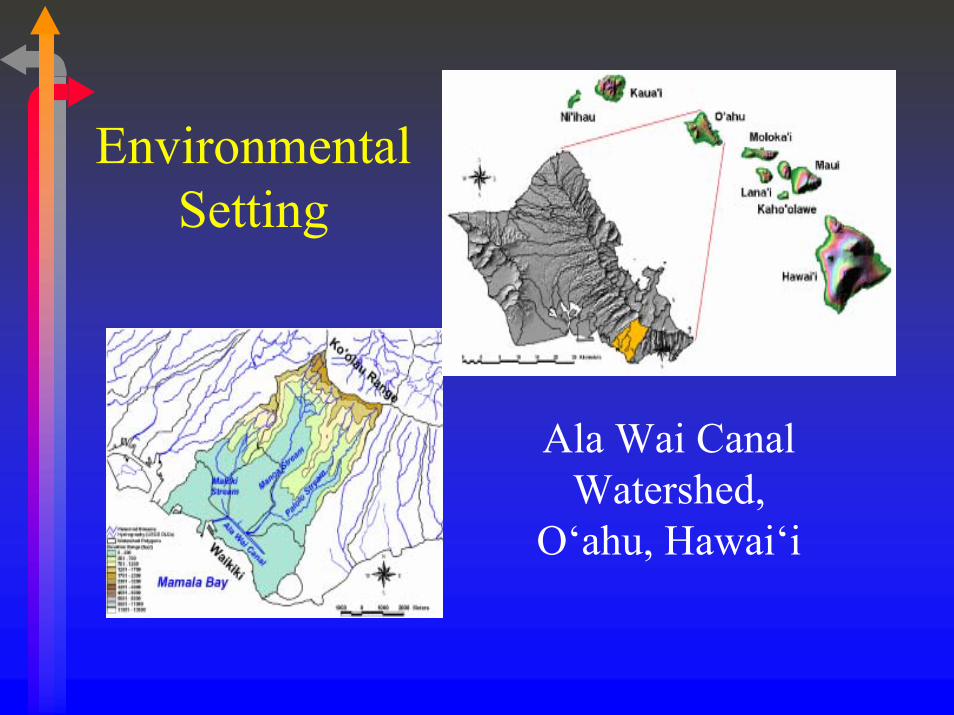
Ala Wai Canal Watershed,
O�ahu, Hawai�i
Environmental Setting
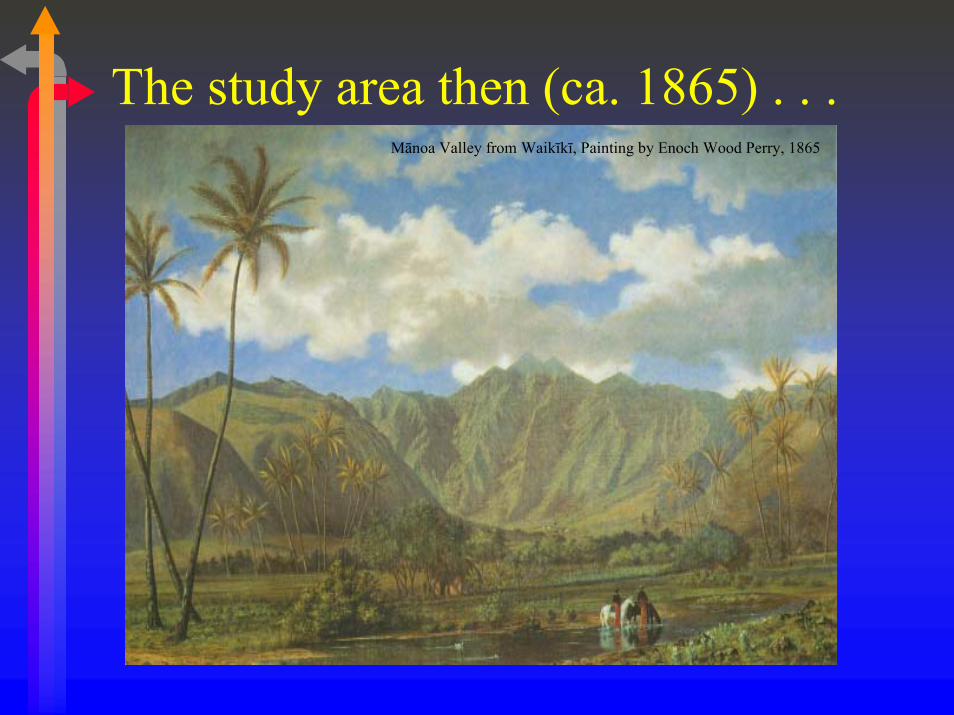
The study area then (ca. 1865) . . .Mānoa Valley from Waikīkī, Painting by Enoch Wood Perry, 1865
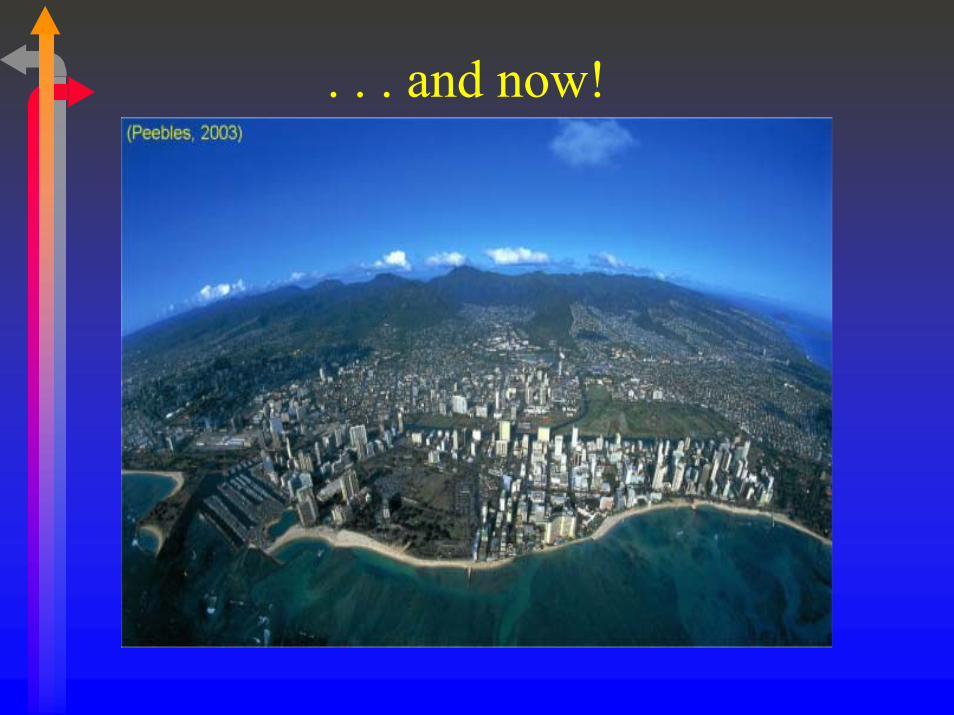
. . . and now!
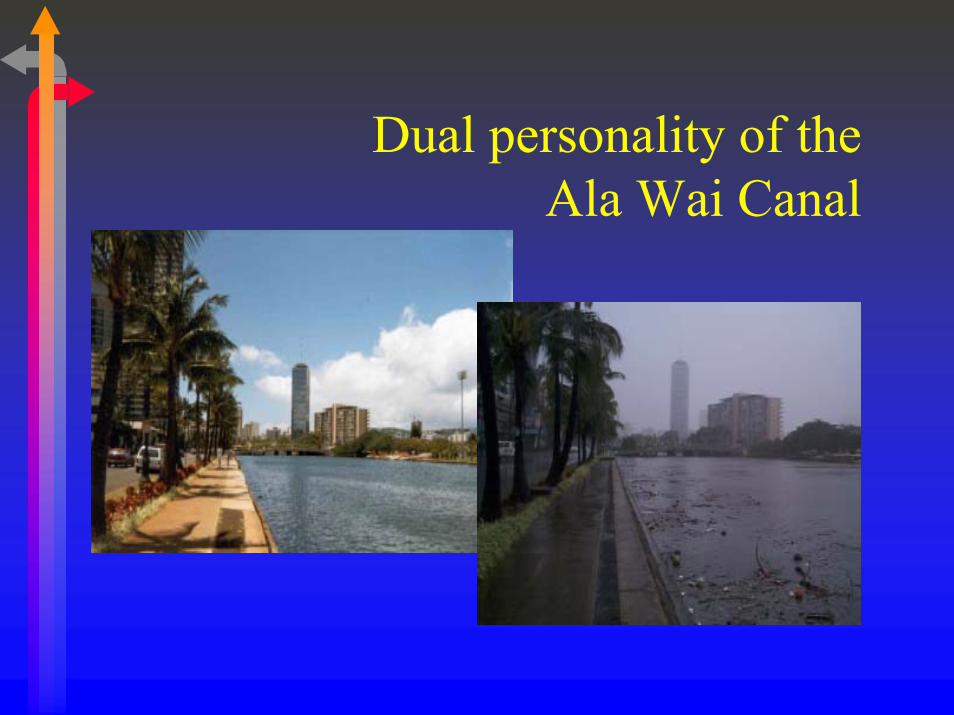
Dual personality of theAla Wai Canal

Dredging the Ala Wai Canal
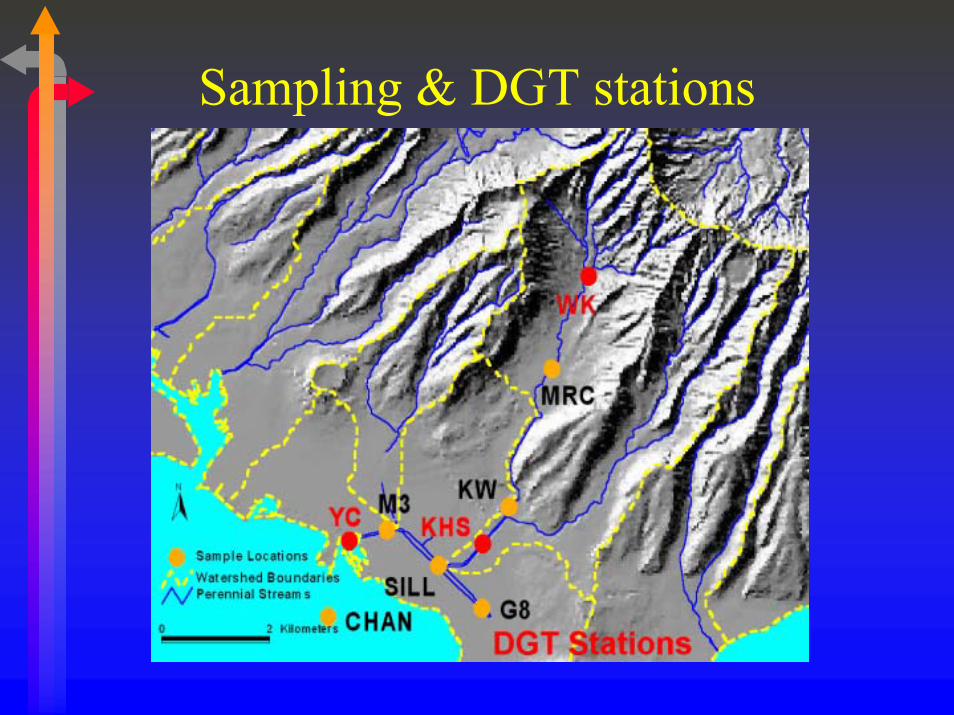
Sampling & DGT stations
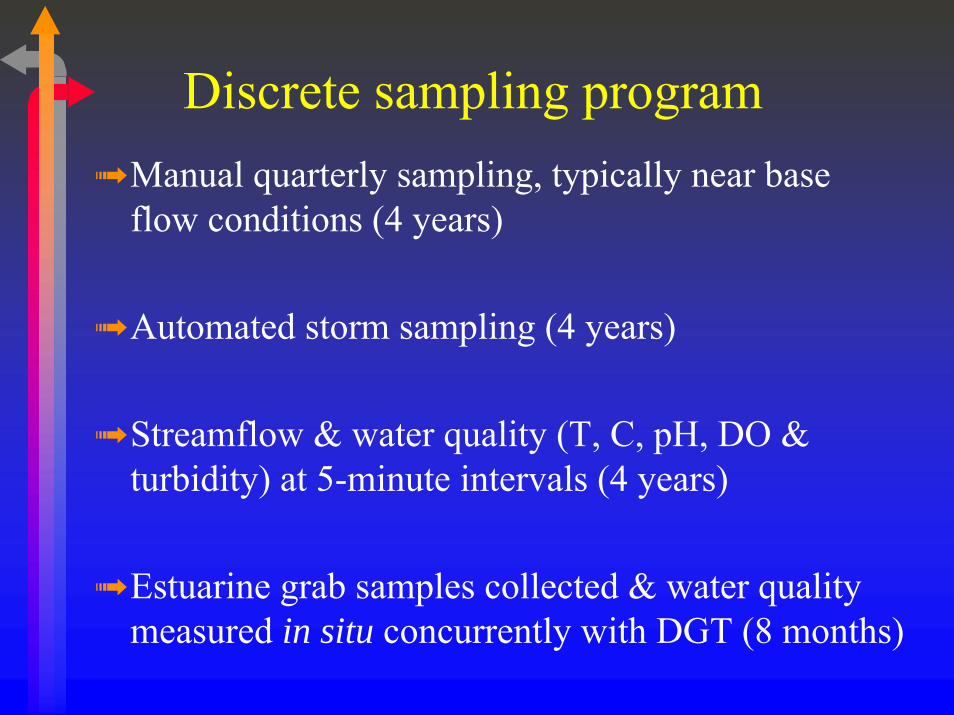
Discrete sampling program➟ Manual quarterly sampling, typically near base
flow conditions (4 years)
➟ Automated storm sampling (4 years)
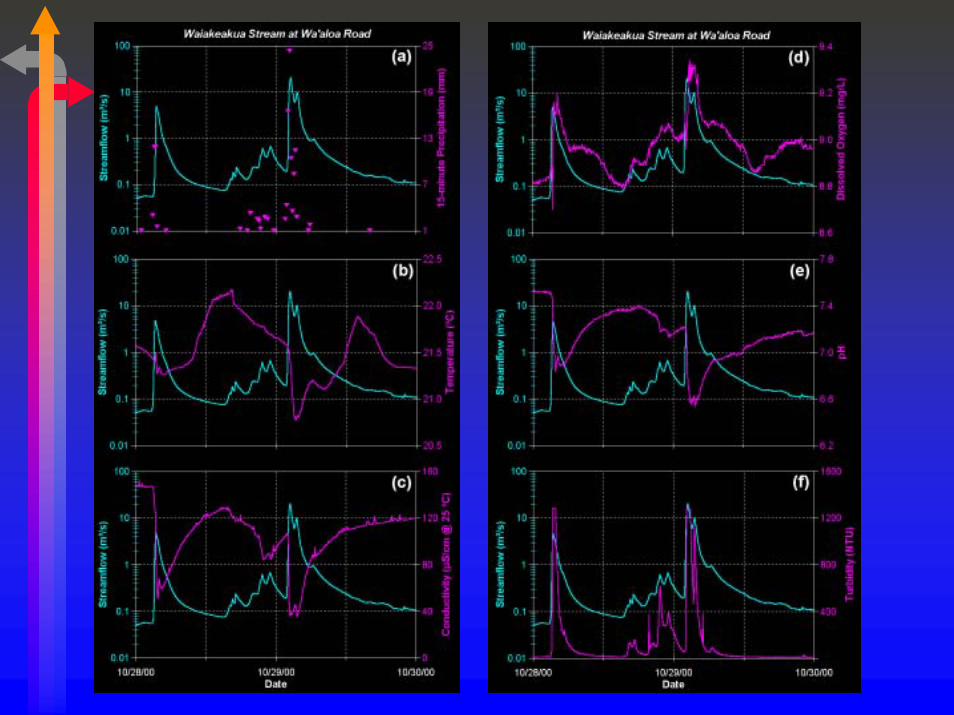
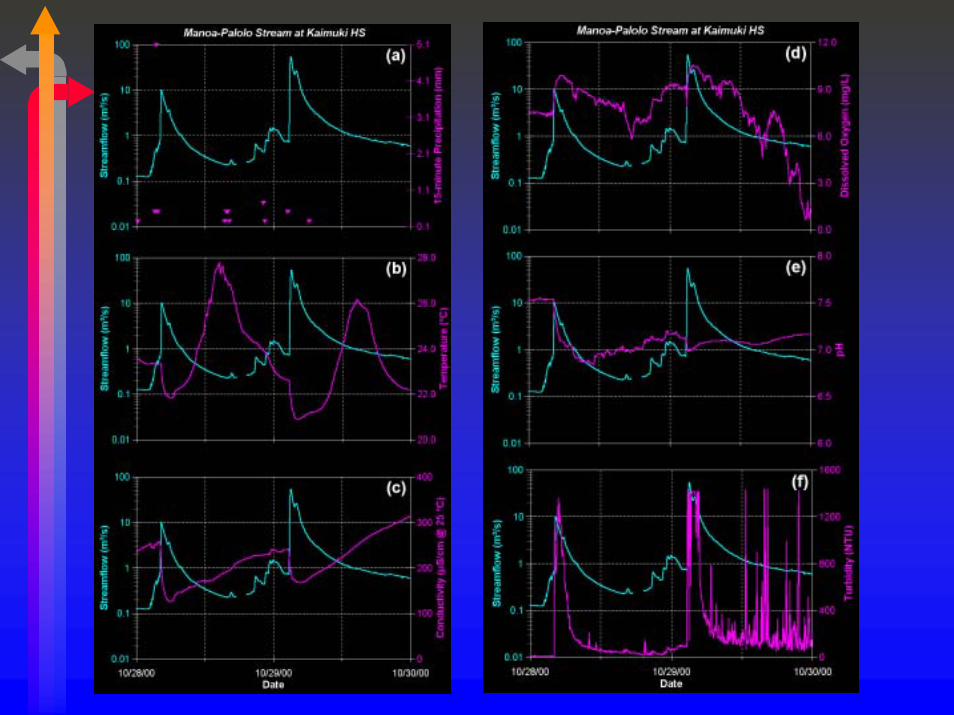
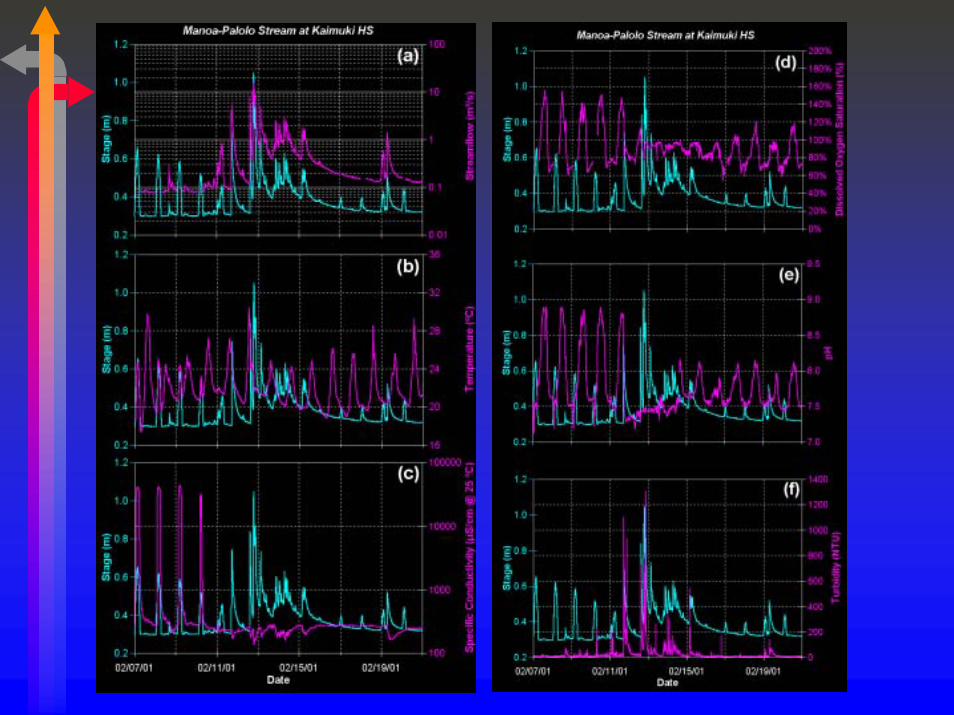
➟ Streamflow & water quality (T, C, pH, DO & turbidity) at 5-minute intervals (4 years)
➟ Estuarine grab samples collected & water quality measured in situ concurrently with DGT (8 months)
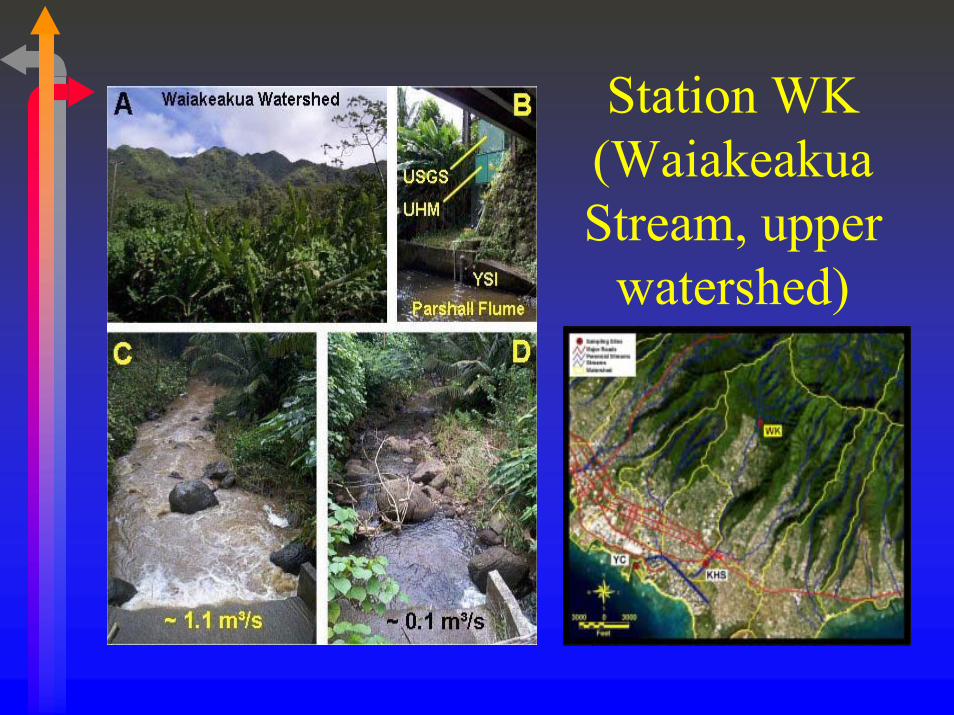
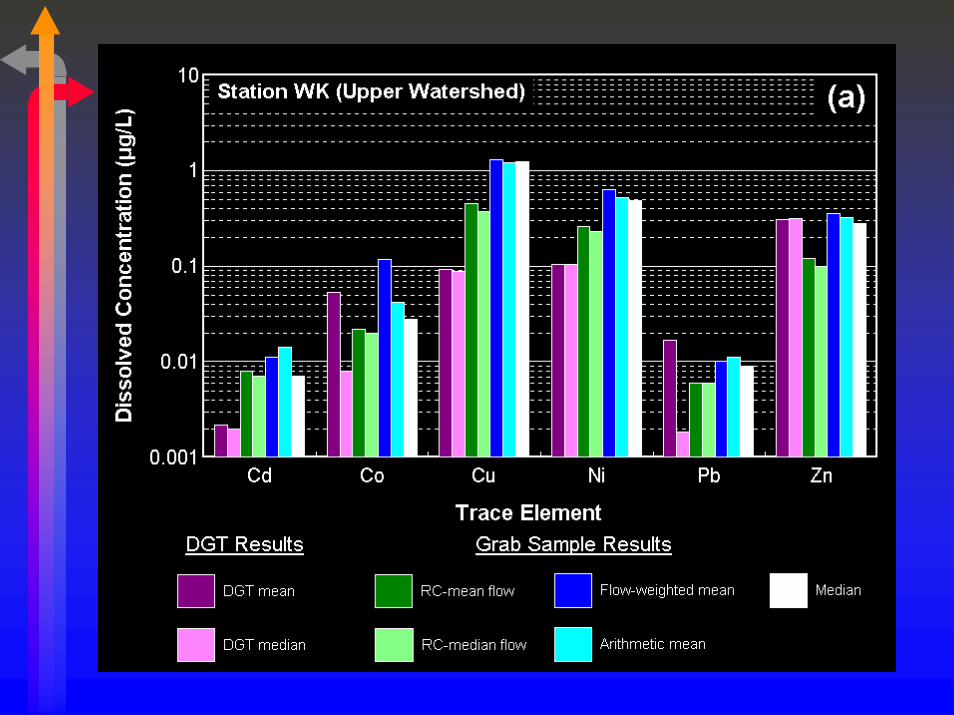
Station WK (WaiakeakuaStream, upper
watershed)
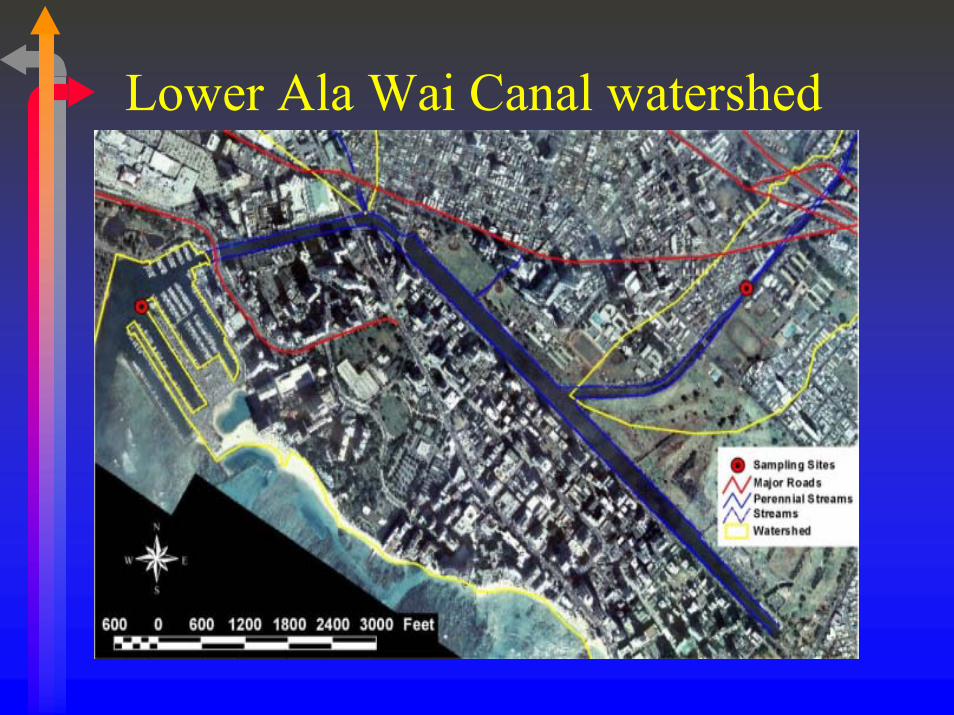
Lower Ala Wai Canal watershed
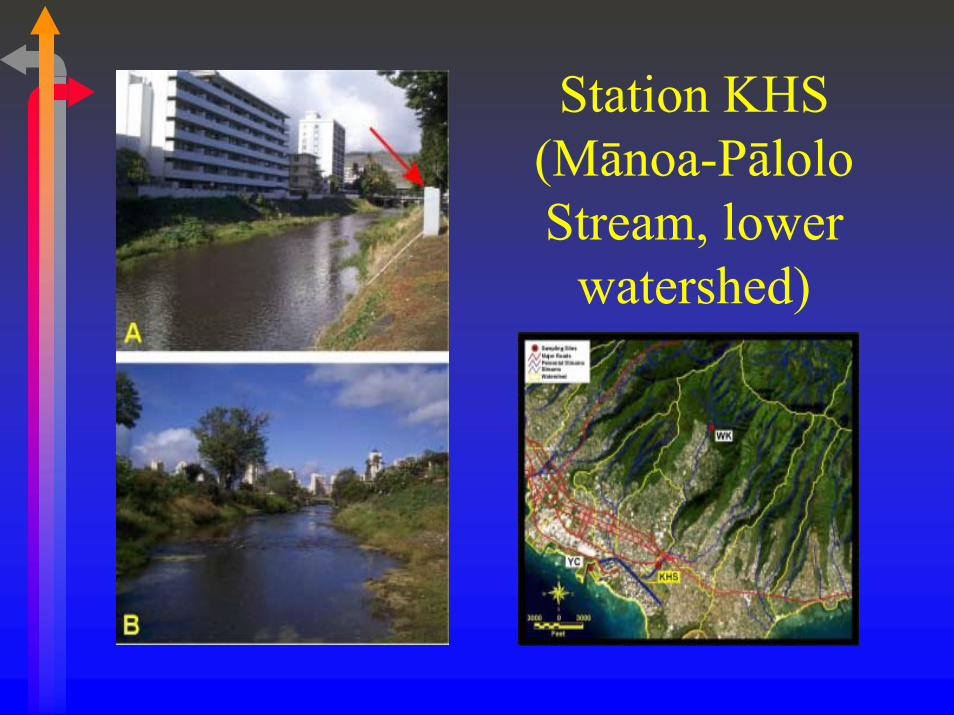
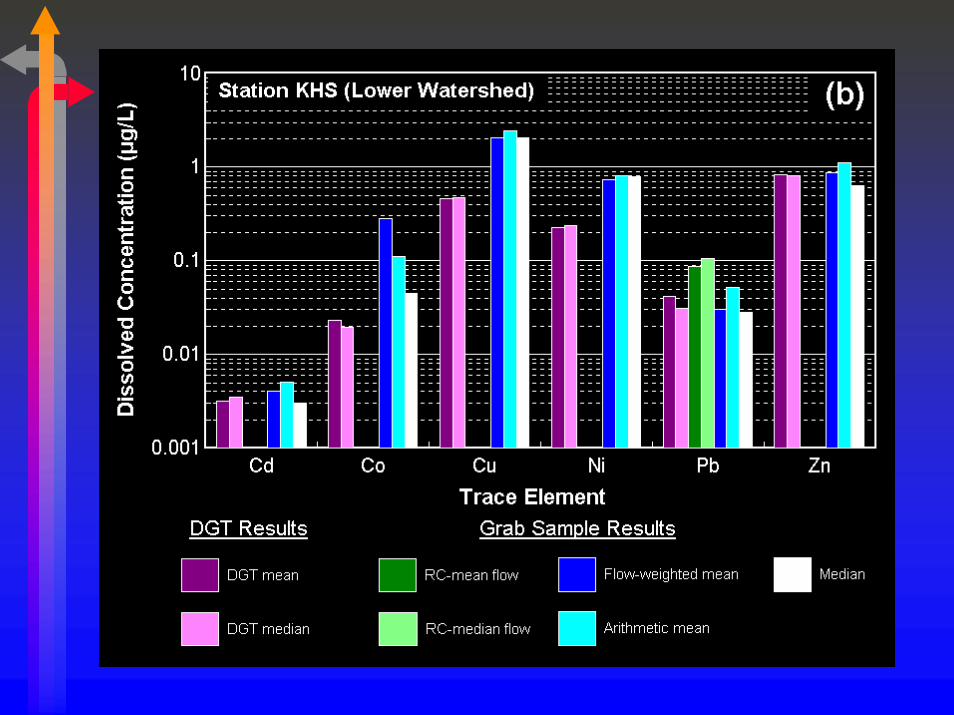
Station KHS(Mānoa-Pālolo Stream, lower
watershed)
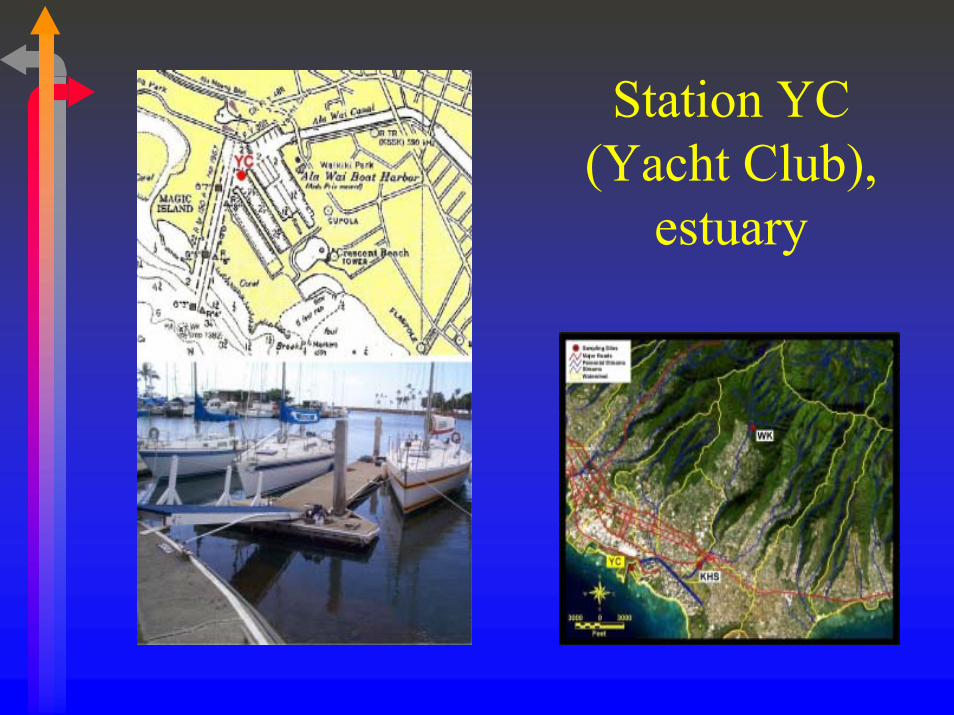
Station YC(Yacht Club),
estuary
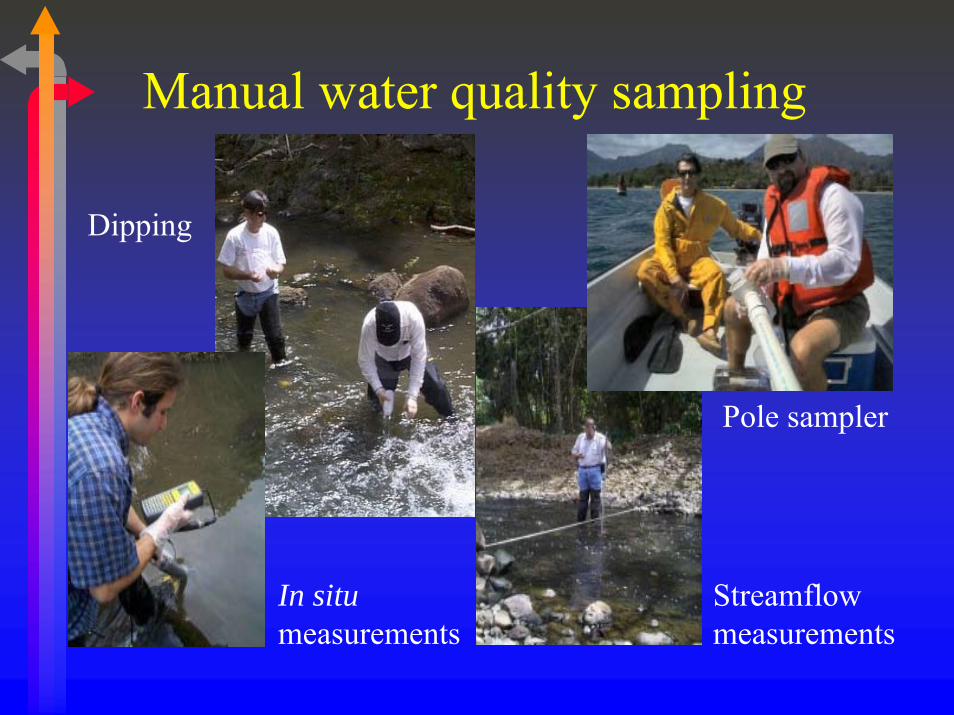
Manual water quality sampling
Dipping
In situmeasurements
Pole sampler
Streamflowmeasurements
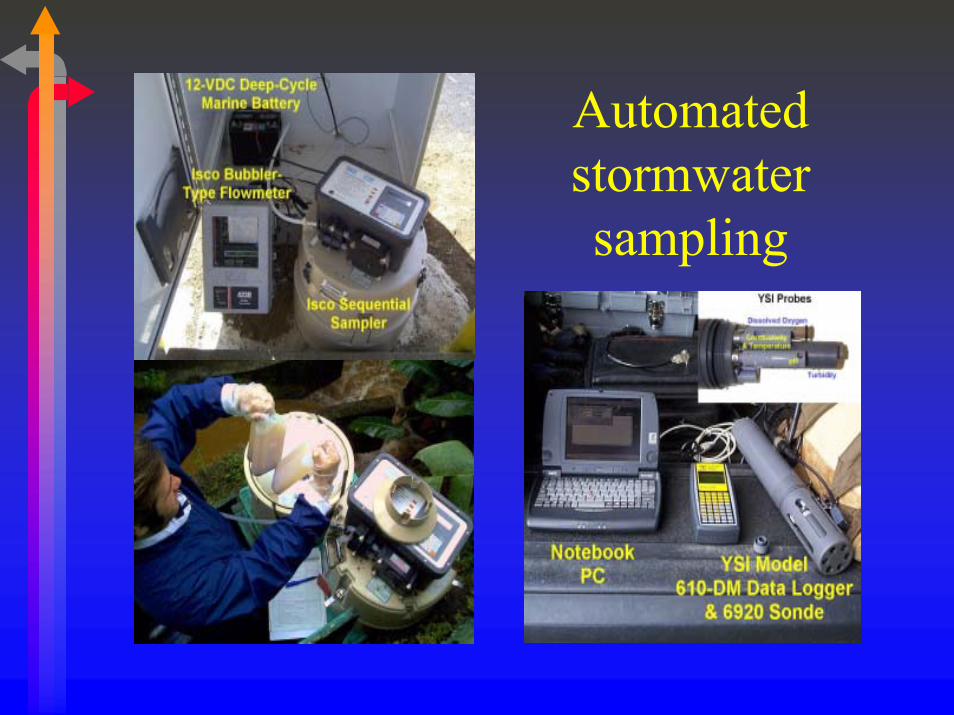
Automatedstormwatersampling
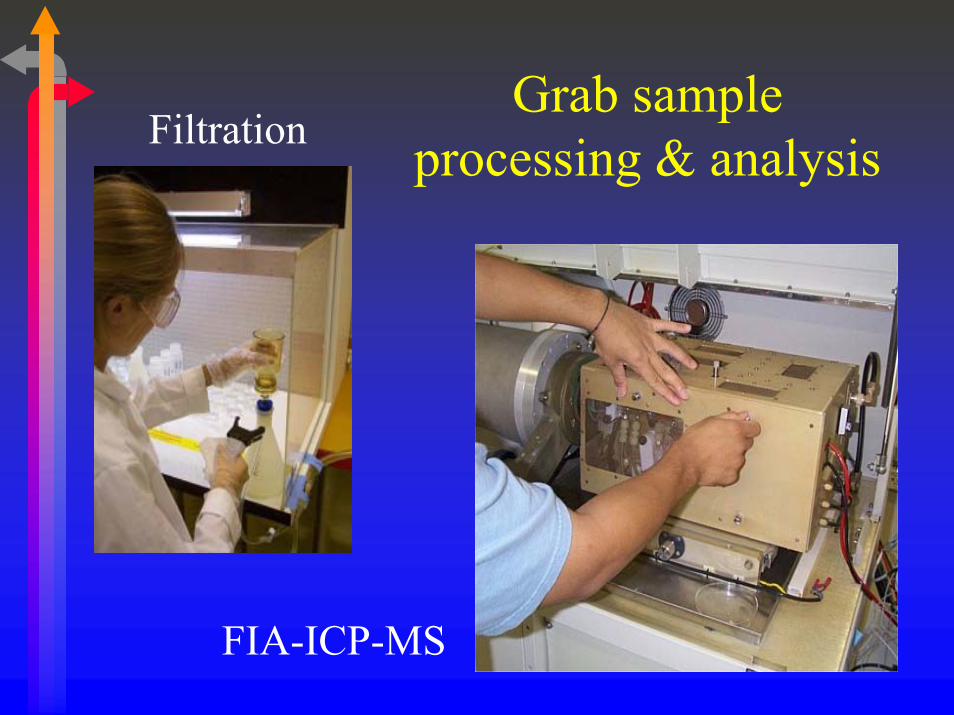
Grab sample processing & analysisFiltration
FIA-ICP-MS
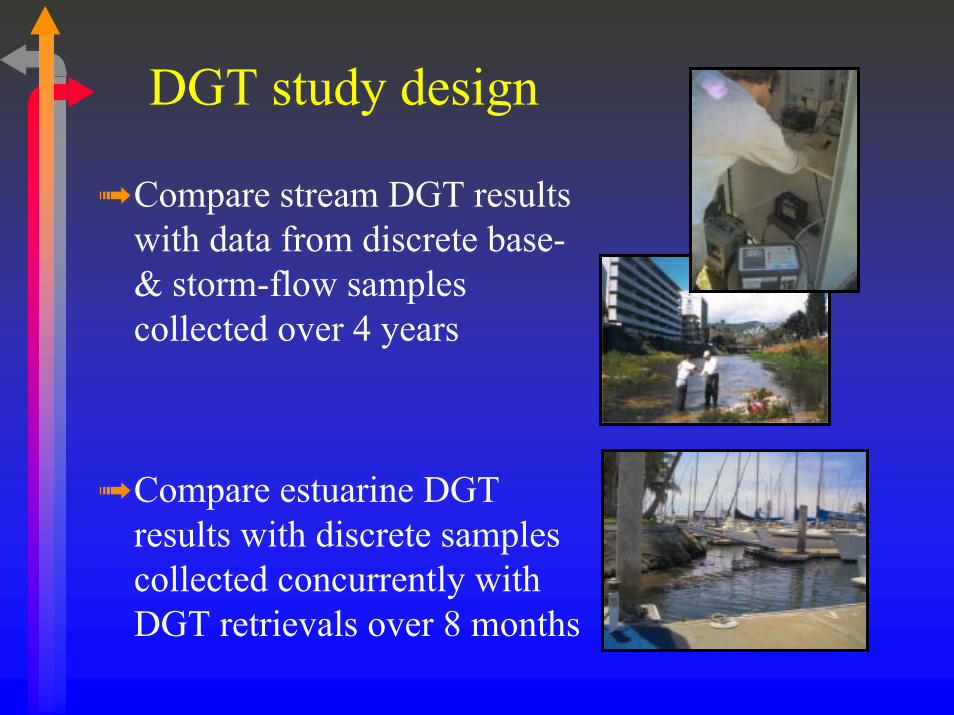
DGT study design
➟ Compare stream DGT results with data from discrete base-& storm-flow samples collected over 4 years
➟ Compare estuarine DGT results with discrete samples collected concurrently with DGT retrievals over 8 months
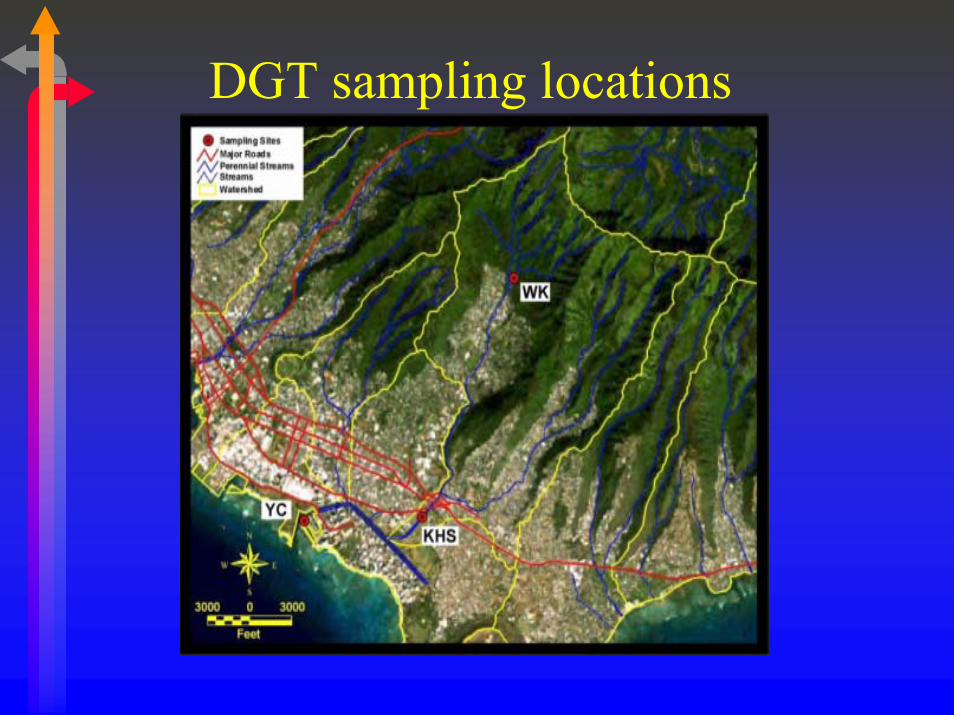
DGT sampling locations
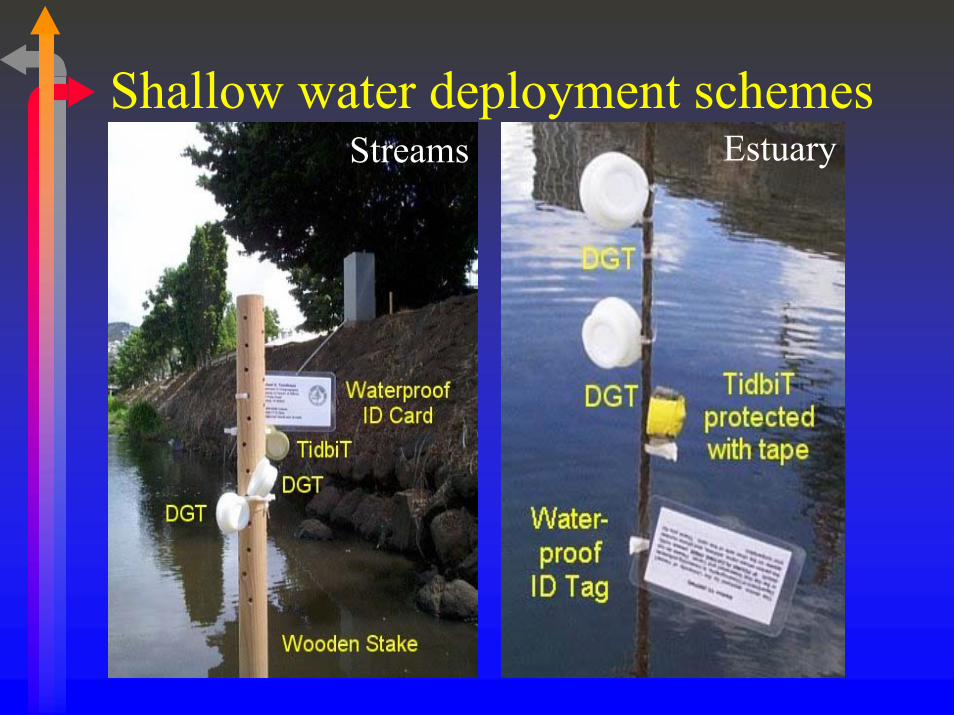
Shallow water deployment schemesStreams Estuary
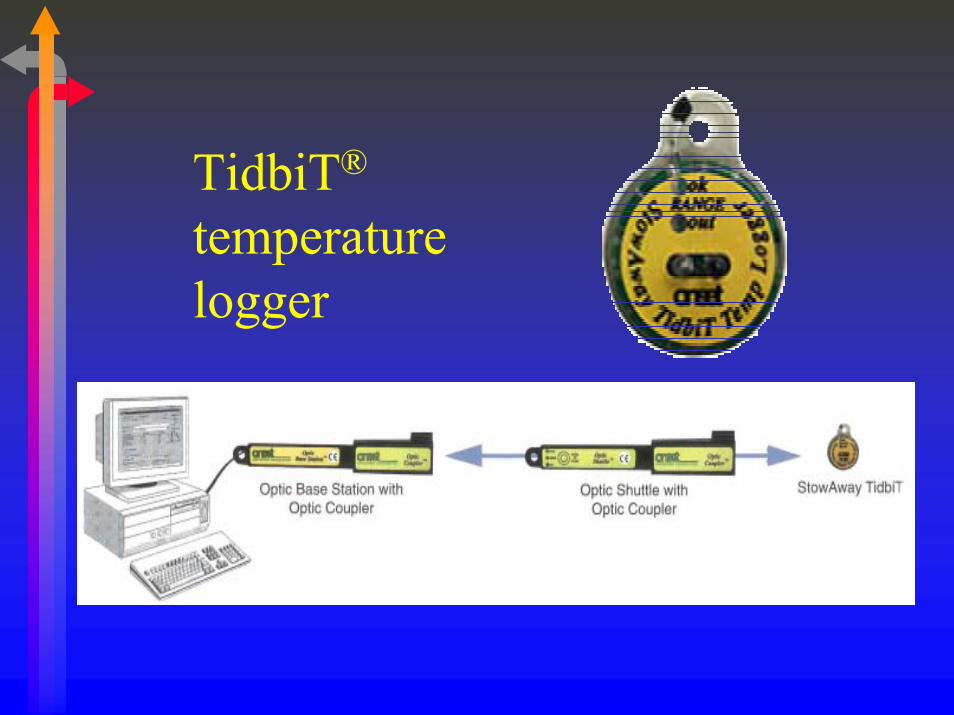
TidbiT®
temperature logger
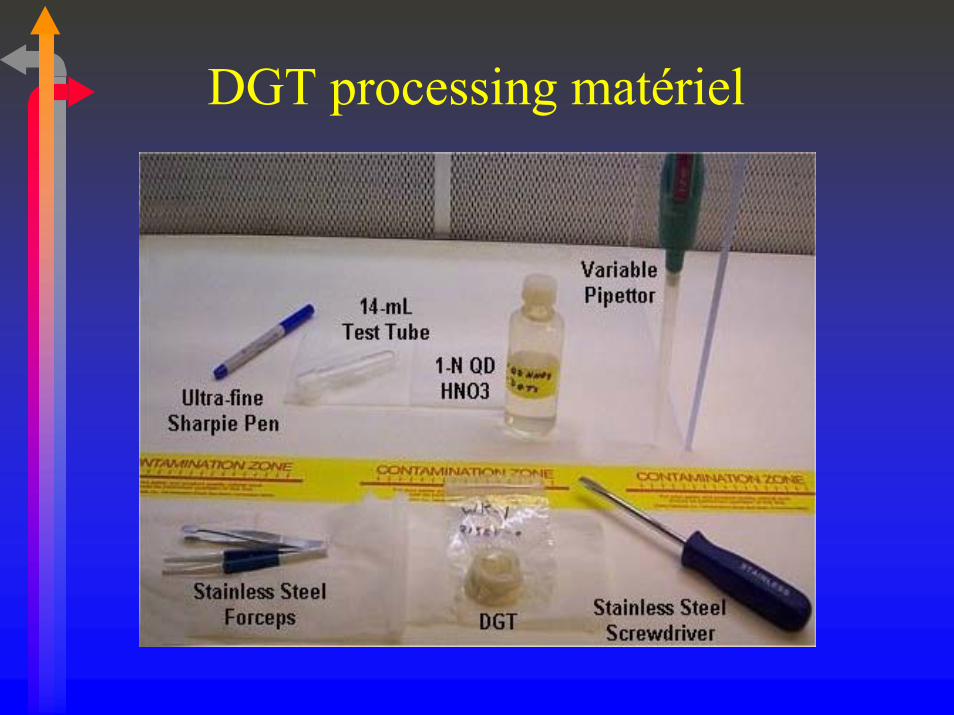
DGT processing matériel
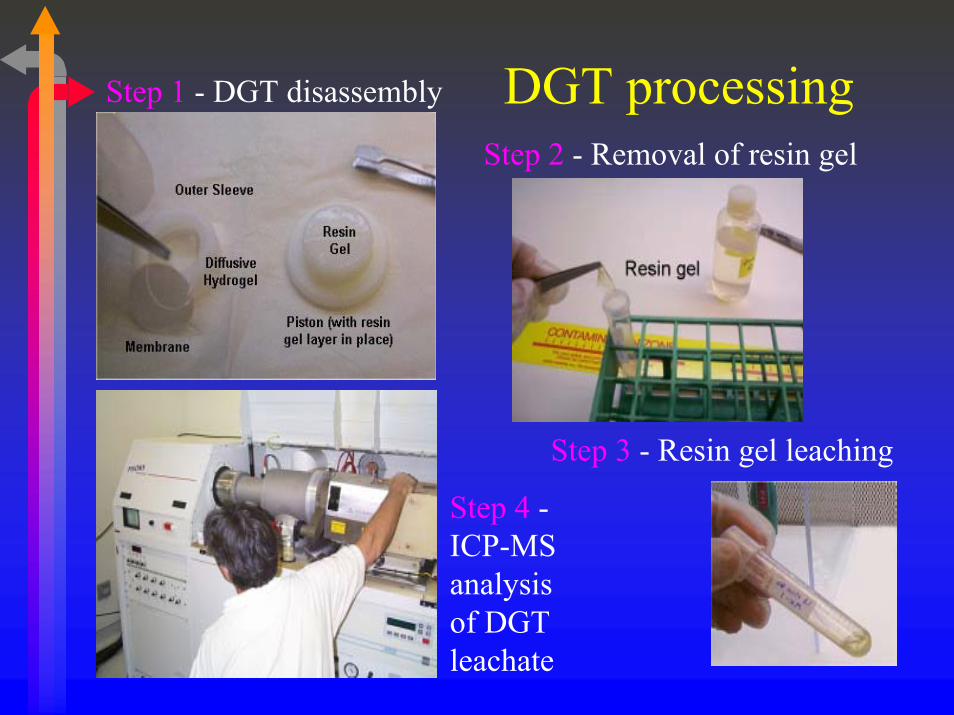
DGT processingStep 1 - DGT disassembly
Step 2 - Removal of resin gel
Step 3 - Resin gel leaching
Step 4 -ICP-MSanalysisof DGT leachate
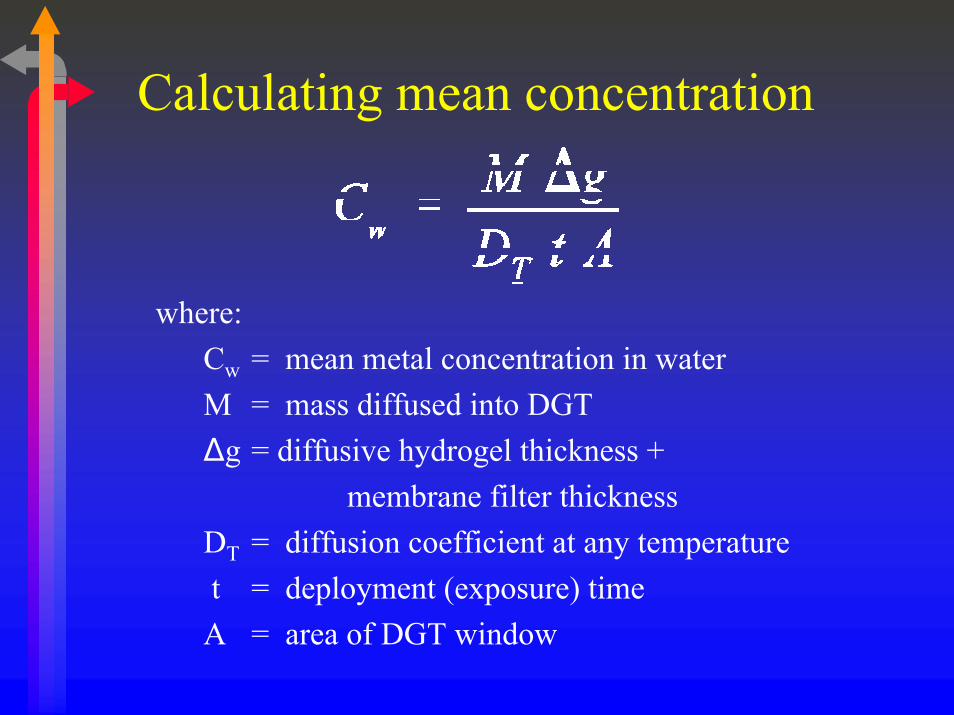
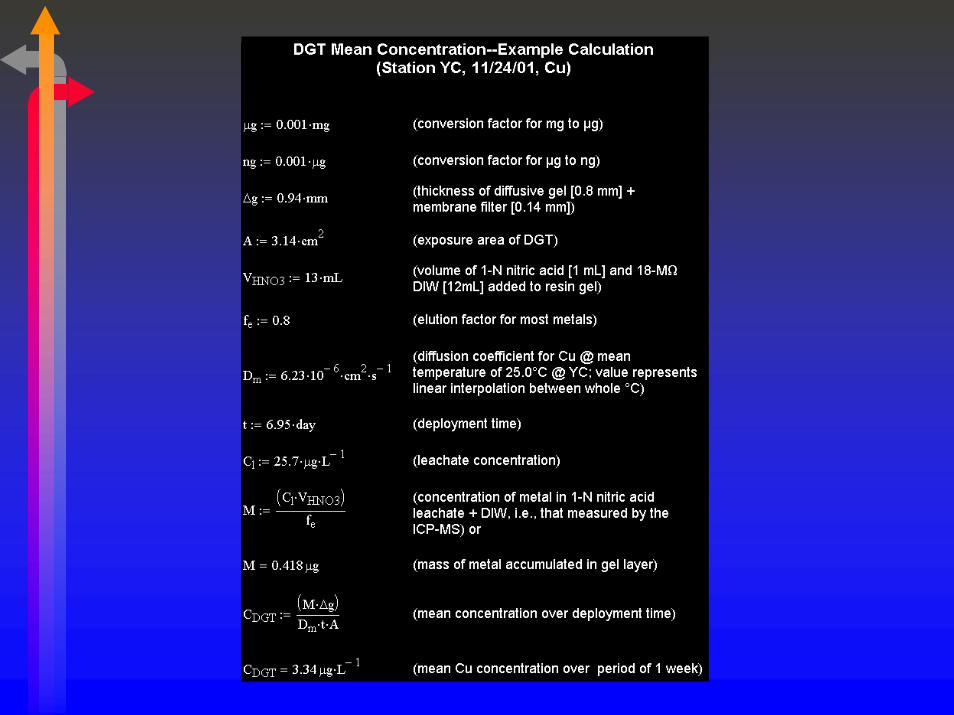
Calculating mean concentration
where:Cw = mean metal concentration in waterM = mass diffused into DGT)g = diffusive hydrogel thickness +
membrane filter thicknessDT = diffusion coefficient at any temperaturet = deployment (exposure) timeA = area of DGT window
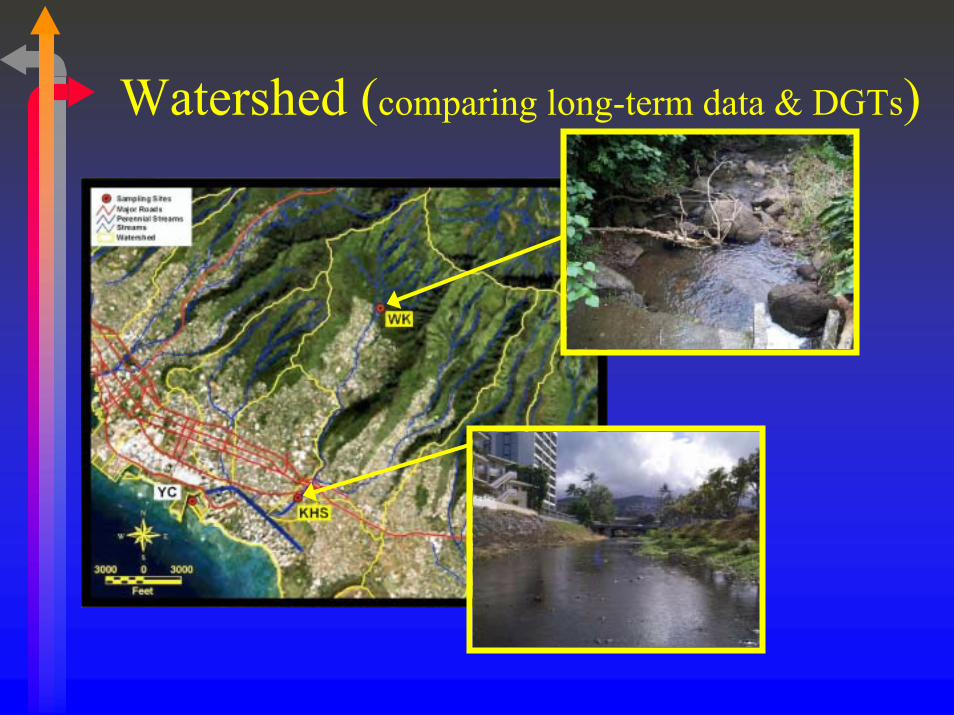
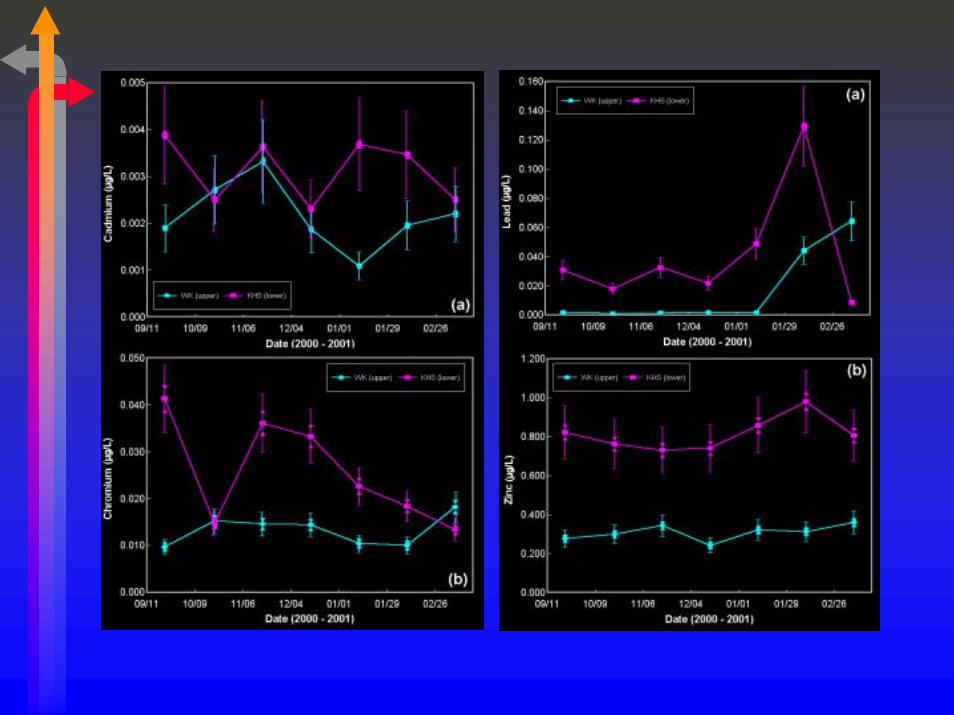
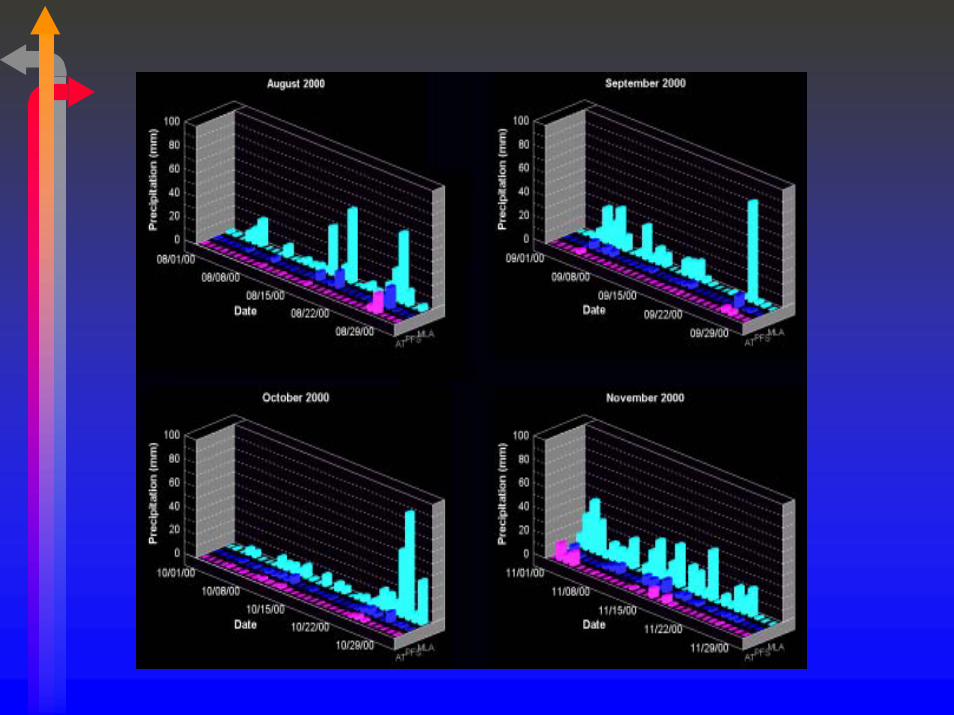
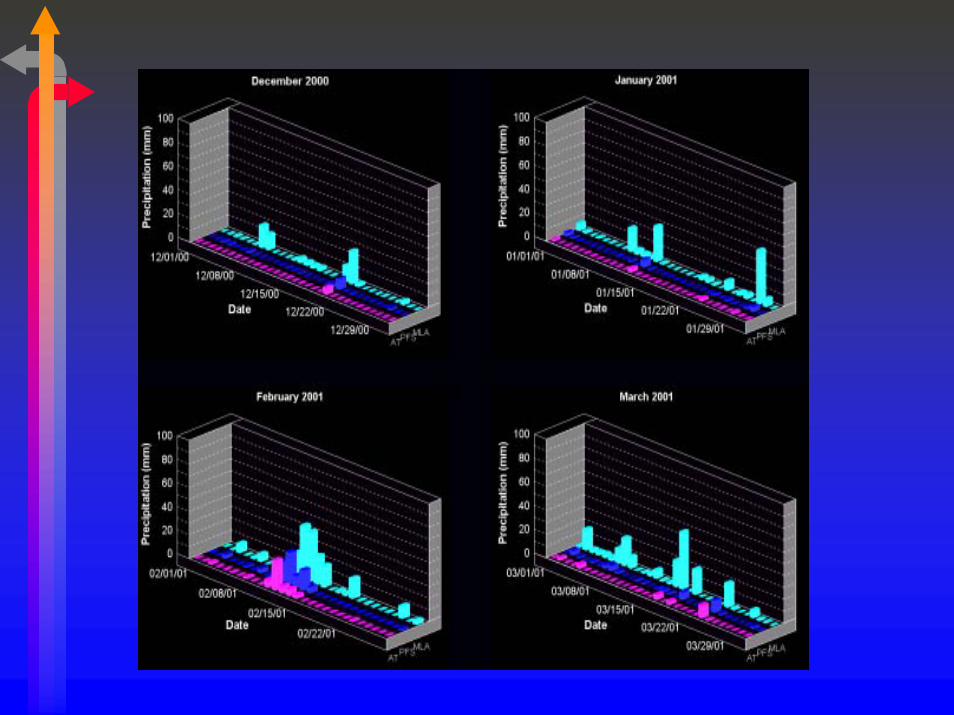
Watershed (comparing long-term data & DGTs)
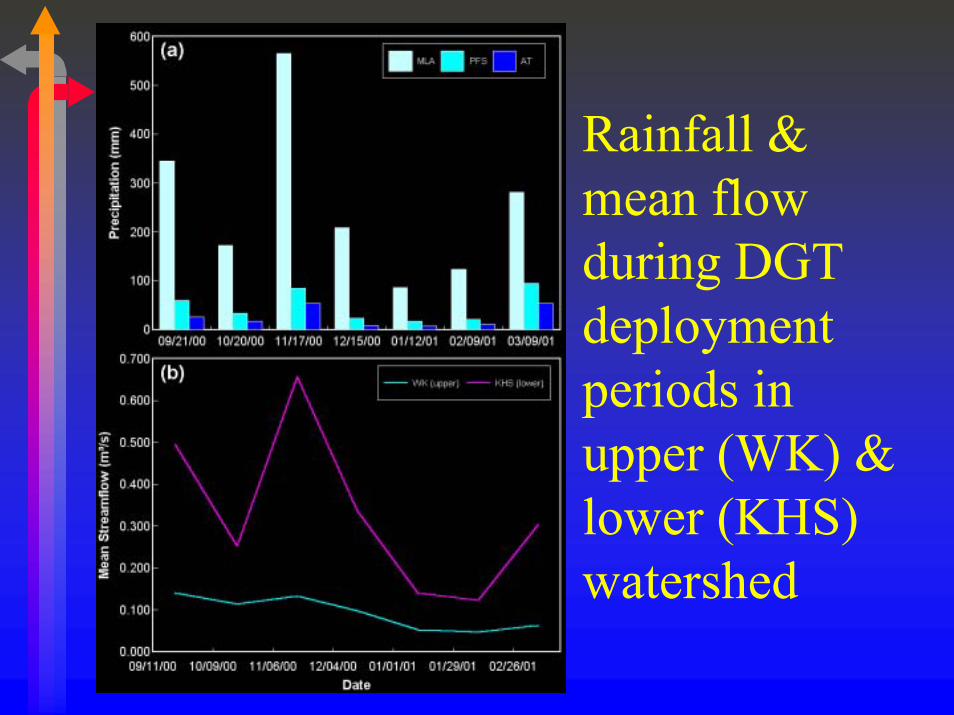
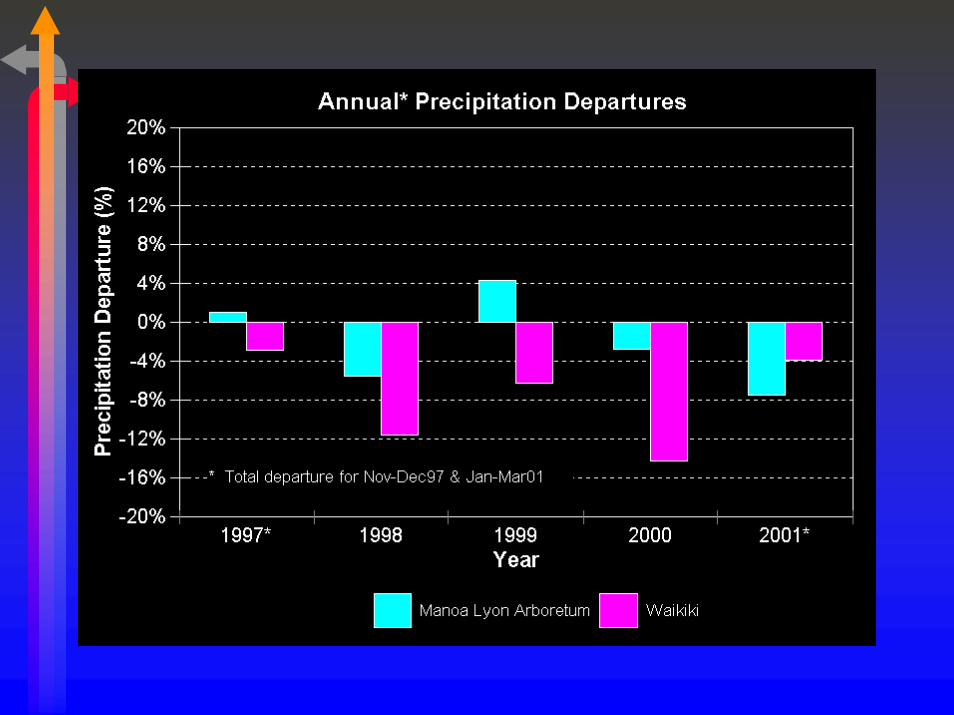
Rainfall & mean flow during DGT deployment periods in upper (WK) & lower (KHS) watershed
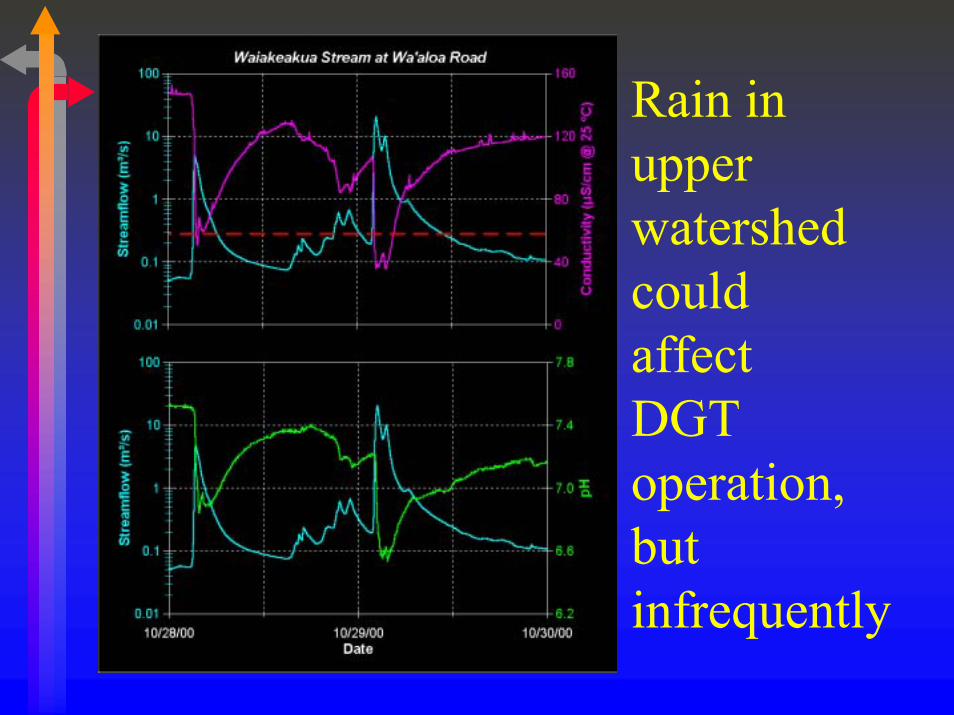
Rain in upper watershed couldaffectDGT operation, but infrequently
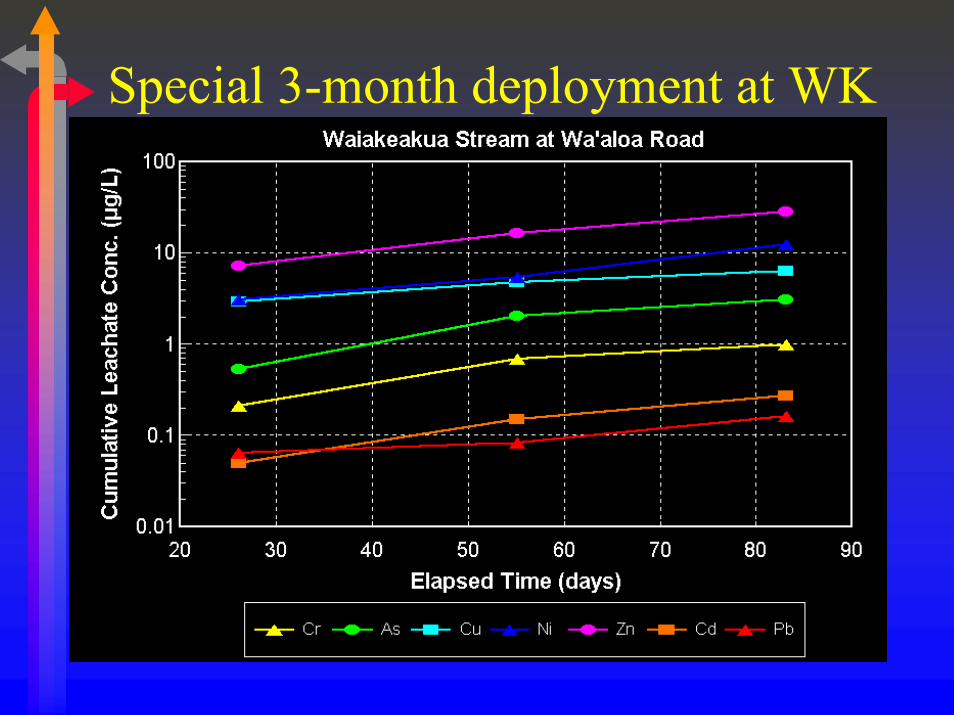
Special 3-month deployment at WK
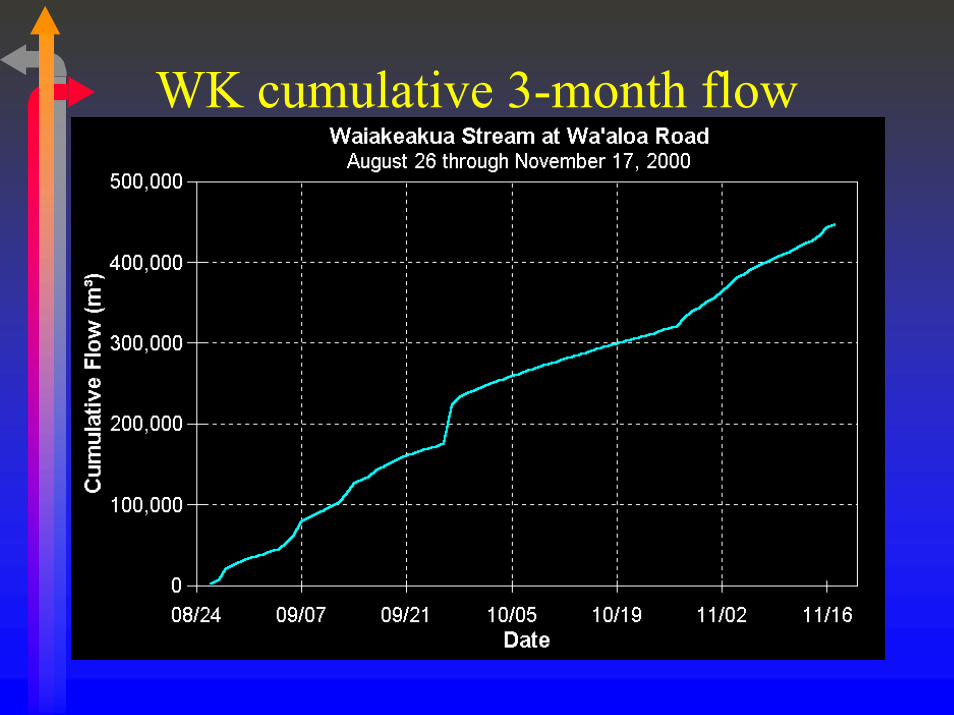
WK cumulative 3-month flow
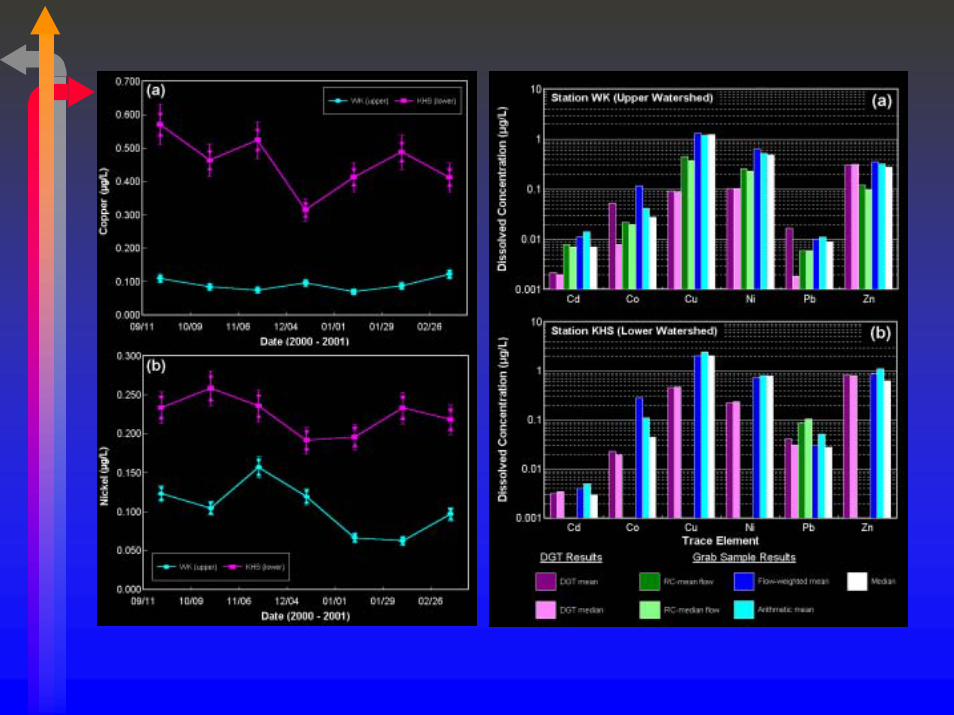
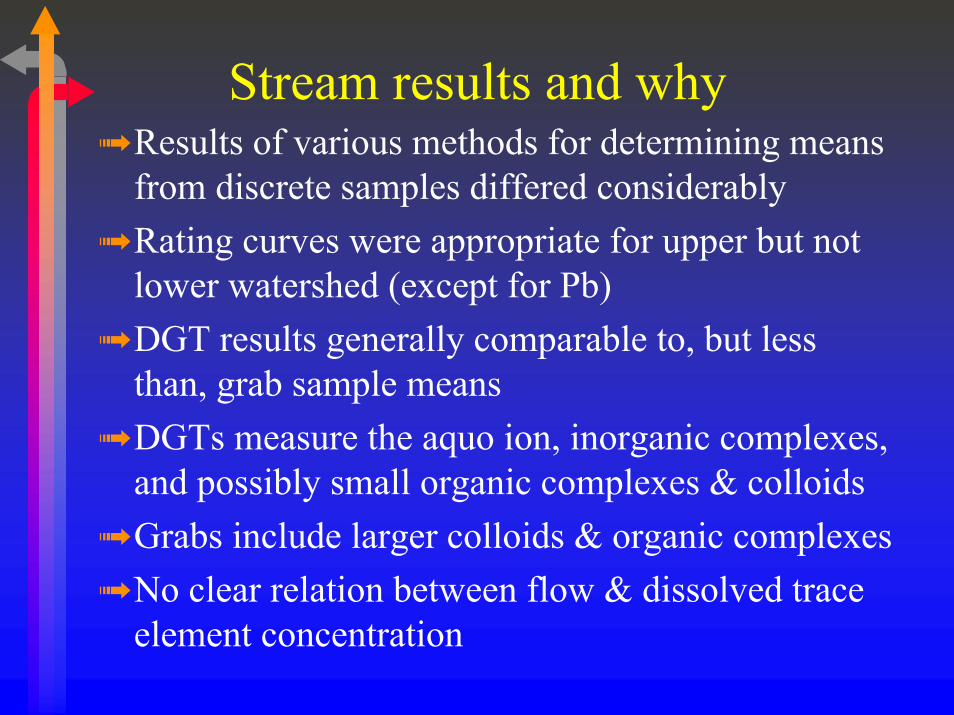
Stream results and why➟ Results of various methods for determining means
from discrete samples differed considerably➟ Rating curves were appropriate for upper but not
lower watershed (except for Pb)➟ DGT results generally comparable to, but less
than, grab sample means➟ DGTs measure the aquo ion, inorganic complexes,
and possibly small organic complexes & colloids➟ Grabs include larger colloids & organic complexes➟ No clear relation between flow & dissolved trace
element concentration
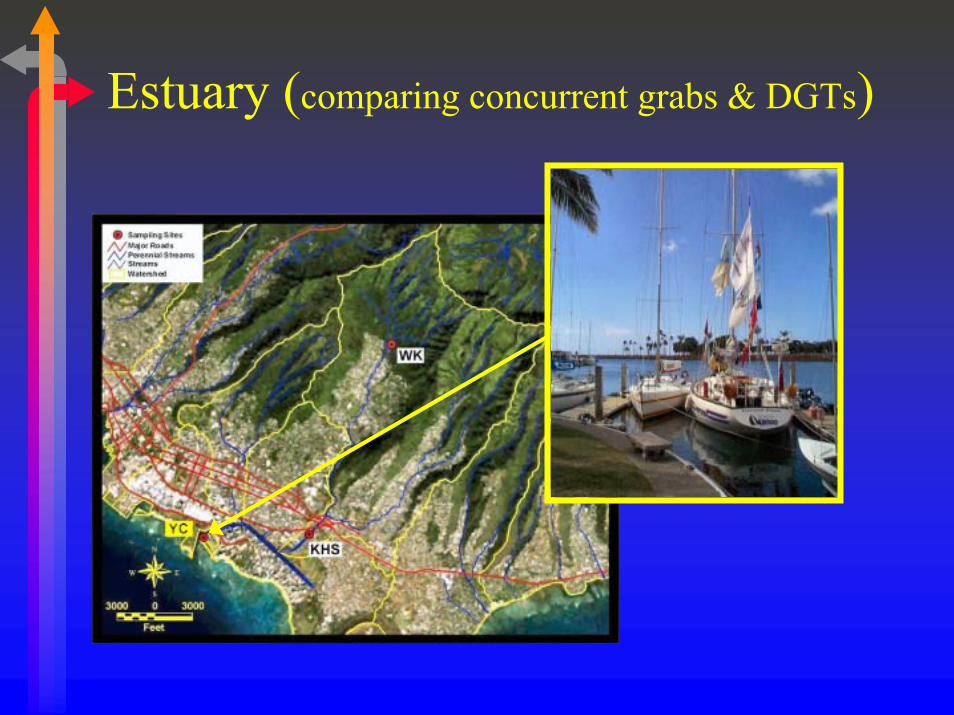
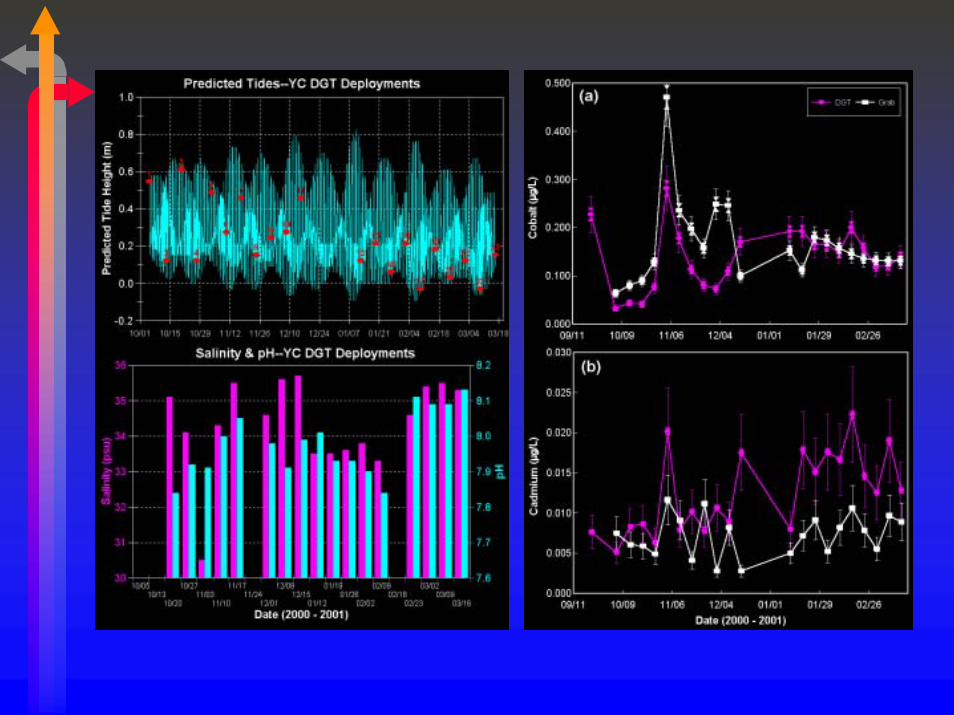
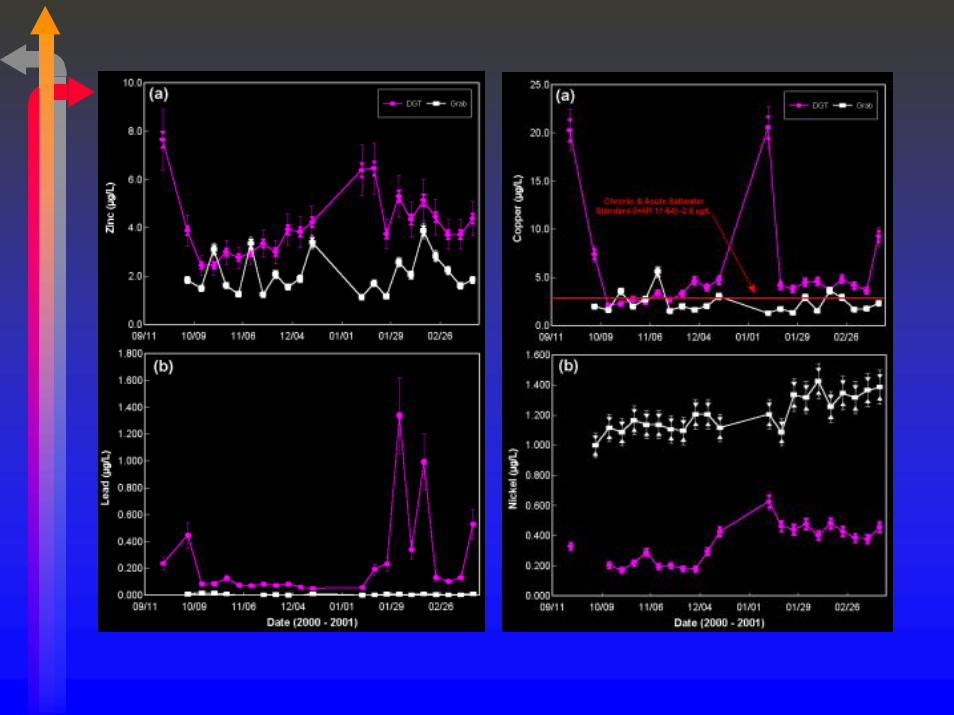
Estuary (comparing concurrent grabs & DGTs)
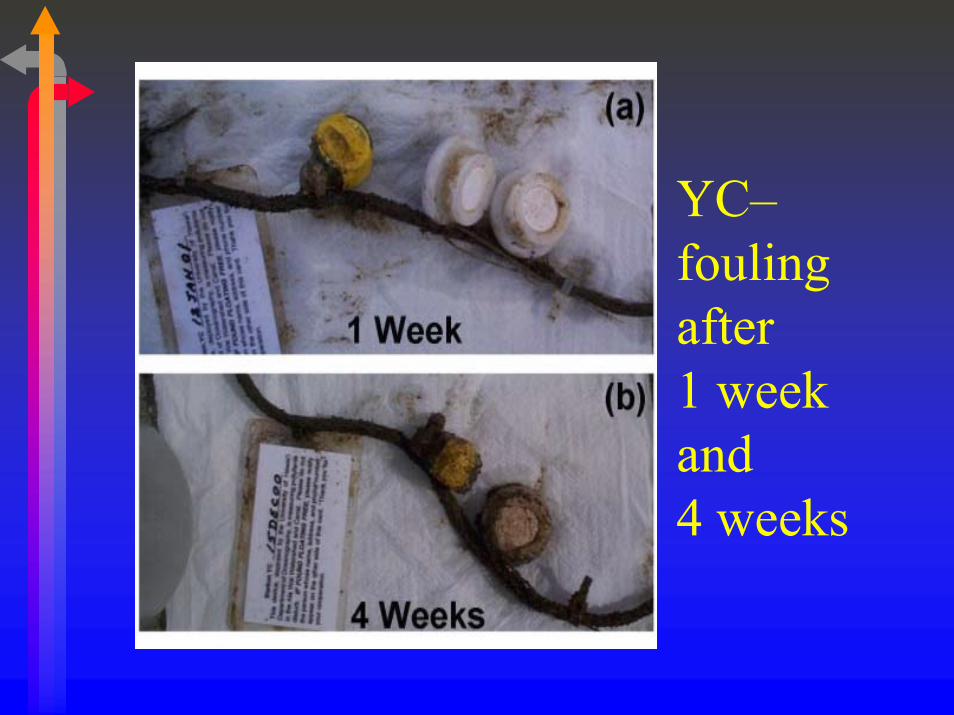
YC�fouling after1 weekand4 weeks
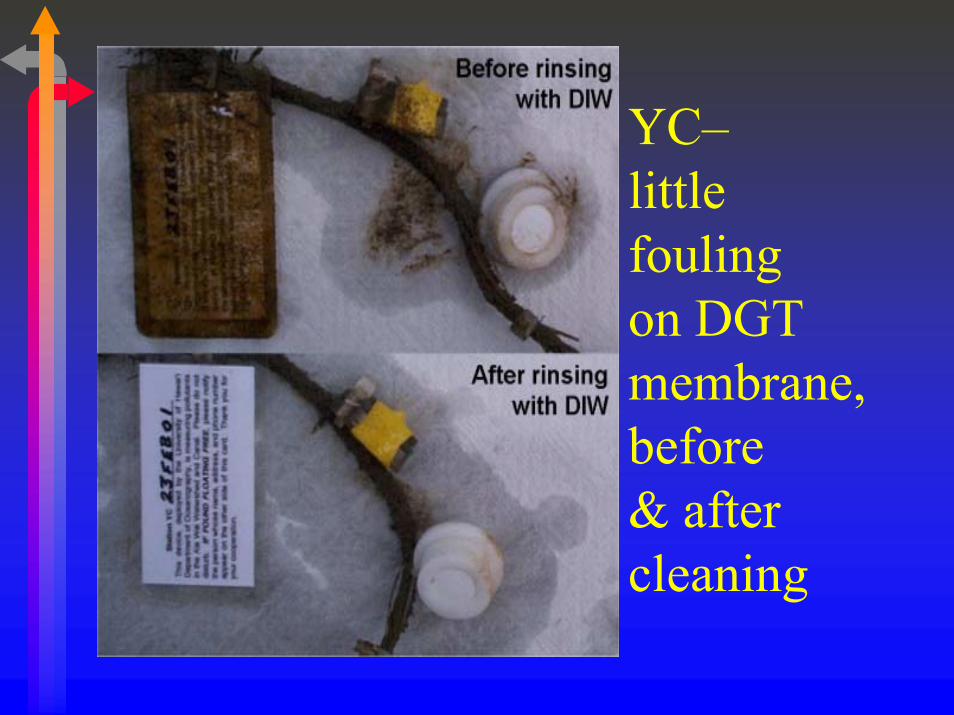
YC�little foulingon DGT membrane, before& after cleaning
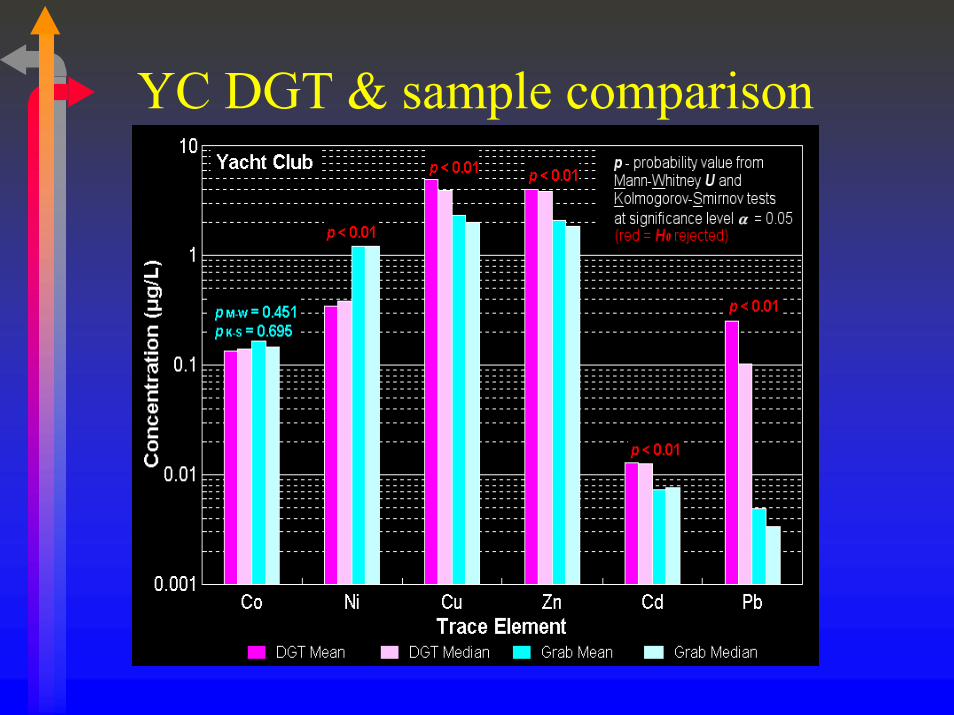
YC DGT & sample comparison
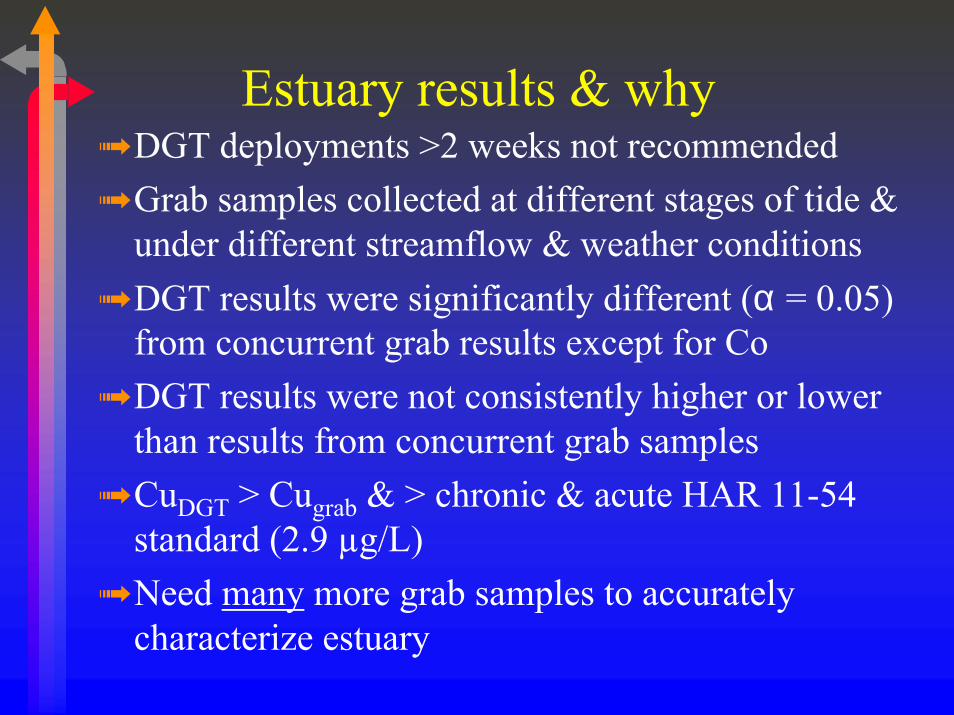
Estuary results & why➟ DGT deployments >2 weeks not recommended➟ Grab samples collected at different stages of tide &
under different streamflow & weather conditions➟ DGT results were significantly different (α = 0.05)
from concurrent grab results except for Co➟ DGT results were not consistently higher or lower
than results from concurrent grab samples➟ CuDGT > Cugrab & > chronic & acute HAR 11-54
standard (2.9 µg/L)➟ Need many more grab samples to accurately
characterize estuary
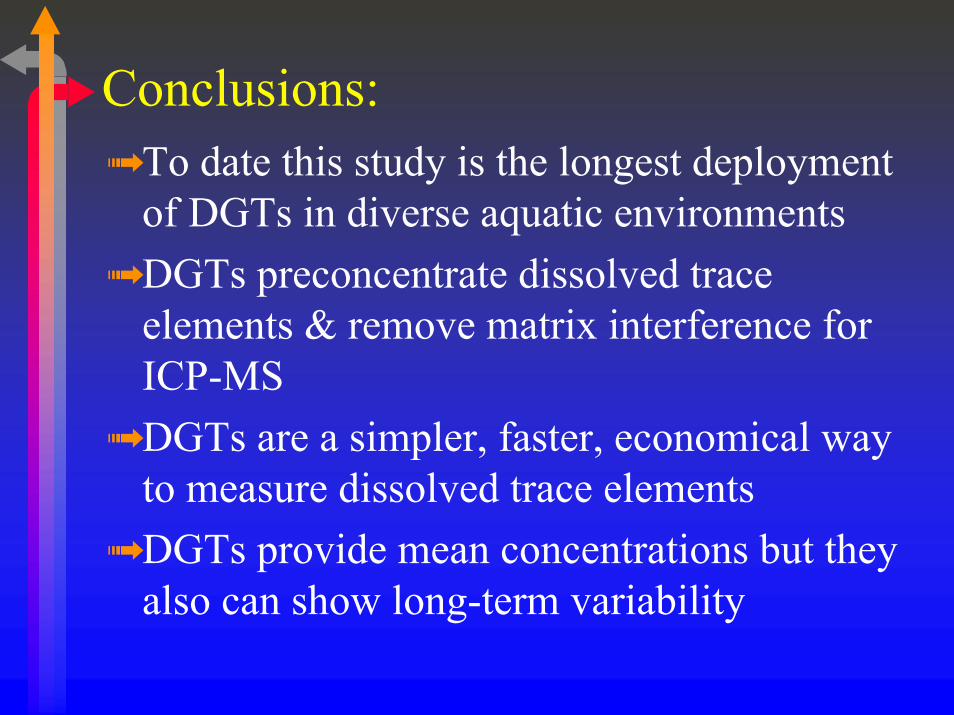
Conclusions:➟ To date this study is the longest deployment
of DGTs in diverse aquatic environments➟ DGTs preconcentrate dissolved trace
elements & remove matrix interference for ICP-MS
➟ DGTs are a simpler, faster, economical way to measure dissolved trace elements
➟ DGTs provide mean concentrations but they also can show long-term variability
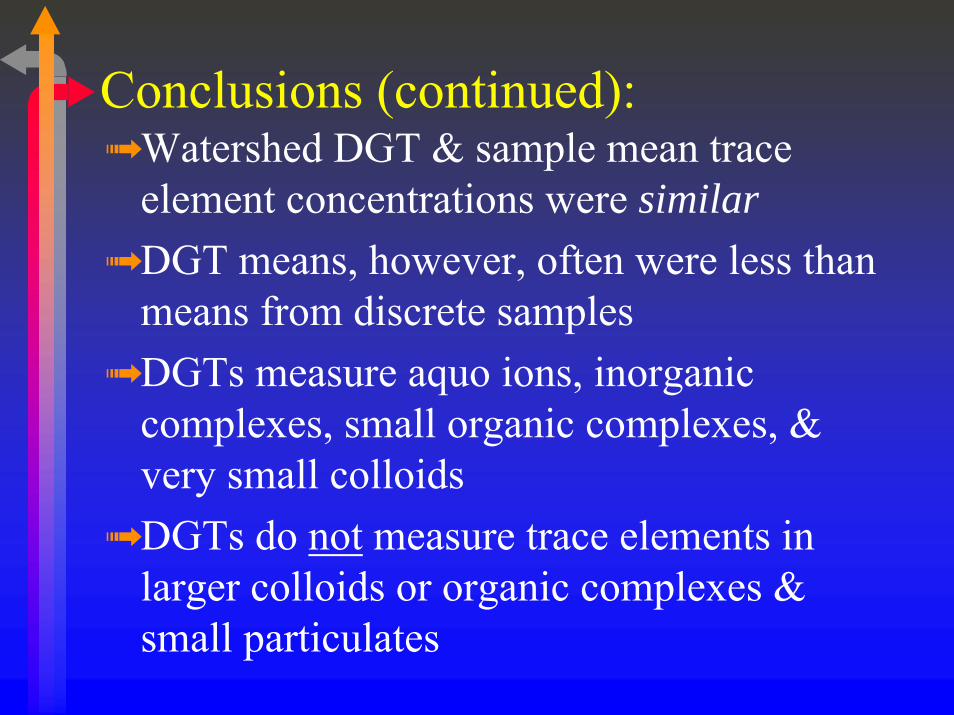
Conclusions (continued):➟ Watershed DGT & sample mean trace
element concentrations were similar➟ DGT means, however, often were less than
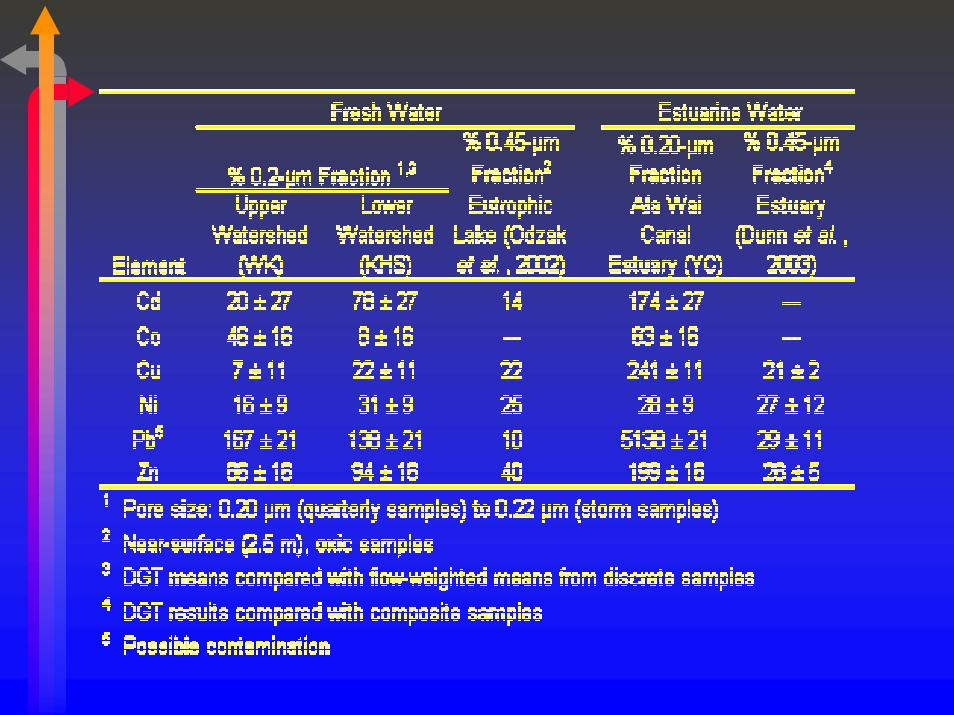
means from discrete samples➟ DGTs measure aquo ions, inorganic
complexes, small organic complexes, & very small colloids
➟ DGTs do not measure trace elements in larger colloids or organic complexes & small particulates
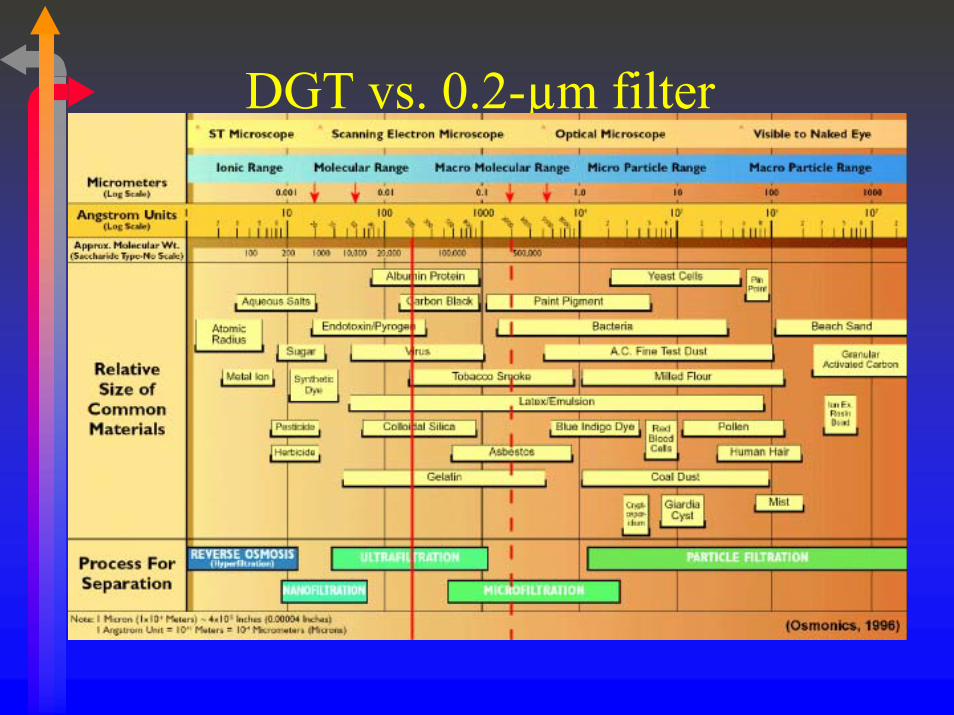
DGT vs. 0.2-µm filter
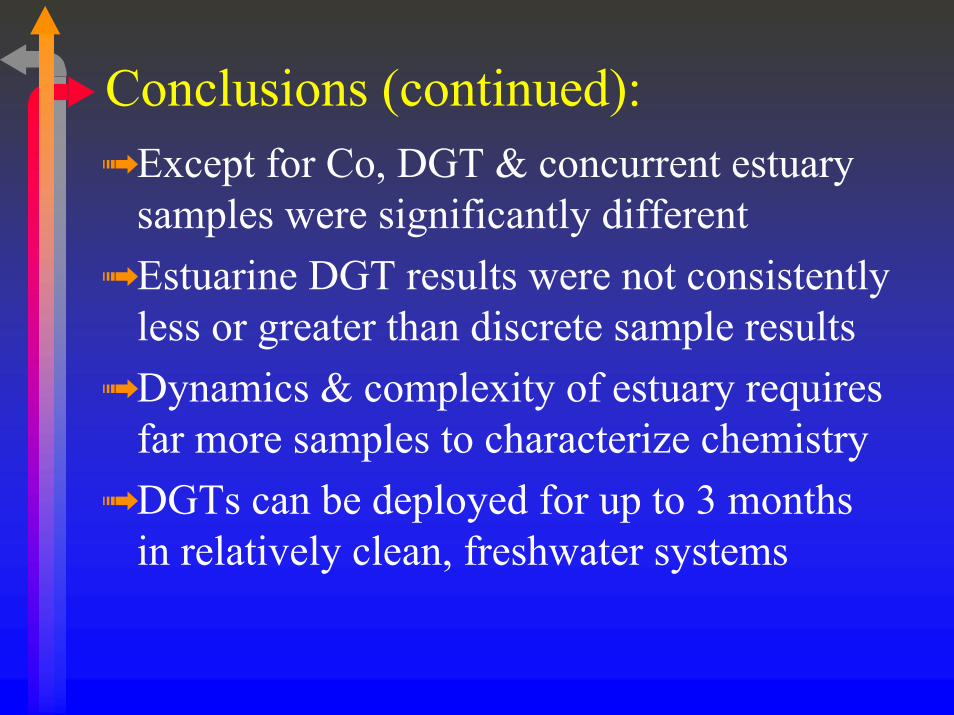
Conclusions (continued):➟ Except for Co, DGT & concurrent estuary
samples were significantly different➟ Estuarine DGT results were not consistently
less or greater than discrete sample results➟ Dynamics & complexity of estuary requires
far more samples to characterize chemistry➟ DGTs can be deployed for up to 3 months
in relatively clean, freshwater systems
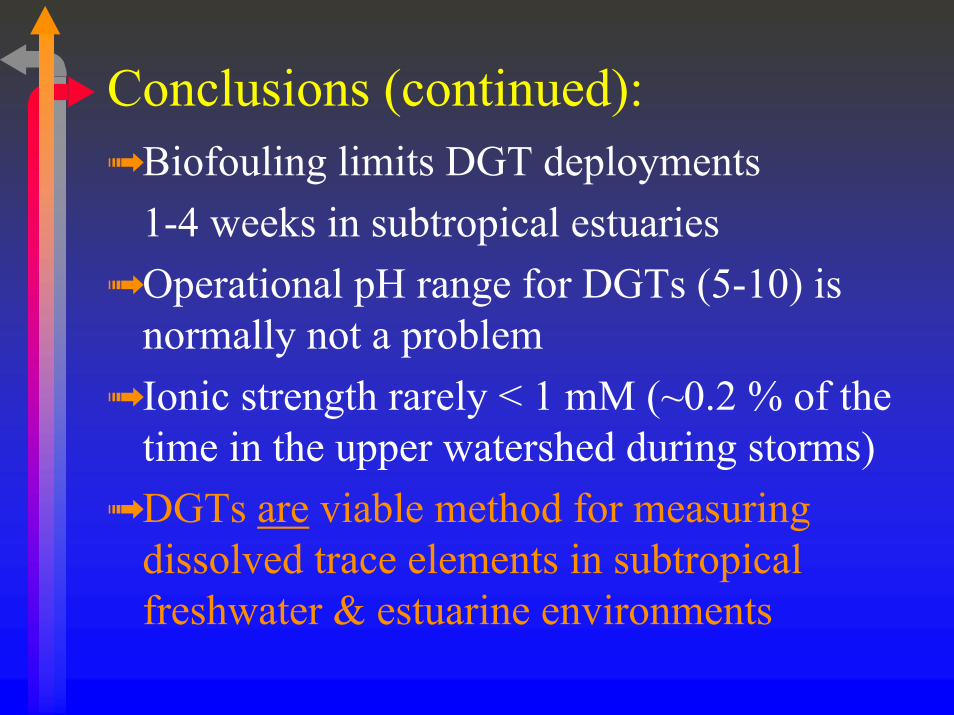
Conclusions (continued):➟ Biofouling limits DGT deployments
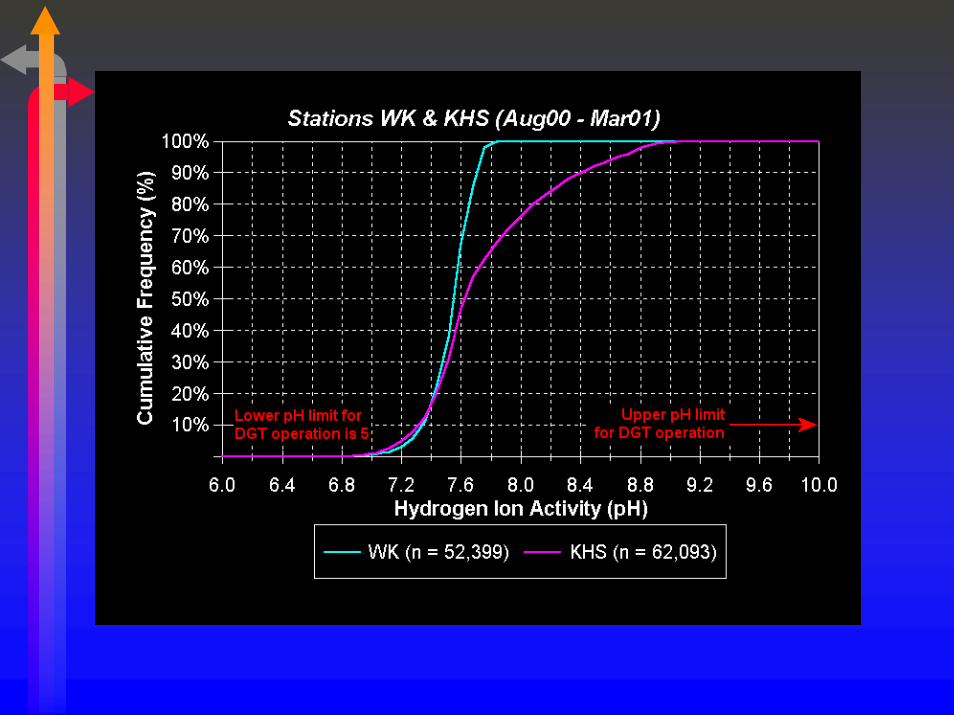
1-4 weeks in subtropical estuaries➟ Operational pH range for DGTs (5-10) is
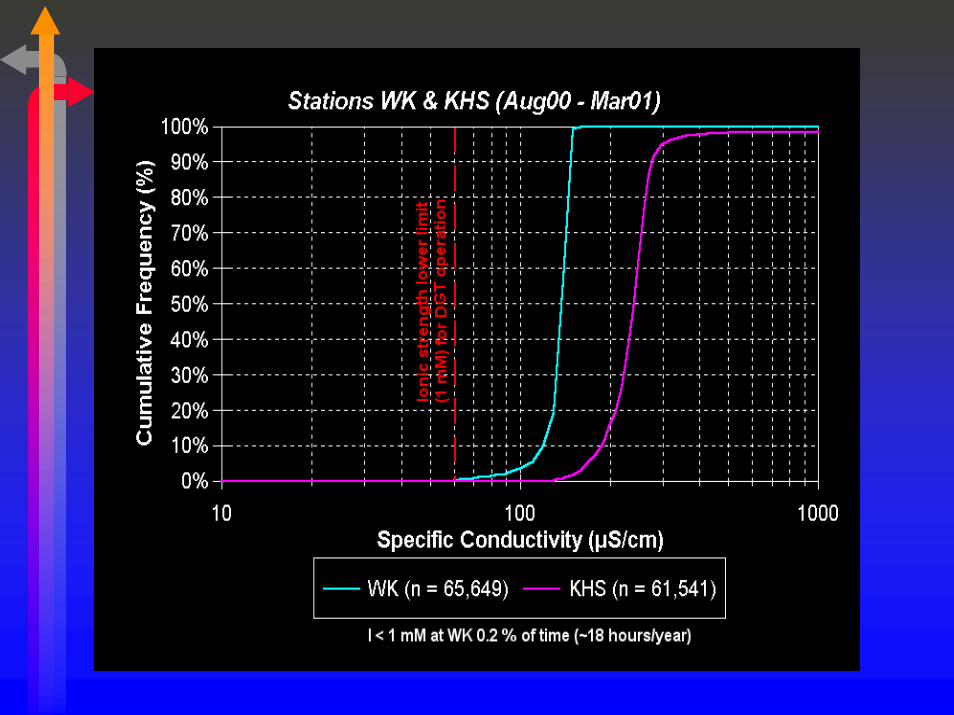
normally not a problem➟ Ionic strength rarely < 1 mM (~0.2 % of the
time in the upper watershed during storms)➟ DGTs are viable method for measuring
dissolved trace elements in subtropical freshwater & estuarine environments
Eric, a man who loves his work . . .
. . . maybe a little too much?
Let it never be said that Eric . . .
. . . hides from his students!
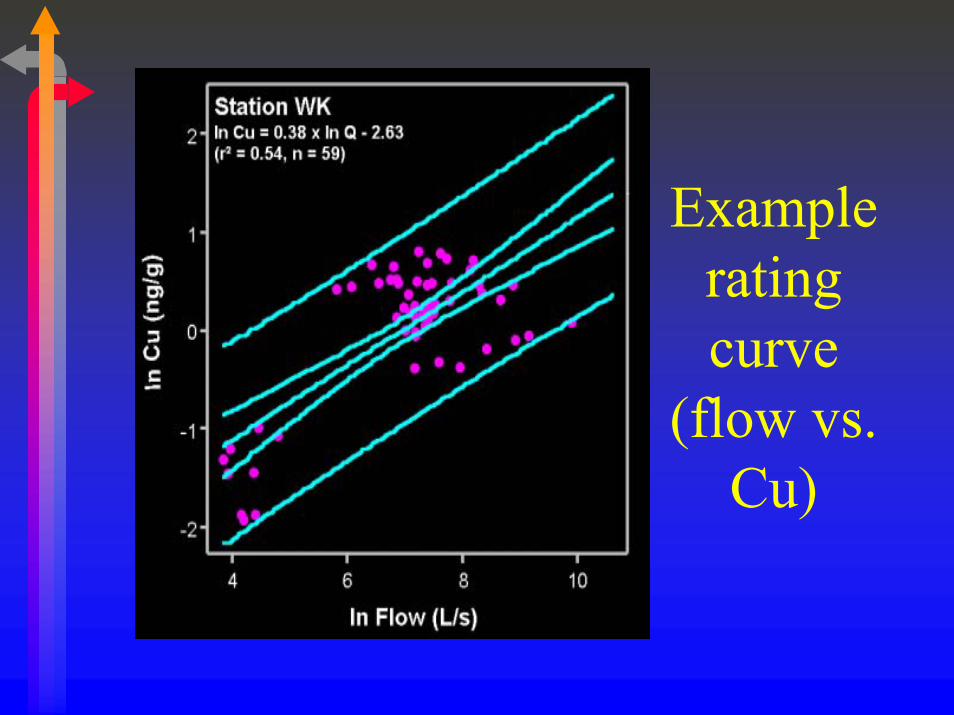
Examplerating curve
(flow vs. Cu)
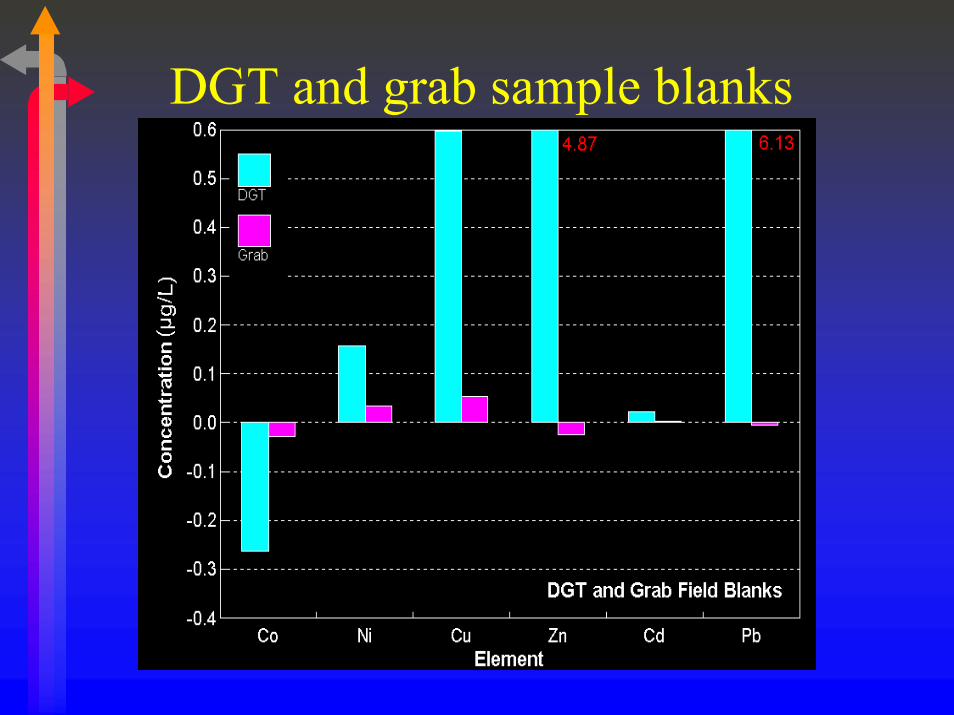
DGT and grab sample blanks
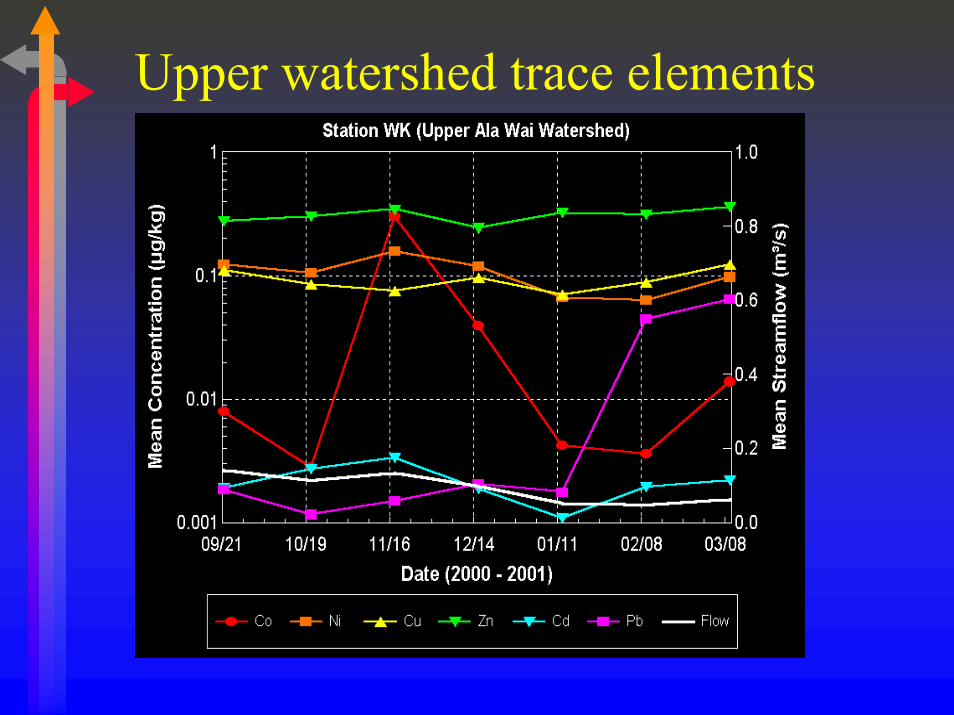
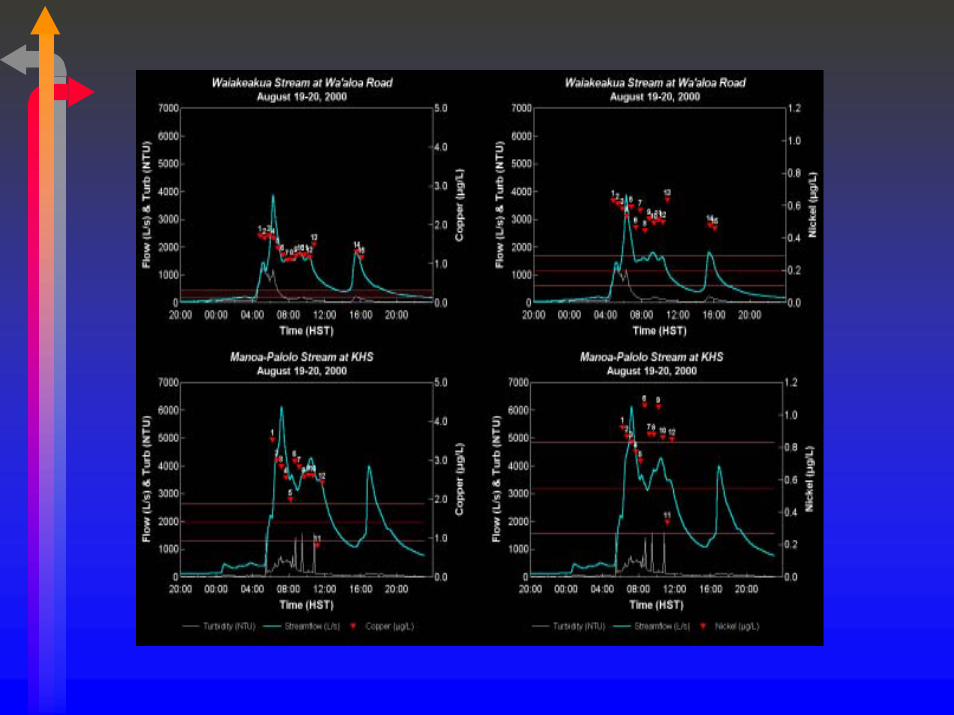
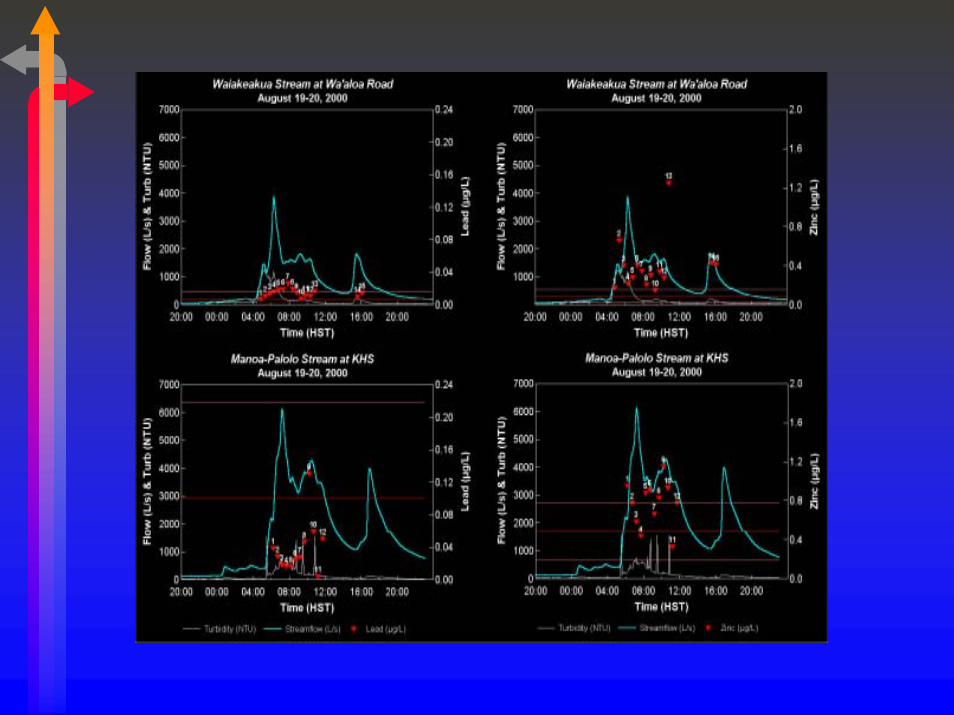
Upper watershed trace elements
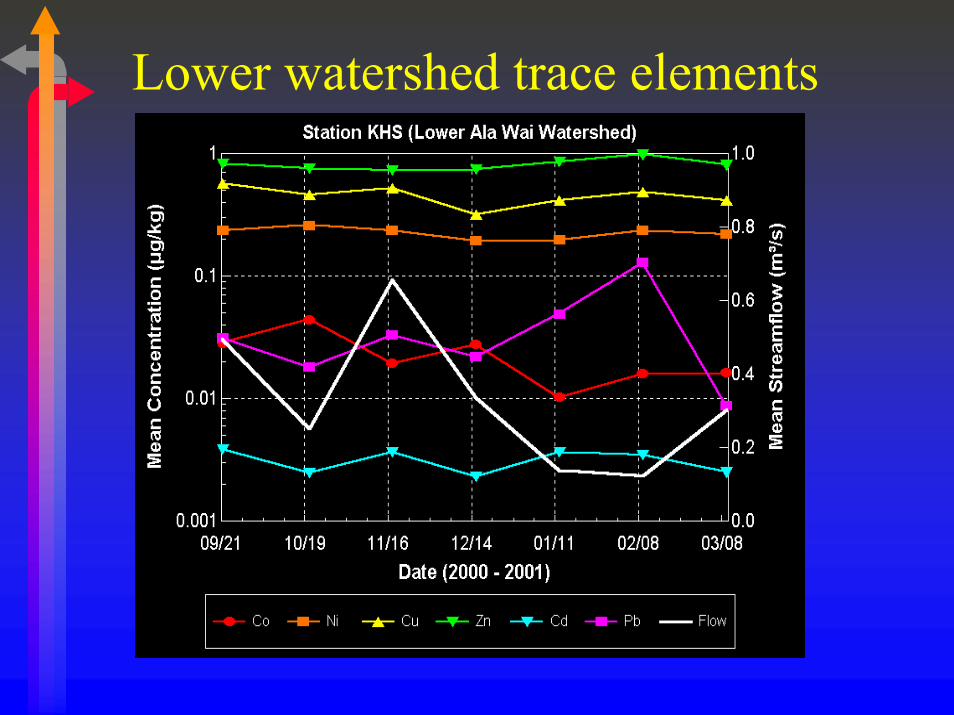
Lower watershed trace elements
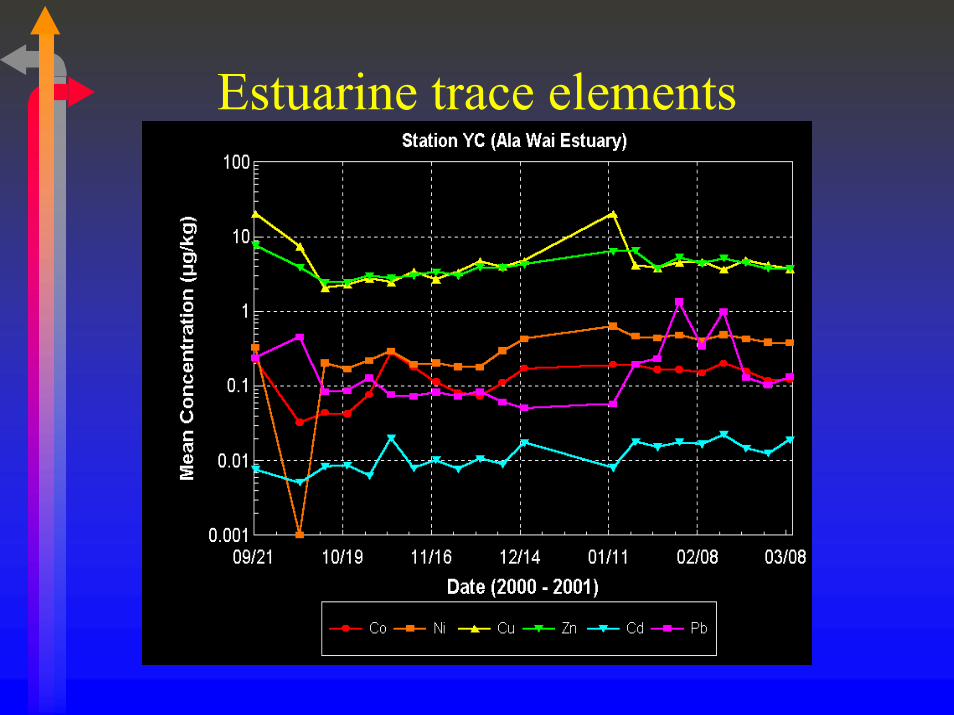
Estuarine trace elements

YC DGT & sample comparison
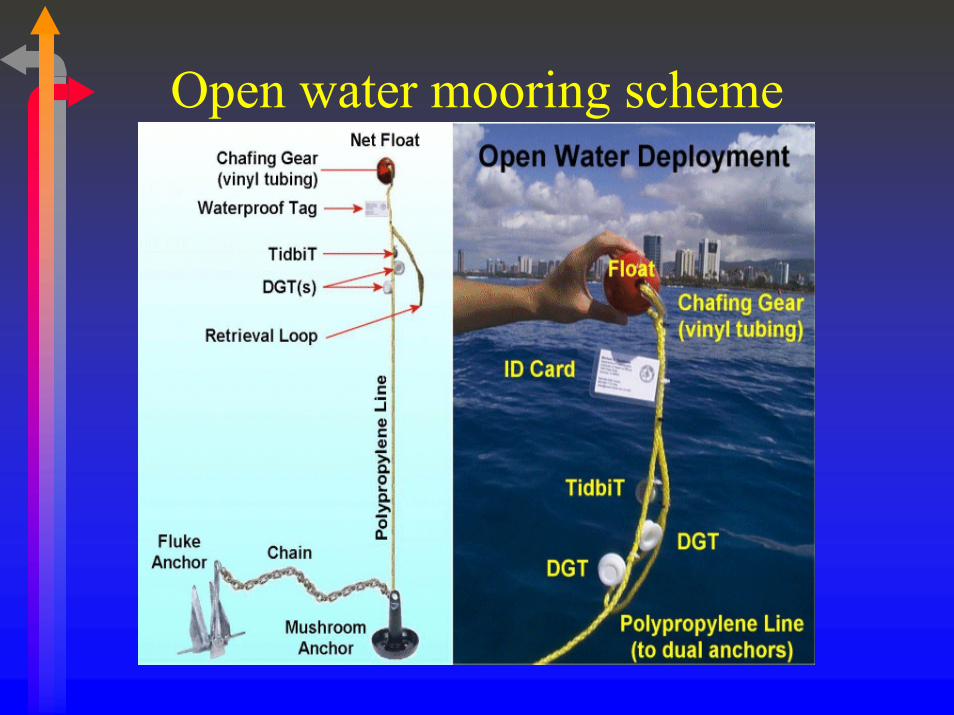
Open water mooring scheme
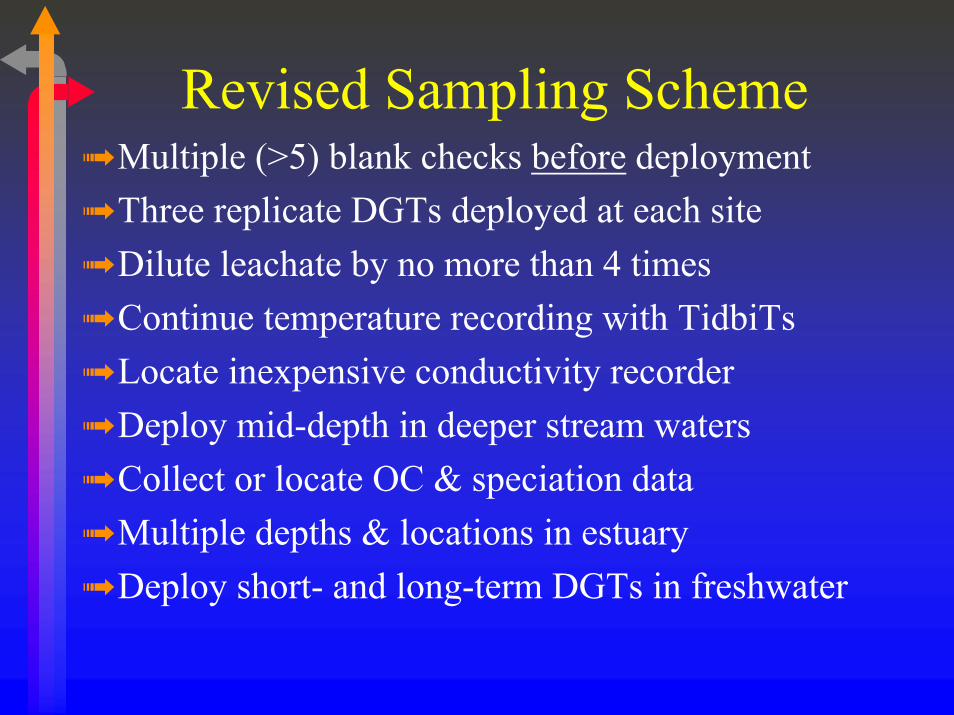
Revised Sampling Scheme➟ Multiple (>5) blank checks before deployment➟ Three replicate DGTs deployed at each site➟ Dilute leachate by no more than 4 times➟ Continue temperature recording with TidbiTs➟ Locate inexpensive conductivity recorder➟ Deploy mid-depth in deeper stream waters➟ Collect or locate OC & speciation data➟ Multiple depths & locations in estuary➟ Deploy short- and long-term DGTs in freshwater