Embed Size (px)
Citation preview
Maillard-Induced Glycation of Whey Protein Hydrolysate and its Effects on Physiochemical Characteristics and Shelf-life Stability
A THESIS SUBMITTED TO THE FACULTY OF
UNIVERSITY OF MINNESOTA BY
Kirsten Ruud
IN PARTIAL FULFILLMENT OF THE REQUIREMENTS FOR THE DEGREE OF MASTER OF SCIENCE
Dr. Baraem Ismail and Dr. Theodore P. Labuza
February 2015

© Kirsten Ruud 2015

Acknowledgements
First I would like to thank my advisors, Dr. Baraem (Pam) Ismail and Dr. Ted
Labuza, for all their guidance, support, and insight over the past 2 years, and without whom
this work could not have happened. Pam, thank you for letting me join your lab as an
inexperienced undergrad 4 years ago! Your mentorship then and through grad school has
helped me to grow to the scientist I am today. Ted, thank you for sharing so much of your
insight and knowledge, and for helping me hone my analytical skills; I am a stronger
scientist because of it. I would also like to thank my committee members, Tonya
Schoenfuss and Michael Bowser, for their willingness to serve on my thesis committee,
and for all the valuable insight I have gained from taking their courses.
I would also like to acknowledge the many people whose help has been invaluable
over the course of this project. Thank you Qinchun Rao for all your extensive training in
the lab, and for always being open to answer any of my many questions. Thank you to
Courtney Lasky, for collaborating with me throughout the course of this project; I couldn’t
have asked for better person to work with. Thank you to Claire Boyle for so many things:
for all your help at multiple steps since almost the beginning of this project, for your hard
work on furosine and digestibility analysis, and for being such a positive spirit in the lab.
Of course, I wouldn’t be where I am now without the support of my friends. Thank
you to Lauren Gillman, Aimee Mortenson, and Jordan Walter for being awesome lab
mates, classmates, and friends. Thank you to Qian Wang for your mentorship on my first
undergraduate lab project that led me to where I am today. Thank you to all my friends in
the Lab 122 family, and others throughout the FSCN department who have been so kind
and helpful over the few couple years.
Finally, thank you to my family- Mom, Dad, and Dana- for all your unending
support, and tolerance of me talking about this project and grad school for the last 2 years.
And thank you to David Chau, for being there for me at every step of the way.
i

Dedication
This thesis is dedicated to those that inspire me to work my hardest.
To my cousins, Jessica, Jacob, and Kayla – your youthful spirit and excitement to
learn is wonderful. Thank you for asking me about my work, about school, and about
science. This thesis is dedicated to you, because each of you can achieve anything you
set your sights on. Follow your passions and each of your will go far.
To my sister, Dana – for being supportive, thoughtful, and a worthy adversary.
Your determination shows me time and time again that any goal can be met with hard-
work. Thank you for being my best competitor, and keeping me on my toes. You too
can achieve anything you set your sights on, and you’ve already shown that you can go
far.
ii
Abstract
Whey protein hydrolysates (WPH) are value-added ingredients that are
experiencing a rapid increase in usage and market volume in part due to their enhanced
health and functional properties. However, a challenge with the commercial use of
hydrolysates in food products is their increased reactivity in many deteriorative reactions
including moisture-induced protein/peptide aggregation, leading to decreased shelf-life
and sensory quality. Moisture-induced protein/peptide aggregation refers to the clustering
of protein molecules and the formation of aggregates, which can lead to decreased
functionality, nutritional quality, and processability of protein powders. However,
Maillard-induced glycation, or the covalent attachment of carbohydrates to proteins using
the Maillard reaction, has been widely used to impart novel functionality to proteins via
several mechanisms. It is hypothesized that Maillard-induced glycation of protein
hydrolysates may reduce moisture-induced protein/peptide aggregation of these powders
during storage.
The objectives of this study were twofold: (1) to produce and characterize a
partially-glycated whey protein hydrolysate product using controlled and limited Maillard-
induced glycation, assimilating industrial procedures where possible; and (2) to assess the
ability of partially-glycated whey protein hydrolysate to retard moisture-induced
aggregation during an accelerated storage study using challenging environmental
conditions.
Maillard glycation of WPH was induced over 12-120 h of incubation at 60°C, 49%
relative humidity (RH), and a 4:1 ratio of dextran to protein. Extent of glycation was
monitored via estimation of Amadori compound formation, browning, fluorescent
compound formation, free amino group loss, and visualization of protein/peptide molecular
weight distribution following sodium dodecyl sulfate polyacrylamide gel electrophoresis
(SDS-PAGE). WPH incubated with dextran for 48 h was selected for further study. Free
dextran was removed from glycated and non-glycated protein and peptides with moderate
success using a 2-step membrane filtration and hydrophobic interaction chromatography
(HIC), yielding a final product termed ‘partially glycated whey protein hydrolysate’ iii
(PGWPH). Basic composition of PGWPH along with a moisture sorption isotherm,
digestibility and lysine blockage were determined. A controlled accelerated shelf-life
study of PGWPH and WPH was then carried out at 45°C and 31%/65% relative humidity
(RH) for up to 28 days to evaluate the effects of glycation on stability. Specifically, the
effects of partial glycation of WPH on production of new initial-stage Maillard reaction
products (MRPs), progression of MRPs generated upon production of PGWPH to
intermediate and advanced stages, and moisture-induced protein/peptide aggregation were
monitored. Over time, changes in color, formation of fluorescent compounds, loss of free
amino groups, protein/peptide molecular weight distribution via SDS-PAGE, surface
hydrophobicity, and solubility were determined. Reaction kinetics were used where
possible to better understand the effects of storage conditions and sample types.
Glycation of WPH incubated with dextran was initiated within 12 h of incubation,
and increased with time. Production of intermediate stage fluorescent MRPs was detected,
but production of advanced stage melanoidins was minimal. PGWPH produced upon
incubation for 48 h was selected for investigation in further studies, due to its moderate
level of Amadori compound formation, minimal progression to intermediate and final
stages of the Maillard reaction, and moderate amino group loss. The final composition of
purified PGWPH was approximately 1:1 protein to carbohydrate, and displayed minimal
blockage of the essential amino acid lysine (4.4%), and no significant decrease in
digestibility compared to WPH. Greatest change in color, and formation of fluorescent
compounds was observed for the samples stored at 65% RH, with PGWPH experiencing
the most change, likely due to progression of the MRPs, generated upon production of
PGWPH, to advanced stages of the reaction. Formation of insoluble aggregates and
changes in surface hydrophobicity index were not detected for either PGWPH or WPH
under the storage conditions studied. However, when heated at 80°C for 30 min at pH 4.5
PGWPH remained soluble while WPH lost over 60% of its solubility.
iv
Overall, results show that partial Maillard glycation can be induced and controlled
to low-levels in whey protein hydrolysate, while maintaining nutritional quality, namely
digestibility and lysine availability. Results confirmed that partially-glycated whey protein
hydrolysate experiences minimal deteriorative reactions during controlled storage,
specifically below 65% RH and 45°C. This work is a promising step toward the
advancement of protein glycation as a novel protein-enhancement technique.
v
Table of Contents
Acknowledgements ............................................................................................................ i
Dedication .......................................................................................................................... ii
Abstract ............................................................................................................................. iii
List of Tables ..................................................................................................................... x
List of Figures ................................................................................................................. xiv
1. Literature Review ........................................................................................................ 1 1.1 Introduction and Objectives .................................................................................. 1 1.2 Origins and Composition of Whey Proteins ......................................................... 3
1.2.1 Whey Protein Origins ........................................................................................ 3 1.2.2 Whey Protein Composition ................................................................................ 4
1.3 Nutritional Quality and Health Benefits of Whey Protein .................................. 6 1.4 Whey Protein Ingredients Production and Application ...................................... 8
1.4.1 Production of Whey Ingredients ........................................................................ 8 1.4.2 Functionality and Application of Whey Protein Ingredients in Foods ............ 10
1.5 Economic Significance of Whey Protein Ingredients ........................................ 13 1.6 Usage of Whey Protein Hydrolysate Ingredients ............................................... 13
1.6.1 Production of Whey Protein Hydrolysate Ingredients ..................................... 14 1.6.2 Health Benefits of Whey Protein Hydrolysate Ingredients .............................. 17 1.6.3 Functional Benefits and Usage of Whey Protein Hydrolysate Ingredients ..... 18 1.6.4 Challenges with the Usage of Whey Protein Hydrolysate Ingredients ............ 20
1.7 Moisture-Induced Protein/Peptide Aggregation ................................................ 21 1.7.1 Mechanisms of Protein/Peptide Aggregation .................................................. 22 1.7.2 Protein/Peptide Aggregation during Storage ................................................... 23 1.7.3 Proposed Solutions to the Problem of Protein/Peptide Aggregation ............... 24
1.8 Maillard-Induced Protein Glycation ................................................................... 26 1.8.1 Significance and Mechanisms of the Maillard Reaction in Foods .................. 26 1.8.2 Control of the Maillard Reaction in Foods ...................................................... 27 1.8.3 Production of Ingredients with Novel Functionality and Application Using the Maillard Reaction...................................................................................................... 29 1.8.4 Consequences of the Maillard Reaction .......................................................... 31
1.9 Conclusions ............................................................................................................ 32
2. Production and Characterization of a Partially-Glycated Whey Protein Hydrolysate ...................................................................................................................... 33
2.1 Overview ................................................................................................................ 33
vi

2.2 Introduction ........................................................................................................... 34 2.3 Materials and Methods ......................................................................................... 36
2.3.1 Materials .......................................................................................................... 36 2.3.2 Controlled Maillard Glycation of Whey Protein Hydrolysate ......................... 36 2.3.3 Estimation of Maillard Glycation Extent of WPH Incubated with Dextran .... 37
2.3.3.1 Estimation of Amadori Compound Formation and Browning ................. 37 2.3.3.2 Determination of Fluorescent Compounds ............................................... 38 2.3.3.3 Loss of Free Amino Groups ...................................................................... 39 2.3.3.4 Sodium Dodecyl Sulfate-Polyacrylamide Gel Electrophoresis (SDS-PAGE) ......................................................................................................... 39
2.3.3.4.1 Coomassie Blue Staining of Polyacrylamide Gels ............................ 40
2.3.3.4.2 Glycoprotein Staining of Polyacrylamide Gels ................................. 40
2.3.4 Separation of Free Dextran from Partially Glycated Whey Protein Hydrolysate ............................................................................................................... 40
2.3.4.1 Preliminary Chromatographic Trials ........................................................ 41 2.3.4.2 Improvement of Free Dextran Separation Protocol with the Use of Centrifugal Filtration Devices ............................................................................... 42 2.3.4.3 Improvement of Free Dextran Separation Protocol with Chromatographic Scale-up................................................................................................................. 43
2.3.5 Characterization of Partially Glycated Whey Protein Hydrolysate ................. 43 2.3.5.1 Analysis of Protein Content ...................................................................... 44 2.3.5.2 Analysis of Carbohydrate Content ............................................................ 44 2.3.5.3 Analysis of Moisture Content ................................................................... 44 2.3.5.4 Determination of Percent Lysine Blockage .............................................. 45 2.3.5.5 Determination of In-vitro Digestibility ..................................................... 46
2.3.6 Statistical Analysis ........................................................................................... 47 2.4 Results and Discussion .......................................................................................... 48
2.4.1 Estimation of Maillard Glycation Extent of WPH Incubated with Dextran .... 48 2.4.2 Separation of Free Dextran from Partially Glycated Whey Protein Hydrolysate ............................................................................................................... 54 2.4.3 Characterization of Partially Glycated Whey Protein Hydrolysate ................. 61
2.5 Conclusions ............................................................................................................ 63
3. Physiochemical Changes of a Partially-Glycated Whey Protein Hydrolysate during Accelerated Shelf-life Testing ............................................................................ 64
3.1 Overview ................................................................................................................ 64 3.2 Introduction ........................................................................................................... 65 3.3 Materials and Methods ......................................................................................... 67
vii
3.3.1 Materials .......................................................................................................... 67 3.3.2 Preparation of Partially Glycated Whey Protein Hydrolysate ......................... 67 3.3.3 Moisture Sorption Isotherm Generation .......................................................... 67 3.3.4 Storage Study Experimental Design ................................................................ 68
3.3.4.1 Color Analysis by Chroma Meter ............................................................. 69 3.3.4.2 Determination of Fluorescent Compounds ............................................... 70 3.3.4.3 Loss of Free Amino Groups ...................................................................... 70 3.3.4.4 Evaluation of Peptide Profile .................................................................... 71 3.3.4.5 Determination of Surface Hydrophobicity................................................ 71 3.3.4.6 Quantitative Determination of Solubility.................................................. 72
3.3.5 Statistical Analysis ........................................................................................... 72 3.4 Results and Discussion .......................................................................................... 74
3.4.1 Moisture Sorption Properties of Partially-Glycated Whey Protein Hydrolysate ............................................................................................................... 74 3.4.2 Progression of the Maillard Reaction during Accelerated Shelf-life Testing of PGWPH ................................................................................................... 75
3.4.2.1 Changes in Total Color and L*, a*, and b* Values during Storage .......... 76 3.4.2.2 Changes in Fluorescence Intensity during Storage ................................... 82 3.4.2.3 Change in Free Amino Groups during Storage......................................... 85
3.4.3 Measurement of Protein/Peptide Aggregation during Accelerated Shelf-life Testing of PGWPH ................................................................................................... 87
3.4.3.1 Changes in Peptide Profile during Storage ............................................... 87 3.4.3.2 Changes in Surface Hydrophobicity during Storage ................................ 89 3.4.3.3 Changes in Solubility and Thermal Stability during Storage ................... 90
3.5 Conclusions ............................................................................................................ 93
4. Overall Conclusions, Implications, and Recommendations .................................... 94
Comprehensive Bibliography ........................................................................................ 96
Appendix A. Browning of WPH Incubated with and without Dextran .................. 116
Appendix B. Formation of Glycoproteins in WPH Incubated with and without Dextran........................................................................................................................... 117
Appendix C. Digestibility of PGWPH and WPH ...................................................... 118
Appendix D – Change in a* and b* values of PGWPH and WPH Stored at 45°C and 31%/65% RH ................................................................................................................ 120
Appendix E – Change in Peptide Profile of PGWPH and WPH Stored at 45°C and 31% RH.......................................................................................................................... 123
viii
Appendix F. Analysis of Variance (ANOVA) Tables for Determining Significant Effects of Treatments .................................................................................................... 124
ix
List of Tables
Table 1. Major whey protein components: Adapted from Advanced Dairy Chemistry Vol.
1 (Fox 2003) ........................................................................................................................ 4
Table 2. Yields of WPH incubated with dextran after first filtration, second filtration, and
after completion of HIC separation and desalting. (Initial Mass: 126.3 g) ...................... 61
Table 3. Moisture, Protein, and Carbohydrate Composition of PGWPH and WPH. ...... 62
Table 4. Furosine content and Percent Lysine Blockage of WPH and PGWPH. ............ 62
Table 5. Kinetic analysis of zero-order model for the change in L* value as a function of
sample type and storage RH at 45°C. ............................................................................... 79
Table 6. Kinetic analysis of zero-order model for the change in ΔE value as a function of
sample type and storage RH at 45°C. ............................................................................... 82
Table 7. Kinetic analysis of zero-order model for the change in fluorescence intensity
(%FI) value as a function of sample type and storage RH at 45°C. ................................. 85
Table 8. Kinetic analysis of zero-order model for the change in *b value as a function of
sample type and storage RH at 45°C. ............................................................................. 122
Table 9. Analysis of variance on the effect of incubation time on 304 nm absorbance of
WPH incubated with or without dextran. ....................................................................... 124
Table 10. Analysis of variance on the effect of incubation time on 420 nm absorbance of
WPH incubated with or without dextran. ....................................................................... 124
Table 11. Analysis of variance on the effect of incubation time on % fluorescent intensity
of WPH incubated with or without dextran. ................................................................... 124
Table 12. Analysis of variance on the effect of incubation time on % free amino group loss
of WPH incubated with dextran. ..................................................................................... 125
Table 13. Analysis of variance on the effect of sample type on furosine content of WPH
and PGWPH .................................................................................................................... 125
Table 14. Analysis of variance on the effect of sample type on % digestibility of WPH and
PGWPH........................................................................................................................... 125
Table 15. Analysis of variance on the effect of sample type and %RH on L* value after 28
days of storage at 45°C. .................................................................................................. 125 x
Table 16. Analysis of variance on the effect of storage time on L* value of PGWPH stored
at 31% RH and 45°C. ...................................................................................................... 126
Table 17. Analysis of variance on the effect of storage time on L* value of WPH stored at
31% RH and 45°C. .......................................................................................................... 126
Table 18. Analysis of variance on the effect of storage time on L* value of PGWPH stored
at 65% RH and 45°C. ...................................................................................................... 126
Table 19. Analysis of variance on the effect of storage time on L* value of WPH stored at
65% RH and 45°C. .......................................................................................................... 126
Table 20. Analysis of variance on the effect of storage time on % remaining free amino
groups of PGWPH stored at 31% RH and 45°C. ............................................................ 127
Table 21. Analysis of variance on the effect of storage time on % remaining free amino
groups of WPH stored at 31% RH and 45°C. ................................................................. 127
Table 22. Analysis of variance on the effect of storage time on % remaining free amino
groups of PGWPH stored at 65% RH and 45°C. ............................................................ 127
Table 23. Analysis of variance on the effect of storage time on % remaining free amino
groups of WPH stored at 31% RH and 45°C. ................................................................. 127
Table 24. Analysis of variance on the effect of storage time on the surface hydrophobicity
index (S0) of PGWPH stored at 31% RH and 45°C. ....................................................... 128
Table 25. Analysis of variance on the effect of storage time on the surface hydrophobicity
index (S0) of WPH stored at 31% RH and 45°C. ............................................................ 128
Table 26. Analysis of variance on the effect of storage time on the surface hydrophobicity
index (S0) of PGWPH stored at 65% RH and 45°C. ....................................................... 128
Table 27. Analysis of variance on the effect of storage time on the surface hydrophobicity
index (S0) of WPH stored at 31% RH and 45°C. ............................................................ 128
Table 28. Analysis of variance on the effect of storage % RH on the surface hydrophobicity
index (S0) of PGWPH stored at 45°C for 7 days. ........................................................... 129
Table 29. Analysis of variance on the effect of storage % RH on the surface hydrophobicity
index (S0) of WPH stored at 45°C for 7 days. ................................................................ 129
xi
Table 30. Analysis of variance on the effect of storage % RH on the surface hydrophobicity
index (S0) of PGWPH stored at 45°C for 14 days. ......................................................... 129
Table 31. Analysis of variance on the effect of storage % RH on the surface hydrophobicity
index (S0) of WPH stored at 45°C for 14 days. .............................................................. 129
Table 32. Analysis of variance on the effect of storage % RH on the surface hydrophobicity
index (S0) of PGWPH stored at 45°C for 28 days. ......................................................... 130
Table 33. Analysis of variance on the effect of storage % RH on the surface hydrophobicity
index (S0) of WPH stored at 45°C for 28 days. .............................................................. 130
Table 34. Analysis of variance on the effect of storage % RH on the water solubility of
PGWPH stored at 45°C for 28 days. ............................................................................... 130
Table 35. Analysis of variance on the effect of storage % RH on the water solubility of
WPH stored at 45°C for 28 days. .................................................................................... 130
Table 36. Analysis of variance on the effect of storage time on water solubility of PGWPH
stored at 31% RH and 45°C. ........................................................................................... 131
Table 37. Analysis of variance on the effect of storage time on water solubility of WPH
stored at 31% RH and 45°C. ........................................................................................... 131
Table 38. Analysis of variance on the effect of storage time on the water solubility of
PGWPH stored at 65% RH and 45°C. ............................................................................ 131
Table 39. Analysis of variance on the effect of storage time on the water solubility of WPH
stored at 31% RH and 45°C. ........................................................................................... 131
Table 40. Analysis of variance on the effect of storage % RH on the pH 3.4 solubility of
PGWPH stored at 45°C for 28 days. ............................................................................... 132
Table 41. Analysis of variance on the effect of storage % RH on the pH 3.4 solubility of
WPH stored at 45°C for 28 days. .................................................................................... 132
Table 42. Analysis of variance on the effect of storage time on the pH 3.4 solubility of
PGWPH stored at 31% RH and 45°C. ............................................................................ 132
Table 43. Analysis of variance on the effect of storage time on the pH 3.4 solubility of
WPH stored at 31% RH and 45°C. ................................................................................. 132
xii
Table 44. Analysis of variance on the effect of storage time on the pH 3.4 solubility of
PGWPH stored at 65% RH and 45°C. ............................................................................ 133
Table 45. Analysis of variance on the effect of storage time on the pH 3.4 solubility of
WPH stored at 31% RH and 45°C. ................................................................................. 133
xiii
List of Figures
Figure 1. Amadori compound formation as determined by UV-Visible difference
spectroscopy at 304 nm for whey protein hydrolysate (WPH) incubated with dextran and
control WPH incubated without dextran at 60°C for 0-120 h at 49% RH ........................ 49
Figure 2. Fluorescent compound formation as determined by fluorescence intensity
quantification for whey protein hydrolysate (WPH) incubated with dextran and control
WPH incubated without dextran at 60°C for 0-120 h at 49% RH. ................................... 51
Figure 3. Percent loss of free amino groups as determined by the OPA method for whey
protein hydrolysate (WPH) incubated with dextran at 60°C for 0-120 h at 49% RH.. .... 52
Figure 4. Change in peptide/protein molecular distribution as visualized by Coomassie blue
stained SDS-PAGE for WPH incubated with dextran at 60°C for 0-120 h at 49% RH. .. 53
Figure 5. Elution of protein and carbohydrate of a 4:1 mixture of dextran and WPH. .... 55
Figure 6. Elution of protein and carbohydrate of a 4:1 mixture of dextran and WPH before
and after centrifugal filtration processing. ......................... Error! Bookmark not defined.
Figure 7. Elution of protein and carbohydrate of incubated WPH and dextran before and
after centrifugal filtration processing ................................................................................ 58
Figure 8. Elution of protein of the permeate of centrifugal filtration processed WPH
incubated with dextran ...................................................................................................... 59
Figure 9. Protein and carbohydrate contents of centrifugal filtration processed WPH
incubated with dextran permeate after 10-60 minutes of a secondary filtration. .............. 60
Figure 10. BET/GAB Moisture sorption isotherm of PGWPH at 25°C. .......................... 75
Figure 11. Changes in L* values of PGWPH and WPH during storage at 45°C and 31%
and 65% RH.. .................................................................................................................... 78
Figure 12. Total color change (ΔE) values of PGWPH and WPH during storage at 45°C
and 31% and 65% RH.. ..................................................................................................... 81
Figure 13. Changes in % fluorescence intensity of PGWPH and WPH during storage at
45°C and 31% and 65% RH.. ........................................................................................... 84
Figure 14. Changes in % remaining free amino group content of PGWPH and WPH during
storage at 45°C and 31% and 65% RH. ............................................................................ 86 xiv
Figure 15. Change in protein/peptide molecular size as determined by Coomassie blue
stained SDS-PAGE for PGWPH and WPH stored at 45°C and 65% RH for 7, 14, and 28
days along with non-incubated controls. .......................................................................... 88
Figure 16. Changes in surface hydrophobicity (S0) of PGWPH and WPH during storage
at 31% and 65% RH and 45°C.. ......................................... Error! Bookmark not defined.
Figure 17. Solubility after 0 and 28 days of storage at 45°C and at 31% and 65% RH of:
PGWPH and WPH in water and at pH 4.5 and 3.4 after heat treatment.Error! Bookmark
not defined.
Figure 18. Browning as determined by UV-Visible difference spectroscopy at 420 nm for
whey protein hydrolysate (WPH) incubated with dextran and control WPH incubated
without dextran at 60°C for 0-120 h at 49% RH ............................................................ 116
Figure 19. Formation of glycoproteins as visualized by Glycoprotein stained SDS-PAGE
for WPH incubated with dextran at 60°C for 0-120 h at 49% RH.. ............................... 117
Figure 20. Chromatograms of WPH before and after in-vitro digestion with pepsin and
trypsin. . .......................................................................................................................... 118
Figure 21. Chromatograms of PGWPH before and after in-vitro digestion with pepsin and
trypsin.. ........................................................................................................................... 119
Figure 22. Changes in a* values of PGWPH and WPH during storage at 45°C and 31%
and 65% RH.. .................................................................................................................. 120
Figure 23. Changes in b* values of PGWPH and WPH during storage at 45°C and 31%
and 65% RH. ................................................................................................................... 121
Figure 24. Change in protein/peptide molecular size as determined by Coomassie blue
stained SDS-PAGE for PGWPH and WPH stored at 45°C and 31% RH for 7, 14, and 28
days along with non-incubated controls. MW. ............................................................... 123
xv
1. Literature Review
1.1 Introduction and Objectives
Whey protein is an industrial byproduct of cheese production with a market value
of $9.8 billion U.S.D. in 2013 (Affertsholt 2009). Whey protein has excellent nutritional
and physiological properties and displays a wide range of functionalities including
solubility, gelation, foaming and emulsification (Kelly et al. 2003). The many health and
functional benefits of whey protein have led to its incorporation in a variety of food
products including high-protein beverages, dairy products, baked goods, confectionaries,
and clinical and sports nutrition products.
Whey protein is commercially available in several forms including whey protein
concentrate (WPC), whey protein isolate (WPI), and whey protein hydrolysates (WPH).
Whey protein hydrolysate can be produced with many enzyme and hydrolysis conditions
to yield products with enhanced functional and physiological qualities. However, a
challenge with the use of protein hydrolysates is their increased molecular mobility and
consequential increased chemical reactivity in degradative reactions such as Maillard
browning and protein/peptide aggregation, hindering their shelf-life stability.
Moisture-induced aggregation is a challenge to the stability of high-protein
powders including whey protein concentrates, isolates, and hydrolysates in particular.
Moisture-induced aggregation is caused by both covalent and non-covalent interactions,
and is exacerbated by protein denaturation, non-ideal storage conditions, and common
interactions with other components in food systems such as lipids and reducing
carbohydrates. Current solutions to the problem, such as product reformulation, use of
additives, and reliance on packaging and careful storage conditions have been
unsatisfactory. The potential for use of protein hydrolysates to mitigate issues of moisture-
induced aggregation is promising, however, several challenges need to be addressed
including increased sensitivity to environmental conditions, increased reactivity in
deteriorative reactions, and decreased stability in protein systems.
1
Protein glycation via the Maillard reaction is a novel mechanism that may improve
upon protein hydrolysates' poor stability while maintaining or enhancing their desirable
nutritional and functional properties. Recent research on Maillard-induced glycation has
largely been focused on the potential benefits to functional properties of food proteins
glycated with various carbohydrates. However, limited information is available on how
these glycated proteins behave in industrial production conditions and in real ingredient
applications. Additionally, no work has of yet been completed on the potential benefits of
Maillard-glycation on the stability of protein hydrolysates.
Therefore, the objectives of this research are two-fold:
1) To produce and characterize a partially-glycated whey protein hydrolysate product using
controlled and limited Maillard-induced glycation, assimilating industrial procedures
where possible; and
2) To assess the ability of partially-glycated whey protein hydrolysate to retard moisture-
induced aggregation during an accelerated storage study using challenging environmental
conditions.
2
1.2 Origins and Composition of Whey Proteins
1.2.1 Whey Protein Origins
Milk and milk-based products are popular ingredients in many foods due to being
sources of proteins with excellent nutritional and functional properties. Milk protein is
made up of two major classes: casein proteins and whey proteins, comprising 80% and
20% of total milk protein, respectively, and each differing greatly in structure,
functionality, and organization within fluid milk (Hui et al. 1993).
Fluid whey is comprised of approximately 0.7-0.8% protein, 3.5-4.7% lactose,
0.05-0.1% milkfat, 0.5-0.8% ash, with the remainder being water (Page et al. 2004).
Historically, whey had little value, and so was used to feed farm animals or used as field
fertilizer (Caric 1993). On average, nine liters of whey is produced with every kilogram of
cheese, resulting in a large amount of whey to dispose of (Tunick 2008). About 960 million
pounds of dried whey were generated in the U.S. in 2013 alone (National Agricultural
Statistics Service 2014). Whey has even been viewed as a detrimental byproduct of a high
biological oxygen demand (BOD), and thus is environmentally costly to dispose of (Caric
1993). However, whey protein specifically has gained new interest since the 1970’s when
improved processing techniques made it easier to create whey products with improved
quality and functional properties (Fox 2003; Tunick 2008).
The whey that is produced industrially can be categorized into two broad classes:
sweet whey or acid whey. Sweet whey is the whey left from production of certain cheese,
such as cheddar, Swiss and mozzarella, and has a pH of 5.5-6, and a maximal titratable
acidity of 0.16% CFR (Page et al. 2004). In contrast, acid whey is whey left from other
cheeses like cottage and ricotta cheese, or Greek yogurt, which are produced by direct
acidification of milk. This whey has a pH of 4.4-4.6, and titratable acidity of 0.35-0.44%
(Page et al. 2004). Acid whey is typically considered to be of lower value because its high
lactic acid content makes it difficult to dry and process, so sweet whey is the whey more
commonly used for the production of industrial ingredients, namely whey protein
ingredients.
3
1.2.2 Whey Protein Composition
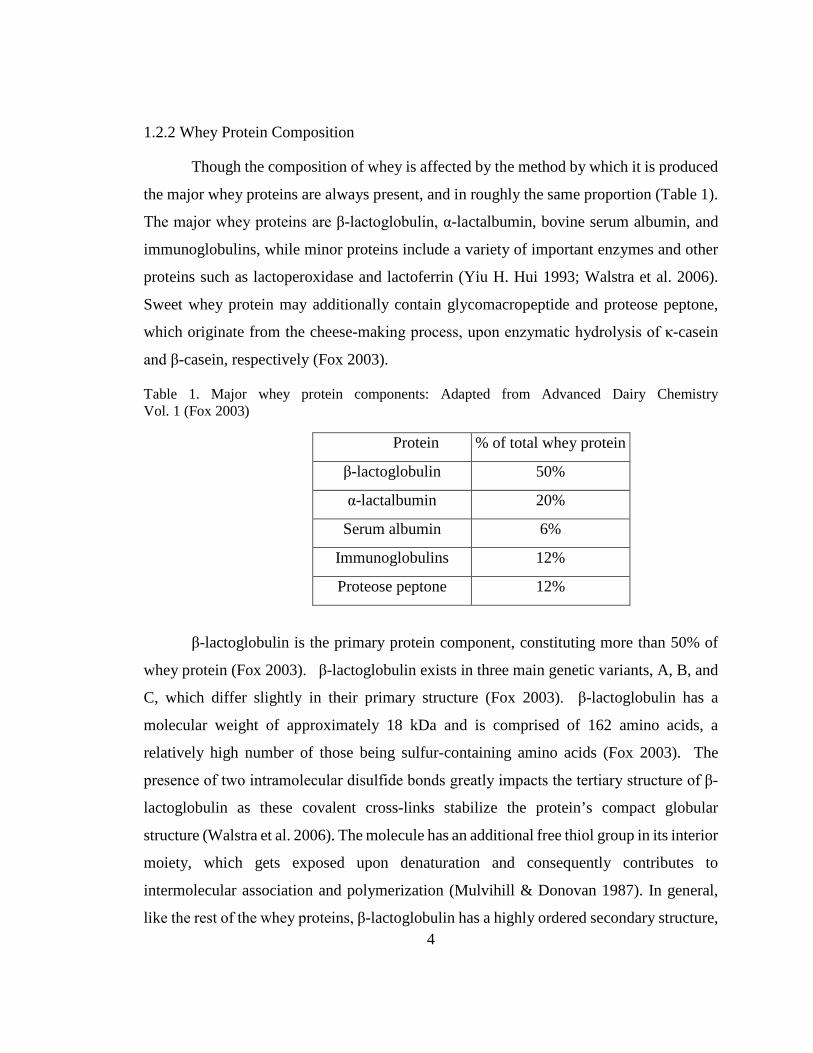
Though the composition of whey is affected by the method by which it is produced
the major whey proteins are always present, and in roughly the same proportion (Table 1).
The major whey proteins are β-lactoglobulin, α-lactalbumin, bovine serum albumin, and
immunoglobulins, while minor proteins include a variety of important enzymes and other
proteins such as lactoperoxidase and lactoferrin (Yiu H. Hui 1993; Walstra et al. 2006).
Sweet whey protein may additionally contain glycomacropeptide and proteose peptone,
which originate from the cheese-making process, upon enzymatic hydrolysis of κ-casein
and β-casein, respectively (Fox 2003).
Table 1. Major whey protein components: Adapted from Advanced Dairy Chemistry Vol. 1 (Fox 2003)
Protein
% of total whey protein
β-lactoglobulin 50%
α-lactalbumin 20%
Serum albumin 6%
Immunoglobulins 12%
Proteose peptone 12%
β-lactoglobulin is the primary protein component, constituting more than 50% of
whey protein (Fox 2003). β-lactoglobulin exists in three main genetic variants, A, B, and
C, which differ slightly in their primary structure (Fox 2003). β-lactoglobulin has a
molecular weight of approximately 18 kDa and is comprised of 162 amino acids, a
relatively high number of those being sulfur-containing amino acids (Fox 2003). The
presence of two intramolecular disulfide bonds greatly impacts the tertiary structure of β-
lactoglobulin as these covalent cross-links stabilize the protein’s compact globular
structure (Walstra et al. 2006). The molecule has an additional free thiol group in its interior
moiety, which gets exposed upon denaturation and consequently contributes to
intermolecular association and polymerization (Mulvihill & Donovan 1987). In general,
like the rest of the whey proteins, β-lactoglobulin has a highly ordered secondary structure, 4
comprised of 43% β-sheets, 10-15% α-helices, with the remainder being random coil (Fox
2003). At physiological pH (pH 5.5-7.5), β-lactoglobulin forms dimers stabilized mostly
by hydrophobic interactions (Walstra et al. 2006). At pH 3.5-5.5, due to the low molecular
net charge and lack of electrostatic repulsions near its isoelectric point, the dimers of β-
lactoglobulin associate to form octamers (Walstra et al. 2006). However, below pH 3.5 or
above 7.5, intermolecular repulsions cause β-lactoglobulin dimers to dissociate into
monomers (Walstra et al. 2006). The physiological function of β-lactoglobulin is still not
well understood. While β-lactoglobulin is not a protein intended for neonate nutrition, as
it is fairly resistant to hydrolysis, it may have a role in transporting Vitamin A, and in
stimulating lipase activity (Fox 2003).
The whey protein present in the next highest concentration is α-lactalbumin,
making up approximately 20% of whey proteins (Fox 2003). Milk can contain either of the
two genetic variants of α-lactalbumin, A and B, which differ slightly in primary structure
(Fox 2003). One molecule of α-lactalbumin has a molecular mass of 14 kDa, and is
comprised of 123 amino acids (Fox 2003). It is less ordered than β-lactoglobulin with 26%
α-helices, 14% β-sheets, and the remaining being random coil (Fox 2003). The tertiary
structure of α-lactalbumin is stabilized by its four intramolecular disulfide bonds, and it
typically binds one residue of divalent calcium (Ca2+), which lends the protein substantial
heat stability compared to the other whey proteins (Walstra et al. 2006). Similar to β-
lactoglobulin, individual α-lactalbumin molecules do associate, but the structures formed
are not as well understood (Walstra et al. 2006). Large aggregates may form at pH slightly
lower than α-lactalbumin’s isoelectric point (Kronman et al. 1964). α-lactalbumin serves
an important role in milk, where it is a coenzyme required in the biosynthesis of lactose by
the enzyme lactose synthase (Walstra et al. 2006).
The other whey proteins are present in much lower concentrations, and so have
lesser impacts on the overall whey protein functionality. Serum albumin is much larger
than either α-lactalbumin or β-lactoglobulin, with 582 amino acids and a total molecular
mass of 66 kDa (Fox 2003). The protein is stabilized by 17 disulfide bonds, and contains
an additional free thiol group (Fox 2003). Serum albumin has necessary functions in the
5

serum of blood, where it originates from, but has little functional or physiochemical
properties in milk (Fox 2003). Milk free of colostrum contains low concentrations of three
classes of immunoglobulins, abbreviated IgA, IgG, and IgM. The purpose of all three is to
provide immunity to calves and to protect the mammary glands of the cow from disease
(Hurley 2003). However, these are often denatured and inactivated by heat treatment of
milk and milk products (Walstra et al. 2006). Various peptide fractions of casein may also
be present in fluid whey, including N-terminal segments of β-casein, previously referred
to as proteose peptone, and the cleaved glycomacropeptide of κ-casein, solubilized by the
action of rennet.
1.3 Nutritional Quality and Health Benefits of Whey Protein
Many connections have been made between consumption of low-fat dairy foods
and health. Diets rich in dairy products have been associated with decreases in blood
pressure (Engberink et al. 2009; Toledo et al. 2009; van Meijl & Mensink 2011), type 2
diabetes (Elwood et al. 2008, 2010), colon cancer (Elwood et al. 2008; Pufulete 2008;
Huncharek et al. 2009), stroke and heart disease (Elwood et al. 2008, 2010). Consumption
of dairy products has also been associated with decreased levels of inflammation
(Esmaillzadeh & Azadbakht 2010; van Meijl 2010) and decreased development of the
metabolic syndrome (Pereira et al. 2002; van Meijl et al. 2008). Considering all these
potential benefits, it is not surprising that consumption of whey protein has also been linked
to good health.
Dairy products make up approximately 30% of the dietary protein of North
American and European diets (Fox 2003); this is in part due to their reputation as versatile
and high-quality sources of protein. Highly digestible and containing all the essential
amino acids in the relative proportions required for health, whey protein is considered to
have excellent protein quality. Based on the protein digestibility corrected amino acid
score (PDCAAS) system of evaluating protein quality, whey protein has the maximum
score of 100, making it on par with other high-quality animal proteins (Walstra et al. 2006).
The protein efficiency ratio (PER) is another system used to evaluate protein quality using
6
the ratio of weight gain in growing animals to protein consumption. The PER of whey
protein is 3.2, which is higher than all other protein sources except egg protein (Walstra et
al. 2006).
Dietary protein is known to contribute to satiety, even more than consumption of
fat and carbohydrate (Halton & Hu 2004). Consumption of whey protein, specifically,
before meals has been correlated with decreased food (Anderson & Moore 2004), and
reduced post-meal blood glucose and enhanced insulin secretion (Horowitz et al. 1993).
Reduction in post-meal blood glucose was attributed to the protein’s effect on gastric
emptying and its concentration of certain amino acids such as isoleucine (Dangin et al.
2002; Luhovyy et al 2007; Veldhorst et al. 2008). Researchers have observed faster
digestion and hormonal response to consumption of whey protein compared to other
proteins such as casein, as its structure and solubility allow it to be more easily metabolized,
and its constituent amino acids consequently absorbed faster (Boirie et al. 1997). Whey
proteins have been found to reduce short-term appetite better than caseins (Hall et al. 2003).
Whey protein supplementation led to increased detection of cholecystokinin (CCK), a
hormone associated with satiation, in the plasma (Hall et al. 2003).
Whey protein has become the protein supplement of choice for athletes and
individuals hoping to build more muscle for a multitude of reasons. Whey protein reaches
the jejunum of the small intestine very quickly and largely intact (Anderson & Moore
2004), and is digested over a longer length of the intestine than most proteins (Boirie et al.
1997; Newport and Henschel 1985; Miranda and Pelissier 1983). Whey protein digestion
leads to rapid and steep increase in plasma amino acids (Boirie et al. 1997), which is
desirable for post-exercise muscle repair and synthesis. Additionally, researchers have
found that postprandial protein synthesis is stimulated with whey protein consumption
(Boirie et al. 1997). This is believed to be in part due to whey protein’s high content of the
amino acid leucine, a branched-chain amino acid, which plays a role in stimulating protein
synthesis (Anderson & Moore 2004; Yudkoff et al. 2005).
Whey protein has garnered much positive attention and use in protein-
supplementation products due to being the highest natural food source of branched-chain
7
amino acids (Page et al. 2004). The branched-chain amino acids: isoleucine, leucine, and
valine, are important for muscle endurance, power, and repair (Page et al. 2004). As
‘essential’ amino acids, a sufficient supply of these three amino acids must come from the
diet. Approximately one-third of muscle is made up of these three amino acids, and so
consumption of these amino acids is vital for muscle synthesis (Page et al. 2004).
Additionally, these amino acids can be used as an energy source for skeletal muscle during
endurance exercises. Branched chain amino acids can be directly taken up by muscles
during exercise, unlike the other amino acids which must first be processed by the liver
(Page et al. 2004).
Whey protein has been widely recognized for its excellent nutritional properties
and its many potential contributions to good health, however, these benefits are of little use
without a proper delivery system. For that reason much focus has also been placed on
efficient production of whey protein ingredients, and on understanding their functionality
in various food systems.
1.4 Whey Protein Ingredients Production and Application
1.4.1 Production of Whey Ingredients
Production of dried milk powders has been used for centuries to remove water from
milk as a means to decrease weight and volume of the product and as a preservative
measure, thereby making transportation and storage more economical (Caric 1993). The
production of dried milk powders without the need for additives such as sucrose or sodium
carbonate started in the end of the 19th century, though dried whey powders were not widely
produced until the late 20th century (Caric 1993; Tunick 2008).
Whey left from production of cheese, yogurts, or other dairy products can be
processed into many whey ingredients which differ in composition and so differ in intended
application. Whey can also be voluntarily graded for quality by the USDA. The distinction
of the USDA U.S. Extra Grade is given to whey with appropriate flavor, physical
appearance, microbial characteristics, milkfat and moisture contents (AMS 2000).
8

Dried whey powders can be produced using a variety of common unit operations.
Depending on the source of the fluid whey, it is often centrifuged or filtered first to remove
cheese fines, clarified to remove any remaining milk fat, and then pasteurized to eliminate
pathogens, spoilage organisms, and any remaining cultures used in cheese production
(Walstra et al. 2006). Fluid whey is then concentrated to remove much of the water and
increase the total solids content to 40% or more (Caric 1993). This is done using
evaporation, reverse osmosis, or both in tandem (Kelly et al. 2003).
The most basic dried whey ingredient is often referred to as ‘dry sweet whey’, and
is of the same composition as fluid whey but has had almost all of the water removed (Page
et al. 2004). The approximate composition of dry sweet whey is 10.5% protein, 71%
lactose, 9% minerals, and 1% fat (Walstra et al. 2006). Dry sweet whey is used in products
in which both the protein and the significant amount of lactose is beneficial, such as bakery
products, frozen desserts, snack foods, and dry mixes for gravies and soups (Page et al.
2004).
Lactose and minerals can be removed from the fluid whey, and the product may be
further concentrated to produce higher-value whey ingredients. Lactose is removed for use
in other applications and to decrease the hygroscopicity of the final whey powder, and is
separated out by crystallization, filtration or chromatographic techniques (Caric 1993).
Minerals are typically removed to prevent defects in taste or interference in some food
applications, and are separated out by electrodialysis or ion-exchange chromatography
(Caric 1993). The last step of the process is drying the remaining material to approximately
4% moisture using spray, roller, or fluid bed drying, each process producing products of
different quality and value (Caric 1993). Dried whey powders are also typically
instantized, causing the dried powder to form agglomerates with improved wettability and
dissolving characteristics (Caric 1993).
The most common separation technologies used in modern production of high-
protein whey ingredients are ion-exchange chromatography and ultrafiltration.
Ultrafiltration of fluid whey can be used to remove low molecular weight compounds such
as minerals, lactose, and vitamins, while concentrating and increasing the protein content
9
at the same time (Caric 1993). Ultrafiltration can be paired with diafiltration to further
produce whey products with protein contents of up to 95% (Caric 1993). Ion-exchange
chromatography makes use of charged resins to purify whey proteins from lactose,
minerals, and other undesired components, and can be used to achieve whey protein
isolates with greater than 95% protein (Page et al. 2004).
When portions of the mineral and lactose are removed via filtration the resulting
ingredients are then referred to as ‘whey protein concentrates’. Whey protein concentrates
(WPC) contain at least 25% protein on a dry basis, and are divided into various categories
based on their protein content such as ‘WPC34’ with 34% protein and ‘WPC80’ with 80%
protein (Page et al. 2004; Tunick 2008). As the composition of products given the
designation of whey protein concentrate are so varied, the possible applications of these
products also vary greatly. WPC34 ingredients are often used in bakery mixes, and as dairy
product stabilizers (Page et al. 2004). In contrast, WPC80 ingredients are frequently seen
in soups, nutritional beverages, and meat products (Page et al. 2004).
The most purified whey protein ingredient is whey protein isolate, produced either
using membrane filtration or ion-exchange chromatography. Whey protein isolate (WPI)
contains at least 90% protein and typically has less than 1% lactose, fat, and less than 2%
minerals (Page et al. 2004). This ingredient can be used in a wide variety of products for
its functionality or nutritional properties, but is most notably used in formulations for
nutritional supplement bars and beverages, and is often packaged for direct purchase by
consumers for at-home protein supplementation (Page et al. 2004).
1.4.2 Functionality and Application of Whey Protein Ingredients in Foods
As noted previously whey protein ingredients can be used in a variety of products
to impart desired functional, organoleptic, and textural characteristics with the nutritional
benefit of added protein. Whey protein has a clean flavor and have better functionality
than most plant proteins (Damodaran 1994). The functionality of whey protein ingredients,
however, is highly dependent on a variety of factors including environmental factors (pH,
humidity), and processing techniques or modifications like thermal or chemical treatments.
10
The most important functional characteristics of whey protein ingredients are solubility,
water-binding, gelation, emulsification, foaming, and whipping (Kelly et al. 2003).
Whey protein is highly soluble at nearly any pH, even around its isoelectric point
(pH 4.5-5.5), a unique functional property attributed to the protein’s structure (Mulvihill &
Ennis 2003). Whey protein naturally has high surface hydrophillicity, contributing to high
intermolecular repulsions and improved solvation (Fox 2003; Moro et al. 2013). Being
globular in structure, whey protein folds in a way that buries most of the hydrophobic
amino acids within its interior moiety to reduce thermodynamically unfavorable
interactions with water (Damodaran 1994). This excellent solubility makes whey protein
ideal for use in high-protein beverages, medical nutrition supplements, powdered coffee
creamers, and soups and sauces (Kilara 1994). The solubility of whey protein is maintained
even through moderate heat treatment at 95°C if at pH less than 3.5 or greater than 6,
however, its solubility is greatly decreased by heating above 70°C around its isoelectric
point. Under these conditions the protein unfolds, exposing the hydrophobic interior and
free thiol group, leading to protein aggregation and precipitation due to reduced
intermolecular repulsions, increased hydrophobic interactions, and formation of disulfide
bridges. Nevertheless, it is still considered one of the most soluble sources of dietary
protein (Damodaran 1994).
While whey protein’s solubility may decrease upon heating, its thermal lability
often allows for excellent gelation properties when environmental conditions are controlled
(such as heating rate, temperature, ionic strength and pH). Upon thermal denaturation of
whey protein and exposure of its hydrophobic interior, and in the case of β-lactoglobulin,
its reactive free thiol group (H. Singh & Havea 2003), intermolecular hydrophobic and
disulfide interactions take place, allowing for gel network formation (H. Singh & Havea
2003). The unfolding of whey protein upon thermal denaturation also enhances the
protein’s water-binding capacity by creating more available binding sites for water (Kilara
1994). The ability of whey proteins to bind-water and gel is ideal for improving yield,
texture, viscosity, and stability of various dairy products like ricotta, cream cheese, and
yogurt (Page et al. 2004). Its water-binding can also increase the viscosity and improve
11

the mouth-feel of fluid products like soups, sauces, and creamy beverages (Kilara 1994).
The use of whey proteins for water-binding and gelation is also important to the structure
of imitation fish and seafood products, and luncheon meat products (Page et al. 2004).
Moreover, gelation and water binding are important for the structure of doughs and
retention of moistness in baked goods (Page et al. 2004).
The gels formed by whey protein with heat treatment are non-reversible, as both
non-covalent and covalent interactions are disrupted during denaturation and as
intermolecular non-covalent and covalent interactions occur during gel network formation
(Damodaran 1994). The firmness, strength, and opacity of whey protein gels can be altered
by varying the pH and ionic strength. Conditions resulting in reduced solubility such as
pH near the isoelectric point of whey protein or high ionic strength lead to opaque gels (Z
Y Ju & Kilara 1998). Strong, firm gels can be created by increasing the heating to just
above the denaturation temperature of whey proteins, and by following a moderate heating
rate to avoid rapid aggregation and precipitation (Damodaran 1994).
While whey protein in its native form lacks the ideal balance of hydrophobic and
hydrophilic regions on the surface that makes a molecule ideal for emulsification, whey
protein can unfold at the interface of emulsions and lend adequate emulsification
characteristics for a variety of applications (Page et al. 2004). Heat-treated and partially
denatured whey protein can be used and potentially replace egg ingredients in various
desserts, candies, sauces, and soups (Kilara 1994). Moderate thermal denaturation causes
unfolding that renders whey protein more amphipathic (Morr 1979; Voutsinas et al. 1983).
Whey protein may also be used to stabilize foams (Kilara 1994). Whey protein is useful in
whipping applications due to its ability to quickly diffuse to the air-water interface and
unfold to stabilize the foam, and thus may serve as a replacement for eggs in candies and
ice cream (Mangino et al. 1987; Page et al. 2004).
The net effects of whey protein’s chemical characteristics and of controlled
environmental conditions allow for excellent performance in a wide variety of applications.
This, along with whey protein’s reputation as a nutritional powerhouse has led to
considerable economic value of the former waste-stream.
12

1.5 Economic Significance of Whey Protein Ingredients
The use of whey protein ingredients and products has been on the rise in recent
years and is poised for future growth. In 2013, over 85 million pounds of WPI and over
480 million pounds of WPC were produced, up 34% and 13.4% from 2012, respectively
(National Agricultural Statistics Service 2014). Global production of whey protein
products had an estimated market value of 9.8 billion U.S.D. in 2013, and is forecasted to
reach 11.7 billion U.S.D. by 2017 (UBIC Consulting 2014). Favorable consumer
perceptions of whey protein and other proteins have helped boost their perceived value and
use in products. More than half of the adults in the U.S. want more protein in their diet,
driven by health and wellness trends and by protein’s associations with satiety, muscle-
building, and healthy aging (The NPD Group 2014). In 2013, nearly 25% of adults in the
U.S. reported that when they check the nutrition facts panel for a product they’re looking
for the protein content (The NPD Group 2014). And half of American consumers are
flexible protein users, and are looking to non-meat sources to meet their protein needs (The
NPD Group 2014). Whey proteins are well suited to meet the needs of flexible protein
users, particularly in the growing performance food and drinks category, estimated to be
worth more than 10 billion U.S.D. (Mintel 2013), as they have become widely available,
and display excellent nutritional and functional quality.
Whey protein is an excellent functional food ingredient due to its wide availability,
excellent functionality, and excellent nutritional properties, which has led to its
incorporation in a wide variety of food products. These same qualities, along with
favorable consumer perception, make whey an excellent candidate for the production of
value-added food ingredients such as whey protein hydrolysates.
1.6 Usage of Whey Protein Hydrolysate Ingredients
In addition to traditional protein isolate and concentrate products, many proteins
are also available as hydrolysates which have undergone varying degrees of hydrolysis to
produce value-added products with improved health, functional, or other properties.
Protein hydrolysates are used most notably in the formulation of infant formulas, sports 13
nutrition products, clinical nutrition products, and other functional foods or dietary
supplements (Affertsholt 2010). Currently protein hydrolysate ingredients make up a
fraction of the market volume of their isolate and concentrate counterparts, but their market
growth greatly outpaces non-hydrolyzed protein ingredients (Affertsholt 2009). Global
production of dairy hydrolysates exceeded 20,000 metric tons in 2010, with a market value
exceeding 300 million U.S.D, and a projected short-term yearly growth of 8-10%
(Affertsholt 2010). More specifically, global production of whey protein hydrolysates is
projected to have an annual average growth rate of 3.4% from 2008-2018 (Frost & Sullivan
2013).
1.6.1 Production of Whey Protein Hydrolysate Ingredients
Hydrolysis is one of many methods available for altering a protein’s structure.
Hydrolysis disrupts the primary structure of a protein by breaking the peptide bonds,
resulting in the production of peptides with lower molecular weight than the native protein.
Protein hydrolysis is primarily accomplished through chemical or enzymatic means (Alder-
Nissen 1986). Chemical hydrolysis uses strong acid or base to hydrolyze the peptide bonds
of proteins, and the resulting peptides are heterogeneous, as acids and bases hydrolyze non-
specifically (Alder-Nissen 1986). More common is the use of enzymes to hydrolyze
proteins, as specific enzymes can be used that target select sequences of the protein,
resulting in a more uniform and consistent hydrolysate (Alder-Nissen 1986; Lahl & Braun
1994). Use of enzymatic methods also eliminates the adverse side-reactions that may occur
with chemical hydrolysis, including a decrease in nutrition quality by destruction of certain
amino acids such as tryptophan, and through the formation of carcinogenic byproducts
such as lysinoalanine (Lahl & Braun 1994).
Properties of hydrolysates are affected by many factors both intrinsic and extrinsic.
Factors that affect protein hydrolysate characteristics include the type and specificity of the
enzyme used, treatment and purity of the protein before hydrolysis, the physiochemical
conditions during hydrolysis (including pH, temperature, ionic strength, and presence or
absence of activators or inhibitors), the extent or degree of hydrolysis (DH), the technique
14
used for enzyme inactivation, and any post-hydrolysis treatment, such as drying (Alder-
Nissen 1986).
In the production of WPH, specifically, a number of enzymes have been used with
success. The enzyme chosen often is dictated by the desired application of the hydrolysate.
Digestive enzymes are commonly used for the production of WPH including pepsin,
trypsin and chymotrypsin (Ju et al. 1995; Groleau et al. 2003; Konrad et al. 2005;
Hernandex-Ledesma et al. 2005; Pouliot et al. 2009). But plant enzymes have also been
used such as papain and bromelin (Nakamura et al. 1993); as well as bacterial proteases
such as that of Bacillus licheniformis (Madsen et al. 1997; Creusot et al. 2006). Often
times a mixture of enzymes are used to achieve desired effects in functionality or nutrition,
and so commercial enzyme preparations are designed with more than one enzyme to target
a specific application (Alder-Nissen 1986). One such commonly used commercial enzyme
preparation is Alcalase® (Novozymes, Bagsværd, Denmark) which is a mixture of
enzymes derived from Bacillus licheniformis, and which has been observed to generate
whey protein hydrolysates with enhanced gel-forming properties (Spellman et al. 2005;
Creusot and Gruppen 2008).
Whey protein hydrolysates are produced on an industrial scale in a few ways.
Traditional production of protein hydrolysates is a batch process (Alder-Nissen 1986). In
batch production the protein substrate is added to a vat along with the enzyme and the
reaction is monitored until the desired DH is achieved, at which point the enzyme is
inactivated with heat or pH (Alder-Nissen 1986). More recently, semipermeable
membrane enzymatic reactors have gained interest. Production of hydrolysates using
membrane enzymatic reactors is similar to batch production except that the vat has a semi-
permeable membrane that retains the enzyme along with proteins and peptides above a
certain size, and allows smaller compounds to pass through (Guadix et al. 2006; Cheison
et al. 2007a, 2007b). This membrane allows for selective hydrolysis of proteins until they
reach a certain size, pass through the filter and are not hydrolyzed any further (Cheison et
al. 2007a, 2007b). This allows for cost-effective re-use of enzyme, reproducible generation
15
of peptides of a specific and controlled length, and allows for high enzyme concentrations
and continuous production (Cheison et al. 2007a, 2007b).
The environmental conditions during hydrolysis have a significant impact on the
efficiency of the process, and the final DH, quality and functionality of the resulting
hydrolysates. The DH of whey protein hydrolysates is maximized with the use of the
optimal temperature and pH of the enzyme(s) used for hydrolysis. However, whey protein
hydrolysates with high DH currently have only a few major uses, specifically reduced-
allergencity formulas for infants with milk allergies and medical diets, due to the poor
functionality of high DH hydrolysates. Instead, DH is often limited to low or moderate
levels (~5-10%) to enhance functionality, including solubility (Mullally et al. 1994),
emulsification (Turgeon et al. 1991), emulsification (Kuehler & Stine 1974), and gelation
(Creusot & Gruppen 2007).
Post hydrolysis treatments of whey protein hydrolysate may include dialysis,
fractionation, de-bittering, and drying (Ismail & Gu 2010). As enzymes are sensitive to
pH and perform best at their optimum pH, the environmental pH during hydrolysis is
typically monitored and adjusted using acid or base. However, pH adjustment using acid
and base results in the generation of salts, which are often removed using dialysis to
maintain the hydrolysate purity (Alder-Nissen 1986). In the production of whey protein
hydrolysate with composition targeted for particular usage, such as selecting for
particularly bioactive peptides or peptides with high aggregation ability, fractionation
using isoelectric focusing, nano-filtration or chromatography have been used to retain only
peptides with the desired characteristics (Ting et al. 2007; Saint-Sauveur et al. 2008). If
bitter peptides are generated during hydrolysis, the hydrolysates may be de-bittered using
a variety of techniques including activated carbon treatment (Cheison et al. 2007a). The
final post-hydrolysis treatment is drying, which is typically carried out using roller drying
or spray drying (Alder-Nissen 1986).
16
1.6.2 Health Benefits of Whey Protein Hydrolysate Ingredients
With the rising consumer trends towards health, wellness and functional foods, one
of the most enticing reasons for the production of protein hydrolysates is the potential
benefits to consumer health and nutrition. The potential health benefits of protein
hydrolysate consumption have been widely studied and include the generation of bioactive
peptides, increases in digestibility, and decreases in allergenicity.
One of the most consequential benefits of the production of protein hydrolysates is
the generation of bioactive peptides. Bioactive peptides are specific sequences of amino
acids that can be liberated from a protein upon hydrolysis and are associated with positive
health benefits such as antihypertensive, anti-inflammatory, antimicrobial, antioxidative,
or opioid activity, among other physiological benefits. Bioactive peptides are typically
short in length, often 2-9 amino acids long (Kitts & Weiler 2003); however, many bioactive
peptides are produced with only limited degree of hydrolysis (2-8%) (Ismail & Gu 2010)
allowing for retention of much of the original protein’s functional properties.
Many bioactive peptides have been identified in or produced from whey protein.
Peptides with opioid activity called lactorophins have been derived from both β-
lactoglobulin and α-lactalbumin (FitzGerald & Meisel 2003). Whey protein peptides called
lactokinins derived from β-lactoglobulin, α-lactalbumin and bovine serum albumin have
been shown to combat increases in blood pressure by inhibiting the angiotensin-I-
converting enzyme (ACE), which increases blood pressure via the renin-angiotensin
system (Meisel 1997; FitzGerald & Meisel 2003). Peptides from lactoferrin have been
reported to have potent antimicrobial activity (FitzGerald & Meisel 2003). Also, whey
protein hydrolysates with low DH have been observed to have antioxidant properties
(Dryáková et al. 2010; Peña-Ramos et al. 2004). The use of bioactive peptides to improve
health and combat illness is promising as bioactive peptides are naturally occurring, non-
toxic, with minimal if any side-effects or dosage effects (Danquah & Agyei 2012). These
characteristics make bioactive peptides a persuasive replacement for many of the synthetic
compounds currently used.
17
Whey protein hydrolysates also serve as valuable ingredients for products such as
infant formula or clinical diet formations. Hydrolysis increases the digestibility of whey
proteins (Sinha et al. 2007). Additionally peptides are more bioavailable than either intact
proteins or free amino acids (Danquah & Agyei 2012). Extensively hydrolyzed whey
protein hydrolysates are often used in the formulation of many medical diets for illnesses
such as liver disease, Chron's disease, pancreatitis, and ulcerative colitis (Clemente 2001;
Poteir and Tome 2008). Moreover, disruption of the primary structure of proteins upon
hydrolysis may result in the destruction of linear or conformational epitopes, hence
decreasing the allergenicity of a protein. Extensively hydrolyzed whey protein has been
successfully used as a replacement for traditional formulas for infants sensitive or allergic
to cow’s milk and soy (Merritt et al. 1990; Oldaeus et al. 1992; Nakamura et al. 1993;
Guadix et al. 2006).
Many health benefits may arise from the production of whey protein hydrolysates,
however excess hydrolysis may be associated with a decrease in functionality. It is
important that hydrolysis conditions are designed to optimize both the health and functional
benefits of whey protein hydrolysates.
1.6.3 Functional Benefits and Usage of Whey Protein Hydrolysate Ingredients
Whey protein hydrolysates can display certain functional benefits depending on
their protein/peptide profile and the DH. Changes in protein size and primary structure
lead to changes in the interactions between proteins and peptides, and alter the effects of
environmental factors, ultimately leading to changes in the protein’s functionality. Most
of the changes in functionality of protein hydrolysates are due to the net decrease in
molecular weight, and the exposure of hydrophobic and ionic groups (Ismail & Gu 2010).
Whey protein hydrolysates may display improved solubility, lower viscosity, improved
emulsification and foaming capacity, improved gelation properties, and improved thermal
stability.
18

Protein hydrolysates with improved solubility and reduced viscosity, allow for the
formulation of high-protein beverages with improved stability (Mullally et al. 1994).
Though the solubility of native whey protein is excellent, high heat-treatment can cause
severe loss in solubility (Wang & Ismail 2012). Hydrolysis has been shown to improve the
solubility of heat denatured whey protein even around the isoelectric point by increasing
the number of accessible charged carboxyl and amine groups (Perea et al. 1993; Mutilangi
et al. 1996).
Whey protein hydrolysates with low DH may also display enhanced surface
activity, as the smaller peptides are more readily adsorbed into the interface and may
display greater molecular flexibility and thus faster unfolding at the interface than their
native non-hydrolyzed counterparts (Damodaran 1994). These qualities along with other
structural factors such as amphipathic character, hydrophobicity, and net charge may make
particular whey protein hydrolysates more suited for specific emulsification or foaming
applications (Turgeon et al. 1991; Ismail & Gu 2010).
Singh and Dalgleish (1998) observed maximal emulsifying capacity using WPH
with DH of 10-20%, however emulsion stability was poorer compared to native proteins
unless a lower DH was used (Singh and Dalgleish 1998; van der Ven et al. 2001; Foegeding
et al. 2002). Whey protein hydrolysates with low DH (2-5%) displayed improved emulsion
and foaming capacity and stability (Althouse, Dinakar, and Kilara 1995; Kuehler and Stine
1974; Foegeding et al. 2002).
Whey protein hydrolysates that were extensively hydrolyzed displayed poorer
gelation properties compared to their native proteins, as shorter peptide chains can make
network formation more difficult (Huang et al. 1999). However, controlled and limited
hydrolysis using specific enzymes may improve gelation properties of food proteins,
including whey protein. Whey protein gelation can be improved when hydrolysis exposes
hydrophobic residues, allowing for intermolecular hydrophobic interactions (Creusot &
Gruppen 2007). For instance, hydrolysis of whey protein using proteases from Bacillus
licheniformis have resulted in improved gel formation (Otte et al. 1996; Creusot et al. 2006;
Creusot and Gruppen 2007).
19

Several researchers have also reported that the hydrolysis of whey protein leads to
changes in gelation properties. For instance, acid-set gels made from non-hydrolyzed whey
protein are typically elastic, while gels made from chymotrypsin hydrolyzed whey protein
have reduced elasticity making them better suited for certain food applications like yogurt
(Rabiey & Britten 2009).
Sometimes gelation is undesirable, such as in high-protein beverages requiring
heat-treatment. In these cases extensive hydrolysis leading to poor gel network formation
is preferred for its improved thermal stability. Hydrolysis has been used as a method to
impart heat stability of whey protein, because hydrolysis disrupts the protein’s secondary
structure leading to less secondary structure loss during subsequent heating (Foegeding et
al. 2002). However, extensive hydrolysis has detrimental effects on flavor because of the
excessive production of bitter peptides (Murray & Baker 1952).
A variety of whey protein hydrolysates have been produced in laboratory research
yielding a diverse array of biological and functional benefits, however a caveat of these
results is that many challenges that would be faced in industrial production are not
addressed. If whey protein hydrolysates are to have greater market value, and increased
inclusion in products these challenges must be addressed.
1.6.4 Challenges with the Usage of Whey Protein Hydrolysate Ingredients
Though WPH have many benefits to their use, they also present several challenges,
one of which is the perception of bitter flavor. Protein hydrolysates, particularly those
which are extensively hydrolyzed, have a perceivable amount of bitter peptides, which
negatively affect the flavor profile of the final products (Murray & Baker 1952).
Particularly, peptides that have a higher number of hydrophobic amino acids have been
associated with the bitter taste (Matoba & Hata 1972). Although the perception of bitter
peptides has no impact on the functional or nutrition properties of WPH, it drastically
decreases their sensory quality and hence consumer acceptability.
Another impact of hydrolysis upon sensory quality of whey protein is the effect of
peptide buffering on acidic products, particularly beverages. Hydrolysis of proteins results
20

in increased exposure of carboxyl and amine groups and a subsequent increase in buffering
capacity of the protein solution. This necessitates a greater amount of acid to lower the pH
to desirable levels, and in the process contributes to extreme sourness and astringency.
Protein hydrolysates also face challenges with shelf-life and deteriorative reactions.
All chemical reactions, such as loss of free amino groups due to non-enzymatic browning,
and protein-protein aggregation, among others, proceed more quickly with protein
hydrolysates due to increased molecular mobility as well as increased exposure of reactive
groups, such as thiol and amino groups as well as hydrophobic residues (Netto et al. 1998;
Zhou and Labuza 2007). These chemical reactions often lead to challenges such as
browning, hardening or caking (Rao, Fisher, et al. 2013), and overall reduced sensory
acceptability. Protein hydrolysates have also been observed to decrease the glass transition
temperature of protein powder systems, making the system less stable and resulting in even
greater molecular mobility (Netto et al. 1998; Zhou and Labuza 2007; Rao and Labuza
2012).
A wealth of research is available on the many beneficial hydrolysates that can be
generated from whey protein including those with bioactive peptides, decreased
allergenicity, improved digestibility, and enhanced functional properties. However, it is
vital that the challenges facing hydrolysate usage are further investigated including
improving the sensory quality and shelf life stability of WPH and the products they are
added to. This is essential if WPH is to have greater industrial production and utilization
in food products.
1.7 Moisture-Induced Protein/Peptide Aggregation
Though concentrated whey protein powders have shown immense promise in a
variety of applications due to their high nutritional and functional qualities, there are still
limitations to their use in products due to problems with aggregation during extended
storage. Aggregation of whey and other proteins can occur both during storage of the
isolate or hydrolysate powders or later after inclusion in high-protein food systems such as
21
bars (Netto et al. 1998; Zhou et al. 2008; McMahon et al. 2009; Zhu and Labuza 2010; Rao
et al. 2013; Zhou et al. 2013).
1.7.1 Mechanisms of Protein/Peptide Aggregation
Protein aggregation refers to the clustering of protein molecules and the formation
of aggregates through both covalent and non-covalent interactions, which are generally
irreversible once they are formed (Weiss et al. 2009). Aggregate formation often leads to
reduced solubility, and increased turbidity, precipitation, and formation of undesired gel
networks, depending on a variety of factors such as protein concentration, presence of salts
and other compounds, relative humidity, and the type and structure of aggregates formed
(Zhou et al. 2008a; Zhu & Labuza 2010). Additionally, problems with solubility and
precipitation can cause reduced overall functionality (De Wit 1990) and nutritional
bioavailability, and thus are serious concerns limiting the usage of these ingredients.
The two primary methods by which proteins form aggregates are hydrophobic
interactions and intermolecular disulfide-bond formation et (Costantino et al. 1994). The
former involves the clustering of exposed hydrophobic regions of multiple protein
molecules in order to decrease their unfavorable interactions with water. The latter
involves the formation of new intermolecular disulfide bonds from reactive free thiol
groups of protein molecules, or free thiol-disulfide interchange between protein molecules,
where an intramolecular disulfide bond is replaced by an intermolecular disulfide bond.
Researchers have suggested that disulfide bond formation is the more responsible of the
two for whey protein aggregation (Costantino et al. 1994; Visschers & de Jongh 2005;
Zhou et al. 2008a).
Researchers have also found that aggregation is often preceded by denaturation (De
Wit 1990; Ju and Kilara 1998; Havea et al. 2002), and that a greater degree of denaturation
often leads to a greater extent of aggregation (H. Singh & Havea 2003). Denaturation alters
the structure of proteins and allows for greater covalent and noncovalent intermolecular
interactions (H. Singh & Havea 2003). The rate of disulfide bond formation can be
increased by most methods known to also induce denaturation such as heating (De Wit
22

1990), high pressure processing (Funtenberger et al. 1997; Patel et al. 2005; X. Liu et al.
2005), mechanical shear (Visschers & de Jongh 2005), alkaline pH (Alting et al. 2000;
Mleko & Foegeding 2000) and high ionic strength (Bryant & McClements 2000;
Unterhaslberger et al. 2006).
Additionally, common chemical reactions such as the Maillard reaction and lipid
oxidation may cause protein polymerization and exacerbate protein aggregation. The
progression of each of these reactions is complex, and the number of potential intermediate
and end products is vast and highly dependent on the food system. The advanced stage of
the Maillard reaction is characterized in part by the formation of high molecular weight
colored compounds called melanoidins, which contribute to noticeable protein aggregation
in protein systems (Zamora & Hidalgo 2005; Zhou et al. 2013). Products of lipid oxidation
can result in free-radical attack on proteins in food systems leading to protein-protein cross-
links (Gardner 1979; Kikugawa & Beppu 1987). Additionally, secondary products of lipid
oxidation may participate in the Maillard reaction leading to more formation of high
molecular weight aggregates (Zamora & Hidalgo 2005).
1.7.2 Protein/Peptide Aggregation during Storage
Much of the work on protein aggregation during storage has examined the
interaction between time, temperature, and moisture. Most research suggested that as time
and temperature of storage increase, so does rate of aggregation (Liu et al. 1990; Zhou et
al. 2008a). The influence of temperature is critical as most chemical reaction rates increase
with increase in temperature due to increase in molecular mobility (Levine & Slade 1986).
Increase in temperature can also lead to denaturation (Zhou et al. 2013), which increases
the aggregation rate, and the transition of proteins from their glassy to their more reactive
rubbery state (Levine & Slade 1986; W.R. Liu et al. 1990). The increase in flexibility and
mobility of whey proteins due to increase in storage temperature led to observable increases
in the accessibility of thiol groups, which enhanced disulfide interchange (Zhou & Labuza
2007; Zhou et al. 2008b). Also researchers studying high-protein bar model systems
formulated with whey protein observed greater formation of aggregates, increased
23
hardness, and changes in protein microstructure with higher storage temperature (Zhou et
al. 2008a). Therefore, research suggests that storage should ideally be done at low
temperatures, where formation of aggregates is generally decreased.
Moisture has similarly important effects on reaction rates and aggregation. At
water activities of the monolayer, chemical reaction rates are at a minimum, since water is
often a vital participant in chemical reactions (Labuza et al. 1970). Water also lowers the
glass transition temperature of proteins, allowing them to more easily transition from their
glassy to rubbery states and contributes to greater inter-chain mobility and greater reaction
rate by serving as a reactant or reaction medium (Slade et al. 1991). Increases in moisture
content of whey protein powders has led to lower denaturation temperatures, while
aggregation rates decreased as moisture content dropped below 30% for whey protein
powders (Zhou & Labuza 2007). Increasing moisture content resulted in increased
aggregation rates until the point at which additional water caused dilution of the protein
reactants, around 70-80% for a whey protein-buffer system (Taoukis et al. 1988; Zhou and
Labuza 2007).
1.7.3 Proposed Solutions to the Problem of Protein/Peptide Aggregation
The challenge of combating protein/peptide aggregation in protein products has
been difficult, as it can be initiated and enhanced by a variety of factors. Several potential
solutions have been proposed including environmental controls, use of additives, and
protein modification.
As the aggregation rate is highest at high temperature and humidity (Costantino et
al. 1994), controlling storage conditions is the most widely used approach for limiting the
extent of protein aggregation during storage. Most protein powders are dried to low
moisture levels well below the monolayer moisture value and are then packaged in
materials such as foil-lined or metalized plastics that help control the microenvironment of
the powder by limiting water vapor transmission into the container. Most manufacturers
will also suggest the product be stored in cool, dry areas to limit aggregation.
24
A number of additives have also been used with success to decrease the aggregation
of protein products. Addition of sodium chloride at 0.05-0.45M levels were observed to
decrease aggregation of whey protein in a model buffer system (Zhou et al. 2008a). This
is believed to be due to the ability of moderate ionic strength to enhance ionic
intermolecular repulsions. Thiol-blockers such as N-ethylmaledimide, 2-indoacetamide,
or iodoacetic acid have been observed to decrease thiol-disulfide interchange, and reducing
agents such as β-mercaptoethanol have been used to break disulfide bonds formed during
aggregation, but all of these compounds are toxic and so cannot be used in foods (Zhu &
Labuza 2010). In contrast, glutathione and cysteine, which are reducing agents and GRAS
food ingredients, have prevented the formation of disulfide-bonded aggregates in whey
protein isolate-based high protein bar model systems (Funtenberger et al. 1997; Zhu and
Labuza 2010). Additionally, cupric ions can be used to reduce aggregation of proteins by
oxidizing thiols and making them less reactive, and thus less likely to participate in
intermolecular disulfide interchange (Hopton et al. 1989; Costantino et al. 1994).
As certain food product applications may limit the use of particular additives,
researchers have also investigated protein modification techniques that may result in
decreasing protein/peptide aggregation. Whey protein hydrolysates are currently used in
the protein bar industry to reduce bar hardening because they serve as a plasticizer and
decrease the glass transition temperature of the bar matrix (McMahon et al. 2009; Rao,
Kamdar, et al. 2013). However the use of protein hydrolysates comes with its own
challenges in terms of shelf-life stability. Protein hydrolysates have been observed to have
increased sensitivity to environmental conditions such as temperature and humidity due to
the increased hygroscopicity and increased molecular mobility of low MW hydrolysates
(Rao & Labuza 2012). Hydrolysates also display increased reactivity in the Maillard
reaction leading to the formation of high-molecular weight aggregates as reaction products
due to increased accessibility of reactive groups such as cysteines, lysines, and n-terminal
free amines (Rao & Labuza 2012). Additionally, protein hydrolysates decrease the stability
of the protein system as a whole by reduction of the glass transition temperature, leading
to greater molecular mobility and instability (Rao & Labuza 2012).
25
An ideal solution to the challenges faced with the use of protein hydrolysates would
be one that curbs the stability challenges, while maintaining or enhancing the nutritional
quality, functionality, and other beneficial attributes of protein hydrolysates. Recently,
protein glycation via the initial stage of the Maillard reaction has been shown to decrease
aggregation naturally via a number of mechanisms (Jimenez-Castano et al. 2005; Wang &
Ismail 2012).
1.8 Maillard-Induced Protein Glycation
The Maillard reaction is a fundamental food chemistry reaction known best for
being responsible for the development of the aromas and brown colors associated with the
heat treatment of food. The Maillard reaction is actually a complex series of reactions that
generate a wide variety of products, and is also often referred to as non-enzymatic
browning (Hodge 1953).
1.8.1 Significance and Mechanisms of the Maillard Reaction in Foods
The Maillard reaction is often described in terms of three stages: initial,
intermediate, and final; of which the first is best understood. The first description of the
initial stage of the reaction is commonly attributed to Louis Camille Maillard, a French
chemist in 1912 after whom the reaction was later named. The first step involves the
condensation of the free aldehyde of a carbonyl containing compound with an amino group.
In foods the carbonyl-containing compound is often a carbohydrate, though ascorbic acid,
products of polyphenol oxidase action, and low molecular weight aroma compounds can
also participate in the reaction (Labuza & Schmidl 1986). The amine groups are typically
supplied by protein. This initial step results in the formation of a Schiff base, which
rearranges in a step known as Amadori rearrangement, to form a ketosamine often called
the Amadori compound (Hodge 1953). The Amadori compound is the first stable
intermediate of the reaction (Hodge 1953).
26
The intermediate and final stages of the Maillard reaction involve the degradation
of the Amadori compound to yield a variety of advanced Maillard reaction products (Hodge
1953). The mechanisms of these later stages of the Maillard reaction are more divergent,
and may involve a variety of different steps including fissions, cyclizations, and
polymerizations leading to diverse products like low molecular weight aromatic
compounds, and highly polymerized and dark-colored melanoidins (Hodge 1953).
1.8.2 Control of the Maillard Reaction in Foods
In some food products such as breads and meats the formation of aromas and brown
color by the Maillard reaction are desirable; however, in many other foods containing
protein and reducing carbohydrates, it is important to minimize the reaction to prevent
losses in quality. The rate and extent of the Maillard reaction in food products can be
controlled through a variety of avenues.
The Maillard reaction proceeds the fastest at elevated temperatures and the reaction
is zero-order with respect to temperature when reactants aren’t limiting such as in many
food products (Stamp & Labuza 1983). In many cases such as in dried milk protein
powders, the reaction does still occur spontaneously at room temperatures, albeit more
slowly. The reaction is also highest in systems with a water activity of 0.5-0.8. This is
because available water causes increases in the molecular mobility of the reactants, and
this mobility is much lower at water activities below 0.5 particularly at the monolayer value
(Eichner and Karel 1971; Duckworth 1981). The reaction peaks around a water activity of
0.6 and begins to decrease as increases in available water result in dilution of the reactants
(Eichner & Karel 1971). At basic pH, the rate of the Maillard reaction is the greatest. At
pH above their pKa, amine groups are not protonated and so are more reactive (Labuza &
Schmidl 1986). However, the rate of the reaction can also be high at extremely acidic pH
(<3) as this may cause protein hydrolysis, resulting in an increase of free amine groups
available for the reaction (Labuza & Schmidl 1986). To control the rate of Maillard
reaction, food products are typically kept under controlled storage where the effects of
temperature, water activity, and pH can be controlled.
27
The reaction can also be limited through the removal of reducing sugars, but as that
may not be possible in all product formulations, selection of appropriate reactants is often
used instead. Smaller pentose sugars proceed through the reaction much quicker than
hexoses, disaccharides, or polysaccharides (Prabhakaram and Ortwerth 1994; Nacka et al.
1998; Aoki et al. 2001; Oliver et al. 2006; Laroque et al. 2008; Hiller and Lorenzen 2010;
Haar et al. 2011). Larger sugars proceed more slowly in the reaction due to steric hindrance
and decreased accessibility of the free aldehyde necessary for the reaction (Haar et al.
2011). Also, in the case of oligo- and polysaccharides, the shorter the carbohydrate chain,
the more open chain form is present at any given time; the open chain form of a
carbohydrate is the most reactive form in the reaction (Chevalier, Chobert, Dalgalarrondo,
et al. 2001). Additionally, the use of charged sugars can decrease the progress of the
reaction by instigating electrostatic repulsions between the proteins and sugars (Haar et al.
2011).
The protein source can also be used to control the rate and extent of the Maillard
reaction in food products. Protein sources with a greater number of accessible free amine
groups, such as protein hydrolysates, have a greater potential for participation in the
reaction. The amino acid lysine, which contains an ε-amine group in its side chain, is
considered to be the most important source of reactive amine groups in the Maillard
reaction (Labuza and Schmidl 1986; Schnickels et al. 1976). Therefore, proteins with a
high percentage of lysine in their primary structure, such as whey protein, have a greater
potential for participation in the reaction. The ratio of amine groups to free carbonyl
groups can also control the rate and extent of the reaction (Kearsley 1978); an increased
ratio of carbohydrate to amino group yields the highest rate of the Maillard reaction in
foods (Lea & Hannan 1951; Wolfrom et al. 1974; Warmbier et al. 1976).
Other components present in foods can also have an effect on the rate and extent of
the Maillard reaction in foods. Presence of certain metals such as iron and copper can
increase the rate of the reaction by aiding sugars in the redox reaction required to convert
from their ring form to the more reactive open-chain form (Labuza & Schmidl 1986). Also,
28
presence of sulfites can decrease the rate of the reaction by keeping carbonyls in less stable
conformations (Burton et al. 1963).
Extensive research has been carried out on the natural propagation of the Maillard
reaction in food systems, and how best to characterize and control its proliferation to
maintain food quality. However, a new area of research focused on the Maillard glycation
aims at using the reaction to naturally enhance the properties of food proteins.
1.8.3 Production of Ingredients with Novel Functionality and Application Using the Maillard Reaction
While the initial research on the Maillard reaction was primarily directed on
understanding the mechanisms and control of the reaction, in the past few decades new
interest is evolving around the use of the Maillard reaction to impact the functionality and
application of food proteins. The Maillard-induced glycation resulted in improved
solubility (Chevalier et al. 2001; Jimenez-Castano et al. 2005; Wang and Ismail 2012),
gelation (Li et al. 2005; Spotti et al. 2013), foaming (Chevalier et al. 2001; Mishra et al.
2001; Hiller & Lorenzen 2010), emulsification (Chevalier et al. 2001; Akhtar & Dickinson
2003, 2007; Hiller & Lorenzen 2010), and thermal stability (Hattori et al. 1997; Chevalier
et al. 2001; Jimenez-Castano et al. 2005; Hiller & Lorenzen 2010; Wang & Ismail 2012)
of whey protein. Researchers have also observed that Maillard-induced glycation can
improve other properties of food proteins such as digestibility and antioxidant capacity of
food proteins (Calligaris et al. 2004; Hiller & Lorenzen 2010; Wang & Ismail 2012).
Several researchers have studied the impact of various reaction conditions on the
functionality of the end product. Researchers found that glycation of whey protein through
dry heating with 15-25 kDa dextran improved mechanical properties of heat-induced gels,
and that the time of the dry heating affected the gel properties (Spotti et al. 2013). Jimenez-
Castano and others ((2005) examined the glycation of β-lactoglobulin with dextran and
found that the best conditions for optimum production of the Amadori product was dry
heating at 60°C with 44% relative humidity, and a ratio of dextran to β-lactoglobulin of
2:1. They also found that glycation with 10kDa dextran improved the solubility of β-
lactoglobulin at low pH, and in other studies, improved the thermal stability of individual 29

whey proteins (Jiménez-Castaño et al. 2005, 2007). Chevalier and others (2001a; 2001b)
found that glycation of β-lactoglobulin with small sugars resulted in an acidic shift of the
isoelectric point towards a lower pH than native β-lactoglobulin, and improvements in the
protein’s solubility and thermal stability at acidic pH. Glycation of whey protein isolate
with 500kDa dextran and also with maltodextran, resulted in a product with improved
emulsification properties (Akhtar & Dickinson 2003, 2007).
Maillard-induced glycation has been shown to decrease protein/peptide aggregation
in certain food systems. Researchers have observed that Maillard-induced glycation
decreases protein aggregation during heating around the protein’s isoelectric point, leading
to maintained solubility at fairly low protein concentrations (Chevalier et al. 2001). Wang
and Ismail (2012) observed that controlled and limitation glycation of whey protein with
10kDa dextran, after removal of unreacted dextran, resulted in a product that maximized
protein retention and resisted aggregation and precipitation even at pH around the
isoelectric point of whey protein, at protein concentrations in excess of 4%, and after
heating at 80°C for 30 min. The researchers attributed this observation to structural
changes including a shift to a more acidic isoelectric point, reduced surface hydrophobicity
and surface sulfhydryl group exposure, an increase in net negative charge due to blockage
of charged lysine residues, an increase in structural rigidity due to ionization of carbonyl
groups and rearrangement of disulfide linkages, and intermolecular steric hindrance due to
the attachment of the bulky sugars (Wang & Ismail 2012; Wang et al. 2013). Additionally,
partial glycation was observed to improve thermal stability, causing a significant increase
in the denaturation temperature of both β-lactoglobulin and α-lactalbumin, decrease in heat
denaturation rate, and minimal changes to surface hydrophobicity and surface sulfhydryl
group exposure even with extended heating at 80°C (Wang et al. 2013).
Despite the flurry of research on the functional benefits of Maillard-induced
glycation of food proteins there are still important areas of investigation that are severely
lacking. Many researchers have identified mechanisms of improved solubility and
decreased aggregation of glycated protein in solution, but no work has yet investigated any
potential benefit to protein powders or intermediate-moisture-foods, where moisture-
30
induced aggregation is a serious problem. Additionally, though there is exhaustive
literature available on the glycation of any number of available protein isolates and
concentrates using a wide variety of carbonyl sources, no work has yet been approached to
use Maillard-induced glycation to address the challenges of protein hydrolysate stability.
Lastly, much of the work on protein glycation for functional benefit has been
exploratory in nature, and doesn’t reflect the needs of industrial production and application
such as maximizing input usage, minimizing waste streams, product consistency, and using
industry-friendly materials and techniques. For protein glycation technologies to advance
pass the bench-top stage and realize their proclaimed benefit, it is vital that research also
be carried out with industry friendly practices.
1.8.4 Consequences of the Maillard Reaction
Despite the promise of the Maillard reaction to improve the functionality and
stability of food proteins, it does come with some drawbacks. Various intermediates and
products of the Maillard reaction such as heterocyclic amines are suspected or confirmed
carcinogens with high mutagenicity (Finot and Magnenat 1981; Finot 1990; Brands et al.
2000). Additionally, the Maillard reaction may cause decreases in protein quality via
decreases in digestibility (Erbersdobler et al. 1981), and in losses of the essential amino
acid lysine (Warren & Labuza 1977). This is all in addition to the polymerization
stimulated in the later stages of the Maillard reaction and production of certain Maillard
reaction products that can stimulate protein/peptide aggregation, potentially further
decreasing protein quality, digestibility, and sensory acceptability. Therefore, when
producing glycated protein ingredients it is of utmost importance to monitor and control
the progression of the Maillard reaction in foods to the initial stages by carefully selecting
the ideal substrates, reactants, and environmental conditions in order to meet the
requirements of a selected application.
31

1.9 Conclusions
Whey protein is a highly nutritious protein source with excellent functionality,
making it ideal for many food applications. Whey protein hydrolysates, in particular, have
been used in many products for their enhanced functionality and health properties
compared to their native counterparts. However, WPH have stability changes, mainly
attributed to increased rates of deteriorative chemical reactions, such as moisture-induced
protein/peptide aggregation and the Maillard reaction. These challenges are further
exacerbated if WPH is exposed to non-ideal storage conditions, including high temperature
and high humidity, potentially leading to loss of functionality and nutritional quality.
Maillard-induced glycation has been shown to reduce protein/peptide aggregation of whey
proteins in solution, and shows potential for reducing moisture-induced aggregation of
WPH powder during storage. No work has yet been done on the effects of Maillard-
induced glycation on reduction of moisture-induced aggregation of protein hydrolysate
powders during storage. Furthermore, research must be designed to simulate industry-
friendly approaches where possible to help approximate the use of these technologies in
the real world.
32
2. Production and Characterization of a Partially-Glycated Whey Protein
Hydrolysate
2.1 Overview
Partial Maillard-induced glycation of WPH was investigated over 12-120 h of
incubation at 60°C, 49% relative humidity (RH), and a 4:1 ratio of dextran to protein.
Glycation was initiated within 12 h of incubation, confirmed by the detection of Amadori
compound formation at 304 nm. Minimal browning was detected over the entire 120 h of
incubation, however, fluorescent compounds, indicators of progression to the intermediate
and final stages of the Maillard reaction, were detected as early as 12 h, and peaked at 120
h of incubation. Detection of Amadori compound formation and loss of free amino groups
indicated that the progression of the reaction increased with time as expected. PGWPH
produced upon incubation for 48 h was selected for investigation in further studies, due to
its moderate level of Amadori compound formation, with minimal progression to
intermediate and final stages of the Maillard reaction. Free dextran was removed from
glycated and non-glycated protein and peptides with moderate success using a 2-step
membrane filtration and hydrophobic interaction chromatography (HIC). The final
composition of glycated whey protein hydrolysate was approximately 1:1 protein to
carbohydrate. Purified glycated whey protein hydrolysate displayed minimal blockage of
the essential amino acid lysine (4.4%), and no significant decrease in digestibility
compared to WPH. Overall, this work showed that Maillard glycation can be induced and
controlled to low-levels in whey protein hydrolysate, producing a value-added product with
maintained nutritional quality, and potentially enhanced functionality and stability.
33

2.2 Introduction
Whey protein is a commonly consumed protein source, popular due to its high
nutritional quality and excellent functionality. Whey protein is highly digestible and
contains all essential amino acids in the relative proportions required for health (Walstra et
al. 2006). It is also an excellent source of the branched chain amino acids isoleucine,
leucine and lysine, valued by consumers for their contributions to optimal muscle synthesis
and repair (Page et al. 2004). Whey protein displays excellent functionality including
gelation (Singh & Havea 2003), emulsification (Kilara 1994), foaming (Mangino et al.
1987) and high solubility across a broad range of pH (Mulvihill & Ennis 2003). These
properties have led to the inclusion of whey protein into a diverse array of products from
baked goods to dairy products to consumer protein supplementation products, leading to
an estimated global market value of 9.8 billion U.S.D. (in 2013) (Affertsholt 2009).
The nutritional and functional quality of whey protein along with its high market
value make whey protein an ideal substrate for production of value-added ingredients such
as whey protein hydrolysate. Whey protein hydrolysates have several benefits over
traditional isolates including the presence of bioactive peptides (FitzGerald & Meisel
2003), increased digestibility (Sinha et al. 2007), and improved functionality (Mullally et
al. 1994; Foegeding et al. 2002; Creusot & Gruppen 2007), and thermal stability
(Foegeding et al. 2002). However, a challenge with the commercial use of hydrolysates in
food products is their increased reactivity in many deteriorative reactions including
moisture-induced protein/peptide aggregation leading to decreased shelf-life and sensory
quality (Netto et al. 1998; Zhou & Labuza 2007). Hydrolysates are not yet as widely used
as protein isolates, but their growth is greatly outpacing that of traditional protein isolates
(Affertsholt 2010) and so it is important that their stability challenges be addressed.
Maillard-induced glycation is a protein modification approach that has recently
been researched for its potential to create protein ingredients with enhanced functionality
and stability. The initial stage of the Maillard reaction is a condensation reaction between
protein/peptides and reducing sugars leading to the formation of glyco-conjugated proteins
that often display new beneficial functional attributes. However, progression of the
34
Maillard reaction beyond its initial stages can lead to the formation of carcinogenic
byproducts (Brands et al. 2000), decreased digestibility (Erbersdobler et al. 1981), and
losses of the essential amino acid lysine (Warren & Labuza 1977). Therefore, the reaction
is often induced and controlled to limit propagation to advanced stages (Wang & Ismail
2012). The reaction is controlled by regulating important parameters including time,
temperature, relative humidity (RH), carbohydrate type, and ratio of protein to
carbohydrate.
Maillard-induced glycation of whey protein has been shown to improve its
solubility (Chevalier 2001; Jimenez-Castano et al. 2006; Wang and Ismail 2012), gelation
properties (Li et al. 2005; Spotti et al. 2013), foaming ability (Chevalier et al. 2001; Mishra
et al. 2001; Hiller and Lorenzen 2010), emulsification capacity and stability (Chevalier et
al. 2001; Akhtar and Dickinson 2002), as well as thermal stability (Chevalier 2001;
Jimenez-Castano et al. 2006; Wang and Ismail 2012). It is, therefore, hypothesized that
limited and controlled Maillard-induced glycation of whey protein hydrolysate will
generate a product with maintained nutritional quality and enhanced functionality. Thus,
it is our objective to produce and characterize a partially-glycated whey protein hydrolysate
product using controlled and limited Maillard-induced glycation, assimilating industrial
procedures where possible.
35

2.3 Materials and Methods
2.3.1 Materials
Whey protein isolate (WPI) (BiPRO®, 92% protein) and whey protein hydrolysate
(WPH) (BioZate®, 90% protein) were generously provided by Davisco Foods
International, Inc. (Eden Prairie, MN, USA). Dextran, average molecular weight of 9-11
kDa (D9260) (dextrose equivalence: 2.3), was purchased from Sigma-Aldrich (St. Louis,
MO, USA). Bovine serum albumin liquid standard (23210), Pierce™ bicinchonic acid
protein assay kit (23227), and Pierce™ glycoprotein staining kit (24562) were purchased
from Thermo Scientific (Waltham, MA, USA). Tris-tricine Criterion™ precast peptide
gels (345-0068), tricine sample buffer (161-0739), Precision Plus Protein™ prestained
molecular weight ladder (161-D377), and concentrated tris-tricine-sodium dodecyl sulfate
running buffer (161-0744) were purchased from Bio-Rad (Hercules, CA, USA). Opaque,
black (Costar® 3916); opaque, white (Falcon® 35-3296); and UV-specific (Costar® 3635)
96-well polystyrene microplates were purchased from Corning, Inc. (Corning, NY, USA).
Pronase enzyme from Streptomyces griseus was purchased from Roche Diagnostics
(Indianapolis, IN, USA). Phenyl sepharose High Performance media (17-1082-01) and
phenyl sepharose CL-4B media (17-0810-01) were purchased from GE Healthcare (Little
Chalfont, UK). Amicon® 3kDa centrifugal filtration devices (UFC900324) and Pellicon®
3 membranes (P3C005C01) were purchased from EMD Millipore (Billerica, MA, USA).
Celltreat® 0.45um filters were purchased from Celltreat Scientific Products (Shirley, MA,
USA). Sep-Pak C18 filter cartridges were purchased from the Waters Corporation
(Milford, MA, USA). Furosine standards (SC494) were purchased from the PolyPeptide
Group (San Diego, CA, USA). Pepsin enzyme (EC 3.4.23.1, P6887) and trypsin enzyme
(EC 3.4.21.4, T8003) were purchased from Sigma-Aldrich. All other reagent grade
chemicals were purchased from Fisher Scientific (Waltham, MA, USA) or Sigma-Aldrich.
2.3.2 Controlled Maillard Glycation of Whey Protein Hydrolysate
WPH and dextran were mixed in a 1:4 (w/w) ratio, dissolved in 0.01 M phosphate
buffer, pH 7, and lyophilized. The dried mixture was then pulverized to a powder
36
consistency, and incubated in triplicate in sealed desiccators under conditions of 49%
relative humidity (RH) and 60°C. WPH that had previously been dissolved in 0.01 M
phosphate buffer, but without the addition of dextran served as a control. RH of the
desiccators was maintained using saturated sodium bromide slurries (49% RH at 60°C).
Samples were removed from the desiccators at predetermined time-points from 12-120
hours to examine the effects of time on the extent of glycatin, and all samples were then
stored at -20°C until analysis.
2.3.3 Estimation of Maillard Glycation Extent of WPH Incubated with Dextran
To estimate the extent of glycation that occurred over the course of the 12-120
hours of incubation, and to aid in selecting an optimum incubation time for production of
glycated WPH for further study, a variety of analyses including estimation of Amadori
compounds and browning, estimation of fluorescent Maillard compounds, estimation of
amino group loss, and visualization of protein/peptide molecular weight distribution
following sodium dodecyl sulfate polyacrylamide gel electrophoresis (SDS-PAGE) were
carried out.
2.3.3.1 Estimation of Amadori Compound Formation and Browning
Estimation of Amadori compound formation and browning of WPH incubated with
dextran over time was estimated following UV-Visible difference spectroscopy as outlined
by Jimenez-Castano et al. (2007), Zhu et al. (2008), Wang and Ismail (2012) , with
modifications. WPH incubated with dextran, WPH incubated without dextran, and non-
incubated controls were analyzed in triplicate. For each, a 0.2% protein solution (w/v) was
prepared in distilled, deionized water (DDW), and centrifuged at 13,800 x g for 10 min.
The absorbance of the supernatant was measured at 280 nm to correct for protein.
Absorbance at 304 nm was recorded to estimate the extent of Amadori compound
formation, and absorbance at 420 nm was recorded to estimate the extent of browning. The
change in Amadori compound formation and browning over time was determined by
comparing WPH incubated with or without dextran to the non-incubated controls.
37

2.3.3.2 Determination of Fluorescent Compounds
The change in fluorescent compound formation in WPH incubated with dextran
over time was monitored as described by Rao et al. (2012), with modifications. WPH
incubated with dextran, WPH incubated without dextran, and non-incubated controls
were analyzed in triplicate. For each, a 1.0 % protein solution (w/v) was prepared in
DDW. A 0.178 mL aliquot of pronase solution (20 U/mL pronase in 50 mM tris-HCl, pH
7.2), made fresh daily, was added to each sample, which was then incubated on a
carousel mixer for 50 min at room temperature to ensure complete digestion. After
digestion, the samples were centrifuged at 15,682 x g for 15 min, and the supernatant was
removed and diluted 1:1 (v/v) with phosphate buffered saline solution (20 mM phosphate
buffer, 15 mM NaCl, pH 7.0). A 200 μL aliquot of each sample was placed into the wells
of a black, opaque microplate, and the fluorescence intensity (FI) was measured at an
excitation of 360 nm (bandwidth 40 nm) and emission of 460 nm (bandwidth 30 nm).
Readings were corrected for protein content using the Thermo Scientific Pierce™
bicinchonic acid (BCA) assay kit, following the manufacturer’s instructions. The
fluorescence intensity (FI) of samples was determined by first correcting for the protein
content of the sample. Then the FI values of all incubated samples were adjusted by
subtracting the FI values of their respective non-incubated controls, which served as
blanks. The FI values were then corrected to the FI of 5 ppm quinine sulfate solution
which was prepared diluting quinine sulfate sulfuric acid solution (100 μg/mL quinine
sulfate in 50 mM sulfuric acid), prepared fresh daily, to 5 ppm with phosphate buffered
saline solution, as in Equation 1.
Equation 1:
𝐹𝐹𝐹𝐹𝐹𝐹𝐹𝐹𝐹𝐹𝐹𝐹𝐹𝐹𝐹𝐹𝐹𝐹𝐹𝐹𝐹𝐹𝐹𝐹 𝐼𝐼𝐹𝐹𝐼𝐼𝐹𝐹𝐹𝐹𝐹𝐹𝐼𝐼𝐼𝐼𝐼𝐼 (𝐹𝐹𝐼𝐼) 𝑔𝑔 𝑝𝑝𝐹𝐹𝐹𝐹𝐼𝐼𝐹𝐹𝐼𝐼𝐹𝐹⁄ = �
𝐸𝐸𝑚𝑚𝐼𝐼𝑆𝑆𝑆𝑆𝑆𝑆𝑆𝑆𝑆𝑆𝑆𝑆𝑔𝑔 𝑃𝑃𝐹𝐹𝐹𝐹𝐼𝐼𝐹𝐹𝐼𝐼𝐹𝐹 −
𝐸𝐸𝑚𝑚𝐼𝐼𝐶𝐶𝐶𝐶𝐶𝐶𝐶𝐶𝐶𝐶𝐶𝐶𝑆𝑆𝑔𝑔 𝑃𝑃𝐹𝐹𝐹𝐹𝐼𝐼𝐹𝐹𝐼𝐼𝐹𝐹
𝐸𝐸𝑚𝑚𝐼𝐼5 𝑆𝑆𝑆𝑆𝑆𝑆 𝑄𝑄𝑄𝑄𝑄𝑄𝐶𝐶𝑄𝑄𝐶𝐶𝑆𝑆 𝑆𝑆𝑄𝑄𝑆𝑆𝑆𝑆𝑆𝑆𝐶𝐶𝑆𝑆 �
Where: Emi = emission reading at 460 nm (bandwidth 30 nm)
38
2.3.3.3 Loss of Free Amino Groups
Percent loss in free amino group content of WPH incubated with dextran over time
was monitored using the o-phthalaldehyde (OPA) method as outlined by Goodno et al.
(1981) and Rao et al. (2012), with modifications. WPH incubated with dextran, WPH
incubated without dextran, and non-incubated controls were analyzed in triplicate. For
each, a 0.2% protein solution (w/v) was prepared in 1% sodium dodecyl sulfate solution
(SDS) (w/v), and centrifuged at 15,682 x g for 10 min. The supernatant was then removed
for analysis. Standards of L-lysine ranging from 0-200 μg/mL were prepared in 1% SDS
(w/v) for generation of a standard curve. OPA reagent was prepared by dissolving 3.810
g of disodium tetraborate decahydrate and 0.5 g sodium dodecyl sulfate in DDW. Two mL
of ethanol was used to dissolve 80 mg o-phthalaldehyde, which was then added to the
reagent solution along with 200 μL β-mercaptoethanol, and the final volume was brought
to 100 mL using DDW. The OPA reagent was shielded from light and used within 2 hours
of preparation. A 50 μL aliquot of each standard and sample was loaded into polystyrene
microplates specific for UV-readings followed by 200 μL of OPA reagent. Plates were
incubated at room temperature for 2 min before reading the absorbance at 340 nm with a
microplate reader (Biotek, Winooski, VT, USA). Data were corrected for protein content
using the BCA assay kit, following the manufacturer’s instructions. The concentration of
free amino groups in each sample was adjusted for the protein content to obtain the % free
amino groups in each sample. The % loss in free amino group content over time was
determined using Equation 2.
Equation 2: % 𝐿𝐿𝐹𝐹𝐹𝐹𝐹𝐹 𝐼𝐼𝐹𝐹 𝐹𝐹𝐹𝐹𝐹𝐹𝐹𝐹 𝐴𝐴𝑚𝑚𝐼𝐼𝐹𝐹𝐹𝐹 𝐺𝐺𝐹𝐹𝐹𝐹𝐹𝐹𝑝𝑝 𝐶𝐶𝐹𝐹𝐹𝐹𝐼𝐼𝐹𝐹𝐹𝐹𝐼𝐼
=% 𝐹𝐹𝐹𝐹𝐹𝐹𝐹𝐹 𝐴𝐴𝑚𝑚𝐼𝐼𝐹𝐹𝐹𝐹 𝐺𝐺𝐹𝐹𝐹𝐹𝐹𝐹𝑝𝑝𝐹𝐹 𝐹𝐹𝑜𝑜 𝐶𝐶𝐹𝐹𝐹𝐹𝐼𝐼𝐹𝐹𝐹𝐹𝐹𝐹 − % 𝐹𝐹𝐹𝐹𝐹𝐹𝐹𝐹 𝐴𝐴𝑚𝑚𝐼𝐼𝐹𝐹𝐹𝐹 𝐺𝐺𝐹𝐹𝐹𝐹𝐹𝐹𝑝𝑝𝐹𝐹 𝐹𝐹𝑜𝑜 𝑆𝑆𝑆𝑆𝑚𝑚𝑝𝑝𝐹𝐹𝐹𝐹
% 𝐹𝐹𝐹𝐹𝐹𝐹𝐹𝐹 𝐴𝐴𝑚𝑚𝐼𝐼𝐹𝐹𝐹𝐹 𝐺𝐺𝐹𝐹𝐹𝐹𝐹𝐹𝑝𝑝𝐹𝐹 𝐹𝐹𝑜𝑜 𝐶𝐶𝐹𝐹𝐹𝐹𝐼𝐼𝐹𝐹𝐹𝐹𝐹𝐹 × 100
2.3.3.4 Sodium Dodecyl Sulfate-Polyacrylamide Gel Electrophoresis (SDS-PAGE)
The change in molecular size of proteins/peptides in WPH incubated with dextran
over time was monitored with SDS-PAGE using tris-tricine peptide gels as outlined by 39
Laemmli (1970), Schägger and von Jagow (1987), with modifications. WPH incubated
with dextran and non-incubated controls were analyzed in triplicate. For each, a 0.02%
protein solution (w/v) was prepared in DDW before being diluted 1:1 (v/v) with tricine
sample buffer containing SDS and 2% β-mercaptoethanol. All samples were then heated
in boiling water for 5 min and then allowed to cool to room temperature. A 10 μL aliquot
of each sample was loaded onto a precast 10-20% gradient tris-tricine peptide gel, along
with a 10 μL aliquot of a prestained molecular weight ladder (Bio-rad, Hercules, CA,
USA). All gels were electrophoresed with tris-tricine-SDS buffer at 4°C and 125 V for 3-
4 hours. Gels were then stained using either Coomassie blue stain or the Pierce™
Glycoprotein Staining kit.
2.3.3.4.1 Coomassie Blue Staining of Polyacrylamide Gels
Coomassie blue staining was carried out by first immersing gels in Coomassie blue
stain solution (45% methanol (v/v), 10% glacial acetic acid (v/v), and 0.3% Brillant Blue
R250 (w/v)) for 1 hour while shaking. Destaining of the gel was then carried out by
repeated rinsing of the gel with a destaining solution (10% glacial acetic acid (v/v), 5%
methanol (v/v)). Visualization of the gel was done using a Canon T3i camera with the gel
positioned over a fluorescent back-lit platform for optimal resolution.
2.3.3.4.2 Glycoprotein Staining of Polyacrylamide Gels
Glycoprotein staining was carried out on a second set of gels with a Pierce™
Glycoprotein Staining Kit. Staining and destaining was performed according to the
manufacturer’s instructions. Visualization of gels was done as outlined in Section
2.3.3.4.1.
2.3.4 Separation of Free Dextran from Partially Glycated Whey Protein Hydrolysate
To prevent further Maillard glycation during storage and testing of the WPH
incubated with dextran, removal of dextran that did not react to form a glycosidic bond
with a protein/peptide over the course of the incubation period, hereafter referred to as ‘free
dextran’, was desired. Separation of the free dextran from the glycated and non-glycated
40

protein/peptides, hereafter referred as ‘partially glycated whey protein hydrolysate’
(PGWPH), using hydrophobic interaction chromatography (HIC) as outlined by Wang and
Ismail (2012) was explored. Modifications including the use of centrifugal filtration
devices and chromatographic scale-up were undertaken. All further analysis was carried
out using WPH incubated with dextran for 48 hours. The selection of this sample was
based on the results of estimated glycation and blockage of free amino groups, as will be
discussed in the results section.
2.3.4.1 Preliminary Chromatographic Trials
Separation of the free dextran from the PGWPH was investigated using
hydrophobic interaction chromatography (HIC). Initial chromatographic conditions were
first tested on a non-incubated 4:1 mixture of dextran and WPH to approximate PGWPH.
A Pharmacia Biotech ÄKTA fast protein liquid chromatography pump, equipped with a
Shimadzu Ultra-Fast Liquid Chromatograph (UFLC) High Performance Liquid
Chromatography (HPLC) CBM-20A communications bus module, SPD-20AV UV-vis
detector and FRC-10A fraction collector was used. A HIC column, 20 cm x 16 mm, was
packed with phenyl sepharose high performance media, and equilibrated with 1M
ammonium sulfate, pH 7. A non-incubated mixture of dextran and WPH (4:1) was
dissolved in DDW (4% protein, w/v), and a 2 mL aliquot of the solution was injected onto
the column at a flow rate of 3 mL/min. Dextran was eluted from the column using 60 mL
of 1M ammonium sulfate (0-20 min), followed by a 60 mL DDW rinse (20-40 min) to elute
protein and peptides. Elution of the protein/peptides in WPH was monitored at 220 nm,
using EZStart™ software (Shimadzu, Kyoto, Japan). Elution volumes were
experimentally adjusted to achieve the best possible separation of dextran and recovery of
protein/peptides. Dextran content of the collected fractions (28 total 3mL fractions,
collected each min) were determined experimentally using the AOAC phenol-sulfuric acid
method (Official Method 988.12, AOAC International, 1988), with modifications. Briefly,
fractions were diluted with DDW to reach 50 ug/mL carbohydrate. A 1 mL aliquot of
diluted sample was taken, and 25 μL of 80% (v/v) phenol and 2.5 mL concentrated sulfuric
acid were added. All samples were vortexed for 5 s and allowed to stand for 10 min to
41
cool to room temperature. Glucose standards ranging from 0-100 μg/mL glucose were
prepared in a similar fashion to construct a standard curve. The absorbance of each
standard and diluted fraction was measured at 490 nm using a spectrophotometer.
2.3.4.2 Improvement of Free Dextran Separation Protocol with the Use of Centrifugal Filtration Devices
To improve the retention of low molecular weight peptides, the addition of a
centrifugal filtration step to the separation protocol was investigated. Two test runs were
conducted using WPH incubated with dextran and non-incubated WPH and dextran mixed
in a 1:4 ratio. Both WPH preparations were dissolved in DDW (4.0% protein, w/v), and
7.5 mL aliquots were loaded into Amicon® 3kDa centrifugal filtration devices, which had
been pre-rinsed with DDW. Solutions were centrifuged for 120 min at 5,000 x g, after
which 2 mL DDW was added as a final rinse, and the solutions were centrifuged at 5,000
x g for a final 60 min. The filtration retentates and permeates were bulked and lyophilized
separately. The dried retentates and permeates were solubilized in 2mL DDW, and 1 mL
of that solution was separated using HIC and analyzed for carbohydrate content as outlined
in Section 2.3.4.1. An additional test run was conducted using WPH incubated with
dextran, which was prepared at a reduced 2.0% protein concentration (w/v), and 7.5 mL
aliquots were loaded into centrifugal filtration devices before centrifugation and separation,
as above.
To reduce the quantity of free dextran passing through the centrifugal filtration
membranes and into the permeate, a final test was run on WPH incubated with dextran to
investigate the efficacy of a second filtration. Dried permeate from WPH incubated with
dextran filtered as above was dissolved in DDW (4.0% protein, w/v), and a 12 mL aliquot
was loaded into Amicon® 3kDa centrifugal filtration devices, which had been pre-rinsed
with DDW. Solutions were centrifuged for up to 60 min at 5,000 x g, and aliquots of the
permeate was removed for analysis at 10 minute intervals. The carbohydrate content of
the permeate fractions was analyzed as outlined in Section 2.3.4.1. The protein content of
the permeate fractions was analyzed by Dumas using the AOAC Official Method 968.06
42

Dumas nitrogen combustion method (AOAC International, 1998) and a Nitrogen Analyzer
(LECO® TruSpecNTM, St. Joseph, MI, USA) with a conversion factor of 6.38.
2.3.4.3 Improvement of Free Dextran Separation Protocol with Chromatographic Scale-up
To improve the efficiency of the free dextran separation protocol, the
chromatographic conditions were scaled-up to accommodate a higher throughput. The
same chromatography system described in Section 2.3.4.1 was used with exception of the
column. A HIC column, 11 cm x 50 mm, was packed with phenyl sepharose CL-4B media,
and equilibrated with 1M ammonium sulfate, pH 7. Lyophilized retentate, produced as
outlined in Section 2.3.4.2, was dissolved in 1M ammonium sulfate (3% protein, w/v), and
a 50 mL aliquot of the solution was injected onto the column at a flow rate of 10 mL/min.
Free dextran was eluted from the column using 0.5 L of 1M ammonium sulfate. PGWPH
was eluted with 1 L DDW. Elution of the protein/peptides in retentate PGWPH was
monitored at 220 nm, as in Section 2.3.4.1. Elution volumes were experimentally adjusted
to achieve best possible separation of free dextran and recovery of retentate PGWPH.
Dextran content of the collected fractions were determined experimentally using the
phenol-sulfuric acid method, as outlined in Section 2.3.4.1.
Eluted retentate PGWPH was collected and then desalted using a 10 kDa molecular
weight cut-off Pellicon 3 membrane with 0.11 m2 surface area (EMD Millipore, Billerica,
MA, USA). The eluted retentate PGWPH was diafitered for 9 hours for 10 diavolumes
until reaching a final conductivity of 165 microsiemens. The diafiltration was performed
with no back pressure on the system. The lyophilized permeate, as produced in Section
2.3.4.2, was then dissolved in the desalted PGWPH solution, and the final PGWPH solution
was lyophilized. The lyophilized PGWPH was then pulverized to a powder consistency,
and stored at -20°C until needed for further testing.
2.3.5 Characterization of Partially Glycated Whey Protein Hydrolysate
After purification of PGWPH from excess free dextran, moisture, protein, and total
carbohydrate contents were determined. Further characterization including % lysine
43

blockage and digestibility were carried out to assess changes in nutritional quality due to
glycation or the purification process.
2.3.5.1 Analysis of Protein Content
Protein content of PGWPH was determined using a Nitrogen Analyzer (LECO®
TruSpecNTM, St. Joseph, MI, USA) following the Dumas nitrogen combustion method
(Method 968.06, AOAC International, 1998). For all whey protein samples, a nitrogen
conversion factor of 6.38 was used.
2.3.5.2 Analysis of Carbohydrate Content
Carbohydrate content of PGWPH was determined using the phenol-sulfuric acid
method, as outlined in Section 2.3.4.1, with one exception. A 0.01% protein solution (w/v)
of PGWPH was prepared in DDW, in duplicate, and then was analyzed.
2.3.5.3 Analysis of Moisture Content
Moisture content of PGWPH was determined following the Karl Fischer method
using an Aquatest CMA Karl Fischer coulometric titrator (Photovolt Instruments,
Minneapolis, MN, USA) (Fischer 1935; MacLeod 1991). A 50 mg sample of PGWPH
was added to 20g methanol, in duplicate, and the samples were shaken at 100 rpm for 18
hours at room temperature in tightly sealed vials; methanol blanks were prepared in the
same way, in duplicate, but were without sample. After 18 hours of extraction, 1 mL of
the methanol extract of each sample or blank was removed with a syringe. A silicon
stopper was used to seal the needle of the syringe to prevent evaporation of the methanol
during weighing. The extract was injected into the Karl Fischer coulometric titrator to
obtain ‘R’ (μg of water) and then the emptied syringe was weighed to verify the mass of
the extract injected. Moisture content was then calculated with Equations 3-5.
Equation 3
Moisture Content (mg) = �R
1000∗
Methanol mass (g)Injection mass (g)
� − Methanol mass (g) ∗ Total H2Oblank
Equation 4
44
%H2O𝐰𝐰𝐰𝐰 =Moisture Content (mg)10 ∗ Sample mass (g)
Equation 5
%H2O𝐝𝐝𝐰𝐰 =%H2O𝐰𝐰𝐰𝐰 ∗ 100100− %H2O𝐰𝐰𝐰𝐰
Where: R = water (μg) Methanol mass = mass of methanol sample was extracted with Injection mass = mass of sample methanol extract injected db = dry basis wb = wet basis
2.3.5.4 Determination of Percent Lysine Blockage
Percent lysine blockage in PGWPH was determined by measuring 2-furoyl-methyl-
Lys, furosine, which is formed upon hydrolysis of the Amadori compound obtained
specifically from the interaction of lysine with a reducing carbohydrate during the Maillard
reaction (Resmini et al. 1990). Furosine was quantified using the methods of Krause et al.
(2003) and Jiménez-Castaño et al. (2007), with modifications. PGWPH, and non-
incubated WPH, were analyzed in triplicate. For each, 3.75 mL of a 0.5% protein solution
(w/v) was prepared in 7.95 N HCl in a vial, and the head-space was flushed with nitrogen
to render it inert. Samples were heated at 110°C for 24 hours. After allowing samples to
reach room temperature, the supernatant of each sample was removed and centrifuged at
10,000 x g for 1 min to settle any debris from the acid digestion. Sample supernatants were
then filtered through Celltreat® 0.45um filters (Celltreat Scientific Products, Shirley, MA,
USA). Sep-Pak C18 cartridges (Waters Corporation, Milford, MA, USA) were then pre-
wet and activated first with 2 mL methanol followed by 2mL DDW before applying 0.5
mL of the samples at a rate of 0.5 mL/min. The furosine in the sample was then eluted by
passing 2 mL of 3N HCl through the cartridge at a rate of 1 mL/min. The eluted furosine
was neutralized with the addition of 0.33 mL 18M NaOH.
The furosine content of all samples was then quantified using HPLC based on the
method outlined by Jiménez-Castaño et al. (2007). An HPLC system (Shimadzu Corp.,
Kyoto, Japan) equipped with a SIL-10AF auto injector, CTO-20A oven, and SPD-M20A
45

photo diode array detector was utilized. A YMC pack ODS AM-12S05-2546WT RP-18
column (250 mm x 4.6 mm, 5 μm) and a guard column (20 mm x 4 mm) of the same
material were used. The elution program was isocratic maintaining 15% acetonitrile
containing 5mM sodium heptanesulphonate and 0.2% (v/v) formic acid throughout the run.
A 20 μL aliquot of the neutralized furosine-eluted sample was injected onto the column at
a flow rate of 1.2 mL/min. The column temperature was maintained at 35°C throughout
the run, and UV detection was measured at 280nm. Furosine was quantified based upon
its peak area at the retention time of approximately 10.5 min. Calibration and standard
curve generation was carried out using furosine standards of 0.5-20 ppm.
2.3.5.5 Determination of In-vitro Digestibility
Digestibility of PGWPH was evaluated using sequential in-vitro digestion with the
enzymes pepsin and trypsin as outlined by Tang et al. (2006) and Chevalier et al. (2001),
with modifications. PGWPH and non-incubated WPH, were analyzed in duplicate. For
each, a 1% protein solution (w/v) was prepared in 0.1 N HCl. Samples were incubated in
a 37°C water bath for 10 min followed by the addition of pepsin (50 μL of 3 mg/mL).
Samples were further incubated in the 37°C water bath for 2 hours before the pH was
adjusted to 7.0 using 1.0 N NaOH to terminate pepsin activity, at which point trypsin was
added (50 μL of 8 mg/mL). The pH of all samples was monitored and adjusted during
incubation to maintain the optimum pH of 7.0 for the trypsin enzyme. After 2 hours of
incubation with trypsin, the samples were filtered through 0.45 μm filters and immediately
frozen at -20°C until further analysis.
The peptide profiles of the digested samples and non-digested controls were
determined using HPLC analysis as outlined by Chevalier et al. (2001). The same HPLC
as described in Section 2.3.5.4 was used. A YMC pack ODS AM-12S05-2546WT RP-18
column (250 mm x 4.6 mm, 5 μm) and a guard column (20 mm x 4 mm) of the same
material were used. The elution program was a binary gradient of HPLC-grade water
(solvent A) and acetonitrile (solvent B), both containing 0.11% (v/v) trifluoroacetic acid.
After injecting a 20 μL aliquot of the digested samples or controls onto the column, solvent
B was linearly increased from 16% to 40% in 20 min, kept constant for 10 min, increased
46

to 80% for 10 min, and then decreased to 16% in 10 min. Throughout the run, the column
temperature was maintained at 35°C and the flow rate was kept constant at 1.2 mL/min.
The eluted peptides were monitored at 214 nm. Percent digestibility was determined based
on the differences in select peak areas obtained at 214 nm between digested samples and
their complementary non-digested controls (Equation 6).
Equation 6:
Digestibility (%) =(𝑃𝑃𝑆𝑆𝑆𝑆𝑃𝑃 𝑆𝑆𝐶𝐶𝑆𝑆𝑆𝑆𝑛𝑛𝑛𝑛𝑛𝑛−𝑑𝑑𝑑𝑑𝑑𝑑𝑑𝑑𝑑𝑑𝑑𝑑𝑑𝑑𝑑𝑑 𝑐𝑐𝑛𝑛𝑛𝑛𝑑𝑑𝑐𝑐𝑛𝑛𝑐𝑐−𝑃𝑃𝑆𝑆𝑆𝑆𝑃𝑃 𝑆𝑆𝐶𝐶𝑆𝑆𝑆𝑆 𝑑𝑑𝑑𝑑𝑑𝑑𝑑𝑑𝑑𝑑𝑑𝑑𝑑𝑑𝑑𝑑 𝑑𝑑𝑠𝑠𝑠𝑠𝑠𝑠𝑐𝑐𝑑𝑑)
𝑃𝑃𝑆𝑆𝑆𝑆𝑃𝑃 𝑆𝑆𝐶𝐶𝑆𝑆𝑆𝑆𝑛𝑛𝑛𝑛𝑛𝑛−𝑑𝑑𝑑𝑑𝑑𝑑𝑑𝑑𝑑𝑑𝑑𝑑𝑑𝑑𝑑𝑑 𝑐𝑐𝑛𝑛𝑛𝑛𝑑𝑑𝑐𝑐𝑛𝑛𝑐𝑐 *100%
2.3.6 Statistical Analysis
Analysis of variance (ANOVA) was carried out using IBM SPSS Statistics
software version 22.0 for Windows (SPSS, Inc., Chicago, IL, USA). Significant differences
among the respective means were determined when a factor effect or an interaction was
found to be significant (P ≤ 0.05) using the Tukey-Kramer multiple means comparison test.
ANOVA tables for Chapter 2 can be found in Appendix F (Tables 7-12).
47
2.4 Results and Discussion
2.4.1 Estimation of Maillard Glycation Extent of WPH Incubated with Dextran
The Amadori compound is the first stable intermediate of the Maillard reaction, and
so its presence is frequently used to estimate the propagation of the reaction (Zhu et al.
2008; Wang & Ismail 2012). Estimation of Amadori compound formation using
absorbance at 304 nm for WPH incubated with and without dextran suggested that
glycation did occur upon incubation at 49% RH and 60°C (Figure 1). The reaction
appeared to have been initiated within the first 12 h of incubation, as indicated by a
significant difference in 304 nm absorbance between non-incubated (0h) and 12 h
incubated WPH with dextran. Absorbance at 304 nm continued to significantly increase
with time indicating continued formation of the Amadori compound. The plateau in 304
nm absorbance seen between 108-120 h of incubation may suggest an equilibrium of new
Amadori compound formation, and conversion of the Amadori compound to intermediate
and final stage Maillard reaction products (MRPs). The 304 nm absorbance of WPH
incubated with and without dextran for 72 h was higher than that observed for 84 or 96 h
of incubation. As samples of WPH with and without dextran for each time point were
stored in separate desiccators for ease of removal during the study, it is hypothesized that
this deviation is due to the isolated environment of the desiccator used for the 72 h
incubated samples, which may have experienced a slightly higher RH leading to increased
Amadori compound formation during incubation. Absorbance at 304 nm was much higher
for WPH samples incubated with dextran than without, as expected; however, as there was
a significant increase in 304 nm absorbance of WPH incubated without dextran over time,
it was concluded that some Maillard reaction occurred even without dextran. This is likely
attributed to Maillard reaction of WPH with the trace amount of lactose present in WPH
(up to 1%, by manufacturer’s specifications). These results were similar to those observed
by other researchers including Wang and Ismail (2012) and Zhu et al. (2008). Wang and
Ismail (2012) observed similar 304 nm absorbances after incubation of WPI with 10 kDa
dextran at 60°C and 49% RH, but at a slower rate than was observed in this study, which
could be due to the increased number of accessible amino groups in WPH compared to
48
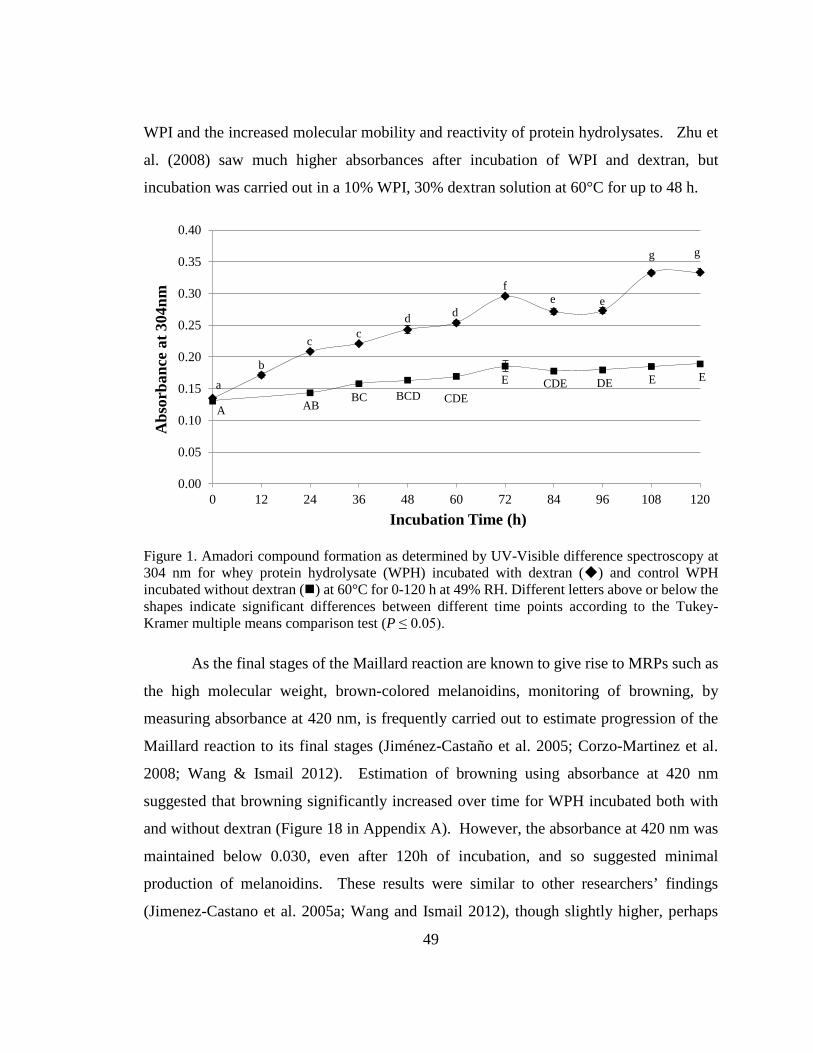
WPI and the increased molecular mobility and reactivity of protein hydrolysates. Zhu et
al. (2008) saw much higher absorbances after incubation of WPI and dextran, but
incubation was carried out in a 10% WPI, 30% dextran solution at 60°C for up to 48 h.
Figure 1. Amadori compound formation as determined by UV-Visible difference spectroscopy at 304 nm for whey protein hydrolysate (WPH) incubated with dextran () and control WPH incubated without dextran () at 60°C for 0-120 h at 49% RH. Different letters above or below the shapes indicate significant differences between different time points according to the Tukey-Kramer multiple means comparison test (P ≤ 0.05).
As the final stages of the Maillard reaction are known to give rise to MRPs such as
the high molecular weight, brown-colored melanoidins, monitoring of browning, by
measuring absorbance at 420 nm, is frequently carried out to estimate progression of the
Maillard reaction to its final stages (Jiménez-Castaño et al. 2005; Corzo-Martinez et al.
2008; Wang & Ismail 2012). Estimation of browning using absorbance at 420 nm
suggested that browning significantly increased over time for WPH incubated both with
and without dextran (Figure 18 in Appendix A). However, the absorbance at 420 nm was
maintained below 0.030, even after 120h of incubation, and so suggested minimal
production of melanoidins. These results were similar to other researchers’ findings
(Jimenez-Castano et al. 2005a; Wang and Ismail 2012), though slightly higher, perhaps
0.00
0.05
0.10
0.15
0.20
0.25
0.30
0.35
0.40
0 12 24 36 48 60 72 84 96 108 120
Abs
orba
nce
at 3
04nm
Incubation Time (h)
a
b
c cd d
fe e
gg
A ABBC BCD CDE
E CDE DE EE
49
again due to the increased chemical reactivity of WPH in the Maillard reaction. However,
browning was much lower than observed by Zhu et al. (2008) (in solution glycation of WPI
and dextran after >24 h of incubation) and Corzo-Martinez et al. (2008) (incubation of β-
lactoglobulin with galactose at 50°C and 44% RH after >24 h of incubation).
Formation of fluorescent compounds occurs during the intermediate and final
stages of the Maillard reaction (Adhikari 1973; Baisier & Labuza 1992), so these markers
may also be used to quantify progression of the Maillard reaction beyond the initial stage.
This is of particular value when the reaction has not proceeded to the stage of melanoidin
production and an increase in browning is not visible (Matiacevich & Pilarbuera 2006).
The % fluorescence intensity of WPH incubated with dextran increased over time,
indicating an increase in the formation of fluorescent compounds (Figure 2). It also appears
that low-levels of Maillard-glycation occurred in WPH incubated without dextran, as
fluorescence intensity increased with time, which is in accordance with the observations of
UV-Visible difference spectroscopy. The % fluorescence intensities of the 108-120 h
incubated samples support the hypothesis that an increased progression to intermediate and
final stage MRPs occurred during that time, as a steep and significant increase in
fluorescent compound formation is visible. Again, the values observed of WPH incubated
with and without dextran for 72 h are higher than that of the neighboring time-points,
suggesting that a greater amount of Maillard reaction was stimulated in these samples. It
is important to note that fluorescent compounds may arise from other chemical reactions
apart from the Maillard reaction including lipid oxidation (Castilho et al. 1994), however,
the WPH used in this study contained less than 0.5% lipid (by manufacturer’s specification)
and so fluorescent compound formation is believed to be due to Maillard-glycation alone.
50

Figure 2. Fluorescent compound formation as determined by fluorescent intensity quantification (excitation: 360 nm, emission: 460 nm) for whey protein hydrolysate (WPH) incubated with dextran () and control WPH incubated without dextran () at 60°C for 0-120 h at 49% RH. Error bars represent standard errors (n=3). Different letters above or below the shapes indicate significant differences between different time points according to the Tukey-Kramer multiple means comparison test (P ≤ 0.05).
The amino group is one of two primary reactants of the Maillard reaction, and so
its disappearance can be used to indicate the progress of the reaction (Ames 1992; Wang
& Ismail 2012). Free amino group content as determined by the OPA method of WPH
incubated with dextran decreased over time, as indicated by a significant increase in % loss
of free amino groups (Figure 3). Extent of free amino group loss was moderate, ranging
from 15.9-30.8% after 12-120 h of incubation. The % free amino groups in WPH before
incubation was 11.05%, which was reduced to 8.65% after 48h of incubation, and to 7.65%
after 120h of incubation with dextran at 60°C and 49% RH. A significant increase in %
loss of free amino groups (15.9%) was initiated within the first 12h of incubation. This
was in accordance with the observations of UV-Visible difference spectroscopy which also
showed an initiation of Maillard-glycation within the first 12h of incubation, and a
subsequent increase in Maillard-glycation over time. The % loss of free amino groups
observed in this study was greater than that observed by other researchers, namely Wang
0
100
200
300
400
500
600
0 12 24 36 48 60 72 84 96 108 120
% F
luor
esce
nt In
ensi
ty (p
er g
Pro
tein
)
Incubation Time (h)
a
abbc bc
c
ef
dde
f
g
A
B B
BB
CDCD CD
C D
51
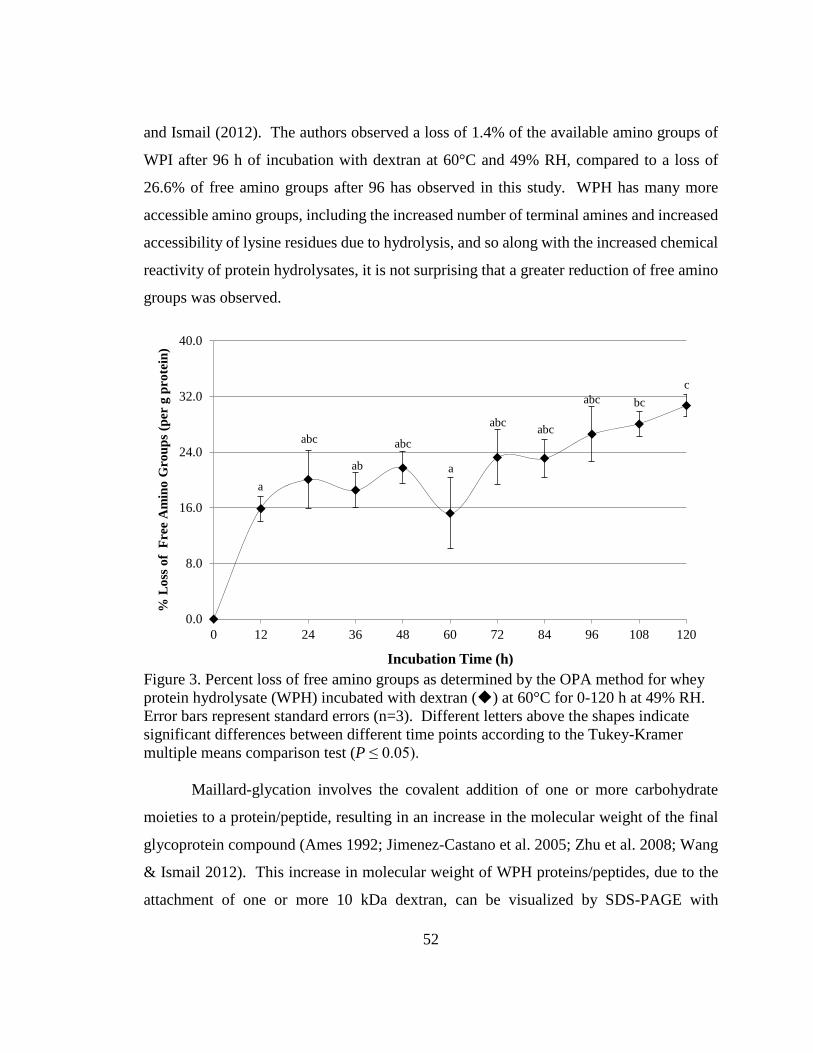
and Ismail (2012). The authors observed a loss of 1.4% of the available amino groups of
WPI after 96 h of incubation with dextran at 60°C and 49% RH, compared to a loss of
26.6% of free amino groups after 96 has observed in this study. WPH has many more
accessible amino groups, including the increased number of terminal amines and increased
accessibility of lysine residues due to hydrolysis, and so along with the increased chemical
reactivity of protein hydrolysates, it is not surprising that a greater reduction of free amino
groups was observed.
Figure 3. Percent loss of free amino groups as determined by the OPA method for whey protein hydrolysate (WPH) incubated with dextran () at 60°C for 0-120 h at 49% RH. Error bars represent standard errors (n=3). Different letters above the shapes indicate significant differences between different time points according to the Tukey-Kramer multiple means comparison test (P ≤ 0.05).
Maillard-glycation involves the covalent addition of one or more carbohydrate
moieties to a protein/peptide, resulting in an increase in the molecular weight of the final
glycoprotein compound (Ames 1992; Jimenez-Castano et al. 2005; Zhu et al. 2008; Wang
& Ismail 2012). This increase in molecular weight of WPH proteins/peptides, due to the
attachment of one or more 10 kDa dextran, can be visualized by SDS-PAGE with
0.0
8.0
16.0
24.0
32.0
40.0
0 12 24 36 48 60 72 84 96 108 120
% L
oss o
f Fr
ee A
min
o G
roup
s (p
er g
pro
tein
)
Incubation Time (h)
a
abc
ab
abc
a
abc abc
abc bcc
52
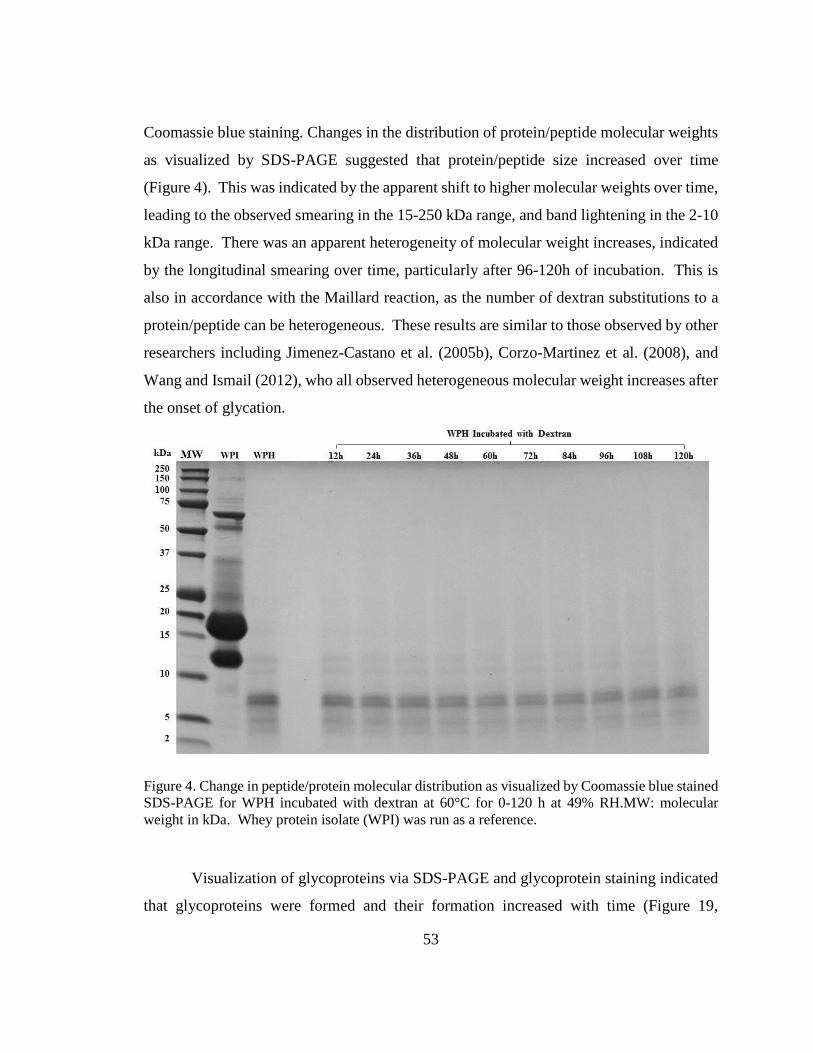
Coomassie blue staining. Changes in the distribution of protein/peptide molecular weights
as visualized by SDS-PAGE suggested that protein/peptide size increased over time
(Figure 4). This was indicated by the apparent shift to higher molecular weights over time,
leading to the observed smearing in the 15-250 kDa range, and band lightening in the 2-10
kDa range. There was an apparent heterogeneity of molecular weight increases, indicated
by the longitudinal smearing over time, particularly after 96-120h of incubation. This is
also in accordance with the Maillard reaction, as the number of.dextran substitutions to a
protein/peptide can be heterogeneous. These results are similar to those observed by other
researchers including Jimenez-Castano et al. (2005b), Corzo-Martinez et al. (2008), and
Wang and Ismail (2012), who all observed heterogeneous molecular weight increases after
the onset of glycation.
Figure 4. Change in peptide/protein molecular distribution as visualized by Coomassie blue stained SDS-PAGE for WPH incubated with dextran at 60°C for 0-120 h at 49% RH.MW: molecular weight in kDa. Whey protein isolate (WPI) was run as a reference.
Visualization of glycoproteins via SDS-PAGE and glycoprotein staining indicated
that glycoproteins were formed and their formation increased with time (Figure 19,
53

Appendix B). This is indicated by the presence of light smearing in the 50-250 kDa range,
absent in the non-incubated WPH lane, which became more apparent over time. The
faintness of the smearing suggested that Maillard-glycation was maintained at low-levels
throughout the incubation time. This is in accordance with observations made by other
researchers, who saw longitudinal smearing after 96h of glycation that was not present in
the non-incubated control (Wang & Ismail 2012).
The incubation time selected for further study was 48 h of incubation, as this time
point provided moderate Amadori compound formation, with minimal progression to
intermediate and final stage MRPs as evidenced by the minimal fluorescent compound
formation and browning. Additionally, incubation at this time length resulted in a moderate
% loss of free amino groups (21.7%) compared to higher losses (~31%) at longer time
periods.
2.4.2 Separation of Free Dextran from Partially Glycated Whey Protein Hydrolysate
The purpose of removing free dextran from the incubated WPH and dextran
mixture was three-fold. For one, the presence of free dextran in a final ingredient would
allow for the possibility of further initiation of the Maillard reaction beyond desired levels
during distribution, storage, and processing, potentially altering the functionality and
nutritional quality of the product. Additionally, excess free dextran could contribute to
turbidity in fluid applications. Lastly, free dextran could result in undesired textural
changes, such as increased viscosity, in some applications.
Preliminary investigation into the separation of free dextran from PGWPH was
carried out with hydrophobic interaction chromatography (HIC), which makes use of the
reversible insolubility of proteins in high salt solutions. When injecting a non-incubated
1:4 mixture of WPH and dextran, the dextran, all of which was free, eluted within the first
20 min during the 1M ammonium sulfate rinse (Figure 5B). However, problematic was
the fact that some protein/peptides were co-eluting with dextran during the 1M ammonium
sulfate rinse, as evidenced by the peak that eluted between 10-20 min (Figure 5A). It was
hypothesized that this protein/peptide peak, hereafter referred to as the early-eluting
protein/peptide peak, was made up of low molecular weight, hydrophilic peptides, which 54

were not made hydrophobic by the high salt concentration, and so did not effectively bind
to the column. A majority of the protein/peptides in WPH were affected by the high salt
concentration and eluted with the DDW rinse from 20-35 min (Figure 5A). This is
dissimilar to the observations of Wang and Ismail (2012) who used HIC to separate
partially glycated whey protein from free dextran. The authors observed that dextran
completely eluted during the preliminary 1M ammonium sulfate rinse, while the protein
did not elute until the DDW rinse. This is because WPI is comprised of fully intact whey
proteins, and so could be effectively made hydrophobic during the high salt rinse, allowing
for sufficient separation of protein and free dextran.
Figure 5. Elution of A) protein and B) carbohydrate of a 4:1 mixture of dextran and WPH. Chromatogram in A shows absorbance at 220 nm, scaled to 1000 absorbance units. Graph B shows mg glucose equivalents per mL of fractions collected every 3 mL (1 min), determined by the phenol-sulfuric acid method (AOAC Method 988.12). Error bars represent standard errors (n=2).
To address the problem of co-elution of dextran with the early-eluting protein peak,
hypothesized to be comprised of low molecular weight, hydrophilic peptides, centrifugal
filtration using 3 kDa membranes was used to separate peptides < 3 kDa from 10 kDa
dextran and >3 kDa peptides and proteins (both glycated and non-glycated). Preliminary
testing using a non-incubated 1:4 mixture of WPH and dextran showed that after filtering,
the carbohydrate elution pattern of the retentate remained similar to the unfiltered sample
(Figure 6, B and D) and most of the dextran appeared to elute within the first 10-20 min
during the 1M ammonium sulfate rinse. The peptide peak eluting between 10-20 min, as
55
determined by absorbance at 220 nm, was slightly reduced in the retentate after filtering
compared to the unfiltered sample (Figure 6, A and C). Small peaks (at 10, 20, and 30 min
of elution) could be observed in the permeate (Figure 6, E) suggesting that a small amount
of peptides were able to pass through the membrane during the filtration, along with only
trace free dextran (Figure 6, F).
Testing using WPH incubated with dextran also showed that most of the free
dextran appeared to elute within the first 10-20 min during the 1M ammonium sulfate rinse
(Figure 7, B and D). However detection of carbohydrate was extended, in low levels, up
to 40 min and within the DDW rinse, which was not seen in Figure 6. This additional
detected carbohydrate is likely the glycated protein/peptides in WPH incubated with
dextran, which elute with the bulk of the protein in the DDW rinse. Only a small amount
of peptides were present in the permeate (Figure 7, E), with trace dextran (2.0 mg total)
(Figure 7, F).
To increase the concentration of peptides in the permeate, centrifugal filtration was
also carried out on WPH incubated with dextran prepared at a 2.0% (w/v) protein
concentration, a decrease from the 4.0% (w/v) protein concentration used in the previous
experiment. Filtration at this lower protein concentration greatly increased the amount of
peptides that passed through the membrane and into the permeate (Figure 8). This proved
that high protein concentrations ultimately led to poorer filtration performance as seen in
Figure 6E and 7E, most likely due to fouling of the membrane. However, carbohydrate
content of the permeate also increased to 58.1% of the dried permeate mass, so a second
filtration step was investigated to decrease the carbohydrate content, while maintaining the
protein content of the permeate.
56

Figure 6. Elution of A) protein and B) carbohydrate of a 4:1 mixture of dextran and WPH; elution of C) protein and D) carbohydrate of the retentate of centrifuge filtration processed 4:1 mixture of dextran and WPH; and elution of E) protein and F) carbohydrate of the permeate of centrifuge filtration processed 4:1 mixture of dextran and WPH. Chromatograms show absorbance at 220 nm, scaled to 1000 absorbance units. Additional chromatogram in E is scaled to 100 absorbance units. Graphs B, D, and F show mg glucose equivalents per mL of fractions collected every 3 mL (1 min), determined by the phenol-sulfuric acid method (AOAC Method 988.12). Error bars represent standard errors (n=2).
57
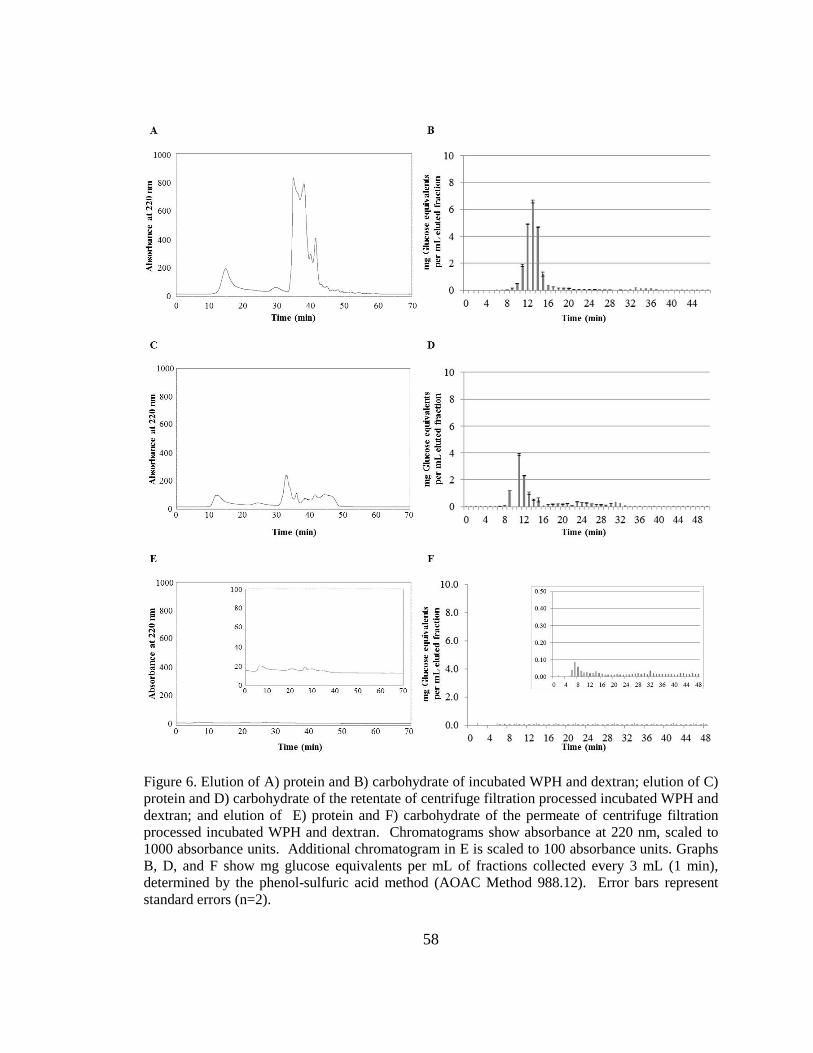
Figure 6. Elution of A) protein and B) carbohydrate of incubated WPH and dextran; elution of C) protein and D) carbohydrate of the retentate of centrifuge filtration processed incubated WPH and dextran; and elution of E) protein and F) carbohydrate of the permeate of centrifuge filtration processed incubated WPH and dextran. Chromatograms show absorbance at 220 nm, scaled to 1000 absorbance units. Additional chromatogram in E is scaled to 100 absorbance units. Graphs B, D, and F show mg glucose equivalents per mL of fractions collected every 3 mL (1 min), determined by the phenol-sulfuric acid method (AOAC Method 988.12). Error bars represent standard errors (n=2).
58
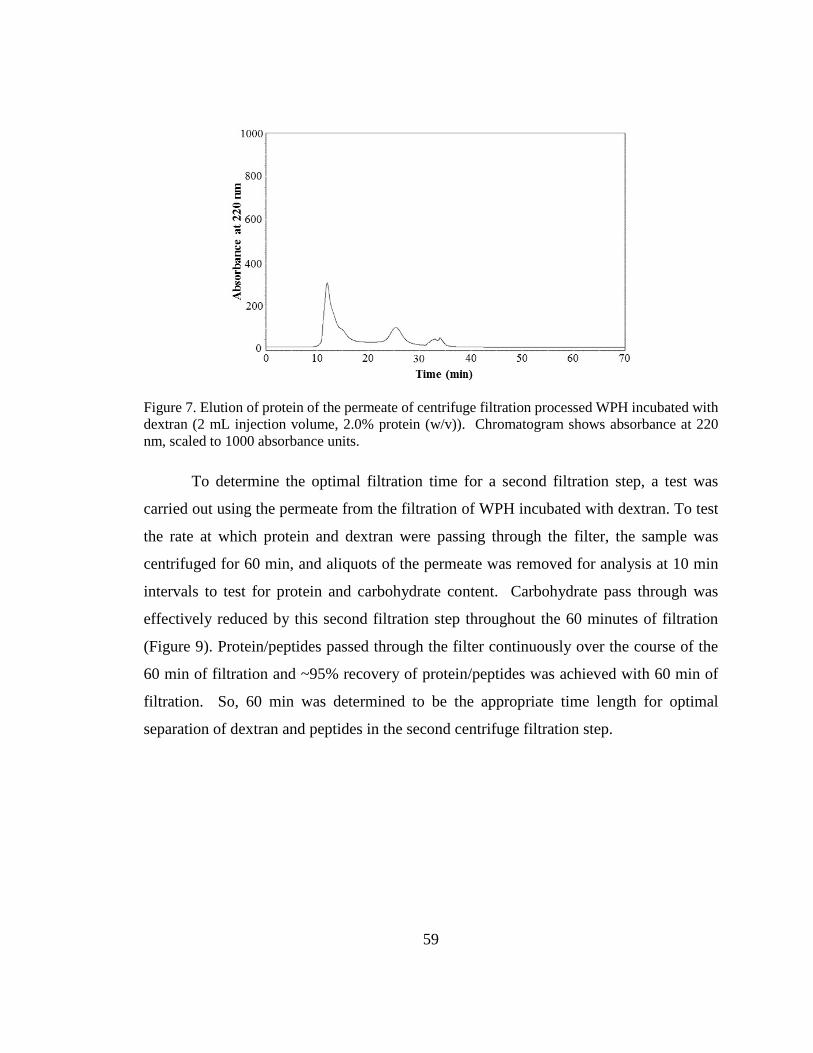
Figure 7. Elution of protein of the permeate of centrifuge filtration processed WPH incubated with dextran (2 mL injection volume, 2.0% protein (w/v)). Chromatogram shows absorbance at 220 nm, scaled to 1000 absorbance units.
To determine the optimal filtration time for a second filtration step, a test was
carried out using the permeate from the filtration of WPH incubated with dextran. To test
the rate at which protein and dextran were passing through the filter, the sample was
centrifuged for 60 min, and aliquots of the permeate was removed for analysis at 10 min
intervals to test for protein and carbohydrate content. Carbohydrate pass through was
effectively reduced by this second filtration step throughout the 60 minutes of filtration
(Figure 9). Protein/peptides passed through the filter continuously over the course of the
60 min of filtration and ~95% recovery of protein/peptides was achieved with 60 min of
filtration. So, 60 min was determined to be the appropriate time length for optimal
separation of dextran and peptides in the second centrifuge filtration step.
59
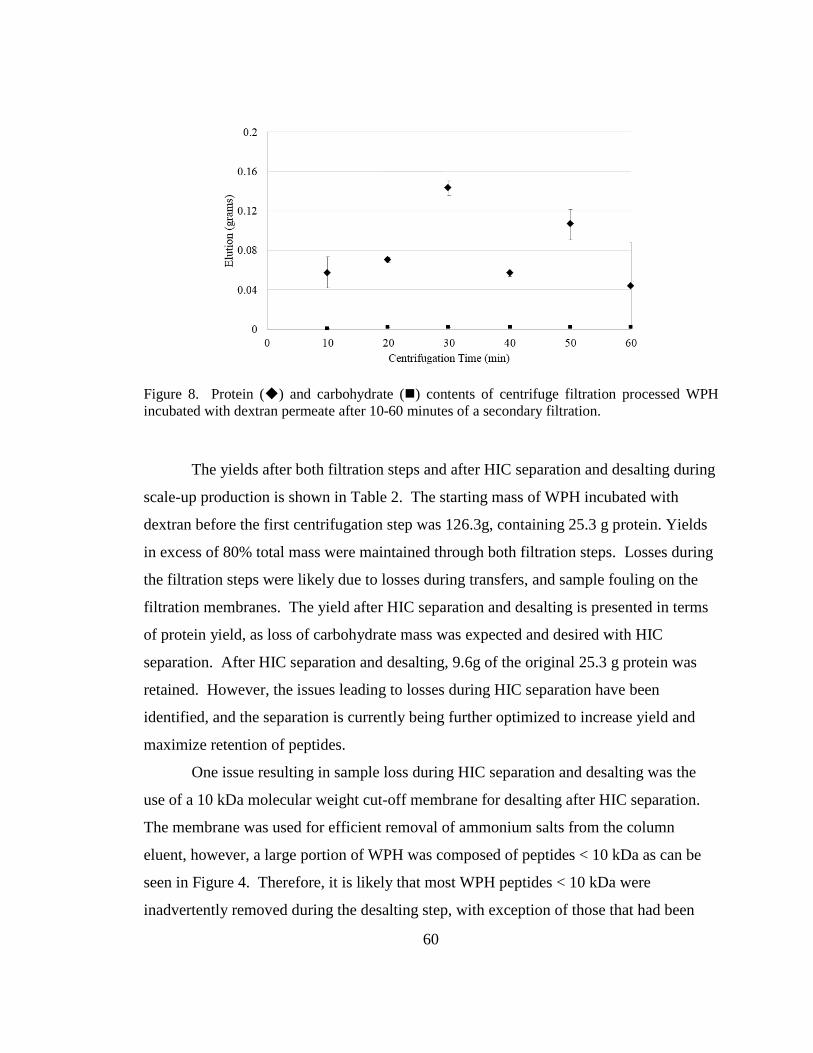
Figure 8. Protein () and carbohydrate () contents of centrifuge filtration processed WPH incubated with dextran permeate after 10-60 minutes of a secondary filtration.
The yields after both filtration steps and after HIC separation and desalting during
scale-up production is shown in Table 2. The starting mass of WPH incubated with
dextran before the first centrifugation step was 126.3g, containing 25.3 g protein. Yields
in excess of 80% total mass were maintained through both filtration steps. Losses during
the filtration steps were likely due to losses during transfers, and sample fouling on the
filtration membranes. The yield after HIC separation and desalting is presented in terms
of protein yield, as loss of carbohydrate mass was expected and desired with HIC
separation. After HIC separation and desalting, 9.6g of the original 25.3 g protein was
retained. However, the issues leading to losses during HIC separation have been
identified, and the separation is currently being further optimized to increase yield and
maximize retention of peptides.
One issue resulting in sample loss during HIC separation and desalting was the
use of a 10 kDa molecular weight cut-off membrane for desalting after HIC separation.
The membrane was used for efficient removal of ammonium salts from the column
eluent, however, a large portion of WPH was composed of peptides < 10 kDa as can be
seen in Figure 4. Therefore, it is likely that most WPH peptides < 10 kDa were
inadvertently removed during the desalting step, with exception of those that had been
60

glycated to 10 kDa dextran during incubation. This removal of non-glycated peptides
likely greatly increased the total proportion of glycated peptides in our PGWPH which
may lead to significant changes in product functionality, stability, and overall quality.
The second issue resulting in sample loss during removal of free dextran was
column fouling. The fouling was discovered after the completion of all separation runs,
and is likely the result of hydrophobic proteins/peptides which strongly bind to the
hydrophobic column resin. This issue is currently being addressed through the use of
several sequential column rinses using water and dilute sodium hydroxide to aid in the
elution of hydrophobic peptides.
Table 2. Yields of WPH incubated with dextran after first filtration, second filtration, and after completion of HIC separation and desalting. (Initial Mass: 126.3 g)
Mass after First
Filtration (g)
Mass after Second
Filtration (g)
Mass after HIC Separation
and Desalting (g)
Retentate 93.7 --- ---
Permeate 11.6 8.18 ---
Total 105 102 18.1 (9.6g protein)
% Yield 83.4% 80.65% 38% (protein yield)
2.4.3 Characterization of Partially Glycated Whey Protein Hydrolysate
PGWPH was composed of almost 1:1 protein and carbohydrate (Table 3), though
it was not confirmed whether all carbohydrate detected was part of glycated protein
complexes, or whether some free dextran contamination had occurred. Wang and Ismail
(2013) observed that their partially glycated whey protein isolate, produced by incubation
of WPI with dextran for 96 h at 60°C and 49% RH and purified using HIC, was comprised
of approximately 60% protein and 30% carbohydrate. This could be due, in part, to the
increase chemical reactivity and accessibility of free amino groups of WPH compared to
WPI. It is also likely that by dialyzing with a 10 kDa membrane, almost all non-glycated
61
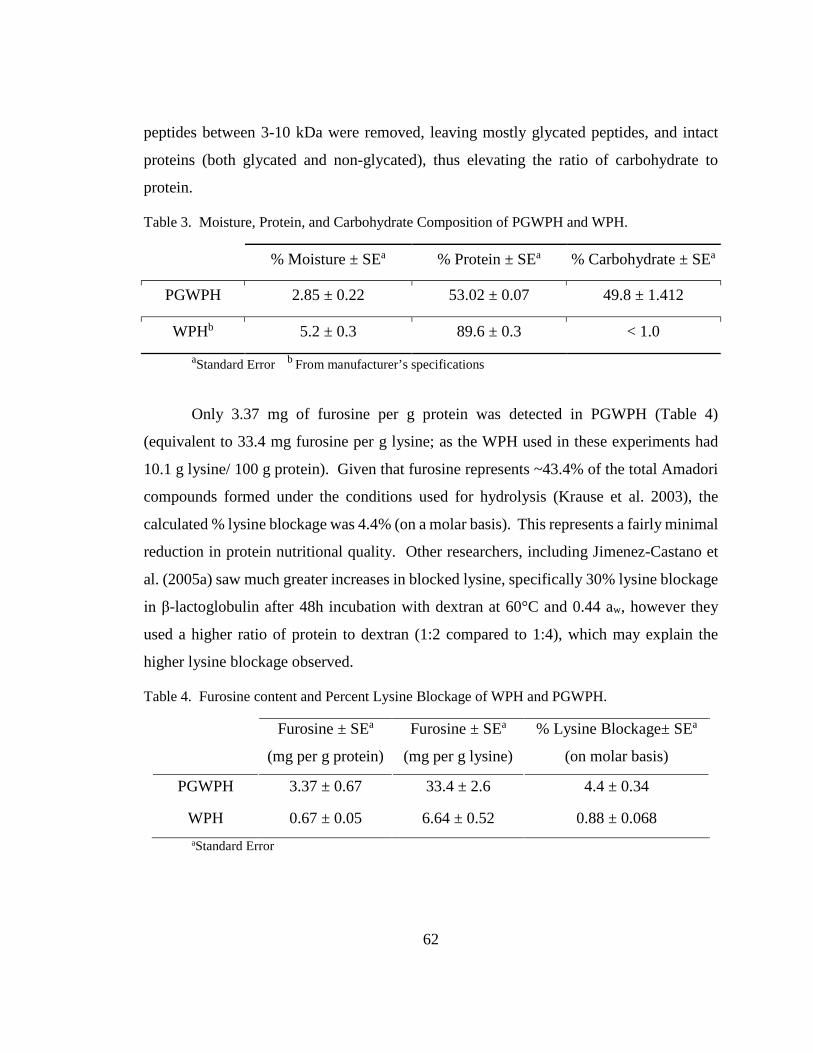
peptides between 3-10 kDa were removed, leaving mostly glycated peptides, and intact
proteins (both glycated and non-glycated), thus elevating the ratio of carbohydrate to
protein.
Table 3. Moisture, Protein, and Carbohydrate Composition of PGWPH and WPH.
% Moisture ± SEa % Protein ± SEa % Carbohydrate ± SEa
PGWPH 2.85 ± 0.22 53.02 ± 0.07 49.8 ± 1.412
WPHb 5.2 ± 0.3 89.6 ± 0.3 < 1.0 aStandard Error b From manufacturer’s specifications
Only 3.37 mg of furosine per g protein was detected in PGWPH (Table 4)
(equivalent to 33.4 mg furosine per g lysine; as the WPH used in these experiments had
10.1 g lysine/ 100 g protein). Given that furosine represents ~43.4% of the total Amadori
compounds formed under the conditions used for hydrolysis (Krause et al. 2003), the
calculated % lysine blockage was 4.4% (on a molar basis). This represents a fairly minimal
reduction in protein nutritional quality. Other researchers, including Jimenez-Castano et
al. (2005a) saw much greater increases in blocked lysine, specifically 30% lysine blockage
in β-lactoglobulin after 48h incubation with dextran at 60°C and 0.44 aw, however they
used a higher ratio of protein to dextran (1:2 compared to 1:4), which may explain the
higher lysine blockage observed.
Table 4. Furosine content and Percent Lysine Blockage of WPH and PGWPH.
Furosine ± SEa
(mg per g protein)
Furosine ± SEa
(mg per g lysine)
% Lysine Blockage± SEa
(on molar basis)
PGWPH 3.37 ± 0.67 33.4 ± 2.6 4.4 ± 0.34
WPH 0.67 ± 0.05 6.64 ± 0.52 0.88 ± 0.068 aStandard Error
62

There was no significant difference in the digestibility of WPH (91.65 ± 1.219%)
and PGWPH (89.393 ± 2.99%), which were both very high. Post digestion, the
chromatographic peaks representing the hydrolyzed peptides of PGWPH were comparable
to those of digested WPH (Figure 20, Appendix C), indicating no change in enzyme
hydrolysis due to glycation. The high digestibility of PGWPH along with its minimal
lysine blockage indicates that partial glycation of WPH does not decrease its high
nutritional quality.
2.5 Conclusions
Maillard-induced glycation of WPH was carried out under controlled conditions to
optimize Amadori compound formation, while minimizing progression to intermediate and
final stage MRPs including florescent compounds and brown pigments. WPH incubated
with dextran for 48h was chosen for further study due to its moderate formation of Amadori
compounds, low browning and fluorescent compound formation, and only moderate
reduction in free amino groups. Comprehensive testing was carried out to devise a
procedure for reducing the quantity of free dextran in glycated whey protein hydrolysate.
The final separation protocol removed free dextran from glycated and non-glycated protein
and peptides with moderate success using a 2-step membrane filtration and hydrophobic
interaction chromatography (HIC). However, desalting with a 10 kDa membrane likely
removed non-glycated peptides < 10 kDa. The final composition of glycated whey protein
hydrolysate was approximately 1:1 protein to carbohydrate. Purified glycated whey
protein hydrolysate displayed minimal blockage of the essential amino acid lysine, and no
significant decrease in digestibility. Overall, this work has shown that partial Maillard
glycation can be induced and controlled to low-levels in whey protein hydrolysate,
producing a value-added product with maintained nutritional quality, and potentially
enhanced functionality and stability. Further testing will investigate whether Maillard-
glycation of WPH will improve its stability during storage, specifically with regard to
moisture-induced protein/peptide aggregation.
63
3. Physiochemical Changes of a Partially-Glycated Whey Protein Hydrolysate
during Accelerated Shelf-life Testing
3.1 Overview
A controlled accelerated shelf-life study of PGWPH and WPH was carried out at
45°C and 31%/65% relative humidity (RH) for up to 28 days to evaluate the effects of
glycation on the powder stability. Specifically, the effects of partial glycation of WPH on
production of new initial-stage Maillard reaction products (MRPs), progression of MRPs
generated upon production of PGWPH to intermediate and advanced stages, and moisture-
induced protein/peptide aggregation were monitored. The moisture-sorption isotherm
generated for PGWPH indicated that it had a monolayer moisture value (m0) of 5.92 g
water/100 g solids at a corresponding water activity (aw) of 0.35 at 25°C. Greatest change
in color, and formation of fluorescent compounds was observed for the samples stored at
65% RH, with PGWPH experiencing the most change, likely due to progression of the
MRPs, generated upon production of PGWPH, to advanced stages of the reaction.
Formation of insoluble aggregates and changes in surface hydrophobicity index were not
detected for either PGWPH or WPH under the storage conditions studied. However, when
heated at 80°C for 30 min at pH 4.5 PGWPH remained soluble while WPH lost over 60%
of its solubility. This work demonstrated that partially-glycated whey protein hydrolysate
experiences minimal deteriorative reactions during controlled storage, specifically below
65% RH, which is promising for the advancement of protein glycation as a novel protein-
enhancement technique.
64
3.2 Introduction
Whey protein hydrolysates are value-added products that are experiencing a rapid
increase in usage and market volume (Affertsholt 2010). Whey protein hydrolysates have
several benefits over traditional isolates including the presence of bioactive peptides
(FitzGerald & Meisel 2003), increased digestibility (Sinha et al. 2007), and improved
functionality (Mullally et al. 1994; Foegeding et al. 2002; Creusot & Gruppen 2007), and
thermal stability (Foegeding et al. 2002). However, a challenge with the commercial use
of hydrolysates in food products is that their increased reactivity in many deteriorative
reactions, including moisture-induced protein/peptide aggregation and the Maillard
reaction, can lead to decreased shelf-life and sensory quality (Netto et al. 1998). To allow
for continued increases in usage of protein hydrolysate in food formulations, it is important
that their stability challenges be addressed.
Moisture-induced protein/peptide aggregation refers to the clustering of protein
molecules and the formation of generally irreversible aggregates, primarily through
intermolecular hydrophobic interactions and disulfide-bond formation (Costantino et al.
1994; Weiss et al. 2009). The formation of protein/peptide aggregates can lead to decreases
in functionality, nutritional quality, and processability. Environmental conditions, such as
increased temperature, and relative humidity (RH) are known to increase the rate of protein
aggregation (W.R. Liu et al. 1990; Zhou & Labuza 2007; Zhou et al. 2008b), which is
problematic given the conditions frequently experienced during modern industrial
distribution and storage. Additionally, common chemical reactions including the later
stages of the Maillard reaction may cause protein polymerization and exacerbate protein
aggregation (Zamora & Hidalgo 2005; Zhou et al. 2013).
Typically, the study of moisture-induced protein/peptide aggregation is carried out
using storage studies at various temperatures, relative humidities, or other conditions meant
to replicate the realities of the product storage experience. One frequently used storage
study type is the accelerated shelf-life test (ASLT) which makes use of elevated
temperature (typically 45°C) to increase the rate of the reactions being studied, and to
allow for a greater visibility of changes that would otherwise have taken much longer to
65
see at lower temperatures. Moisture-sorption isotherm generation is also frequently carried
out when evaluating the stability of products to moisture-induced changes. Greater
susceptibility of a product to moisture content and environmental RH changes can lead to
substantial challenges with product physical and physiochemical stability.
Several studies have been conducted on the storage stability of protein hydrolysate
powders with respect to moisture-induced protein aggregation. For instance, moisture-
induced protein aggregation was monitored during storage of egg white protein hydrolysate
(Rao & Labuza 2012), soy protein hydrolysate (Gillman 2014) and whey protein
hydrolysate (Zhou & Labuza 2007; Zhou et al. 2014). The studies on WPH in particular
indicated that formation of insoluble aggregates was an issue at high RH (>70%), and that
disulfide interactions, and hydrophobic interactions to a lesser extent, were responsible for
the formation of aggregates (Zhou & Labuza 2007; Zhou et al. 2014).
Environmental control is the primary technique currently being used to control and
limit protein/peptide aggregation during industrial production, distribution, and storage.
However, in recent years researchers have observed that Maillard-induced glycation
decreases protein aggregation in certain food systems (Chevalier et al. 2001; Wang &
Ismail 2012). It has been hypothesized that Maillard-induced protein glycation may reduce
moisture-induced protein/peptide aggregation of protein hydrolysates in a dry powder
system. Therefore, it is our objective to assess the ability of partially-glycated whey protein
hydrolysate to retard moisture-induced aggregation during an accelerated storage study
using challenging environmental conditions.
66

3.3 Materials and Methods
3.3.1 Materials
All materials are the same as listed in Section 2.3.1, with the addition of standard
color plates. Standard color plates (yellow, gray, white, pink, blue, and green) were
purchased from Hunter Associates Laboratory, Inc. (Fairfax, VA, USA).
3.3.2 Preparation of Partially Glycated Whey Protein Hydrolysate
Controlled and limited Maillard glycation of whey protein hydrolysate and removal
of excess free dextran from PGWPH was carried out as outlined in Section 2.3.2 and
Section 2.3.4.3.
3.3.3 Moisture Sorption Isotherm Generation
A moisture sorption isotherm for PGWPH was created using an Aqualab Vapor
Sorption Analyzer (VSA) (Decagon Devices, Inc., Pullman, OR, USA). A sample (500
mg) was loaded into a stainless steel analysis cup. The current moisture content (as
determined by Karl Fischer) was recorded to track the change in weight and was used to
determine the change in moisture content with the change in relative humidity (RH) to
generate the isotherm. A dynamic vapor sorption (DVS) isotherm was carried out by
exposing the sample to water activities (aw) from 0.05 to 0.75 at 0.05 aw intervals. Only
after the weight was stable for 3 reading points (indicating that the sample aw had reached
equilibrium) was the RH increased to the next highest level.
The completion of one DVS isotherm took approximately 6 days. To determine
the monolayer value (m0) and the surface heat constant (C), a Brunauer-Emmett-Teller
(BET) isotherm model was created for PGWPH using the Equations 7-9. The BET graph
was created by plotting aw/([1- aw]moisture content) on the y-axis and aw on the x-axis as
shown by the BET equation (Equation 7). The y-intercept and slope of the trend line were
used to calculate the m0 (Equation 8) and C (Equation 9). A Guggenheim-Andersen-
deBoer (GAB) isotherm model was then created to model the change in moisture content
with changes in water activity above 0.55. The GAB graph was created by plotting
67

aw/moisture on the y-axis and aw on the x-axis as shown by the GAB equation (Equation
10).
Equation 7
𝑆𝑆𝑤𝑤[(1 − 𝑆𝑆𝑤𝑤)𝑚𝑚] =
1𝑚𝑚0𝐶𝐶
+ �(𝐶𝐶 − 1)𝑚𝑚0𝐶𝐶
�𝑆𝑆𝑤𝑤
Equation 8
m0 =1
1𝑚𝑚0𝐶𝐶
+ �(𝐶𝐶 − 1)𝑚𝑚0𝐶𝐶
�
Equation 9
C =1
1𝑚𝑚0𝐶𝐶
+ �(𝐶𝐶 − 1)𝑚𝑚0𝐶𝐶
�×
1𝑚𝑚0𝐶𝐶
Equation 10
m =C1km0aw
(1 − kaw)(1− kaw + C1kaw)
Where: aw = water activity m0 = monolayer moisture value k = multilayer constant C = surface heat constant
3.3.4 Storage Study Experimental Design
To determine extent of aggregation during storage of PGWPH and WPH powders
an accelerated shelf-life study was designed. PGWPH and WPH were stored at 2 different
water activities (aw) at 45°C for up to 28 days. Desiccators containing saturated salt slurries
of magnesium chloride (MgCl2, 0.31 aw) and potassium iodide (KI, 0.65 aw) were used to
control the humidity of the storage environment and hence the aw of the samples. A storage
temperature of 45°C was chosen to simulate accelerated shelf-life testing. By increasing
the storage temperature the rates of chemicals reactions were increased, allowing for a
greater possible observation of changes than could otherwise be seen in the same period of
68
time with a lower temperature. Samples to be checked for color were stored in glass Petri
dishes in thin, flat layers to allow for maximum water adsorption. Samples to be collected
for analysis at various pre-determined time points (specifically, after 3, 5, 7, 10, 14, 21,
and 28 days of storage) were stored in glass HPLC vials, without caps, with the same
starting mass of 50 mg protein. Samples were removed at specific times, and stored at -
20°C until analysis.
3.3.4.1 Color Analysis by Chroma Meter
The change in color of PGWPH and WPH during storage was measured using a
Chroma Meter CR-211 (Minolta Camera Co., Osaka, Japan) tri-stimulus color analyzer.
The meter was first calibrated using standard white CR-221 calibration plate, and six color
standards (yellow, gray, white, pink, blue, and green). Each sample was measured in
triplicate, following the manufacturer’s instructions in the absolute measuring mode, using
the CIE (International Commission on Illumination) 1976 L*a*b color space system. The
L* values (lightness) extend between 0 for black and 100 for white; the positive a* values
are red/magenta and the negative a* values are green; the positive b* values are yellow and
the negative b* values blue. The a* and b* values do not have a limited scale in contrast to
the lightness scale, which is bound by 0 and 100. To measure the overall change in color
over time, the total color difference (ΔE) was calculated (Equation 11). The ΔE takes into
account the differences between the L*, a*, and b* values from a stored sample and its
respective day 0 control.
Equation 11
∆E = �∆L∗2 + ∆a∗2 + ∆b∗2
Where: ∆E = total color difference ∆L* = change in L* value from day 0 to day of measurement ∆a* = change in a* value from day 0 to day of measurement
∆b *= change in b* value from day 0 to day of measurement Reaction rate constants were determined where possible using linear regressions of
the color values plotted versus storage time in days for each color measurement (L*, a*, 69
b*, and ΔE). Goodness of fit (R2) was used to indicate how well the linear model fit the
experimental data. Model-predicted color values at 28 days were determined using the
linear regression equation for each color measurement. Confidence Intervals (95%) were
used to indicate significant differences between storage %RH and sample type.
3.3.4.2 Determination of Fluorescent Compounds
The change in fluorescent compound formation in PGWPH and WPH during
storage was monitored as outlined in Section 2.3.3.2. PGWPH and WPH samples from
each pre-determined time point were analyzed in triplicate. The fluorescence intensity (FI)
of all incubated samples were adjusted by subtracting the FI values of their respective day
0 controls, as in Equation 13. Reaction rate constants were determined where possible
using linear regressions as in Section 3.3.4.1.
Equation 12:
% 𝐹𝐹𝐹𝐹𝐹𝐹𝐹𝐹𝐹𝐹𝐹𝐹𝐹𝐹𝐹𝐹𝐹𝐹𝐹𝐹𝐹𝐹𝐹𝐹 𝐼𝐼𝐹𝐹𝐼𝐼𝐹𝐹𝐹𝐹𝐹𝐹𝐼𝐼𝐼𝐼𝐼𝐼 (𝐹𝐹𝐼𝐼) 𝑔𝑔 𝑝𝑝𝐹𝐹𝐹𝐹𝐼𝐼𝐹𝐹𝐼𝐼𝐹𝐹⁄ = �
𝐸𝐸𝑚𝑚𝐼𝐼𝑆𝑆𝐶𝐶𝐶𝐶𝐶𝐶𝑆𝑆𝑟𝑟 𝑆𝑆𝑆𝑆𝑆𝑆𝑆𝑆𝑆𝑆𝑆𝑆𝑔𝑔 𝑃𝑃𝐹𝐹𝐹𝐹𝐼𝐼𝐹𝐹𝐼𝐼𝐹𝐹 −
𝐸𝐸𝑚𝑚𝐼𝐼𝐷𝐷𝑆𝑆𝐷𝐷 0 𝐶𝐶𝐶𝐶𝐶𝐶𝐶𝐶𝐶𝐶𝐶𝐶𝑆𝑆𝑔𝑔 𝑃𝑃𝐹𝐹𝐹𝐹𝐼𝐼𝐹𝐹𝐼𝐼𝐹𝐹
𝐸𝐸𝑚𝑚𝐼𝐼5 𝑆𝑆𝑆𝑆𝑆𝑆 𝑄𝑄𝑄𝑄𝑄𝑄𝐶𝐶𝑄𝑄𝐶𝐶𝑆𝑆 𝑆𝑆𝑄𝑄𝑆𝑆𝑆𝑆𝑆𝑆𝐶𝐶𝑆𝑆 �
Where: Emi = emission reading at 460 nm (bandwidth 30 nm)
3.3.4.3 Loss of Free Amino Groups
The change in free amino group content of PGWPH and WPH during storage was
determined by the o-phthalaldehyde (OPA) method as outlined in Section 2.3.3.3.
PGWPH and WPH samples from each pre-determined time point were analyzed in
triplicate. The % remaining free amino group content over storage time was determined
using Equation 13.
Equation 13:
% 𝑅𝑅𝐹𝐹𝑚𝑚𝑆𝑆𝐼𝐼𝐹𝐹𝐼𝐼𝐹𝐹𝑔𝑔 𝐹𝐹𝐹𝐹𝐹𝐹𝐹𝐹 𝐴𝐴𝑚𝑚𝐼𝐼𝐹𝐹𝐹𝐹 𝐺𝐺𝐹𝐹𝐹𝐹𝐹𝐹𝑝𝑝 𝐶𝐶𝐹𝐹𝐹𝐹𝐼𝐼𝐹𝐹𝐹𝐹𝐼𝐼 =% 𝐹𝐹𝐹𝐹𝐹𝐹𝐹𝐹 𝐴𝐴𝑚𝑚𝐼𝐼𝐹𝐹𝐹𝐹 𝐺𝐺𝐹𝐹𝐹𝐹𝐹𝐹𝑝𝑝𝐹𝐹 𝐹𝐹𝑜𝑜 𝑆𝑆𝐼𝐼𝐹𝐹𝐹𝐹𝐹𝐹𝑆𝑆 𝑆𝑆𝑆𝑆𝑚𝑚𝑝𝑝𝐹𝐹𝐹𝐹% 𝐹𝐹𝐹𝐹𝐹𝐹𝐹𝐹 𝐴𝐴𝑚𝑚𝐼𝐼𝐹𝐹𝐹𝐹 𝐺𝐺𝐹𝐹𝐹𝐹𝐹𝐹𝑝𝑝𝐹𝐹 𝐹𝐹𝑜𝑜 𝐷𝐷𝑆𝑆𝐼𝐼 0 𝐶𝐶𝐹𝐹𝐹𝐹𝐼𝐼𝐹𝐹𝐹𝐹𝐹𝐹
× 100
70
3.3.4.4 Evaluation of Peptide Profile
The change in peptide distribution and size of PGWPH and WPH during storage
was visualized with tris-tricine SDS-PAGE under reducing conditions as outlined in
Section 2.3.3.4. PGWPH and WPH samples from each pre-determined time point were
analyzed in triplicate. Gels were stained with Coomassie blue stain as outlined in
Section 2.3.3.4.1.
3.3.4.5 Determination of Surface Hydrophobicity
The change in surface hydrophobicity of PGWPH and WPH during storage was
determined as described by Kato and Nakai (1980) and Sava and Planken (2005), with
modifications. PGWPH and WPH samples from each pre-determined time point were
analyzed in triplicate. For each, 0.005-0.050% protein solutions (w/v) were prepared in
citric acid phosphate buffer (0.017 M citric acid, 0.165 M sodium phosphate, pH 7). A
0.025% solution (w/v) of 8-Anilino-1-napthalenesulfonic acid ammonium salt (ANS) in
phosphate buffer (80mM K2HPO4, 19.8 mM KH2PO4, pH 7.4) was made fresh at the time
of analysis. A 200 μL aliquot of samples were loaded into opaque, white polystyrene
microplate and the relative fluorescence index (RFI) was measured at an excitation of 400
nm (bandwidth 30 nm), emission of 460 nm (bandwidth 40 nm), and a gain of 25 with a
microplate reader (Biotek, Winooski, VT). A 10 μL aliquot of ANS solution was then
added to each well and the plates were incubated at 23°C in the dark for 15 minutes before
reading the RFI a second time. The surface hydrophobicity was determined by calculating
the Net RFI of each sample by subtracting the RFI of samples before addition of ANS from
the RFI of samples after addition of ANS. A plot of the Net RFI for each sample at various
protein concentrations was generated, along with a linear regression trend-line for the plot.
The initial slope (S0) of the linear regression is equal to the protein surface hydrophobicity
index.
71

3.3.4.6 Quantitative Determination of Solubility
The change in water solubility of PGWPH and WPH during storage was performed
as outlined by Zhou (2008a), and Gillman (2014) with modifications. PGWPH and WPH
samples from each pre-determined time point were analyzed in triplicate. For each, a 2.5%
protein solution (w/v) was prepared in DDW, in triplicate. Solubilized samples were
vortexed and then shaken for one hour. Afterwards, 1 mL of each sample was removed to
determine protein content by Dumas using the LECO® Nitrogen Analyzer as in Section
2.3.5.1. The remaining dispersions were then centrifuged at 15,682 x g for 10 min and the
supernatants were removed for protein content analysis. To determine the percent protein
solubility for each sample, Equation 14 was used.
Equation 14
% Protein Solubility
=(original protein content − supernatant protein content )
original protein content× 100
The change in solubility of PGWPH and WPH at pH 4.5 and 3.4, after heat
treatment at 80°C for 30 min was also assessed. PGWPH and WPH samples from each
pre-determined time point were analyzed in triplicate. For each, a 2.5% protein solution
(w/v) was prepared in DDW. Solubilized samples were vortexed and then shaken for one
hour. Afterwards, samples were adjusted to pH 4.5 or 3.4 using 3N HCl and heated in an
80°C water bath for 30 min. After heating, 1 mL of each sample was removed to determine
protein content by Dumas using the LECO® Nitrogen Analyzer as in Section 2.3.5.1. The
remaining dispersions were then centrifuged at 15,682 x g for 10 min and the supernatants
were removed for protein content analysis. To determine the percent protein solubility for
each sample, Equation 14 was used.
3.3.5 Statistical Analysis
Analysis of variance (ANOVA) was carried out using IBM SPSS Statistics
software version 22.0 for Windows (SPSS, Inc., Chicago, IL, USA). Significant differences
72

among the respective means were determined when a factor effect or an interaction was
found to be significant (P ≤ 0.05) using the Tukey-Kramer multiple means comparison test.
ANOVA tables for Chapter 3 can be found in Appendix F (Tables 13-44).
73

3.4 Results and Discussion
3.4.1 Moisture Sorption Properties of Partially-Glycated Whey Protein Hydrolysate
Moisture-sorption isotherms give indication of the change in moisture content of a
substance with changing water activity (aw). Isotherms can also be used to calculate other
important physiochemical parameters including the monolayer moisture value (mo) and
surface heat constant (C). The m0 indicates the moisture content at a specific aw at which
moisture is tightly bound to the substance, and is the moisture content that results in the
lowest rates of chemical reactions, and thus the greatest stability (Katz and Labuza 1981).
The C indicates how tightly water is bound within the substance.
The moisture-sorption isotherm for PGWPH had a sigmoidal, or Type II shape,
which is the most common for food products (Figure 10). The BET model indicated an m0
of 5.9 g water/100 g solids, at a corresponding aw of 0.35. This m0 is similar to that
observed by researchers of other protein hydrolysate powders at 23°C including soy protein
hydrolysate (m0 6.8 at 0.29 aw) (Gillman 2014) and whey protein hydrolysate (m0 6.1, aw
not specified) (Zhou and Labuza 2007). The model also indicated a C of 2.97, which was
lower than that observed by researchers of soy protein hydrolysate (C 8.00) (Gillman 2014)
and much lower than that of whey protein hydrolysate (C 60.39) (Zhou and Labuza 2007),
suggesting that PGWPH binds water less tightly than other non-glycated protein
hydrolysates. However, these authors also determined their m0 and C values using the
Guggenheim-Anderson-de Boer (GAB) model, which may be the reason for these
differences.
74

Figure 9. BET/GAB Moisture sorption isotherm of PGWPH at 25°C. Points shown are the points at which equilibrium to the RH were achieved.
The isotherm was also used to indicate RH regions that would be most interesting
to investigate during the subsequent study of PGWPH storage stability. The isotherm was
used to select 31% and 65% RH for further study of PGWPH storage stability. The RH of
31% was selected as it is very near the m0, and would approximate PGWPH stability at
typical industrial conditions. In contrast, 65% RH was selected as it is sufficiently higher
than the m0 but below the RH at which mold growth would be expected, and so could
indicate the stability of PGWPH at conditions of unfavorable RH.
3.4.2 Progression of the Maillard Reaction during Accelerated Shelf-life Testing of PGWPH
Propagation of the Maillard reaction was investigated during accelerated shelf-life
testing of PGWPH for several reasons. For one, it is possible that the initial-stage MRPs
generated during glycation of PGWPH may progress into intermediate and final stage
products. Also, since there is the possibility that PGWPH may contain residual free
dextran, new initial-stage Maillard products may be created. It has been observed by other
0.00
0.05
0.10
0.15
0.20
0.25
0.30
0.00 0.20 0.40 0.60 0.80 1.00
Moi
stur
e C
onte
nt (g
wat
er/ g
solid
s)
Water Activity (aw)
75
researchers (Jimenez-Castano et al. 2005; Zhou et al. 2013) that the final and intermediate
products formed in the Maillard reaction may contribute to protein/peptide aggregation.
And lastly, the Maillard reaction has been known to cause decreases in protein quality via
losses of the essential amino acid lysine (Labuza and Warren 1977), and through
production of toxic compounds (Brands 2000; Finot et al. 1981), therefore it is important
to monitor the reaction during storage.
3.4.2.1 Changes in Total Color and L*, a*, and b* Values during Storage
Color is one of the most basic and common criterions used to determine the
acceptability of food ingredients, and so is frequently used as an indicator of quality in
shelf-life studies. Color can be used as an indicator of many deteriorative reactions
including the Maillard reaction. This is particularly useful as the Maillard reaction is a
common mode of quality loss during storage of dry protein powders that contain even small
amounts reducing compounds (Dattatreya et al. 2007; Rao and Labuza 2012; Zhou et al.
2014). The system used to measure color of the samples during the study was the L*a*b
color space system, which gives indication of a sample’s lightness, hue, and total change
in color using 4 indices: L*, a*, b*, and ΔE.
The L* dimension of the color space system gives indication of change in lightness
of a sample ranging from 0 (black) to 100 (white). PGWPH stored at 65% RH displayed
the greatest change in L* value over time. The L* value of PGWPH decreased over time,
corresponding to a darkening of the sample (Figure 11). After 28 days, the L* value of
PGWPH was significantly different (P < 0.05) than at day 0, and was significantly different
than all other samples. In contrast, all other samples displayed no significant difference
from day 0 to 28, and no significant difference between each other at day 28. The decrease
in L* value for PGWPH stored at 65% could be fit with a zero-order model with a reaction
rate constant of -0.133 (Table 5). Zero-order models could be constructed for all other
samples, but there was a corresponding low goodness of fit due to the minimal changes
observed.
76
A decrease in L* value is characteristic of the Maillard reaction, specifically the
intermediate and final stages that involve the production of melanoidins (Rao et al. 2012;
Rao and Labuza 2012). It is apparent that PGWPH stored at 65% RH underwent more
Maillard reaction during storage. This is plausible, as the Maillard reaction proceeds at
faster rates between 0.5-0.8 aw due to increased molecular mobility of the reactants
(Eichner and Karel 1972). Additionally, PGWPH may contain trace free dextran remaining
after purification, allowing for initiation of the reaction. Other researchers have observed
significant Maillard browning of protein hydrolysates with only trace amounts of reducing
sugar when stored at an unfavorable RH (Rao and Labuza 2012; Rao et al. 2012).
However, this decrease in lightness may also be due to progression of the initial-stage
MRPs, generated during the production of PGWPH, to intermediate and final stage MRPs
including melanoidins. The Amadori compound is the first stable intermediate of the
Maillard reaction, however, at elevated temperature and RH conditions as tested in this
study, it is plausible that these initial compounds would further progress to later stage
derivatives.
The reason for the fluctuation of L* values of PGWPH and WPH stored at 31%
RH, and WPH stored at 65% RH is likely due to changes in light reflection due to the
adsorption of moisture or changes in microstructure of the powders with storage at elevated
humidity levels (Rao et al. 2012; Zhou et al. 2014; Gillman 2014). Researchers observed
minimal changes in the L* value of WPH when stored below 73% RH and at or below
45°C (Zhou et al. 2014). Changes observed above 73% RH were attributed to changes in
protein powder microstructure. However, other researchers attributed the slight changes
in L* value to changes in moisture adsorption (Rao et al. 2012; Gillman 2014). The starting
moisture content of PGWPH, for example, was 2.94% (w/v, dry basis), which the moisture
sorption isotherm predicts would increase to 5.0% at 31% RH and 12.6% at 65% RH.
Increase in adsorbed moisture may result in a change in light reflection of a sample, and
does not reflect the chemical properties of the sample (Rao et al. 2012).
77
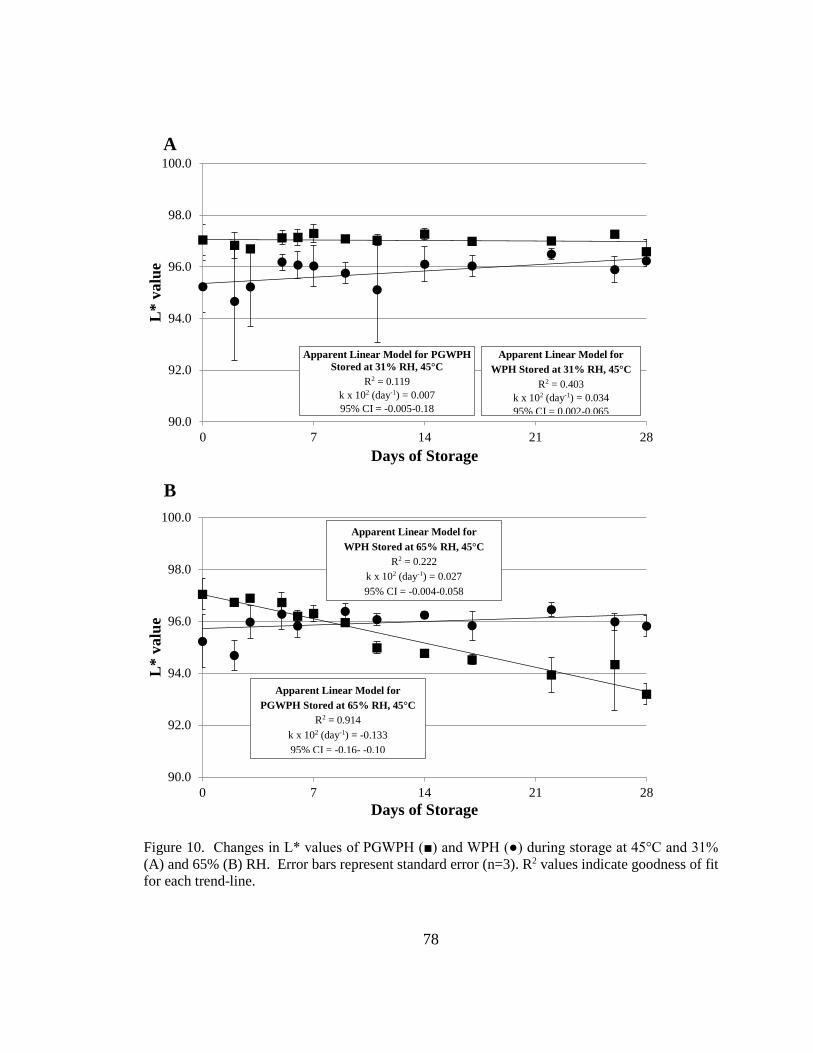
Figure 10. Changes in L* values of PGWPH (■) and WPH (●) during storage at 45°C and 31% (A) and 65% (B) RH. Error bars represent standard error (n=3). R2 values indicate goodness of fit for each trend-line.
90.0
92.0
94.0
96.0
98.0
100.0
0 7 14 21 28
L*
valu
e
Days of Storage
90.0
92.0
94.0
96.0
98.0
100.0
0 7 14 21 28
L*
valu
e
Days of Storage
A
B
Apparent Linear Model for PGWPH Stored at 31% RH, 45°C
R2 = 0.119 k x 102 (day-1) = 0.007 95% CI = -0.005-0.18
Apparent Linear Model for WPH Stored at 31% RH, 45°C
R2 = 0.403 k x 102 (day-1) = 0.034 95% CI = 0.002-0.065
Apparent Linear Model for WPH Stored at 65% RH, 45°C
R2 = 0.222 k x 102 (day-1) = 0.027 95% CI = -0.004-0.058
Apparent Linear Model for PGWPH Stored at 65% RH, 45°C
R2 = 0.914 k x 102 (day-1) = -0.133 95% CI = -0.16- -0.10
78

Table 5. Kinetic analysis of zero-order model for the change in L* value as a function of sample type and storage RH at 45°C.
Apparent Linear Model 31% RH 65% RH PGWPH WPH PGWPH WPH
Best fit values L*28 97.1 96.2 93.3 96.4 k x 102 (day-1) 0.007 0.034 -0.133 0.027 95% CI L*28 97.0-97.4c* 95.7-96.8b 92.8-93.8a 95.8-96.9b k x 102 (day-1) -0.005-0.018b 0.002-0.065b -0.16- -0.10a -0.004-0.058b bGoodness of fit R2 0.119 0.403 0.914 0.222 L*28: model predicted values for L* after 28 days of storage k x 102 (day-1): reaction rate constant * Values in the same row with different letters are significantly different (P≤0.05) by the use of a 95% confidence interval (CI).
The a* and b* dimensions of the color space system indicate a change in hue of a
sample, with a* ranging from green (negative values) to red (positive values), and b*
ranging from blue (negative values) to yellow (positive values). All samples displayed
minimal change in a* value over time (Appendix D). Due to the minimal changes
observed, a zero-order model could not be constructed due to poor goodness of fit.
PGWPH and WPH stored at 31% RH, and WPH stored at 65% RH became slightly greener,
though this was only significant (P < 0.05) for WPH stored at 65% RH. PGWPH stored
at 65% RH became slightly redder, though the change was not statistically significant.
Other researchers observed increases of redness of nonfat dry milk powder stored at 50°C,
however, these increases were also very small (Liu and Metzger 2007).
In the b* dimension, all samples became more yellow over time. PGWPH stored
at 65% RH displayed the greatest increase in b* value, followed by WPH stored at 65%
RH. The samples stored at 31% RH showed only slight increases in b* value over time.
This increase in b* value over time with storage of protein powders has been seen by
several other researchers (Liu and Metzger 2007; Gillman 2014). However, neither the a*
79
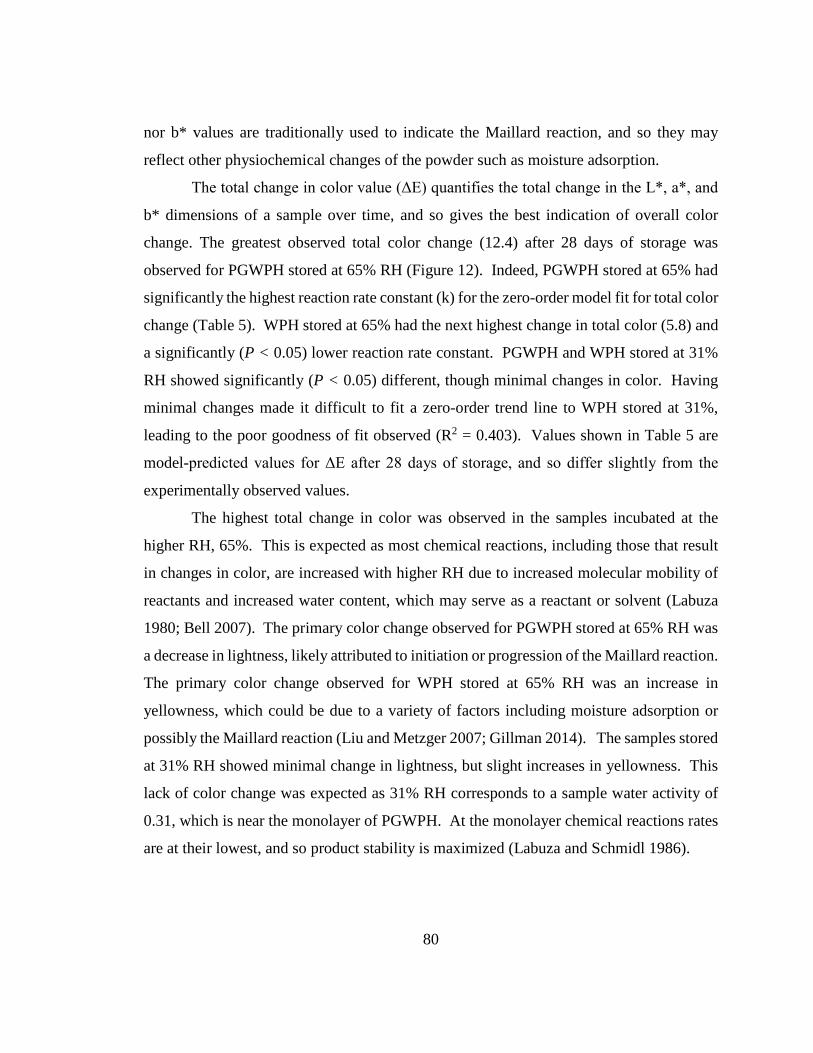
nor b* values are traditionally used to indicate the Maillard reaction, and so they may
reflect other physiochemical changes of the powder such as moisture adsorption.
The total change in color value (ΔE) quantifies the total change in the L*, a*, and
b* dimensions of a sample over time, and so gives the best indication of overall color
change. The greatest observed total color change (12.4) after 28 days of storage was
observed for PGWPH stored at 65% RH (Figure 12). Indeed, PGWPH stored at 65% had
significantly the highest reaction rate constant (k) for the zero-order model fit for total color
change (Table 5). WPH stored at 65% had the next highest change in total color (5.8) and
a significantly (P < 0.05) lower reaction rate constant. PGWPH and WPH stored at 31%
RH showed significantly (P < 0.05) different, though minimal changes in color. Having
minimal changes made it difficult to fit a zero-order trend line to WPH stored at 31%,
leading to the poor goodness of fit observed (R2 = 0.403). Values shown in Table 5 are
model-predicted values for ΔE after 28 days of storage, and so differ slightly from the
experimentally observed values.
The highest total change in color was observed in the samples incubated at the
higher RH, 65%. This is expected as most chemical reactions, including those that result
in changes in color, are increased with higher RH due to increased molecular mobility of
reactants and increased water content, which may serve as a reactant or solvent (Labuza
1980; Bell 2007). The primary color change observed for PGWPH stored at 65% RH was
a decrease in lightness, likely attributed to initiation or progression of the Maillard reaction.
The primary color change observed for WPH stored at 65% RH was an increase in
yellowness, which could be due to a variety of factors including moisture adsorption or
possibly the Maillard reaction (Liu and Metzger 2007; Gillman 2014). The samples stored
at 31% RH showed minimal change in lightness, but slight increases in yellowness. This
lack of color change was expected as 31% RH corresponds to a sample water activity of
0.31, which is near the monolayer of PGWPH. At the monolayer chemical reactions rates
are at their lowest, and so product stability is maximized (Labuza and Schmidl 1986).
80
Figure 11. Total color change (ΔE) values of PGWPH (■) and WPH (●) during storage at 45°C and 31% (A) and 65% (B) RH. Error bars represent standard error (n=3). R2 values indicate goodness of fit for each trend-line.
0.0
2.0
4.0
6.0
8.0
10.0
0 7 14 21 28
ΔE v
alue
Days
0.0
2.0
4.0
6.0
8.0
10.0
12.0
14.0
0 7 14 21 28
ΔE v
alue
Days
A
B
Apparent Linear Model for PGWPH Stored at 31% RH, 45°C
R2 = 0.856 k x 102 (day-1) = 0.025 95% CI = 0.018-0.032
Apparent Linear Model for WPH Stored at 31% RH, 45°C
R2 = 0.403 k x 102 (day-1) = 0.022 95% CI = 0.003-0.040
Apparent Linear Model for WPH Stored at 65% RH, 45°C
R2 = 0.787 k x 102 (day-1) = 0.184 95% CI = 0.012-0.25
Apparent Linear Model for PGWPH Stored at 65% RH, 45°C
R2 = 0.941 k x 102 (day-1) = 0.47 95% CI = 0.39-0.55
81

Table 6. Kinetic analysis of zero-order model for the change in ΔE value as a function of sample type and storage RH at 45°C.
Apparent Linear Model 31% RH 65% RH PGWPH WPH PGWPH WPH
Best fit values ΔE28 0.87 1.53 13.9 7.08 k x 102 (day-1) 0.025 0.022 0.47 0.184 95% CI ΔE28 0.74-0.99a* 1.20-1.86b 12.4-15.3d 5.89-8.27c k x 102 (day-1) 0.018-0.032a 0.003-0.040a 0.39-0.55c 0.12-0.25b Goodness of fit R2 0.856 0.403 0.941 0.787 ΔE28: model predicted values for ΔE after 28 days of storage k x 102 (day-1): reaction rate constant * Values in the same row with different letters are significantly different (P≤0.05) by the use of a 95% confidence interval (CI).
3.4.2.2 Changes in Fluorescence Intensity during Storage
Determination of change in fluorescence intensity of stored samples was used to
indicate progression of the Maillard reaction to the intermediate stage. While color can be
used to indicate production of melanoidins in the later stages of the Maillard reaction, the
measurement of fluorescence can be a useful indicator of the progression of the Maillard
reaction beyond the initial stage, but before melanoidins are detectable (Friedman and
Kline 1950; Morales and Boekel 1997).
The samples stored at different RH displayed different rates of fluorescent
compound production. PGWPH stored at 65% showed the greatest formation of fluorescent
compounds after 28 days (Figure 13), and the greatest rate of fluorescent compound
formation when fit with a zero-order model (Table 6). The next highest reaction rate and
quantity of fluorescent compounds formed was for WPH stored at 65% RH. PGWPH and
WPH stored at 31% RH significantly (P < 0.05) differed in the quantity of fluorescent
compounds formed, but not in the rate at which they were formed. Both the rate and the
quantity of fluorescent compounds formed after 28 days were minimal.
82
Though production of fluorescent compounds is indicative of more than one
chemical reaction including lipid oxidation, in this case it is likely that production of
fluorescent compounds was primarily due to progression to the intermediate stages of
Maillard reaction, given that the fat content was minimal (<0.5%, by manufacturer’s
specifications). The high quantity and significantly (P < 0.05) higher rate constant
observed for PGWPH stored at 65% RH, suggests that at least in part, initial MRPs were
able to progress to the intermediate stage of the reaction. However, it is still unclear
whether this was due to MRPs newly formed during this storage study, or whether it was
progression of the initial-stage MRPs generated during glycation of PGWPH. The
moderate concentration of fluorescent compounds formed in WPH stored at 65% RH was
also of interest, as it suggests that the Maillard reaction was also occurring, but to a lesser
extent, in the protein powder. The WPH used in this study contains less than 1% lactose
(by manufacturer’s specifications), but due to its small size and consequent high reducing
power, even a small concentration of the lactose could result in significant Maillard
reaction over time when stored in conditions that promote the reaction, such as high
temperature and humidity. Other researchers have also observed increases in fluorescence
and Maillard reaction progression during storage of dry protein powders with low reducing
compound concentrations (Rao and Labuza 2012; Gillman 2014).
83
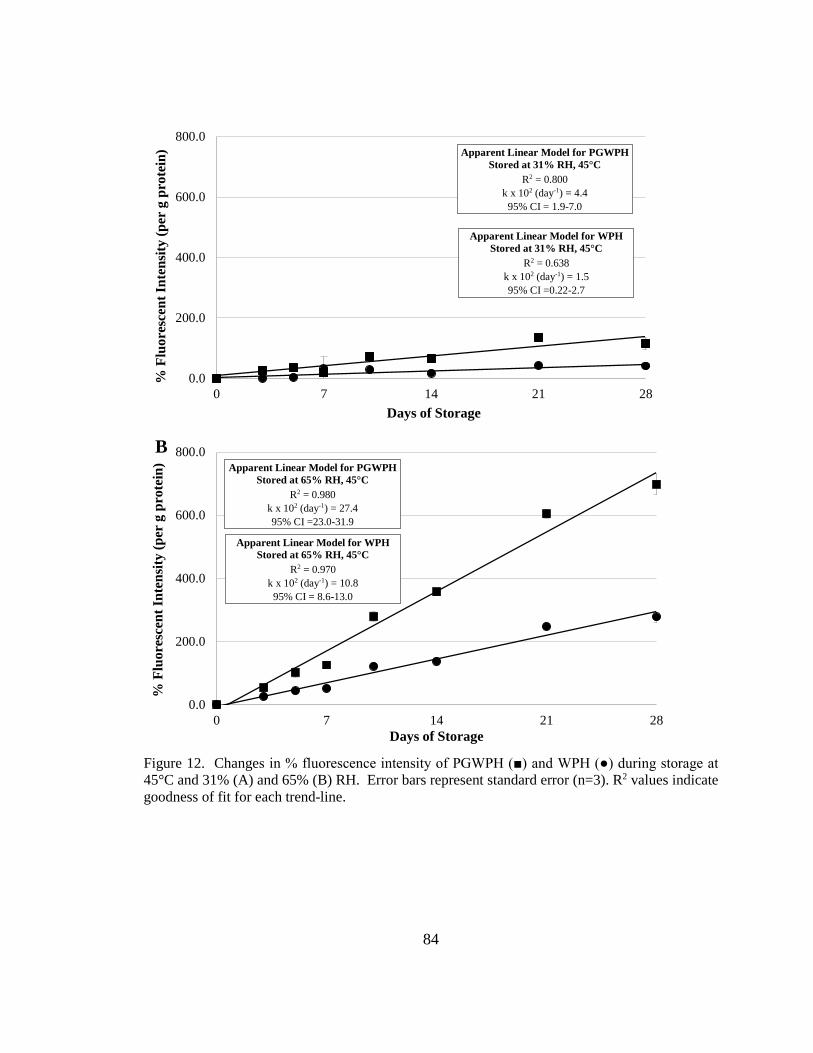
Figure 12. Changes in % fluorescence intensity of PGWPH (■) and WPH (●) during storage at 45°C and 31% (A) and 65% (B) RH. Error bars represent standard error (n=3). R2 values indicate goodness of fit for each trend-line.
0.0
200.0
400.0
600.0
800.0
0 7 14 21 28
% F
luor
esce
nt In
tens
ity (p
er g
pro
tein
)
Days of Storage
0.0
200.0
400.0
600.0
800.0
0 7 14 21 28
% F
luor
esce
nt In
tens
ity (p
er g
pro
tein
)
Days of Storage
B
Apparent Linear Model for WPH Stored at 65% RH, 45°C
R2 = 0.970 k x 102 (day-1) = 10.8
95% CI = 8.6-13.0
Apparent Linear Model for PGWPH Stored at 65% RH, 45°C
R2 = 0.980 k x 102 (day-1) = 27.4 95% CI =23.0-31.9
Apparent Linear Model for WPH Stored at 31% RH, 45°C
R2 = 0.638 k x 102 (day-1) = 1.5 95% CI =0.22-2.7
Apparent Linear Model for PGWPH Stored at 31% RH, 45°C
R2 = 0.800 k x 102 (day-1) = 4.4
95% CI = 1.9-7.0
84
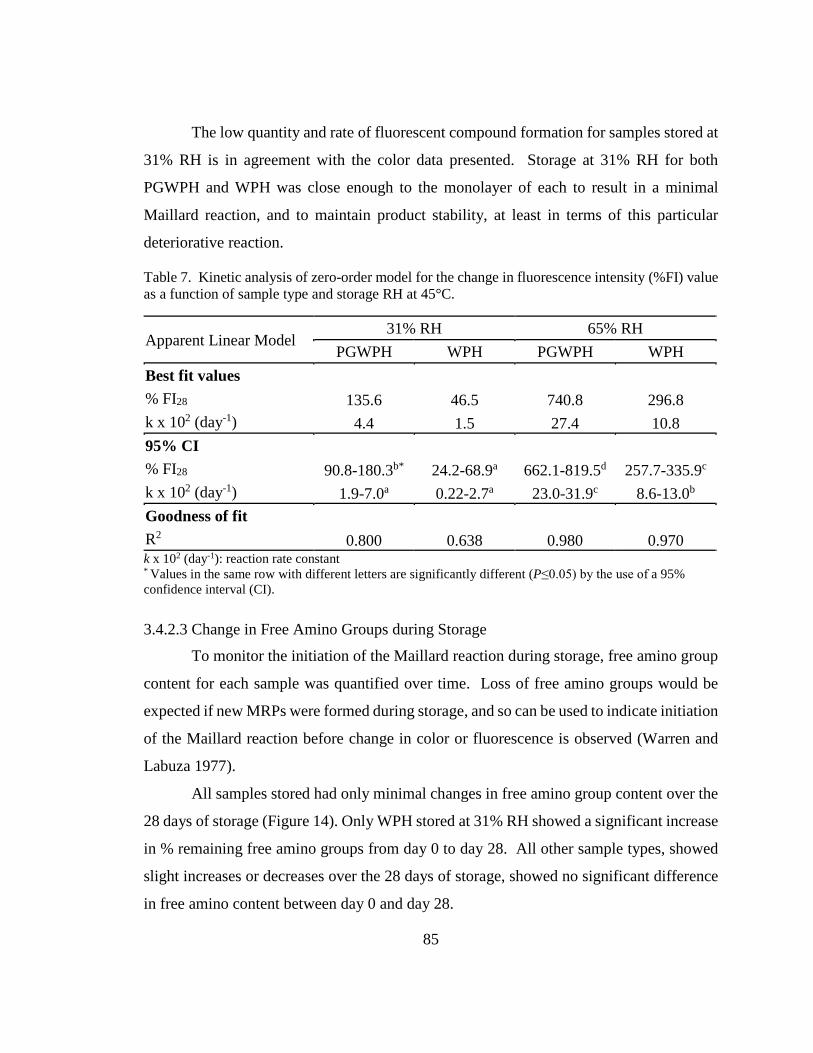
The low quantity and rate of fluorescent compound formation for samples stored at
31% RH is in agreement with the color data presented. Storage at 31% RH for both
PGWPH and WPH was close enough to the monolayer of each to result in a minimal
Maillard reaction, and to maintain product stability, at least in terms of this particular
deteriorative reaction.
Table 7. Kinetic analysis of zero-order model for the change in fluorescence intensity (%FI) value as a function of sample type and storage RH at 45°C.
Apparent Linear Model 31% RH 65% RH
PGWPH WPH PGWPH WPH Best fit values % FI28 135.6 46.5 740.8 296.8 k x 102 (day-1) 4.4 1.5 27.4 10.8 95% CI % FI28 90.8-180.3b* 24.2-68.9a 662.1-819.5d 257.7-335.9c k x 102 (day-1) 1.9-7.0a 0.22-2.7a 23.0-31.9c 8.6-13.0b Goodness of fit R2 0.800 0.638 0.980 0.970 k x 102 (day-1): reaction rate constant * Values in the same row with different letters are significantly different (P≤0.05) by the use of a 95% confidence interval (CI).
3.4.2.3 Change in Free Amino Groups during Storage
To monitor the initiation of the Maillard reaction during storage, free amino group
content for each sample was quantified over time. Loss of free amino groups would be
expected if new MRPs were formed during storage, and so can be used to indicate initiation
of the Maillard reaction before change in color or fluorescence is observed (Warren and
Labuza 1977).
All samples stored had only minimal changes in free amino group content over the
28 days of storage (Figure 14). Only WPH stored at 31% RH showed a significant increase
in % remaining free amino groups from day 0 to day 28. All other sample types, showed
slight increases or decreases over the 28 days of storage, showed no significant difference
in free amino content between day 0 and day 28.
85
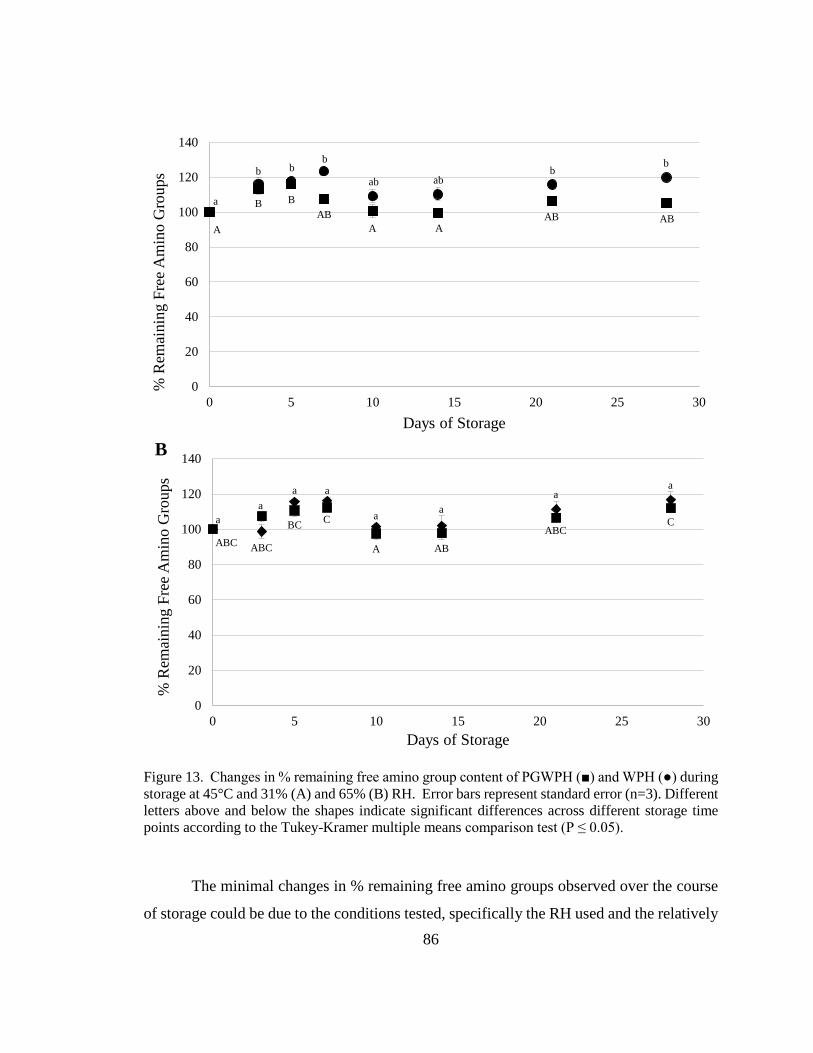
Figure 13. Changes in % remaining free amino group content of PGWPH (■) and WPH (●) during storage at 45°C and 31% (A) and 65% (B) RH. Error bars represent standard error (n=3). Different letters above and below the shapes indicate significant differences across different storage time points according to the Tukey-Kramer multiple means comparison test (P ≤ 0.05).
The minimal changes in % remaining free amino groups observed over the course
of storage could be due to the conditions tested, specifically the RH used and the relatively
0
20
40
60
80
100
120
140
0 5 10 15 20 25 30
% R
emai
ning
Fre
e Am
ino
Gro
ups
Days of Storage
0
20
40
60
80
100
120
140
0 5 10 15 20 25 30
% R
emai
ning
Fre
e Am
ino
Gro
ups
Days of Storage
a
b b b
ab ab b
A
B B AB
A A AB
b
AB
a a a
a a a
C
A AB
ABC
a BC
ABC ABC
a
C
B
86
short length of the study. Loss of free amino groups in soy protein hydrolysate was most
pronounced at 79% RH, over a longer storage period (Gillman 2014); however, at several
other RH conditions, no significant change in free amino group content was observed.
There are also several factors that may have contributed to the lack of changes in
free amino group content observed. For one, Amadori compound rearrangement products
formed during the intermediate stage of the Maillard reaction may regenerate free amino
groups through deamidation, fission, or dehydration reactions (Wolf et al., 1977; Labuza
& Massaro, 1990; Baisier & Labuza, 1992). Also, microbial proteases could have been
introduced that could result in protein cleavage and production of new free terminal
amines. However, it may just be that no new Maillard reaction was initiated during the
time period of the study, and that changes in color and fluorescence are due to progression
of MRPs already present at the beginning of storage rather than generation of new ones.
Potentially a combination of all three of these factors may have contributed to the lack of
change in % remaining free amino groups during storage of PGWPH and WPH.
3.4.3 Measurement of Protein/Peptide Aggregation during Accelerated Shelf-life Testing of PGWPH
3.4.3.1 Changes in Peptide Profile during Storage
The intermediate and advanced stages of the Maillard reaction can stimulate protein
polymerization (Zamora and Hidalgo 2005; Zhou et al. 2013), so as intermediate and
advanced MRPs were detected in PGWPH and WPH during storage it was important to
monitor aggregation during storage due to this covalent polymerization. Polymerization,
and thus change in protein/peptide molecular size, was monitored during storage using
SDS-PAGE under reducing conditions. The use of reducing conditions and SDS disrupted
disulfide and hydrophobic interactions, respectively, allowing for the observation of any
non-disulfide covalent interactions that could have been formed.
87
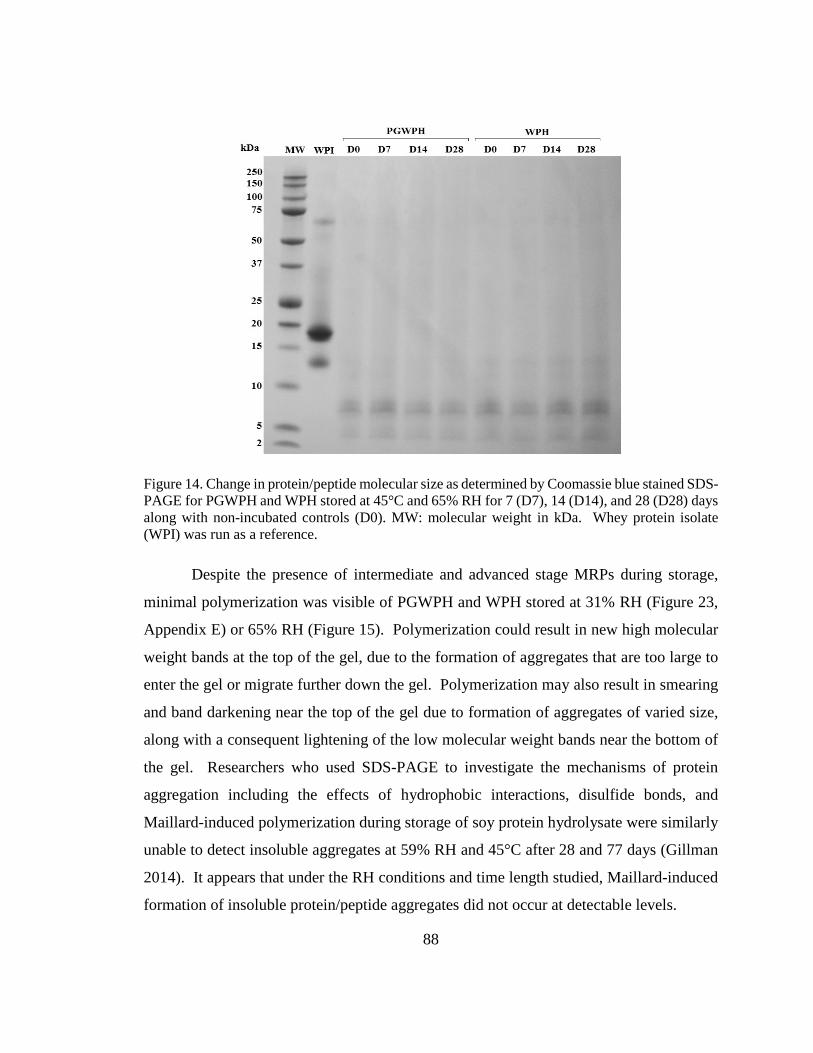
Figure 14. Change in protein/peptide molecular size as determined by Coomassie blue stained SDS-PAGE for PGWPH and WPH stored at 45°C and 65% RH for 7 (D7), 14 (D14), and 28 (D28) days along with non-incubated controls (D0). MW: molecular weight in kDa. Whey protein isolate (WPI) was run as a reference.
Despite the presence of intermediate and advanced stage MRPs during storage,
minimal polymerization was visible of PGWPH and WPH stored at 31% RH (Figure 23,
Appendix E) or 65% RH (Figure 15). Polymerization could result in new high molecular
weight bands at the top of the gel, due to the formation of aggregates that are too large to
enter the gel or migrate further down the gel. Polymerization may also result in smearing
and band darkening near the top of the gel due to formation of aggregates of varied size,
along with a consequent lightening of the low molecular weight bands near the bottom of
the gel. Researchers who used SDS-PAGE to investigate the mechanisms of protein
aggregation including the effects of hydrophobic interactions, disulfide bonds, and
Maillard-induced polymerization during storage of soy protein hydrolysate were similarly
unable to detect insoluble aggregates at 59% RH and 45°C after 28 and 77 days (Gillman
2014). It appears that under the RH conditions and time length studied, Maillard-induced
formation of insoluble protein/peptide aggregates did not occur at detectable levels.
88
3.4.3.2 Changes in Surface Hydrophobicity during Storage
As hydrophobic interactions are one of the primary mechanisms of protein/peptide
aggregation (Costantino et al. 1994), the surface hydrophobicity index of PGWPH and
WPH stored samples was determined. A decrease in surface hydrophobicity index would
be expected if proteins/peptides were aggregating based upon hydrophobic interactions, as
less hydrophobic regions would be available for the hydrophobic probe used to bind.
For the most part, however, neither PGWPH nor WPH showed any significant
decrease in surface hydrophobicity over storage time, or at either of the RH conditions
(Figure 16). This observation suggests that if protein/peptide aggregation did occur,
hydrophobic interactions were not a major contributor. Both WPH and PGWPH
experienced slight decreases in surface hydrophobicity with storage, particularly when
stored at 65% RH, however, these differences were, for the most part, not statistically
significant.
It was hypothesized that glycation might reduce protein/peptide aggregation during
storage due to the various physical and chemical changes that occur with glycation. Several
researchers observed a decrease in surface hydrophobicity of glycated protein (Nacka et al.
1998; Mu et al. 2006; Wang and Ismail 2012), which was attributed to the blockage of
hydrophobic regions upon glycation, and increased surface hydrophilicity via increased net
negative charge and attachment of hydrophilic carbohydrate-moieties. However,
researchers also observed an increase in surface hydrophobicity of casein-glucose and milk
protein-lactose conjugates, which was attributed to an increase protein unfolding due to
loss of tertiary structure upon glycation, and to the conditions (temperature, aw) used to
initiate glycation (Hiller and Lorenzen 2010). Thus, the effects of protein glycation on
surface hydrophobicity may depend on the protein and carbohydrate source, among other
factors.
89

Figure 16. Changes in surface hydrophobicity (S0) of PGWPH (A) and WPH (B) during storage at 31% and 65% RH and 45°C. Error bars represent standard error (n=3). Different letters above the bars indicate significant differences across different storage time points and within each %RH condition according to the Tukey-Kramer multiple means comparison test (P ≤ 0.05). An asterisk above bars of a time point indicates a significant difference within each % RH condition according to the Tukey-Kramer multiple means comparison test (P ≤ 0.05).
0
500
1000
1500
2000
2500
3000
0 7 14 28
Surf
ace
Hyd
roph
obic
ity In
dex
(S0)
Days of Storage
31% RH 65% RH
a,A a aaA
A A
0
500
1000
1500
2000
2500
3000
0 7 14 28
Surf
ace
Hyd
roph
obic
ity In
dex
(S0)
Days of Storage
31% RH 65% RH
a,A aa a
BA A
*
A
B
90
3.4.3.3 Changes in Solubility and Thermal Stability during Storage
To quantify insoluble aggregation during storage, solubility of PGWPH and WPH
was measured under several conditions. A reduction in solubility between day 0 and day
28 would be expected if insoluble aggregates were formed.
For the most part, no significant changes in solubility over time were observed for
any of the samples or conditions tested (Figure 17). Both WPH and PGWPH displayed
excellent solubility in water, approximately 100%, after 28 days of storage. However, after
a 30 minute heat treatment at 80°C and pH 4.5 (near the isoelectric point of whey protein)
the solubility of WPH was markedly reduced to below 40%, while solubility was
maintained at approximately 100% for PGWPH. Enhanced solubility at pH close to the
isoelectric point has previously been observed by other researchers who have glycated
intact whey proteins (Wang and Ismail 2012), and so it is promising to see that this property
is maintained upon glycation and throughout extended storage of whey protein
hydrolysates. After a similar heat treatment at pH 3.4, PGWPH and WPH again maintained
100% of their solubility, which was not affected significantly by storage under any of the
conditions studied.
It was initially hypothesized that a change in solubility might be observed in the
stored samples, particularly at 65% RH due to increased protein/peptide mobility and
potential for formation of intermolecular covalent or noncovalent bonds as seen by other
researchers (Zhou and Labuza 2007; Gillman 2014). It must be noted that protein solubility
in this study was measured at 2.5% protein concentration, which may have been too dilute
to detect changes in solubility for whey protein, which displays excellent solubility
ordinarily. However, the combined results of the peptide profile, surface hydrophobicity
index, and solubility measurements suggest that aggregation did not occur under the RH
conditions and time span studied. Other researchers investigating the storage stability of a
similar WPH to what was used in this study only noted a significant decrease in solubility
at 45°C over 2 weeks when stored at RH in excess of 70% (Zhou and Labuza 2007). These
authors found no formation of insoluble aggregates for intact WPI upon storage at 45°C
and over a wide range of RH (11-85%) for up to 2 weeks, but they found high formation
91
of insoluble aggregates (>50% solubility loss) in WPH when stored at RH in excess of
70%.
Figure 17. Solubility after 0 and 28 days of storage at 45°C and at 31% and 65%
RH of: PGWPH (A) and WPH (B) in water and at pH 4.5 and 3.4 after heat treatment. Error bars represent standard error (n=3). Different letters above the bars indicate significant differences in solubility at a specific pH and % RH between day 0 and 28 according to the Tukey-Kramer multiple means comparison test (P ≤ 0.05).
0
20
40
60
80
100
120
% S
olub
ility
28 Days of Storage0 Days of Storage
31% RH 65% RH
0
20
40
60
80
100
120
% S
olub
ility
28 Days of Storage0 Days of Storage
31% RH 65% RH
qa,A Q
x X
aAq,Q
x,X
a,A a A x,X x
X q,Q q Q
A
B
92

When the authors investigated the mechanisms of solubility loss, they found that
disulfide interactions were the main contributor to the observed loss, with hydrophobic
interactions also playing a small part. This suggests that aggregation is still a problem for
WPH powders at severe temperature and RH conditions, and glycation may still show
promise as a technique to reduce moisture-induced protein/peptide aggregation since it is
able to sterically, or otherwise limit the formation of intermolecular disulfide interactions.
Therefore, further storage studies must be conducted at more severe RH conditions for
longer periods of time followed by testing of solubility and aggregation at higher protein
concentrations to fully understand the effects of protein glycation on aggregation of whey
protein hydrolysates.
3.5 Conclusions
A controlled study of PGWPH and WPH stored at 45°C and 31% /65% RH for up
to 28 days was carried out to evaluate the effects of partial glycation of WPH on production
of new MRPs, progression of the initial-stage MRPs generated upon production of
PGWPH, and moisture-induced protein/peptide aggregation. Greatest change in color, and
formation of fluorescent compounds was observed for the samples stored at 65% RH, with
PGWPH experiencing the most change, likely due to progression of the initial-stage MRPs
generated upon production of PGWPH to advanced stages of the reaction. Formation of
insoluble aggregates, or changes in surface hydrophobicity index could not be detected at
the conditions studied. Further studies must be done to fully understand the effects of
protein glycation on aggregation of whey protein hydrolysates. However, this work shows
that partially-glycated products of WPH in particular, experience minimal deteriorative
reactions during controlled storage, specifically below 65% RH and 45°C, which is
promising for the advancement of protein glycation as a novel protein-enhancement
technique.
93
4. Overall Conclusions, Implications, and Recommendations
This work has shown that low-level Maillard-induced glycation of WPH can be
achieved under the conditions studied without progression to the advanced stages of the
Maillard reaction. It also showed that partial glycation of WPH has minimal effect on the
nutritional quality of the protein. This maintenance of nutritional quality is vital if
Maillard-glycation is to have wider application in the production of value-added products.
This study also showed that the use of membrane filtration and HIC adequately
removed free dextran allowing for the production of glycated whey protein hydrolysate.
However, as the process was cumbersome and resulted in mediocre protein yields a more
efficient process must be developed to save time and inputs, while increasing product yield
and limiting waste streams, to best fit industrial demands. It is also important that this
improved separation process retain as many peptides as possible, as peptides are primarily
responsible for the enhanced health and functional properties of protein hydrolysates. It is
vital that the procedure developed for removal of free dextran be designed with industrial
feasibility in mind if Maillard-glycation is to be used for the production of real-world
ingredients. Industrial feasibility necessitate limited waste streams, high throughput, and
efficient processes. Separation protocol improvement is currently in the works, and will
address each of these issues.
The findings of this study also showed that deteriorative reactions including
progression of MRPs to advanced stages and moisture-induced protein/peptide aggregation
of glycated whey protein hydrolysate were minimal during storage at 31% RH, near the
monolayer of PGWPH. This finding affirms the importance of storage at or near the
monolayer for protein hydrolysate powders. On the other hand, this work also showed that
progression of initial-stage MRPs, generated upon production of PGWPH, to advanced
stages can occur when environmental RH is high. This is important to note, and must be
taken into consideration in future studies and in the development of protein-glycation
technology for the production of commercial ingredients. As high environmental RH may
occur in the real world due to non-ideal distribution or storage conditions both for the
industrial ingredient, and as the finished consumer product, it is important that glycated 94
proteins retain their nutritional and functional quality during storage if this technology is
to make the transition from bench-top to industrial-scale production.
Finally, this study highlighted the excellent solubility at various pH conditions
including the isoelectric point of whey protein and high resilience of glycated whey protein
hydrolysate to environmental conditions, as no moisture-induced aggregation was
observed under the storage conditions and time period studied. This enhanced stability
suggests that whey protein is a promising candidate for future protein-glycation work and
has a great potential for industrial application. However, as previous research has indicated
that the formation of insoluble aggregates is exacerbated with protein hydrolysis when
stored at higher RH, glycation may still show promise as a technique to reduce moisture-
induced protein/peptide aggregation. Further studies at higher RH and over longer periods
of time must be done to fully understand the effects of protein glycation on aggregation of
whey protein hydrolysates.
This study has laid the ground-work for future studies on the industrial feasibility
of glycation, the application of Maillard glycation to other protein hydrolysates for greater
functionality improvements, and the stability of protein hydrolysates during storage. With
this work, the collective knowledge on Maillard-glycation and stability of hydrolysates is
expanded.
95

Comprehensive Bibliography
Adhikari, HR. 1973. Fluorescent products in a glucose-glycine browning reaction.
Journal of Food Science 38: 486–488.
Affertsholt, T. 2009. International Whey Market Overview. In 3A Business Consulting
(ed.), Annual Conference of the American Dairy Products Institute. Chicago, IL,
USA.
Affertsholt, T. 2010. The World Market for Dairy Bioactive Ingredients 2009-2012. In
3A Business Consulting (ed.), 12th Annual Dairy Ingredients Symposium. San
Fancisco, CA, USA.
Akhtar, M and Dickinson, E. 2003. Emulsifying properties of whey protein–dextran
conjugates at low pH and different salt concentrations. Colloids and Surfaces B:
Biointerfaces 31(1-4): 125–132.
Akhtar, M and Dickinson, E. 2007. Whey protein–maltodextrin conjugates as
emulsifying agents: an alternative to gum arabic. Food Hydrocolloids 21(4): 607–
616.
Alder-Nissen, J. 1986. Enzymatic Hydrolysis of Food Proteins. New York City, NY,
USA: Elsevier Applied Science Publishers.
Althouse, PJ, Dinakar, P and Kilara, A. 1995. Screening of Proteolytic Enzymes to
Enhance Foaming of Whey Protein Isolates. Journal of Food Science 60(5): 1110–
1112.
Alting, AC, Hamer, RJ, G, de KC and Visschers, RW. 2000. Formation of disulfide
bonds in acid-induced gels of preheated whey protein isolate. Journal of
Agricultural and Food Chemistry 48(10): 5001–5007.
96
Ames, JM. 1992. The Maillard reaction. In B. J. F. Hudson (ed.), Biochemistry of Food
Proteins. London, U.K.: Elsevier Applied Science.
Anderson, GH and Moore, SE. 2004. Dietary Proteins in the Regulation of Food Intake
and Body Weight in Humans. The Journal of Nutrition 134: 974–979.
Baisier, WM and Labuza, TP. 1992. Maillard browning kinetics in a liquid model system.
Journal of Agricultural and Food Chemistry 40(5): 707–713.
Boirie, Y, Dangin, M, Gachon, Pi, Vasson, M-P, Maubois, J-L and Beaufrere, B. 1997.
Slow and fast dietary proteins differently modulate postprandial protein accretion.
Proceedings of the National Academy of Sciences 94: 14930–14935.
Brands, CM, Alink, GM, van Boekel, M a and Jongen, WM. 2000. Mutagenicity of
heated sugar-casein systems: effect of the Maillard reaction. Journal of Agricultural
and Food Chemistry 48(6): 2271–5.
Bryant, CM and McClements, DJ. 2000. Influence of NaCl and CaCl2 on cold-set
gelation of heat-denatured whey protein. Journal of Food Science 65(5): 801–804.
Burton, HS, McWeeny, DJ and Biltcliffe, DO. 1963. Non-enzymic browning
development of chromophores in the glucose-glycine and sucrose-glycine systems.
Journal of Food Science 28(6): 631–639.
Calligaris, S, Manzocco, L, Anese, M and Nicoli, MC. 2004. Effect of heat-treatment on
the antioxidant and pro-oxidant activity of milk. International Dairy Journal 14:
421–427.
Caric, M. 1993. Concentrated and Dried Dairy Milk Products. In Y. H. Hui (ed.), Dairy
Science and Technology Handbook: Vol. 2. Product Manufacturing. New York:
VCH Publishers.
97

Castilho, RF, Meinicke, AR, Almeida, AM, Hermeslima, M and Vercesi, AE. 1994.
Oxidative damage of mitochondria induced by Fe (II) citrate is potentiated by Ca 2+
and includes lipid peroxidation and alterations in membrane proteins. Archives of
Biochemistry and Biophysics 308(1): 158–163.
Cheison, SC, Wang, Z and Xu, SY. 2007a. Preparation of whey protein hydrolysates
using a single- and two-stage enzymatic membrane reactor and their immunological
and antioxidant properties: Characterization by multivariate data analysis. Journal of
Agricultural and Food Chemistry 55: 3896–3904.
Cheison, SC, Wang, Z and Xu, SY. 2007b. Use of response surface methodology to
optimise the hydrolysis of whey protein isolate in a tangential flow filter membrane
reactor. Journal of Food Engineering 80: 1134–1145.
Chevalier, F, Chobert, J, Dalgalarrondo, M and Haertle, T. 2001. Characterization of the
Maillard reaction products of B-lactoglobulin glucosylated in mild conditions.
Journal of Food Biochemistry 25: 33–55.
Chevalier, F, Chobert, J-M, Popineau, Y, Georgette, M and Haertle, T. 2001.
Improvement of functional properties of b-lactoglobulin glycated through the
Maillard reaction is related to the nature of the sugar. International Dairy Journal
11: 145–152.
Clemente, A. 2001. Enzymatic protein hydrolysates in human nutrition. Trends in Food
Science & Technology 11(2000): 254–262.
Corzo-Martinez, M, Moreno, FJ, Olano, A and Villamiel, M. 2008. Structural
characterization of bovine b-lactoglobulin-galactose/tagatose Maillard complexes by
electrophoretic, chromatographic, and spectroscopic methods. Journal of
Agricultural and Food Chemistry (56): 4244–4252.
98
Costantino, HR, Langer, R and Klibanov, AM. 1994. Moisture-induced aggregation of
lyophilized insulin. Pharmaceutical Research 11(1): 21–29.
Creusot, N and Gruppen, H. 2007. Enzyme-induced aggregation and gelation of proteins.
Biotechnology Advances 25(6): 597–601.
Creusot, N and Gruppen, H. 2008. Hydrolysis of whey protein isolate with Bacillus
licheniformis protease: aggregating capacities of peptide fractions. Journal of
Agricultural and Food Chemistry 56(21): 10332–9.
Creusot, N, Gruppen, H, van Koningsveld, G a., de Kruif, CG and Voragen, AGJ. 2006.
Peptide–peptide and protein–peptide interactions in mixtures of whey protein isolate
and whey protein isolate hydrolysates. International Dairy Journal 16(8): 840–849.
Damodaran, S. 1994. Structure-Function Relationship of Food Proteins. In N.
Hettiarachchy & G. Ziegler (eds.), Protein Functionality in Food Systems. CRC
Press.
Danquah, M and Agyei, D. 2012. Pharmaceutical applications of bioactive peptides. OA
Biotechnology 1(2): 1–7.
De Wit, JN. 1990. Thermal stability and functionality of whey proteins. Journal of Dairy
Science 73(12): 3602–3612.
Dryáková, A, Pihlanto, A, Marnila, P, Čurda, L and Korhonen, HJT. 2010. Antioxidant
properties of whey protein hydrolysates as measured by three methods. European
Food Research and Technology 230(6): 865–874.
Eichner, K and Karel, M. 1971. The influence of water content and water activity on the
sugar-amino browning reaction in model systems under various conditions. Journal
of Agricultural and Food Chemistry 20(2): 218–223.
99
Elwood, PC, Givens, DI, Beswick, AD, Fehily, AM, Pickering, JE and Gallacher, J.
2008. The survival advantage of milk and dairy consumption: an overview of
evidence from cohort studies of vascular diseases, diabetes and cancer. Journal of
the American College of Nutrition 27(6): 723S–34S.
Elwood, PC, Pickering, JE, Ian Givens, D and Gallacher, JE. 2010. The consumption of
milk and dairy foods and the incidence of vascular disease and diabetes: An
overview of the evidence. Lipids 45: 925–939.
Engberink, MF, Hendriksen, MAH, Schouten, EG, van Rooij, FJA, Hofman, A,
Witteman, JCM and Geleijnse, JM. 2009. Inverse association between dairy intake
and hypertension: The Rotterdam Study. American Journal of Clinical Nutrition
89(C): 1877–1883.
Erbersdobler, HF, Brandt, A, Scharrer, E and Wangenheim, B. 1981. Transport and
metabolism studies with fructose amino acids. Progress in Food and Nutrition
Science 5: 257e–263e.
Esmaillzadeh, A and Azadbakht, L. 2010. Dairy consumption and circulating levels of
inflammatory markers among Iranian women. Public health nutrition 13(9): 1395–
1402.
Finot, P. 1990. The Maillard reaction in food processing, human nutrition and
physiology. Springer Science & Business Media.
Finot, PA and Magnenat, E. 1981. Metabolic transit of early and advanced Maillard
products. Progress in Food and Nutrition Science.
Fischer, K. 1935. A new method for the analytical determination of the water content of
liquids and solids. Angew Chem 48(394): 24.
100
FitzGerald, RJ and Meisel, H. 2003. Milk Protein Hydrolysates and Bioactive Peptides.
In P. F. Fox & P. L. H. McSweeney (eds.), Advanced Dairy Chemistry: Vol. 1.
Proteins (3rd ed.). New York: Kluwer Academic/Plenum Publishers.
Foegeding, EA, Davis, JP, Doucet, D and McGuffey, MK. 2002. Advances in modifying
and understanding whey protein functionality. Trends in Food Science &
Technology 13(5): 151–159.
Fox, PF. 2003. Milk Proteins: General and Historical Aspects. In P. F. Fox & P. L. H.
McSweeney (eds.), Advanced Dairy Chemistry: Vol. 1. Proteins (3rd ed.). New
York: Kluwer Academic/Plenum Publishers.
Frost & Sullivan. 2013. Market overview of the global protein ingredients market.
Funtenberger, S, Dumay, E and Cheftel, JC. 1997. High pressure promotes b-
lactoglobulin aggregation through SH/S-S interchange reactions. Journal of
Agricultural and Food Chemistry (45): 912–921.
Gardner, HW. 1979. Lipid hydroperoxide reactivity with proteins and amino acids: A
review. Journal of Agricultural and Food Chemistry 27(2): 220–229.
Gillman, L. 2014. The Impact of Moisture-Induced Aggregation of Soy Protein
Hydrolysate during Storage on Product and Nutritional Quality. University of
Minnesota.
Goodno, CC, Swaisgood, HE and Catignani, GL. 1981. A fluorimetric assay for available
lysine in proteins. Analytical Biochemistry 115: 203–211.
Groleau, PE, Gauthier, SF and Pouliot, Y. 2003. Effect of residual chymotryptic activity
in a trypsin preparation on peptide aggregation in a β-lactoglobulin hydrolysate.
International Dairy Journal 13(11): 887–895.
101
Guadix, A, Camacho, F and Guadix, EM. 2006. Production of whey protein hydrolysates
with reduced allergenicity in a stable membrane reactor. Journal of Food
Engineering 72(4): 398–405.
Hall, WL, Millward, DJ, Long, SJ and Morgan, LM. 2003. Casein and whey exert
different effects on plasma amino acid profiles, gastrointestinal hormone secretion
and appetite. The British Journal of Nutrition 89(2): 239–48.
Halton, TL and Hu, FB. 2004. The effects of high protein diets on thermogenesis, satiety
and weight loss: a critical review. Journal of the American College of Nutrition
23(5): 373–385.
Hattori, M, Ogino, A, Nakai, H and Takahashi, K. 1997. Functional Improvement of -
Lactoglobulin by Conjugating with Alginate Lyase-Lysate 703–708.
Havea, P, Singh, H and Creamer, LK. 2002. Heat-induced aggregation of whey proteins:
comparison of cheese wpc with acid wpc and relevance of mineral composition.
Journal of Agricultural and Food Chemistry (50): 4674–4681.
Hiller, B and Lorenzen, PC. 2010. Functional properties of milk proteins as affected by
Maillard reaction induced oligomerisation. Food Research International 43(4):
1155–1166.
Hodge, JE. 1953. Chemistry of Browning Reactions in Model Systems. Journal of
Agricultural and Food Chemistry 1(15): 928–943.
Hopton, JD, Swan, CJ and Trimm, DL. 1989. Liquid-phase oxidation of thiols to
disulfides. Advanced Chemistry Series 75: 216–224.
Horowitz, M, Edelbroek, MAL, Wishart, JM and Straathof, JW. 1993. Relationship
between oral glucose tolerance and gastric emptying in normal healthy subjects.
Diabetologia 36: 857–862. 102
Huang, XL, Catignani, GL and Swaisgood, HE. 1999. Modification of rheological
properties of whey protein isolates by limited proteolysis. Nahrung/Food 43(2): 79–
85.
Hui, YH (ed.). 1993. Dairy Science and Technology Handbook. New York City, USA:
VCH Publishers.
Huncharek, M, Muscat, J and Kupelnick, B. 2009. Colorectal cancer risk and dietary
intake of calcium, vitamin D, and dairy products: a meta-analysis of 26,335 cases
from 60 observational studies. Nutrition and Cancer 61(1): 47–69.
Hurley, WL. 2003. Immunoglobulins in Mammary Secretions. In P. F. Fox & P. L. H.
McSweeney (eds.), Advanced Dairy Chemistry: Vol. 1. Proteins (3rd ed.). New
York: Kluwer Academic/Plenum Publishers.
Ismail, B and Gu, Z. 2010. Whey Protein Hydrolysates : Current Knowledge and
Challenges. Saint Paul, MN, USA.
Jimenez-Castano, L, Lopezfandino, R, Olano, A and Villamiel, M. 2005. Study on β-
lactoglobulin glycosylation with dextran: effect on solubility and heat stability. Food
Chemistry 93(4): 689–695.
Jiménez-Castaño, L, Villamiel, M and López-Fandiño, R. 2007. Glycosylation of
individual whey proteins by Maillard reaction using dextran of different molecular
mass. Food Hydrocolloids 21(3): 433–443.
Jiménez-Castaño, L, Villamiel, M, Martín-Álvarez, PJ, Olano, A and López-Fandiño, R.
2005. Effect of the dry-heating conditions on the glycosylation of β-lactoglobulin
with dextran through the Maillard reaction. Food Hydrocolloids 19(5): 831–837.
Ju, ZY and Kilara, A. 1998. Textural properties of cold-set gels induced from heat-
denatured whey protein isolates. Journal of Food Science 63(2): 288–292. 103
Ju, ZY, Otte, J, Madsen, JS and Qvist, KB. 1995. Effects of Limited Proteolysis on
Gelation and Gel Properties of Whey Protein Isolate. Journal of Dairy Science
78(10): 2119–2128.
Kato, A and Nakai, S. 1980. Hydrophobicity determined by a fluoresence probe method
and its correlation with surface properties of proteins. Biochimica et Biophysica Acta
624: 13–20.
Kearsley, MW. 1978. The control of hygroscopicity, browning and fermentation in
glucose syrups. International Journal of Food Science & Technology 13(4): 339–
348.
Kelly, ALL, O’Connell, JEE and Fox, PFF. 2003. Manufacture and Properties of Milk
Powders. In P. F. Fox & P. L. H. McSweeney (eds.), Advanced Dairy Chemistry:
Vol. 1. Proteins (3rd ed., Vol. 1). New York: Kluwer Academic/Plenum Publishers.
Kikugawa, K and Beppu, M. 1987. Involvement of lipid oxidation products in the
formation of fluorescent and cross-linked proteins. Chemistry and Physics of Lipids
44(2): 277–296.
Kilara, A. 1994. Whey Protein Functionality. In N. Hettiarachchy & G. Ziegler (eds.),
Protein Functionality in Food Systems. CRC Press.
Kitts, DD and Weiler, K. 2003. Bioactive proteins and peptides from food sources.
Applications of bioprocesses used in isolation and recovery. Current
Pharmaceutical Design 9(16): 1309–1323.
Krause, R, Knoll, K and Henle, T. 2003. Studies on the formation of furosine and
pyridosine during acid hydrolysis of different Amadori products of lysine. European
Food Research and Technology 216: 277–283.
104

Kronman, MJ, Andreotti, R and Vitols, R. 1964. Inter- and intramolecular interactions of
a-lactalbumin. II. Aggregation reactions at acid pH. Biochemistry 3(8): 1152–1160.
Kuehler, C a. and Stine, CM. 1974. Effect of Enzymatic Hydrolysis on Some Functional
Properties of Whey Protein. Journal of Food Science 39(2): 379–382.
Labuza, TP and Schmidl, MK. 1986. Advances in the Control of Browning Reactions in
Foods. In O. R. Fennema, W.-H. Chang & C.-Y. Lii (eds.), Role of Chemistry in the
Quality of Processed Food. Westport, Connecticut: Food & Nutrition Press, Inc.
Labuza, TP, Tannenbaum, SR and Karel, M. 1970. Water content and stability of low-
moisture and intermediate-moisture foods. Food Technology.
Laemmli, UK. 1970. Cleavage of structural proteins during the assembly of the head of
bacteriophage T4. Nature 227(5259): 680–185.
Lahl, WJ and Braun, SD. 1994. Enzymatic production of protein hydrolysates for food
use. Food Technology.
Lea, CH and Hannan, RS. 1951. Studies of the reaction between proteins and reducing
sugars in the dry state. Biochimica et Biophysica Acta 3: 313–325.
Levine, H and Slade, L. 1986. A polymer physico-chemical approach to the study of
commercial starch hydrolysis products (SHPs). Carbohydrate Polymers 6: 213–244.
Li, CP, Enomoto, H, Ohki, S, Ohtomo, H and Aoki, T. 2005. Improvement of functional
properties of whey protein isolate through glycation and phosphorylation by dry
heating. Journal of dairy science 88(12): 4137–45.
Liu, WR, Langer, R and Klibanov, AM. 1990. Moisture-induced aggregation of
lyophilized proteins in the solid state. Biotechnology and Bioengineering 37: 177–
184.
105
Liu, X, Powers, JR, Swanson, BG, Hill, HH and Clark, S. 2005. Modification of whey
protein concentrate hydrophobicity by high hydrostatic pressure. Innovative Food
Science & Emerging Technologies 6(3): 310–317.
Luhovyy, BL, Akhavan, T and Anderson, GH. 2007. Whey Proteins in the Regulation of
Food Intake and Satiety. Journal of the American College of Nutrition 26(6): 704S–
712S.
MacLeod, SK. 1991. Moisture determination using Karl Fischer titrations. Analytical
Chemistry 63(10): 557A–566A.
Madsen, JS, Ahmt, TO, Otte, J, Halkier, T and Qvist, KB. 1997. Hydrolysis of B-
lactoglobulin by four different proteinases monitored by capillary electrophoresis
and high performance liquid chromatography. International Dairy Journal 7: 399–
409.
Mangino, ME, Liao, YY, Harper, NJ, Morr, CV and Zadow, JG. 1987. Effects of Heat
Processing on the Functionality of Whey Protein Concentrates. Journal of Food
Science 52(6): 1522–1524.
Matiacevich, S and Pilarbuera, M. 2006. A critical evaluation of fluorescence as a
potential marker for the Maillard reaction. Food Chemistry 95(3): 423–430.
Matoba, T and Hata, T. 1972. Relationship between bitterness of peptides and their
chemical structures. Agricultural and Biological Chemistry 36(8): 1423–1431.
McMahon, DJ, Adams, SL and McManus, WR. 2009. Hardening of high-protein
nutrition bars and sugar/polyol-protein phase separation. Journal of Food Science
74(6): E312–21.
Meisel, H. 1997. Biochemical properties of regulatory peptides derived from milk
proteins. Peptide Science 43(2): 119–128. 106
Merritt, RJ, Carter, M, Haight, M and Eisenberg, LD. 1990. Whey protein hydrolysate
formula for infants with gastrointestinal intolerance to cow milk and soy protein in
infant formulas. Journal of Pediatric Gastroenterology and Nutrition 11: 78–82.
Mintel. 2013. Performance Food and Drink - US - January 2013 (January).
Mishra, S, Mann, B and Joshi, VK. 2001. Functional improvement of whey protein
concentrate on interaction with pectin. Food Hydrocolloids 15: 9–15.
Mleko, S and Foegeding, EA. 2000. pH induced aggregation and weak gel formation of
whey protein polymers. Food Engineering and Physical Properties 65(1): 139–143.
Moro, A, Báez, GD, Ballerini, GA, Busti, PA and Delorenzi, NJ. 2013. Emulsifying and
foaming properties of β-lactoglobulin modified by heat treatment. Food Research
International 51(1): 1–7.
Morr, C V. 1979. Functionality of whey protein products. New Zealand Journal of Dairy
Science and Technology.
Mullally, MM, Callaghan, DMO, Fitzgerald, RJ, Donnelly, WJ and Dalton, JP. 1994.
Proteolytic and Peptidolytic Activities in Commercial Pancreatic Protease
Preparations and Their Relationship to Some Whey Protein Hydrolysate
Characteristics 2973–2981.
Mulvihill, DM and Donovan, M. 1987. Whey proteins and their thermal denaturation - a
review. Irish Journal of Food Science and Technology 11(1): 43–75.
Mulvihill, DM and Ennis, MP. 2003. Functional Milk Proteins: Production and
Utilization. In P. F. Fox & P. L. H. McSweeney (eds.), Advanced Dairy Chemistry:
Vol. 1. Proteins (3rd ed.). New York: Kluwer Academic/Plenum Publishers.
107
Murray, TK and Baker, BE. 1952. Studies on protein hydrolysis. I.—preliminary
observations on the taste of enzymic protein‐hydrolysates. Journal of the Science of
Food and Agriculture 3(10): 470–475.
Mutilangi, W a. M, Panyam, D and Kilara, a. 1996. Functional Properties of Hydrolysates
from Proteolysis of Heat-denatured Whey Protein Isolate. Journal of Food Science
61(2): 270–275.
Nakamura, T, Sado, H, Syukunobe, Y and Hirota, T. 1993. Antigenicity of whey protein
hydrolysates prepared by combination of two proteases. Milchwissenchaft.
National Agricultural Statistics Service. 2014. Dairy Products 2013 Summary.
Washington, DC.
Netto, FM, Desobry, SA and Labuza, TP. 1998. Effect of water content on the glass
transition, caking, and stickiness of protein hydrolysates. International Journal of
Food Properties 1(2): 141–161.
Newport, MJ and Henschel, MJ. 1985. Growth, digestion, and protein metabolism in
neonatal pigs given diets containing whey as the predominant or only source of milk
protein. Journal of Pediatric Gastroeneterology and Nutrition 4: 639–644.
Otte, J, Ju, ZY, Færgemand, M, Lomholt, SB and Qvist, KB. 1996. Protease-Induced
Aggregation and Gelation of Whey Proteins. Journal of Food Science 61(5): 911–
916.
Page, J, Meyer, D, Haines, B, Lagrange, V, Kenney, A and Clark Jr, WS. 2004.
Reference Manual for U.S. Whey and Lactose Products. Arlington, Virginia.
Patel, HA, Singh, H, Havea, P, Considine, T and Creamer, L. 2005. Pressure-induced
unfolding and aggregation of the proteins in whey protein concentrate solutions.
Journal of Agricultural and Food Chemistry (53): 9590–9601. 108
Peña-Ramos, EA, Xiong, YL and Arteaga, GE. 2004. Fractionation and characterisation
for antioxidant activity of hydrolysed whey protein. Journal of the Science of Food
and Agriculture 84(14): 1908–1918.
Perea, A, Ugalde, U, Rodriguez, I and Serra, JL. 1993. Preparation and characterization
of whey protein hydrolysates: applications in industrial whey bioconversion
processes. Enzyme and Microbial Technology 15: 418–423.
Pereira, MA, Jacobs, DR, Van Horn, L, Slattery, ML, Kartashov, AI and Ludwig, DS.
2002. Dairy consumption, obesity, and the insulin resistance syndrome in young
adults. The CARDIA study. Journal of the American Medical Association 11(16):
28–29.
Pouliot, Y, Guy, M-M, Tremblay, M, Gaonac’h, A-C, Chay Pak Ting, BP, Gauthier, SF
and Voyer, N. 2009. Isolation and characterization of an aggregating peptide from a
tryptic hydrolysate of whey proteins. Journal of agricultural and food chemistry
57(9): 3760–4.
Pufulete, M. 2008. Intake of dairy products and risk of colorectal neoplasia. Nutrition
Research Reviews 21: 56–67.
Rabiey, L and Britten, M. 2009. Effect of protein composition on the rheological
properties acid-induced whey protein gels. Food Hydrocolloids 23: 973–979.
Rao, Q, Fisher, MC, Guo, M and Labuza, TP. 2013. Storage stability of a commercial
hen egg yolk powder in dry and intermediate-moisture food matrices. Journal of
Agricultural and Food Chemistry 61(36): 8676–86.
Rao, Q, Kamdar, AK and Labuza, TP. 2013. Storage Stability of Food Protein
Hydrolysates-a Review. Critical reviews in food science and nutrition (August): 37–
41.
109
Rao, Q and Labuza, TP. 2012. Effect of moisture content on selected physicochemical
properties of two commercial hen egg white powders. Food Chemistry 132(1): 373–
384.
Rao, Q, Rocca-Smith, JR, Schoenfuss, TC and Labuza, TP. 2012. Accelerated shelf-life
testing of quality loss for a commercial hydrolysed hen egg white powder. Food
chemistry 135(2): 464–72.
Resmini, P, Pellegrino, L and Batelli, G. 1990. Acurate quantification of furosine in
milks and dairy products by a direct HPLC method. Italian Journal of Food Science
2: 173–183.
Saint-Sauveur, D, Gauthier, SF, Boutin, Y and Montoni, A. 2008. Immunomodulating
properties of a whey protein isolate, its enzymatic digest and peptide fractions.
International Dairy Journal 18: 260–270.
Sava, N, Van der Plancken, I, Claeys, W and Hendrickx, M. 2005. The kinetics of heat-
induced structural changes of beta-lactoglobulin. Journal of dairy science 88(5):
1646–53.
Schägger, H and von Jagow, G. 1987. Tricine-sodium dodecyl sulfate-polyacrylamide gel
electrophoresis for the separation of proteins in the range from 1 to 100 kDa.
Analytical Biochemistry 166(2): 368–79.
Schnickels, RA, Warmbier, HC and Labuza, TP. 1976. Effect of protein substitution on
nonenzymatic browning in an intermediate moisture food system 24(5).
Singh, a. M and Dalgleish, DG. 1998. The Emulsifying Properties of Hydrolyzates of
Whey Proteins. Journal of Dairy Science 81(4): 918–924.
110

Singh, H and Havea, P. 2003. Thermal Denaturation, Aggregation, and Gelation of Whey
Proteins. In P. F. Fox & P. L. H. McSweeney (eds.), Advanced Dairy Chemistry:
Vol. 1. Proteins (3rd ed.). New York: Kluwer Academic/Plenum Publishers.
Sinha, R, Radha, C, Prakash, J and Kaul, P. 2007. Whey protein hydrolysate: Functional
properties, nutritional quality and utilization in beverage formulation. Food
Chemistry 101(4): 1484–1491.
Slade, L, Levine, H and Reid, DS. 1991. Beyond water activity: recent advances based on
an alternative approach to the assessment of food quality and safety. Critical
Reviews in Food Science & Nutrition 30(2): 115–360.
Spellman, D, Kenny, P, O’Cuinn, G and FitzGerald, RJ. 2005. Aggregation properties of
whey protein hydrolysates generated with Bacillus licheniformis proteinase
activities. Journal of agricultural and food chemistry 53(4): 1258–65.
Spotti, MJ, Perduca, MJ, Piagentini, A, Santiago, LG, Rubiolo, AC and Carrara, CR.
2013. Gel mechanical properties of milk whey protein–dextran conjugates obtained
by Maillard reaction. Food Hydrocolloids 31(1): 26–32.
Stamp, JA and Labuza, TP. 1983. Kinetics of the Maillard reaction between aspartame
and glucose in solution at high temperatures. Journal of Food Science 48(2): 543–
544.
Tang, CH, Li, L and Yang, XQ. 2006. Influence of transglutaminase-induced cross-
linking on in vitro digestibility of soy protein isolate. Journal of Food Biochemistry
30: 718–731.
Taoukis, PS, El, MA and Labuza, TP. 1988. Moisture Transfer and Shelf Life of
Packaged Foods. In J. H. Hotchkiss (ed.), Food and Packaging Interactions.
American Chemical Society.
111
The NPD Group. 2014. Protein Perceptions and Needs. Port Washington, NY.
Ting, BPCP, Gauthier, SF and Pouliot, Y. 2007. Fraction of β-lactoglobulin tryptic
peptides using spiral wound nanofiltration membranes. Separation Science and
Technology 42: 2419–2433.
Toledo, E, Delgado-Rodríguez, M, Estruch, R, Salas-Salvadó, J, Corella, D, Gomez-
Gracia, E, … Martínez-González, M a. 2009. Low-fat dairy products and blood
pressure: follow-up of 2290 older persons at high cardiovascular risk participating in
the PREDIMED study. The British Journal of Nutrition 101: 59–67.
Tunick, MH. 2008. Whey Protein Production and Utilization: A Brief History. In C.
Onwulata & P. J. Huth (eds.), Whey Processing, Functionality and Health Benefits.
Blackwell Publishing.
Turgeon, SL, Gauthier, SF and Paquin, P. 1991. Interfacial and emulsifying properties of
whey peptide fractions obtained with a two-step ultrafiltration process. Journal of
Agricultural and Food Chemistry 39(4): 673–676.
UBIC Consulting. 2014. Protein Hydrolysate Ingredient Market. Newport Beach, CA.
Unterhaslberger, G, Schmitt, C, Sanchez, C, Appolonia-Nouzille, C and Raemy, A. 2006.
Heat denaturation and aggregation of β-lactoglobulin enriched WPI in the presence
of arginine HCl, NaCl and guanidinium HCl at pH 4.0 and 7.0. Food Hydrocolloids
20(7): 1006–1019.
Van der Ven, C, Gruppen, H, de Bont, DB a. and Voragen, AGJ. 2001. Emulsion
Properties of Casein and Whey Protein Hydrolysates and the Relation with Other
Hydrolysate Characteristics. Journal of Agricultural and Food Chemistry 49(10):
5005–5012.
112
Van Meijl, LEC. 2010. The role of dairy products and constituents in metabolic risk
management 1–121.
Van Meijl, LEC and Mensink, RP. 2011. Low-fat dairy consumption reduces systolic
blood pressure, but does not improve other metabolic risk parameters in overweight
and obese subjects. Nutrition, Metabolism and Cardiovascular Diseases 21(5): 355–
361.
Van Meijl, LEC, Vrolix, R and Mensink, RP. 2008. Dairy product consumption and the
metabolic syndrome. Nutrition Research Reviews 21: 148–157.
Veldhorst, M, Smeets, A, Soenen, S, Hochstenbach-Waelen, A, Hursel, R, Diepvens, K,
… Westerterp-Plantenga, M. 2008. Protein-induced satiety: effects and mechanisms
of different proteins. Physiology & behavior 94(2): 300–7.
Visschers, RW and de Jongh, HHJ. 2005. Disulphide bond formation in food protein
aggregation and gelation. Biotechnology Advances 23(1): 75–80.
Voutsinas, LP, Cheung, E and Nakai, S. 1983. Relationships of hydrophobicity to
emulsifying properties of heat denatured proteins. Journal of Food Science 48: 26–
32.
Walstra, P, Wouters, JTM and Geurts, TJ. 2006. Dairy Science and Technology (2nd ed.).
Boca Raton, FL, USA: Taylor & Francis Group/CRC Press.
Wang, Q, He, L, Labuza, TP and Ismail, B. 2013. Structural characterisation of partially
glycosylated whey protein as influenced by pH and heat using surface-enhanced
Raman spectroscopy. Food chemistry 139(1-4): 313–9.
Wang, Q and Ismail, B. 2012. Effect of Maillard-induced glycosylation on the nutritional
quality, solubility, thermal stability and molecular configuration of whey protein.
International Dairy Journal 25(2): 112–122. 113
Warmbier, HC, Schnickels, RA and Labuza, TP. 1976. Nonenzymatic Browning Kinetics
in an Intermediate Moisture Model System: Effect of Glucose to Lysine Ratio.
Journal of Food Science 41: 981–983.
Warren, RM and Labuza, TP. 1977. Comparison of chemically measured available lysine
with relative nutritive value measured by a Tetrahymena bioassay during early
stages of nonenzymatic browning. Journal of Food Science 42: 429–431.
Weiss, WF, Young, TM and Roberts, CJ. 2009. Principles, approaches, and challenges
for predicting protein aggregation rates and shelf life. Journal of Pharmaceutical
Sciences 98(4): 1246–1277.
Wolfrom, ML, Kashimura, N and Horton, D. 1974. Factors affecting the Maillard
browning reaction between sugars and amino acids. Journal of Agricultural and
Food Chemistry 22: 791–795.
Yudkoff, M, Daikhin, Y, Nissim, I, Horyn, O, Luhovyy, B, Lazarow, A and Nissim, I.
2005. 4th Amino Acid Assessment Workshop Brain Amino Acid Requirements and
Toxicity : The Example of Leucine 1 , 2.
Zamora, R and Hidalgo, FJ. 2005. Coordinate contribution of lipid oxidation and
Maillard reaction to the nonenzymatic food browning. Critical Reviews in Food
Science and Nutrition 45(1): 49–59.
Zhou, P, Guo, M, Liu, D, Liu, X and Labuza, TP. 2013. Maillard-reaction-induced
modification and aggregation of proteins and hardening of texture in protein bar
model systems. Journal of Food Science 78(3): C437–44.
Zhou, P and Labuza, TP. 2007. Effect of Water Content on Glass Transition and Protein
Aggregation of Whey Protein Powders During Short-Term Storage. Food
Biophysics (2): 108–116.
114
Zhou, P, Liu, D, Chen, X, Chen, Y and Labuza, TP. 2014. Stability of whey protein
hydrolysate powders: Effects of relative humidity and temperature. Food Chemistry
150: 457–62.
Zhou, P, Liu, X and Labuza, TP. 2008a. Moisture-induced aggregation of whey proteins
in a protein/buffer model system. Journal of Agricultural and Food Chemistry
56(6): 2048–54.
Zhou, P, Liu, X and Labuza, TP. 2008b. Effects of moisture-induced whey protein
aggregation on protein conformation, the state of water molecules, and the
microstructure and texture of high-protein-containing matrix. Journal of
Agricultural and Food Chemistry 56(12): 4534–40.
Zhu, D, Damodaran, S and Lucey, JA. 2008. Formation of whey protein isolate (WPI)-
dextran conjugates in aqueous solutions. Journal of Agricultural and Food
Chemistry 56(16): 7113–8.
Zhu, D and Labuza, TP. 2010. Effect of cysteine on lowering protein aggregation and
subsequent hardening of whey protein isolate (WPI) protein bars in WPI/buffer
model systems. Journal of Agricultural and Food Chemistry 58(13): 7970–9.
115
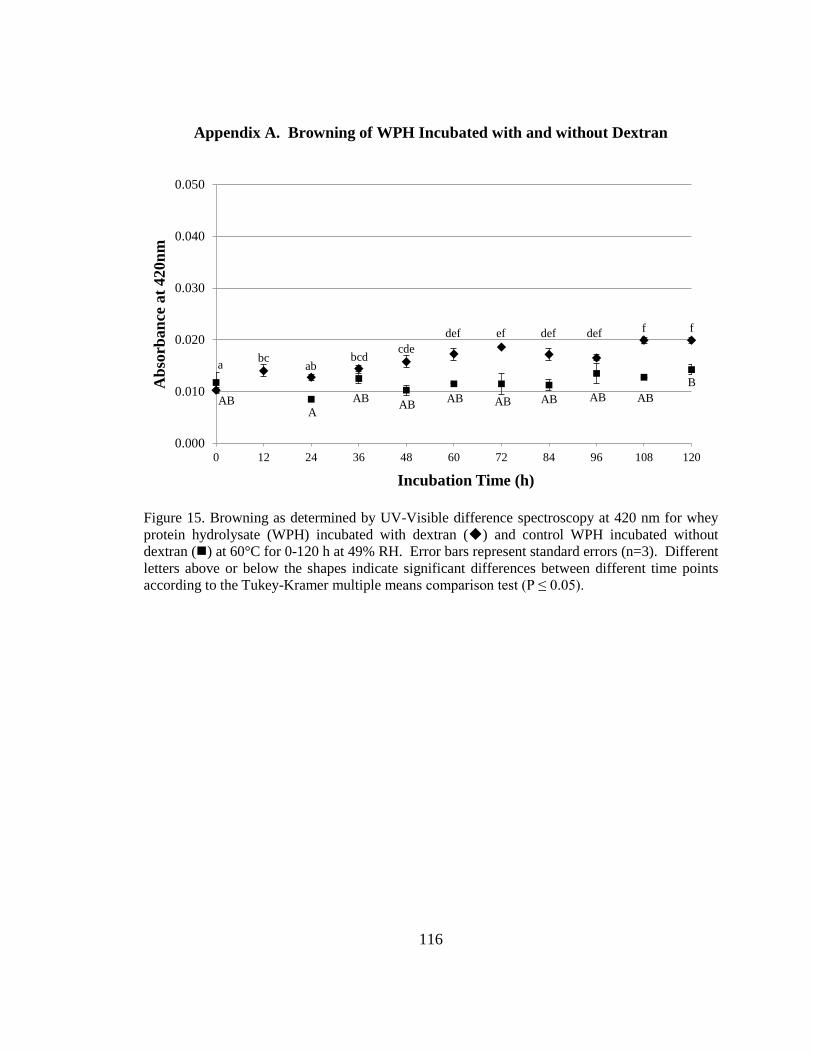
Appendix A. Browning of WPH Incubated with and without Dextran
Figure 15. Browning as determined by UV-Visible difference spectroscopy at 420 nm for whey protein hydrolysate (WPH) incubated with dextran () and control WPH incubated without dextran () at 60°C for 0-120 h at 49% RH. Error bars represent standard errors (n=3). Different letters above or below the shapes indicate significant differences between different time points according to the Tukey-Kramer multiple means comparison test (P ≤ 0.05).
0.000
0.010
0.020
0.030
0.040
0.050
0 12 24 36 48 60 72 84 96 108 120
Abs
orba
nce
at 4
20nm
Incubation Time (h)
A ABAB AB AB AB AB ABB
AB
a bcab
bcdcde
def ef def def fff
116
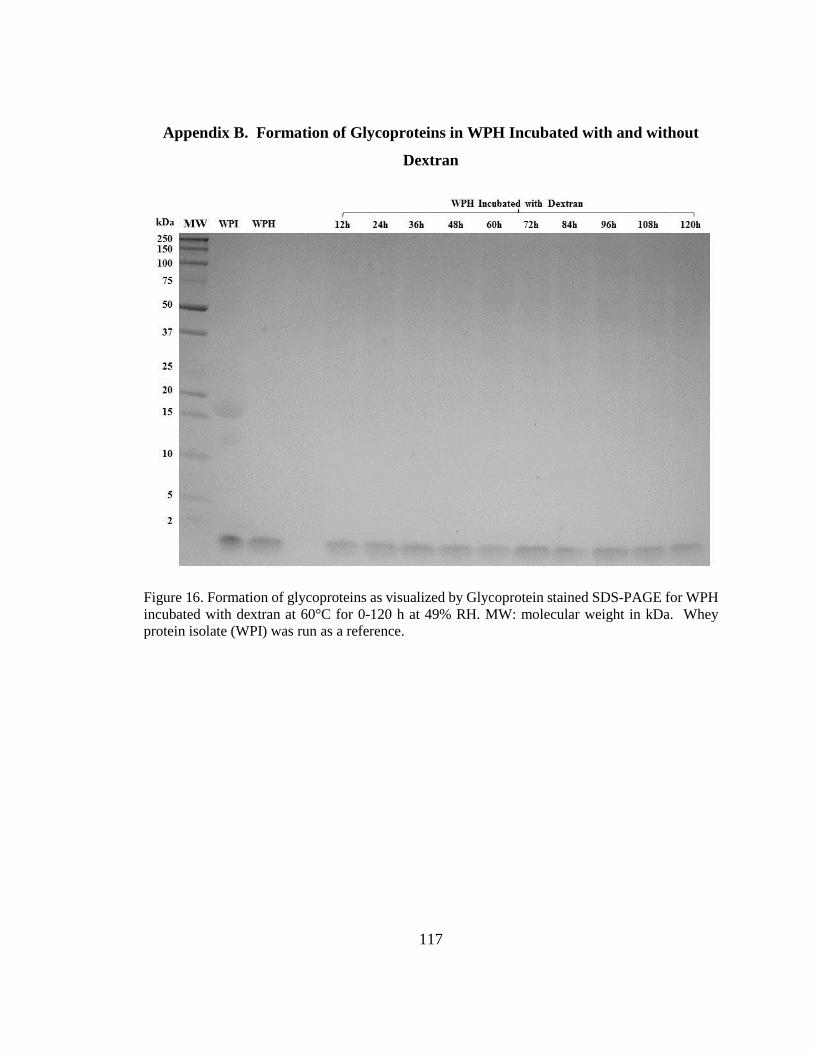
Appendix B. Formation of Glycoproteins in WPH Incubated with and without
Dextran
Figure 16. Formation of glycoproteins as visualized by Glycoprotein stained SDS-PAGE for WPH incubated with dextran at 60°C for 0-120 h at 49% RH. MW: molecular weight in kDa. Whey protein isolate (WPI) was run as a reference.
117
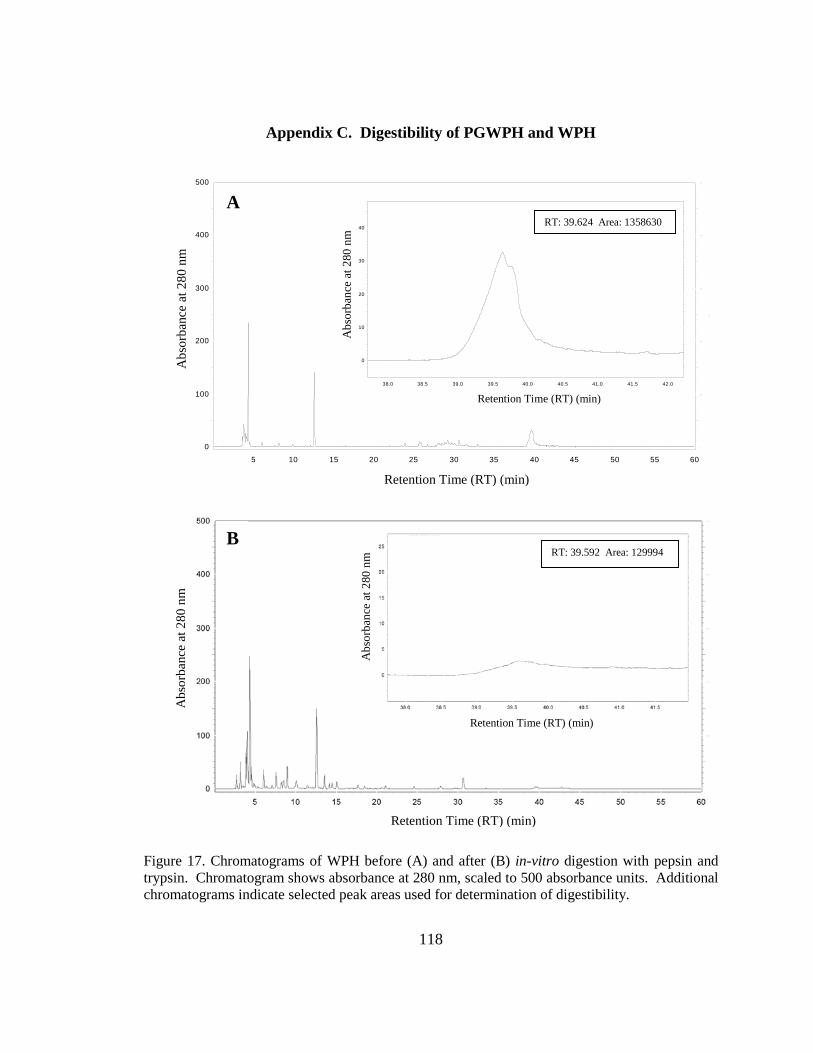
Appendix C. Digestibility of PGWPH and WPH
Figure 17. Chromatograms of WPH before (A) and after (B) in-vitro digestion with pepsin and trypsin. Chromatogram shows absorbance at 280 nm, scaled to 500 absorbance units. Additional chromatograms indicate selected peak areas used for determination of digestibility.
5 10 15 20 25 30 35 40 45 50 55 60
0
100
200
300
400
500
mA
u
0
1 0 0
2 0 0
3 0 0
4 0 0
5 0 0
SPD-M20A-280 nm20141126 WPH Digestibility NonDig 1
Retention TimeArea
Minutes38.0 38.5 39.0 39.5 40.0 40.5 41.0 41.5 42.0
mA
u
0
10
20
30
40
mA
u
0
1 0
2 0
3 0
4 0
SPD-M20A-280 nm20141126 WPH Digestibility NonDig 1
Retention TimeArea RT: 39.624 Area: 1358630
RT: 39.592 Area: 129994
Abs
orba
nce
at 2
80 n
m
Abs
orba
nce
at 2
80 n
m
Retention Time (RT) (min)
Retention Time (RT) (min)
Retention Time (RT) (min)
Abs
orba
nce
at 2
80 n
m
Abs
orba
nce
at 2
80 n
m
Retention Time (RT) (min)
A
B
118

Figure 18. Chromatograms of PGWPH before (A) and after (B) in-vitro digestion with pepsin and trypsin. Chromatogram shows absorbance at 280 nm, scaled to 500 absorbance units. Additional chromatograms indicate selected peak areas used for determination of digestibility.
RT: 39.544 Area: 1613540
RT: 39.540 Area: 122827
Retention Time (RT) (min)
Retention Time (RT) (min)
Abs
orba
nce
at 2
80 n
m
Abs
orba
nce
at 2
80 n
m
Abs
orba
nce
at 2
80 n
m
Abs
orba
nce
at 2
80 n
m
Retention Time (RT) (min)
Retention Time (RT) (min)
A
B
119

Appendix D – Change in a* and b* values of PGWPH and WPH Stored at 45°C and
31%/65% RH
Figure 19. Changes in a* values of PGWPH (■) and WPH (●) during storage at 45°C and 31% (A) and 65% (B) RH. Error bars represent standard error (n=3).
-5.0
-4.0
-3.0
-2.0
-1.0
0.0
1.0
0 7 14 21 28
a* V
alue
Days of Storage
-5.0
-4.0
-3.0
-2.0
-1.0
0.0
1.0
0 7 14 21 28
a* V
alue
Days of Storage
A
B
120
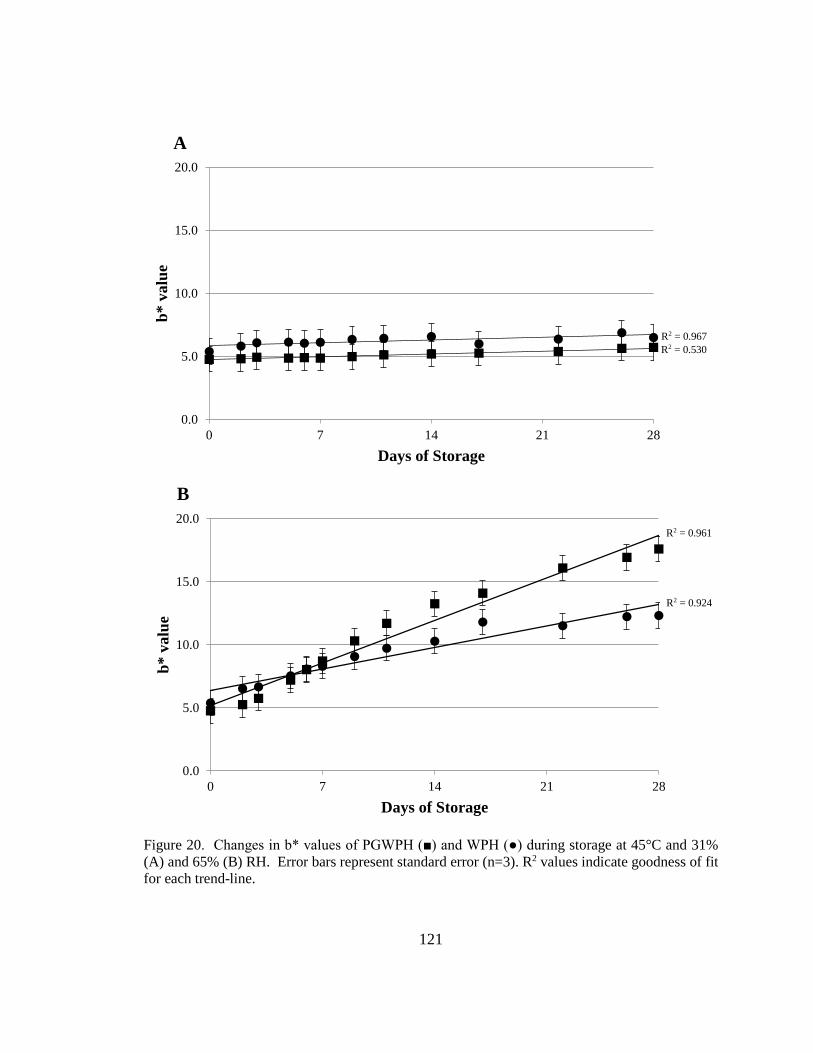
Figure 20. Changes in b* values of PGWPH (■) and WPH (●) during storage at 45°C and 31% (A) and 65% (B) RH. Error bars represent standard error (n=3). R2 values indicate goodness of fit for each trend-line.
0.0
5.0
10.0
15.0
20.0
0 7 14 21 28
b* v
alue
Days of Storage
0.0
5.0
10.0
15.0
20.0
0 7 14 21 28
b* v
alue
Days of Storage
B
A
R2 = 0.924
R2 = 0.967 R2 = 0.530
R2 = 0.961
121
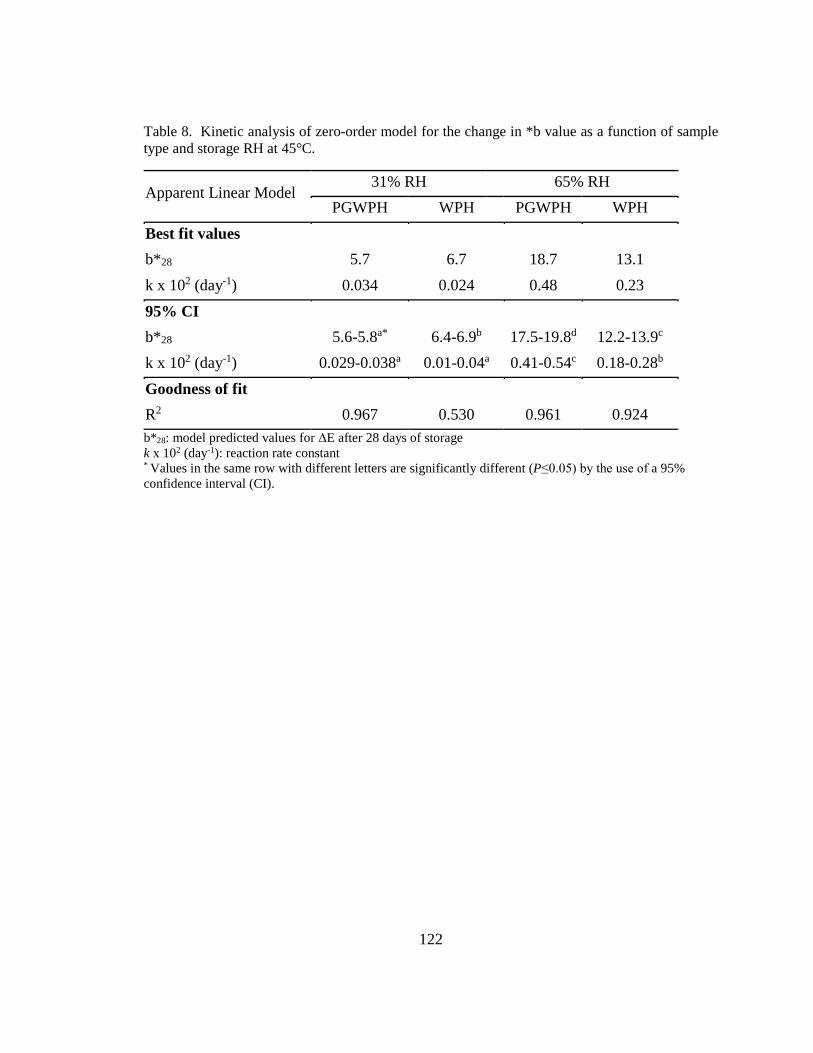
Table 8. Kinetic analysis of zero-order model for the change in *b value as a function of sample type and storage RH at 45°C.
Apparent Linear Model 31% RH 65% RH
PGWPH WPH PGWPH WPH Best fit values b*28 5.7 6.7 18.7 13.1 k x 102 (day-1) 0.034 0.024 0.48 0.23 95% CI b*28 5.6-5.8a* 6.4-6.9b 17.5-19.8d 12.2-13.9c k x 102 (day-1) 0.029-0.038a 0.01-0.04a 0.41-0.54c 0.18-0.28b Goodness of fit R2 0.967 0.530 0.961 0.924 b*28: model predicted values for ΔE after 28 days of storage k x 102 (day-1): reaction rate constant * Values in the same row with different letters are significantly different (P≤0.05) by the use of a 95% confidence interval (CI).
122
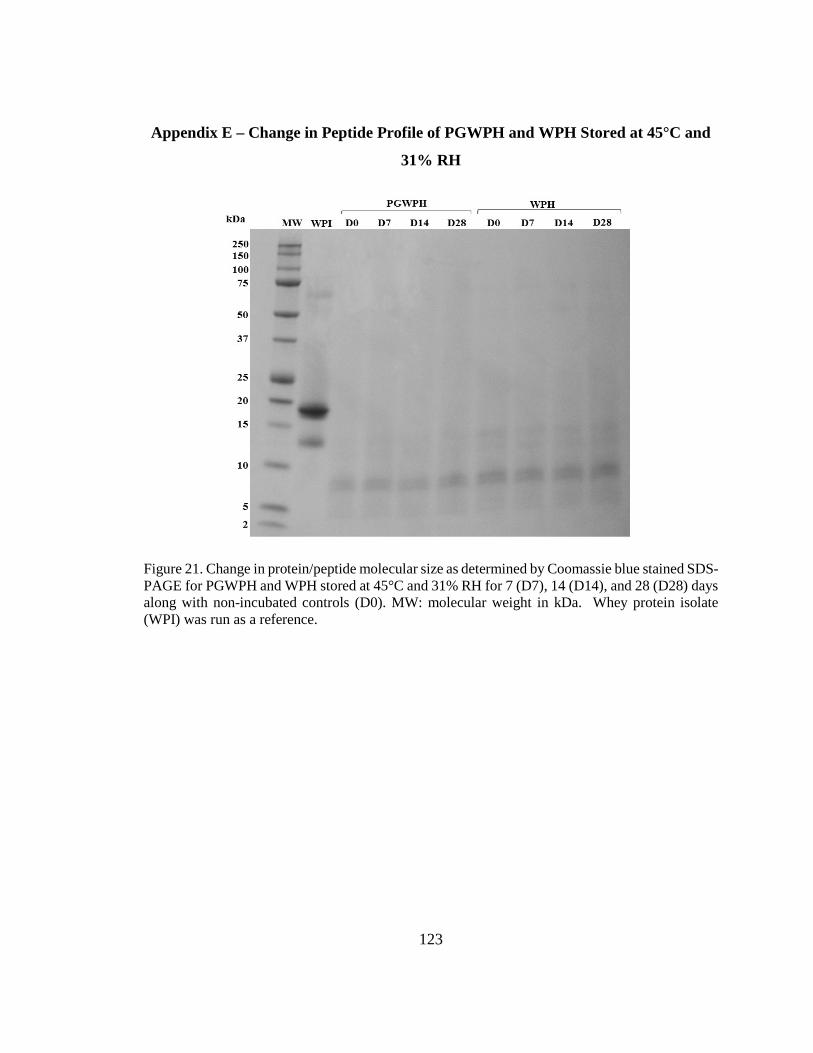
Appendix E – Change in Peptide Profile of PGWPH and WPH Stored at 45°C and
31% RH
Figure 21. Change in protein/peptide molecular size as determined by Coomassie blue stained SDS-PAGE for PGWPH and WPH stored at 45°C and 31% RH for 7 (D7), 14 (D14), and 28 (D28) days along with non-incubated controls (D0). MW: molecular weight in kDa. Whey protein isolate (WPI) was run as a reference.
123
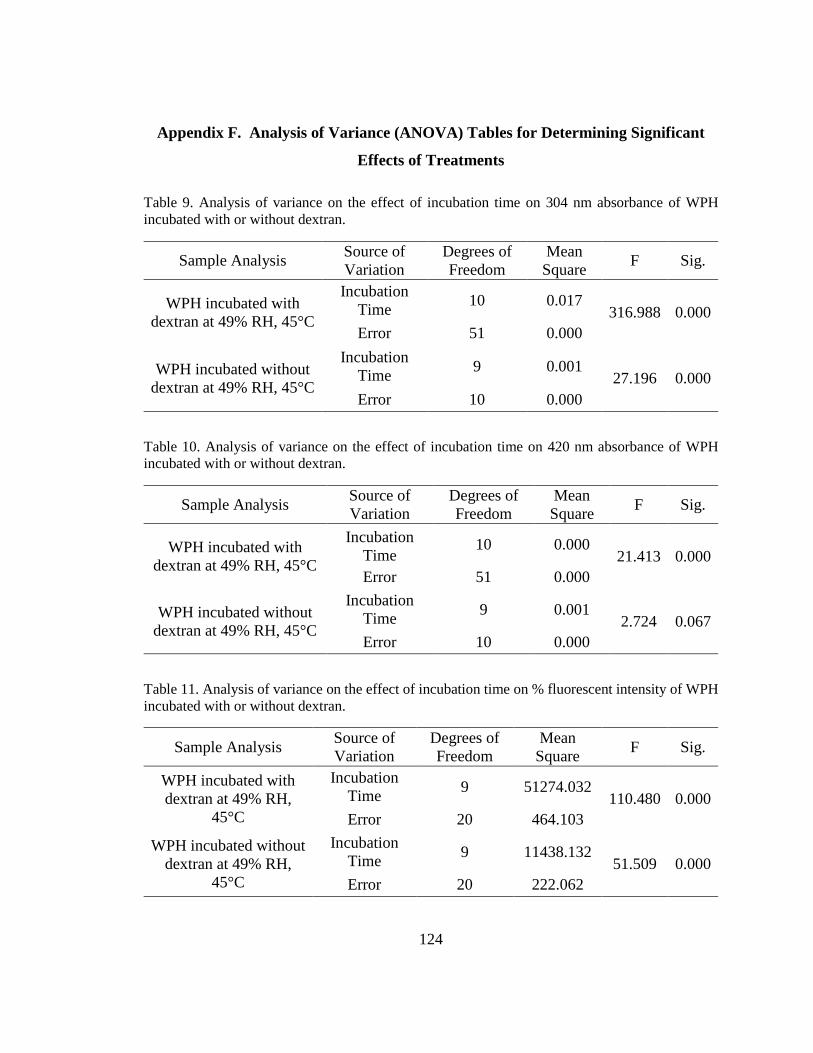
Appendix F. Analysis of Variance (ANOVA) Tables for Determining Significant
Effects of Treatments
Table 9. Analysis of variance on the effect of incubation time on 304 nm absorbance of WPH incubated with or without dextran.
Sample Analysis Source of Variation
Degrees of Freedom
Mean Square F Sig.
WPH incubated with dextran at 49% RH, 45°C
Incubation Time
10 0.017 316.988 0.000
Error 51 0.000
WPH incubated without dextran at 49% RH, 45°C
Incubation Time
9 0.001 27.196 0.000
Error 10 0.000 Table 10. Analysis of variance on the effect of incubation time on 420 nm absorbance of WPH incubated with or without dextran.
Sample Analysis Source of Variation
Degrees of Freedom
Mean Square F Sig.
WPH incubated with dextran at 49% RH, 45°C
Incubation Time
10 0.000 21.413 0.000
Error 51 0.000
WPH incubated without dextran at 49% RH, 45°C
Incubation Time
9 0.001 2.724 0.067
Error 10 0.000 Table 11. Analysis of variance on the effect of incubation time on % fluorescent intensity of WPH incubated with or without dextran.
Sample Analysis Source of Variation
Degrees of Freedom
Mean Square F Sig.
WPH incubated with dextran at 49% RH,
45°C
Incubation Time
9 51274.032 110.480 0.000
Error 20 464.103 WPH incubated without
dextran at 49% RH, 45°C
Incubation Time
9 11438.132 51.509 0.000
Error 20 222.062
124
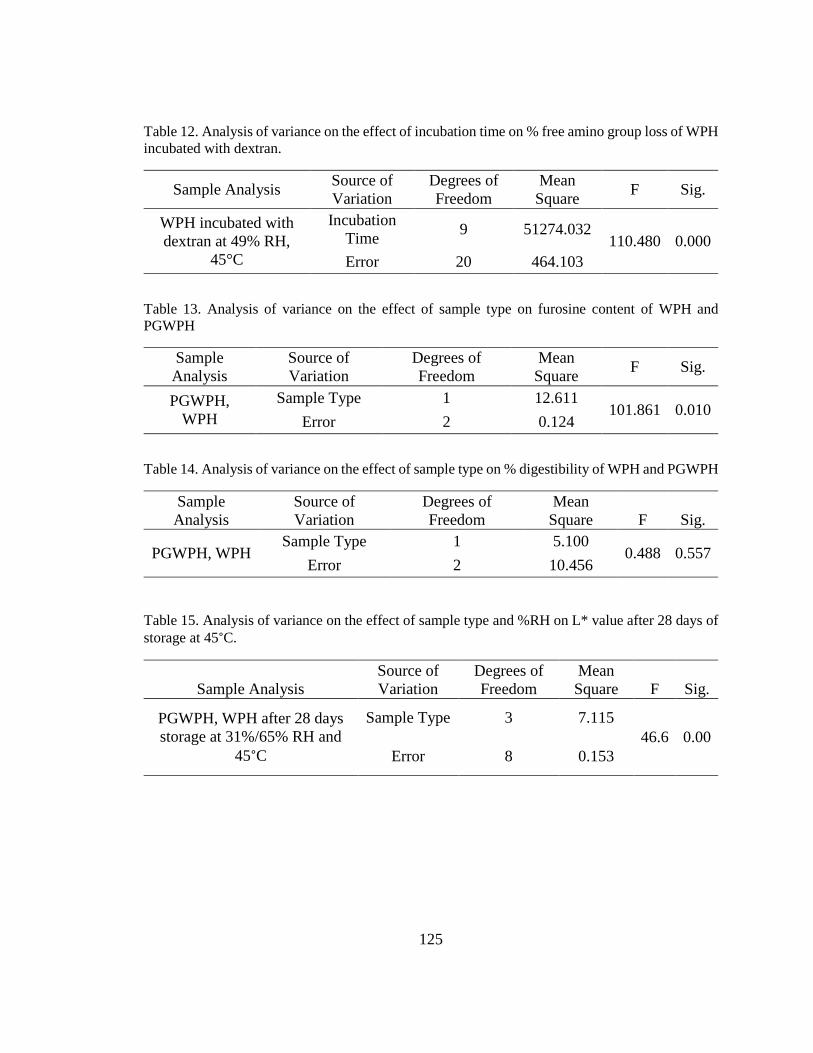
Table 12. Analysis of variance on the effect of incubation time on % free amino group loss of WPH incubated with dextran.
Sample Analysis Source of Variation
Degrees of Freedom
Mean Square F Sig.
WPH incubated with dextran at 49% RH,
45°C
Incubation Time
9 51274.032 110.480 0.000
Error 20 464.103 Table 13. Analysis of variance on the effect of sample type on furosine content of WPH and PGWPH
Sample Analysis
Source of Variation
Degrees of Freedom
Mean Square F Sig.
PGWPH, WPH
Sample Type 1 12.611 101.861 0.010
Error 2 0.124 Table 14. Analysis of variance on the effect of sample type on % digestibility of WPH and PGWPH
Sample Analysis
Source of Variation
Degrees of Freedom
Mean Square F Sig.
PGWPH, WPH Sample Type 1 5.100
0.488 0.557 Error 2 10.456
Table 15. Analysis of variance on the effect of sample type and %RH on L* value after 28 days of storage at 45°C.
Sample Analysis Source of Variation
Degrees of Freedom
Mean Square F Sig.
PGWPH, WPH after 28 days storage at 31%/65% RH and
45°C
Sample Type 3 7.115 46.6 0.00
Error 8 0.153
125

Table 16. Analysis of variance on the effect of storage time on L* value of PGWPH stored at 31% RH and 45°C.
Sample Analysis Source of Variation
Degrees of Freedom
Mean Square F Sig.
PGWPH stored at 31% RH and 45°C
Storage Time 1 0.317 1.079 0.358
Error 4 0.294
Table 17. Analysis of variance on the effect of storage time on L* value of WPH stored at 31% RH and 45°C.
Sample Analysis Source of Variation
Degrees of Freedom
Mean Square F Sig.
WPH stored at 31% RH and 45°C
Storage Time 1 1.500 2.765 0.172
Error 4 0.543
Table 18. Analysis of variance on the effect of storage time on L* value of PGWPH stored at 65% RH and 45°C.
Sample Analysis Source of Variation
Degrees of Freedom
Mean Square F Sig.
PGWPH stored at 31% RH and 45°C
Storage Time 1 22.195 84.758 0.001
Error 4 0.262
Table 19. Analysis of variance on the effect of storage time on L* value of WPH stored at 65% RH and 45°C.
Sample Analysis Source of Variation
Degrees of Freedom
Mean Square F Sig.
WPH stored at 65% RH and 45°C
Storage Time 1 0.522 0.869 0.404
Error 4 0.601
126
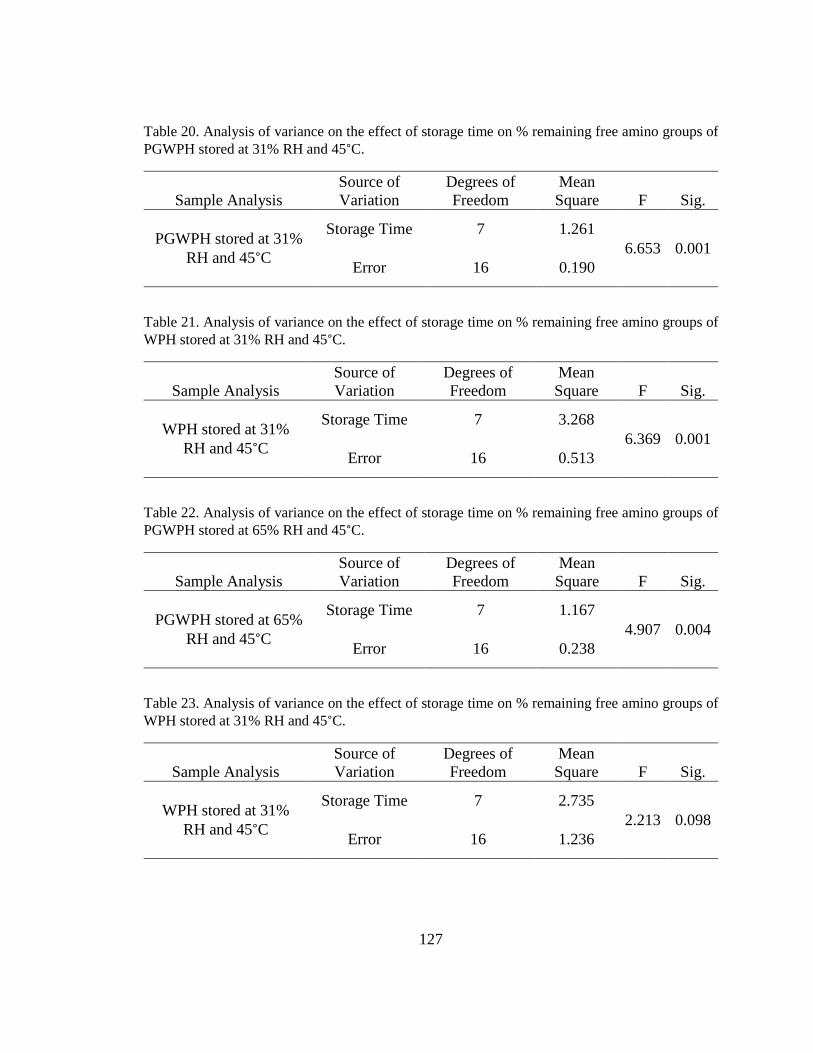
Table 20. Analysis of variance on the effect of storage time on % remaining free amino groups of PGWPH stored at 31% RH and 45°C.
Sample Analysis Source of Variation
Degrees of Freedom
Mean Square F Sig.
PGWPH stored at 31% RH and 45°C
Storage Time 7 1.261 6.653 0.001
Error 16 0.190
Table 21. Analysis of variance on the effect of storage time on % remaining free amino groups of WPH stored at 31% RH and 45°C.
Sample Analysis Source of Variation
Degrees of Freedom
Mean Square F Sig.
WPH stored at 31% RH and 45°C
Storage Time 7 3.268 6.369 0.001
Error 16 0.513
Table 22. Analysis of variance on the effect of storage time on % remaining free amino groups of PGWPH stored at 65% RH and 45°C.
Sample Analysis Source of Variation
Degrees of Freedom
Mean Square F Sig.
PGWPH stored at 65% RH and 45°C
Storage Time 7 1.167 4.907 0.004
Error 16 0.238
Table 23. Analysis of variance on the effect of storage time on % remaining free amino groups of WPH stored at 31% RH and 45°C.
Sample Analysis Source of Variation
Degrees of Freedom
Mean Square F Sig.
WPH stored at 31% RH and 45°C
Storage Time 7 2.735 2.213 0.098
Error 16 1.236
127
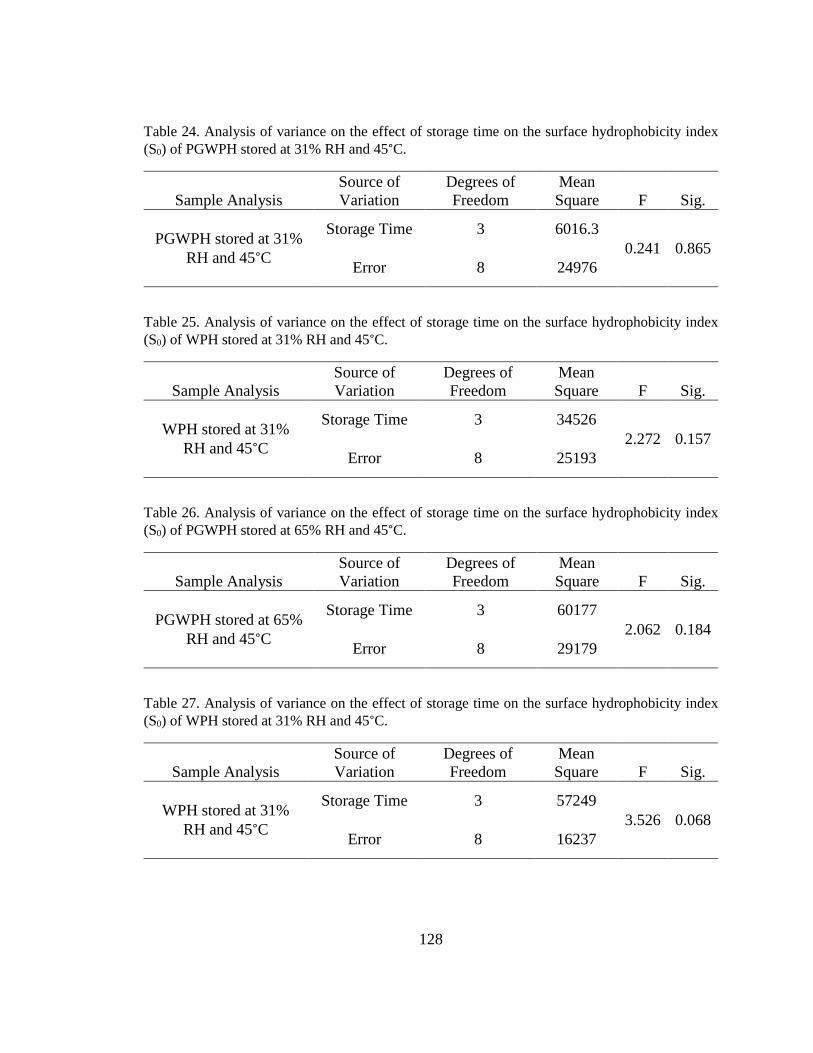
Table 24. Analysis of variance on the effect of storage time on the surface hydrophobicity index (S0) of PGWPH stored at 31% RH and 45°C.
Sample Analysis Source of Variation
Degrees of Freedom
Mean Square F Sig.
PGWPH stored at 31% RH and 45°C
Storage Time 3 6016.3 0.241 0.865
Error 8 24976
Table 25. Analysis of variance on the effect of storage time on the surface hydrophobicity index (S0) of WPH stored at 31% RH and 45°C.
Sample Analysis Source of Variation
Degrees of Freedom
Mean Square F Sig.
WPH stored at 31% RH and 45°C
Storage Time 3 34526 2.272 0.157
Error 8 25193
Table 26. Analysis of variance on the effect of storage time on the surface hydrophobicity index (S0) of PGWPH stored at 65% RH and 45°C.
Sample Analysis Source of Variation
Degrees of Freedom
Mean Square F Sig.
PGWPH stored at 65% RH and 45°C
Storage Time 3 60177 2.062 0.184
Error 8 29179
Table 27. Analysis of variance on the effect of storage time on the surface hydrophobicity index (S0) of WPH stored at 31% RH and 45°C.
Sample Analysis Source of Variation
Degrees of Freedom
Mean Square F Sig.
WPH stored at 31% RH and 45°C
Storage Time 3 57249 3.526 0.068
Error 8 16237
128

Table 28. Analysis of variance on the effect of storage % RH on the surface hydrophobicity index (S0) of PGWPH stored at 45°C for 7 days.
Sample Analysis Source of Variation
Degrees of Freedom
Mean Square F Sig.
PGWPH stored at 45°C for 7 days
Storage % RH 1 28981 2.591 0.183
Error 4 11187
Table 29. Analysis of variance on the effect of storage % RH on the surface hydrophobicity index (S0) of WPH stored at 45°C for 7 days.
Sample Analysis Source of Variation
Degrees of Freedom
Mean Square F Sig.
WPH stored at 45°C for 7 days
Storage % RH 1 251371 16.875 0.015
Error 4 14896
Table 30. Analysis of variance on the effect of storage % RH on the surface hydrophobicity index (S0) of PGWPH stored at 45°C for 14 days.
Sample Analysis Source of Variation
Degrees of Freedom
Mean Square F Sig.
PGWPH stored at 45°C for 14 days
Storage % RH 1 136866 2.769 0.171
Error 4 49419
Table 31. Analysis of variance on the effect of storage % RH on the surface hydrophobicity index (S0) of WPH stored at 45°C for 14 days.
Sample Analysis Source of Variation
Degrees of Freedom
Mean Square F Sig.
WPH stored at 45°C for 14 days
Storage % RH 1 4406 0.164 0.707
Error 4 26944
129

Table 32. Analysis of variance on the effect of storage % RH on the surface hydrophobicity index (S0) of PGWPH stored at 45°C for 28 days.
Sample Analysis Source of Variation
Degrees of Freedom
Mean Square F Sig.
PGWPH stored at 45°C for 28 days
Storage % RH 1 74103 2.035 0.227
Error 4 36414
Table 33. Analysis of variance on the effect of storage % RH on the surface hydrophobicity index (S0) of WPH stored at 45°C for 28 days.
Sample Analysis Source of Variation
Degrees of Freedom
Mean Square F Sig.
WPH stored at 45°C for 28 days
Storage % RH 1 5865.6 0.320 0.602
Error 4 18333
Table 34. Analysis of variance on the effect of storage % RH on the water solubility of PGWPH stored at 45°C for 28 days.
Sample Analysis Source of Variation
Degrees of Freedom
Mean Square F Sig.
PGWPH stored at 45°C for 28 days
Storage % RH 1 37.216 1.159 0.342
Error 4 32.119
Table 35. Analysis of variance on the effect of storage % RH on the water solubility of WPH stored at 45°C for 28 days.
Sample Analysis Source of Variation
Degrees of Freedom
Mean Square F Sig.
WPH stored at 45°C for 28 days
Storage % RH 1 0.001 0.000 0.986
Error 4 2.936
130
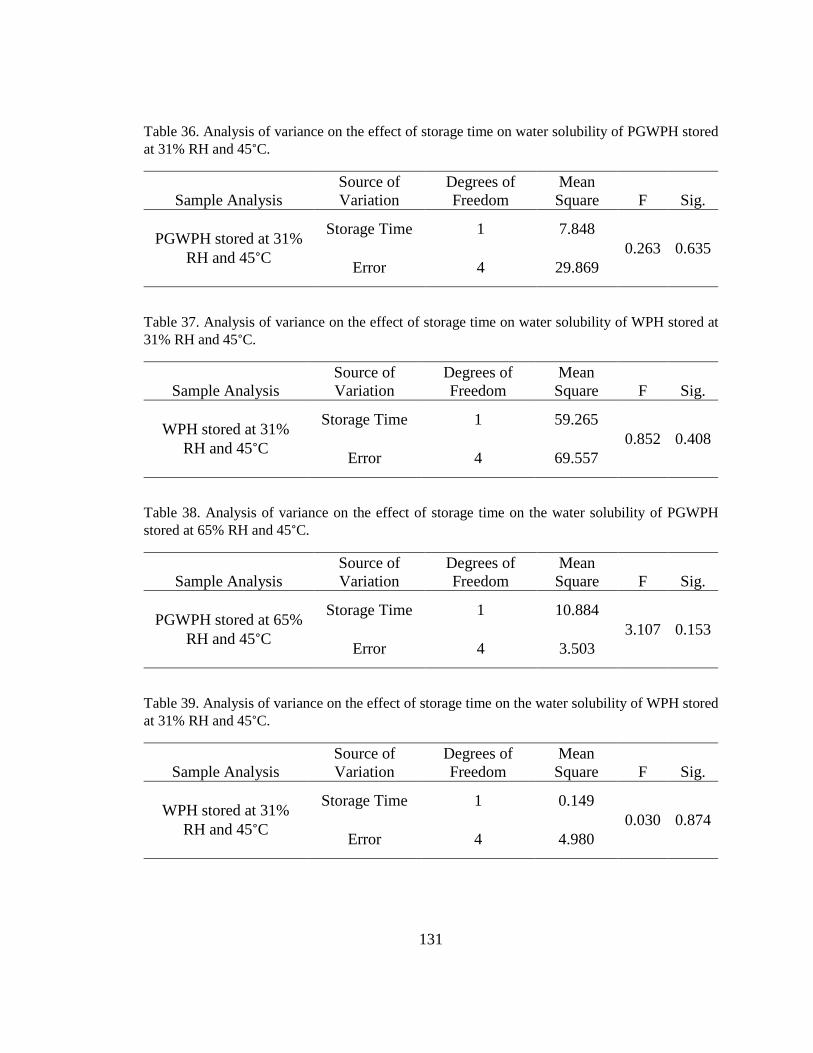
Table 36. Analysis of variance on the effect of storage time on water solubility of PGWPH stored at 31% RH and 45°C.
Sample Analysis Source of Variation
Degrees of Freedom
Mean Square F Sig.
PGWPH stored at 31% RH and 45°C
Storage Time 1 7.848 0.263 0.635
Error 4 29.869
Table 37. Analysis of variance on the effect of storage time on water solubility of WPH stored at 31% RH and 45°C.
Sample Analysis Source of Variation
Degrees of Freedom
Mean Square F Sig.
WPH stored at 31% RH and 45°C
Storage Time 1 59.265 0.852 0.408
Error 4 69.557
Table 38. Analysis of variance on the effect of storage time on the water solubility of PGWPH stored at 65% RH and 45°C.
Sample Analysis Source of Variation
Degrees of Freedom
Mean Square F Sig.
PGWPH stored at 65% RH and 45°C
Storage Time 1 10.884 3.107 0.153
Error 4 3.503
Table 39. Analysis of variance on the effect of storage time on the water solubility of WPH stored at 31% RH and 45°C.
Sample Analysis Source of Variation
Degrees of Freedom
Mean Square F Sig.
WPH stored at 31% RH and 45°C
Storage Time 1 0.149 0.030 0.874
Error 4 4.980
131
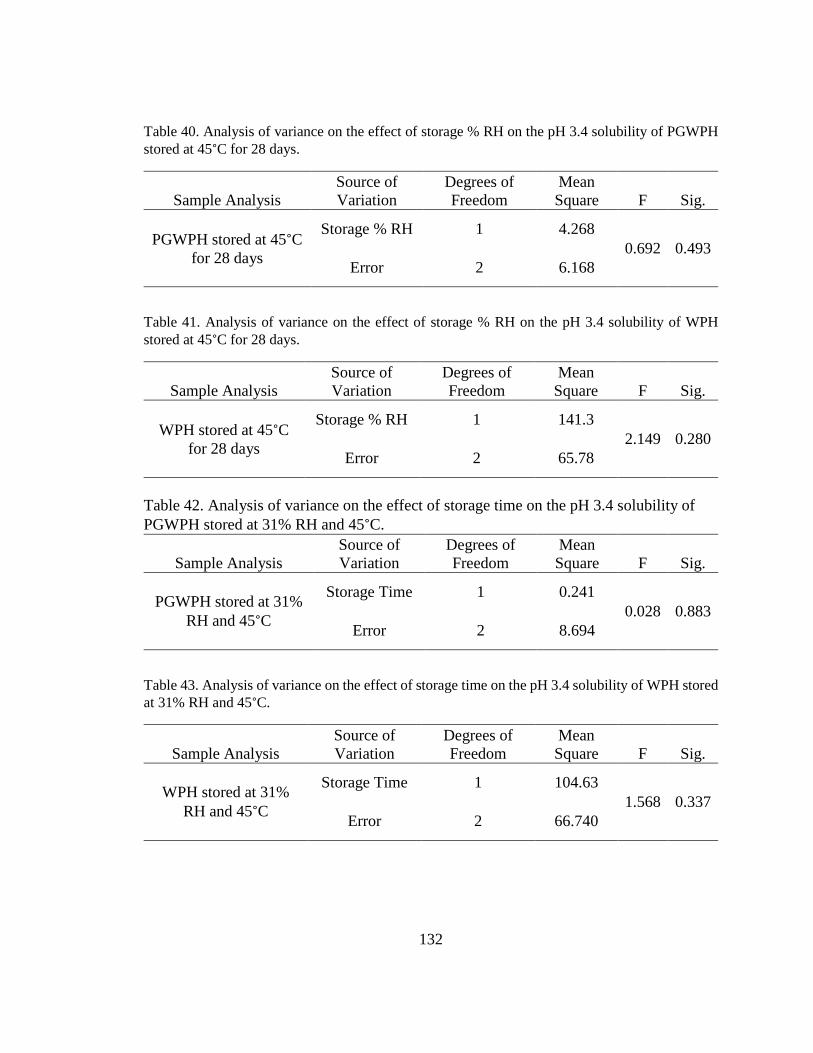
Table 40. Analysis of variance on the effect of storage % RH on the pH 3.4 solubility of PGWPH stored at 45°C for 28 days.
Sample Analysis Source of Variation
Degrees of Freedom
Mean Square F Sig.
PGWPH stored at 45°C for 28 days
Storage % RH 1 4.268 0.692 0.493
Error 2 6.168
Table 41. Analysis of variance on the effect of storage % RH on the pH 3.4 solubility of WPH stored at 45°C for 28 days.
Sample Analysis Source of Variation
Degrees of Freedom
Mean Square F Sig.
WPH stored at 45°C for 28 days
Storage % RH 1 141.3 2.149 0.280
Error 2 65.78
Table 42. Analysis of variance on the effect of storage time on the pH 3.4 solubility of PGWPH stored at 31% RH and 45°C.
Sample Analysis Source of Variation
Degrees of Freedom
Mean Square F Sig.
PGWPH stored at 31% RH and 45°C
Storage Time 1 0.241 0.028 0.883
Error 2 8.694
Table 43. Analysis of variance on the effect of storage time on the pH 3.4 solubility of WPH stored at 31% RH and 45°C.
Sample Analysis Source of Variation
Degrees of Freedom
Mean Square F Sig.
WPH stored at 31% RH and 45°C
Storage Time 1 104.63 1.568 0.337
Error 2 66.740
132
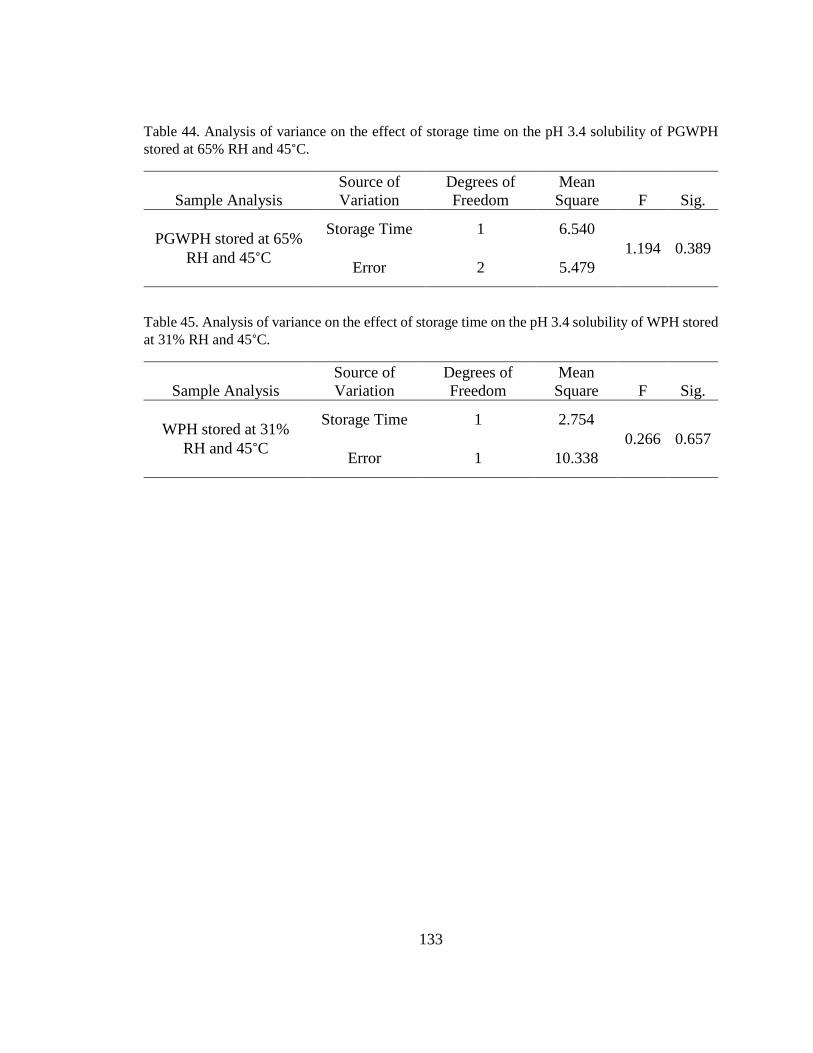
Table 44. Analysis of variance on the effect of storage time on the pH 3.4 solubility of PGWPH stored at 65% RH and 45°C.
Sample Analysis Source of Variation
Degrees of Freedom
Mean Square F Sig.
PGWPH stored at 65% RH and 45°C
Storage Time 1 6.540 1.194 0.389
Error 2 5.479
Table 45. Analysis of variance on the effect of storage time on the pH 3.4 solubility of WPH stored at 31% RH and 45°C.
Sample Analysis Source of Variation
Degrees of Freedom
Mean Square F Sig.
WPH stored at 31% RH and 45°C
Storage Time 1 2.754 0.266 0.657
Error 1 10.338
133

![Coating Effect of Whey Protein and Xylose Maillard ... · bonding and hydrophobic interactions upon drying to form films [3], [4]. The fragility of the film makes the addition of](https://img.pdfslide.us/doc/110x75/5f8159342e034f208e542bf2/coating-effect-of-whey-protein-and-xylose-maillard-bonding-and-hydrophobic-interactions.jpg)