Embed Size (px)
Citation preview

MOL #108787
1
Title page
A System-independent Scale of Agonism and Allosteric Modulation for Assessment of
Selectivity, Bias and Receptor Mutation
Terry Kenakin Ph.D.
This article has not been copyedited and formatted. The final version may differ from this version.Molecular Pharmacology Fast Forward. Published on July 5, 2017 as DOI: 10.1124/mol.117.108787
at ASPE
T Journals on A
ugust 14, 2019m
olpharm.aspetjournals.org
Dow
nloaded from
MOL #108787
2
Running Title Page
Running title: Scale for Agonism and Allosteric Modulation
Corresponding author: Terry Kenakin Ph.D.
Professor, Department of Pharmacology
University of North Carolina School of Medicine
120 Mason Farm Road
Room 4042 Genetic Medicine Building, CB# 7365
Chapel Hill, NC 27599-7365
Phone: 919-962-7863
Fax: 919-966-7242 or 5640
Email: [email protected]
Number of text pages: 17
Number of Tables: 2
Number of Figures:10
Number of References:29
Number of words in Abstract:149
Number of words in Introduction:226
Number of words in Discussion:4195
Abbreviations: PAM- positive Allosteric modulator, NAM- negative allosteric modulator
This article has not been copyedited and formatted. The final version may differ from this version.Molecular Pharmacology Fast Forward. Published on July 5, 2017 as DOI: 10.1124/mol.117.108787
at ASPE
T Journals on A
ugust 14, 2019m
olpharm.aspetjournals.org
Dow
nloaded from

MOL #108787
3
Abstract
An index of agonism is described which can be used to quantify agonist receptor
selectivity, bias, cell-based agonism and the effects of receptor mutation on signaling .
The parameter is derived from agonist concentration-response curves and is comprised
of the maximal response to the agonist (max) and the EC50 (concentration of agonist
producing half maximal response) in the form of Log(max/EC50). This parameter is
derived from equations describing agonists as positive allosteric facilitators of receptor-
signaling protein interaction. A similar index is also derived to quantify the potentiating
effects of positive allosteric modulators which can be used to quantify in situ PAM
activity in vivo. These indices lend themselves to statistical analysis and are system
independent in that the effects of the system processing of agonist response and
differences in assay sensitivity and receptor expression are cancelled. The various
applications of the Log(max/EC50) scale are described for each pharmacological
application.
This article has not been copyedited and formatted. The final version may differ from this version.Molecular Pharmacology Fast Forward. Published on July 5, 2017 as DOI: 10.1124/mol.117.108787
at ASPE
T Journals on A
ugust 14, 2019m
olpharm.aspetjournals.org
Dow
nloaded from

MOL #108787
4
Introduction
A critical component of the lead optimization process in new drug discovery for
agonists and allosteric modulators is the determination of relative measures of activity
that are not specifically linked only to the assays in which they are measured, i.e. they
are system-independent measures of activity. For full agonists, system independent
measures of activity are achieved through relative potency ratios (ratios of EC50 values
where EC50 refers to the concentration of agonist producing 50% maximal response).
However, this scale devolves into a non-linear scale when comparing full and partial
agonists so it cannot be used for the comparison of these types of agonists. In this
paper, agonism is developed as a positive allosteric modulation of the natural receptor-
signaling protein interaction and the resulting scale is presented as a system
independent measure of the relative receptor activation for any set of agonists (full or
partial). Separately, the same approach is applied to the assessment of the relative
activity of any set of allosteric modulators positive (PAMs) or negative (NAMs). While
the activity of NAMs can be quantified with standard methods for antagonists, the
affinity of PAMs is uniquely dependent on the co-binding agonist and thus require
special methods to assess. This new scale may be particularly useful in that it can be
used to furnish system-independent measures of PAM activity in vivo for advancement
of candidate molecules.
Receptor-Signaling Protein Interaction
The discovery of constitutive seven transmembrane receptor (7TMR) activity
(Costa and Herz, 1989) and subsequent recasting of the ternary complex model for
receptors to the extended ternary complex model (Samama et al, 1993) reveals that
This article has not been copyedited and formatted. The final version may differ from this version.Molecular Pharmacology Fast Forward. Published on July 5, 2017 as DOI: 10.1124/mol.117.108787
at ASPE
T Journals on A
ugust 14, 2019m
olpharm.aspetjournals.org
Dow
nloaded from

MOL #108787
5
agonists can be considered simply as positive allosteric modulators of an already
ongoing spontaneous association between the receptor and the signaling protein
(Kenakin, 2015). In accordance with the standard functional allosteric model for
receptors (Kenakin, 2005; Ehlert, 2005; Price et al, 2005) such modulators (in this case
agonists) can change the affinity of the receptor for the signaling protein (through a co-
operativity term ) and the efficacy of the receptor-signaling protein complex for
production of cellular response (through a co-operativity term ). In terms of binding, the
relevant protein species can be described within the context of the standard Stockton-
Ehlert allosteric binding model (Stockton et al,1983; Ehlert, 1989) whereby the agonist
(denoted A) and signaling protein (denoted G) bind to separate but interactive sites on
the receptor. Thus both A and G interact with the receptor with equilibrium association
constants K’a and Kg respectively:
…[1]
This binding model is then placed as the receptor species producing unit for the
Black/Leff operational model of agonism (Black and Leff, 1983) to yield the functional
allosteric model. An ‘allosteric vector’ can be described to denote the direction of
modulation (Kenakin and Miller, 2010) which in this case has the binding of a ligand to
the receptor directing the modification of the interaction between the receptor and a
This article has not been copyedited and formatted. The final version may differ from this version.Molecular Pharmacology Fast Forward. Published on July 5, 2017 as DOI: 10.1124/mol.117.108787
at ASPE
T Journals on A
ugust 14, 2019m
olpharm.aspetjournals.org
Dow
nloaded from
MOL #108787
6
signaling protein within the cytosol; this vector constitutes agonism. It should be noted
that G protein coupled receptors have been described as allosteric proteins in the
literature in early mathematical models (see Karlin, 1967; Thron, 1973). The standard
functional allosteric model for a cytosol-directed vector can be used to show that ratios
of the maximal response (max) and EC50 (concentration of agonist producing half
maximal response) from agonist concentration-response curves for a set of agonists (to
furnish Log(max/EC50) values) creates a system independent scale of agonism that
can be used to quantify selectivity- see Appendix 1 for derivation. This same conclusion
can be reached through derivation of the term within the Black/Leff operational model as
well- see Kenakin (2015) and Appendix 2.
Historically, the relative activity of agonists has been quantified through potency
ratios (for example differences in the negative logarithm of EC50 values denoted as
pEC50). For full agonists pEC50 values are constant over all ranges of system
sensitivity (as long as both agonists produce full system response, i.e. are full agonists).
However, this relationship breaks down when one or both of the agonists becomes a
partial agonist because the impact of tissue sensitivity on the potency of full and partial
agonists is different. Specifically, reductions in receptor density for full agonists produce
defined dextral displacement of concentration-response curves in contrast to the effect
produced on curves for partial agonists which essentially do not change location along
the concentration axis but rather show depressed maxima (see Fig 1A). This produces
distinctly non-linear changes in the relative pEC50 values of an agonist when it
expresses partial agonism in systems of low sensitivity- see curvature in the relationship
between pEC50 and receptor density shown in Fig 1B. This non-linearity makes pEC50
This article has not been copyedited and formatted. The final version may differ from this version.Molecular Pharmacology Fast Forward. Published on July 5, 2017 as DOI: 10.1124/mol.117.108787
at ASPE
T Journals on A
ugust 14, 2019m
olpharm.aspetjournals.org
Dow
nloaded from
MOL #108787
7
values dependent on tissue sensitivity and thus not useful as a system-independent
index of relative agonist activity. For dose response curves with Hill coefficients not
significantly different from unity normalization of agonist activity through inclusion of the
maximal response (in the form of Log(max/EC50) values) corrects this dependence on
tissue sensitivity and yields a truly system-independent scale of agonism (see Fig 1);
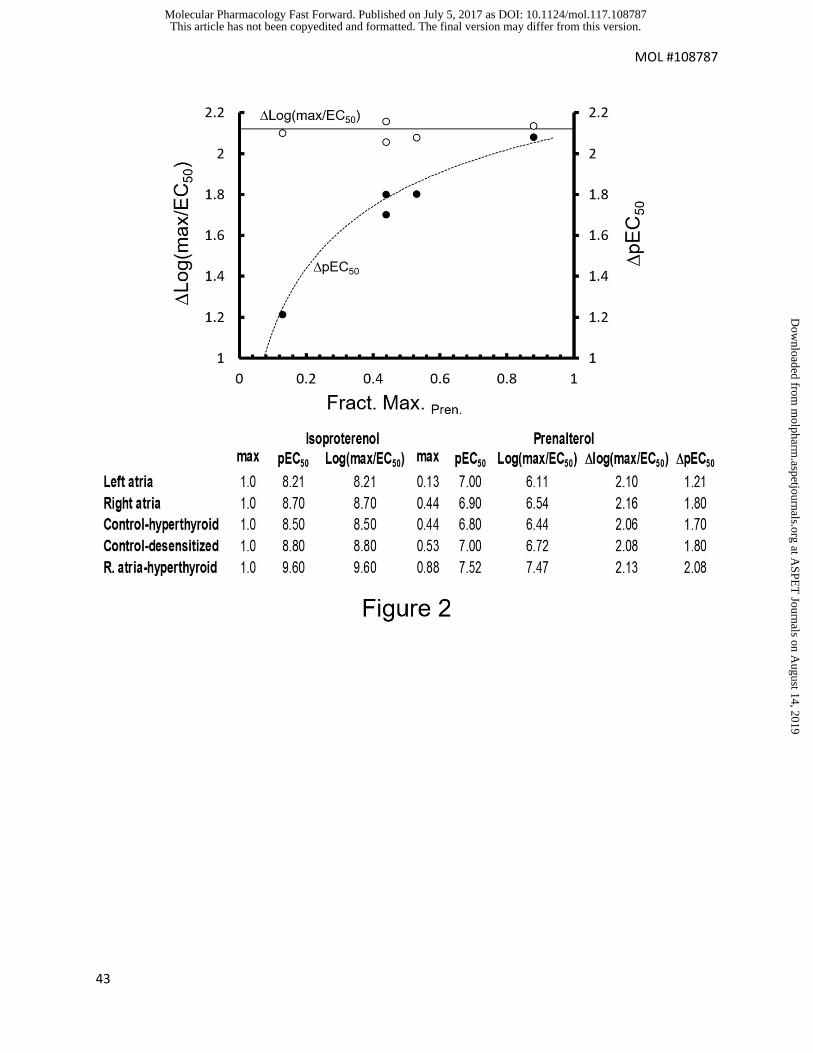
this effect is shown with experimental data in Fig 2 for the -adrenoceptor partial agonist
prenalterol and full agonist isoproterenol. As shown in Fig 2, the pEC50 values produce
a distinct curvature with varying tissues while Log(max/EC50) values remain constant
through a range of tissue conditions.
There are three important points to consider when discussing Log(max/EC50)
values; the first is the fact that calculation of max/EC50 reduces agonism to a single
number. This is useful from the point of view of allowing statistical analyses (i.e. as in
the analysis of signaling bias, Kenakin et al, 2012). The various formulae to do this are
described in Appendix 3 with the key parameter to enable the calculations being an
estimate of pooled variance (Kenakin et al, 2012). Thus, estimates of the agonism
produced by any molecule can be made with mean Log(max/EC50) values + 95% c.l.,
comparison of the relative base agonist activity in any one system can be made with
Log(max/EC50) values + 95% confidence limits (c.l.) and finally, comparisons of
selectivity, bias and the effects of mutation made through Log(max/EC50) + 95% c.l.
estimates with simple adjustment of formulae based on the pooled variance- see
Appendix 3.
This article has not been copyedited and formatted. The final version may differ from this version.Molecular Pharmacology Fast Forward. Published on July 5, 2017 as DOI: 10.1124/mol.117.108787
at ASPE
T Journals on A
ugust 14, 2019m
olpharm.aspetjournals.org
Dow
nloaded from

MOL #108787
8
The second point is that the comparison of Log(max/EC50) values between
agonists in a single functional system to produce Log(max/EC50) allows the system
independent scaling of agonism within a given functional system. When this is done the
agonism of a test compound is compared to a reference agonist and system effects are
cancelled, i.e. the sensitivity of the functional system is not an issue and the
Log(max/EC50) reflects molecular efficacy and affinity in a system independent manner
within a given assay. The third point involves the cross comparison of different response
systems whether they be signaling pathways in the cell or different receptors. Once the
power of a test agonist is scaled to the same reference agonist in two systems, then
Log(max/EC50) values cancel cross system effects (including differences in assay
sensitivity) and become independent measures of the power of the agonist activation
across the two systems. This can be in terms of different receptors (receptor selectivity),
different signaling pathways (biased signaling), cell-based agonist selectivity, or
measures of the impact of receptor mutation on a given agonist activity. It is worth
considering these settings as they are fundamental pharmacological procedures applied
to the quantitative measurement of agonist effect. As a pre-requisite it is useful to
consider some operational features of the analysis.
Practical Use of the Log(max/EC50)
It is important to note that the maximal response for agonism must be expressed
as a fraction of the maximal window available in the assay to express agonism and not
simply as the maximal response to the most efficacious agonist in the assay. For
example, if direct activation of adenylate cyclase with forskolin in a given functional
assay produces a maximal elevation of cyclic AMP greater than the most efficacious
This article has not been copyedited and formatted. The final version may differ from this version.Molecular Pharmacology Fast Forward. Published on July 5, 2017 as DOI: 10.1124/mol.117.108787
at ASPE
T Journals on A
ugust 14, 2019m
olpharm.aspetjournals.org
Dow
nloaded from
MOL #108787
9
agonist in the assay, then the maximal response to the agonist must be expressed as a
fraction of the maximal effect of forskolin. In addition, the derivation given in Appendix 1
assumes that the Hill coefficient of the agonist concentration response curves are not
significantly different from unity. In the comparison of the Black/Leff operational model
scale of Log(/KA) to Log(max/EC50) values this is an explicit requirement to equate
the two values (Appendix 2). In some instances in experimental pharmacology this is
not the case therefore it is useful to explore the effects of slopes differing from unity on
the immutability of the Log(max/EC50) scale with receptor density and tissue
sensitivity. Specifically, the comparison is made between a curve fit to the Hill equation
of Response = [A]n max/([A]n + EC50n) where n=1 and n≠1.Then comparisons of
different Log(max/EC50) values can be made through simulation whereby the actual
values of Log(max/EC50) values for concentration response curves of different slopes
can be compared to the true values of Log(/KA); this yields an error term where:
= Log(max/EC50) - Log(/KA) …[2]
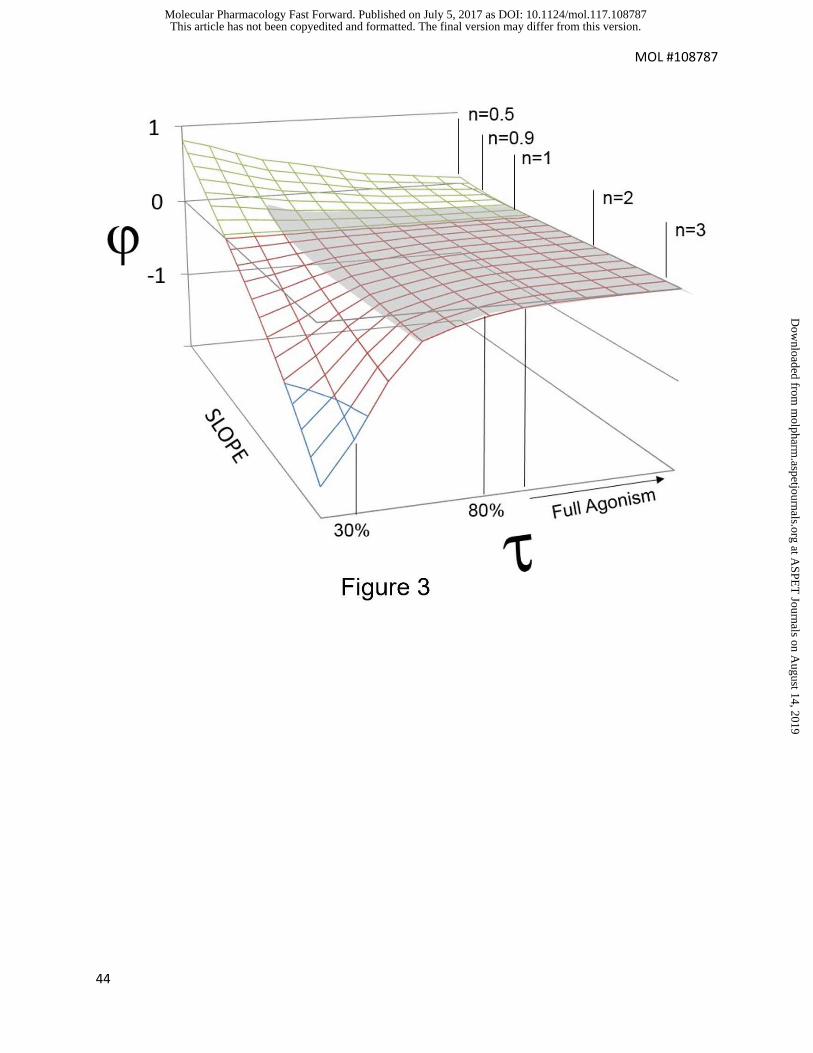
Fig 3 shows a simulation surface of the dependence of on slope and maximal
response of the agonist concentration response curves. It can be seen from this figure
that slopes > 1 provide Log(max/EC50) values that depend only slightly on slope (as
indicated by the small deviation with agonist maxima). In fact, the main region of
deviation occurs with agonist concentration-response curves of low maximal response
and slopes significantly less than unity. This should be considered as a caution to the
use of Log(max/EC50) values for low efficacy agonists (maximal responses < 35%)
demonstrating concentration response curves with slopes significantly lower than 0.5.
This article has not been copyedited and formatted. The final version may differ from this version.Molecular Pharmacology Fast Forward. Published on July 5, 2017 as DOI: 10.1124/mol.117.108787
at ASPE
T Journals on A
ugust 14, 2019m
olpharm.aspetjournals.org
Dow
nloaded from
MOL #108787
10
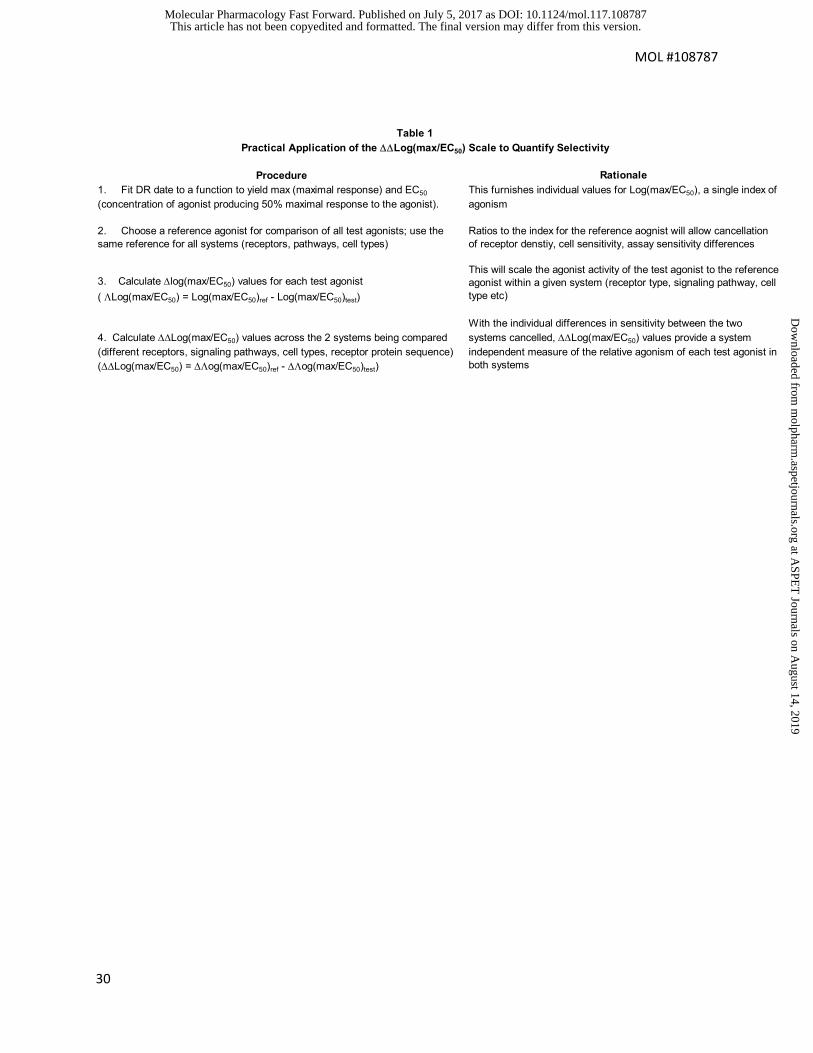
Table 1 shows the sequential procedures required to apply the Log(max/EC50)
scale for quantification of selectivity for different receptors, signaling pathways, cell
types and receptor sequence.
Log(max/EC50) Quantification of Receptor Selectivity
Historically, receptor selectivity has been expressed as the ratio of agonist potencies
and for full agonists this yields useful and system independent measures. However, as
discussed above, the use of maximal responses extends this scale to all agonists,
partial and full and provides a more inclusive scale. Table 2 shows data describing
concentration-response curves for four muscarinic agonists on M1 and M4 receptors
(CHO cell GTPS binding) from Watt et al, 2011. Selectivity can be calculated through
conventional potency values (EC50) or through Log(max/EC50) and in the case of
Talsididine, different outcomes illustrate the effect of ignoring differences in maximal
response. In cases where partial agonism is produced, EC50 values over-estimate the
agonism of the ligand because full agonism is assumed in the calculation. The first step
is to cancel the effect of the sensitivity of each assay by comparing agonism to a
reference compound; in this case, acetylcholine is the reference. Considering pEC50
values first, talsididine is 0.032-fold as active as acetylcholine on M1 receptors and
0.066-fold as active as acetylcholine on M4 receptors; this leads to an overall selectivity
of talsididine of 2.1 for M4 receptors (talsididine is relatively more active on M4 than M1
receptors ). Use of Log(max/EC50) values leads to a different conclusion; talsididine is
0.022-fold as active on M1 receptors and 0.016-fold as active on M4 receptors ; this
leads to an overall selectivity of 1.38-fold for M1 receptors (non-selective). This is in
keeping with the lower maximal response of talsididine for M4 receptors (21.6%)
This article has not been copyedited and formatted. The final version may differ from this version.Molecular Pharmacology Fast Forward. Published on July 5, 2017 as DOI: 10.1124/mol.117.108787
at ASPE
T Journals on A
ugust 14, 2019m
olpharm.aspetjournals.org
Dow
nloaded from

MOL #108787
11
indicating a lower activity for that receptor subtype. In general pEC50 values assume a
maximal response for M4 receptors thereby over-estimating M4 activity and erroneously
classifying talsididine as M4-selective. Fig 4 shows the selectivity of the four agonists in
these recombinant functional systems where it can be seen that as the maximal
responses to the agonists diminish, the disparity between Log(max/EC50) and
pEC50 increases.
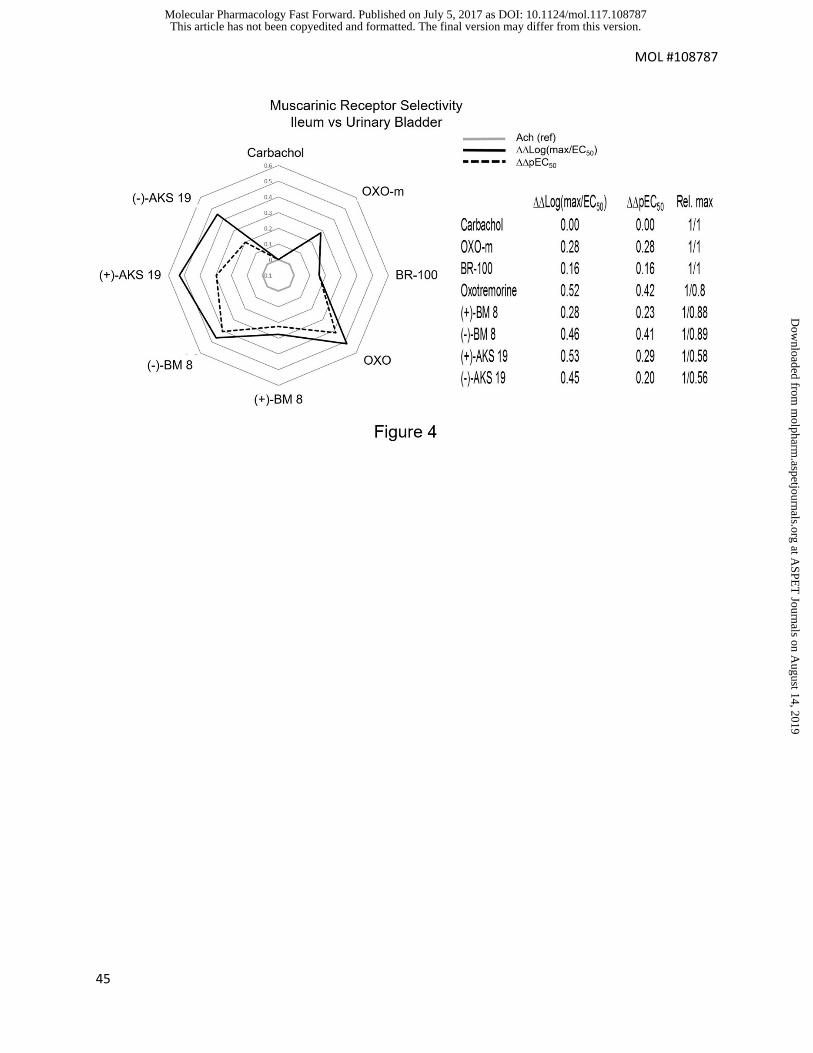
General tissue selectivity of agonists also can be quantified; Fig 5 shows the relative
activity of 8 muscarinic agonists, compared to that of acetylcholine, in guinea pig
bladder and ileum. Relative selectivity is calculated through Log(max/EC50) values
and relative agonist potency ratios as pEC50 values. In this calculation, the value for
each agonist within a given tissue is compared to that of acetylcholine through
Log(max/EC50) or pEC50 values and then the selectivity between the tissues
assessed through differences of these values in these two tissues to yield
Log(max/EC50) or pEC50 values for tissue selectivity (to cancel differences in
tissue sensitivity between the assays). The result is a measure of how well the agonists
activate the muscarinic receptors of guinea pig bladder and ileum. Tissue selective
differences might be seen with varying mixtures of receptor type in each tissue or a cell
type effect on biased agonism (Kenakin, 2016); the analysis makes no assumptions as
to the nature of the differences in potency and functions only as an operational measure
of observed selectivity. It can be seen that, as expected, estimates are identical when
both agonists produce full agonism. However, in drug discovery programs where new
test molecules of low intrinsic activity are compared to powerful standard agonists, this
scale becomes important. This is illustrated by the deviations in values in Fig 5 when
This article has not been copyedited and formatted. The final version may differ from this version.Molecular Pharmacology Fast Forward. Published on July 5, 2017 as DOI: 10.1124/mol.117.108787
at ASPE
T Journals on A
ugust 14, 2019m
olpharm.aspetjournals.org
Dow
nloaded from
MOL #108787
12
one of the agonists is a partial agonist in either tissue (see far right column of table
showing relative maxima and compare differences between Log(max/EC50) and
pEC50).
Log(max/EC50) Quantification of Signaling Bias
Just as extracellular agonist selectivity can be quantified with this scale, so too
can intracellular selectivity (agonist bias). This occurs when a given agonist that
interacts with a pleiotropically coupled receptor selectively activates one or more of the
signaling cascades at the expense of others, i.e. it biases the stimulus and does not
distribute activation evenly amongst the available pathways. This is predicted to be the
result of the stabilization of different receptor active states by different agonists (Kenakin
and Morgan, 1989; Kenakin, 1995) and, irrespective of mechanism, is a widespread
phenomenon in pharmacology studied by numerous research groups and given a
variety of names (i.e. ‘stimulus trafficking’, (Kenakin, 1995); ‘biased signaling’ (Jarpe et
al, 1998); ‘functional selectivity’ (Lawler et al, 1999); ‘collateral efficacy’ (Kenakin, 2005);
‘functional dissociation’ (Whistler and van Zastrow, 1999); ‘biased inhibition’ (Kudlacek
et al, 2002); ‘differential engagement’ (Manning, 2002)). Insofar as signaling bias may
be a therapeutically exploitable favorable agonist property, it is useful to have a
quantitative scale to guide medicinal chemists in efforts to optimize this effect.
A theoretically optimal scale for this utilizes Log(/KA) values (Kenakin et al,
2012; Kenakin and Christopoulos, 2013) and just as Log(max/EC50) values can be
useful surrogates for agonist selectivity, they can also function as the same for signaling
bias. Thus, when the slopes of the concentration response curves to the agonists are
This article has not been copyedited and formatted. The final version may differ from this version.Molecular Pharmacology Fast Forward. Published on July 5, 2017 as DOI: 10.1124/mol.117.108787
at ASPE
T Journals on A
ugust 14, 2019m
olpharm.aspetjournals.org
Dow
nloaded from
MOL #108787
13
>0.5 or maximal responses > 35%, Log(max/EC50) values can provide convenient
and rapid assessment of signaling bias. Just as for receptor selectivity, Log(max/EC50)
values are calculated for each agonist for two signaling pathways and then compared
through Log(max/EC50) values using a reference agonist in each (the reference
agonist must be the same for both pathways). This cancels the relative effects of assay
sensitivity in each assay. This is extremely important as signaling assays such as
effects on second messengers (i.e. cyclic AMP) are highly coupled and much more
sensitive than assays quantifying -arrestin complementation. After this, cross pathway
comparison can be done through comparison of Log(max/EC50) values to yield values
of Log(max/EC50). The bias is then calculated as the antilog of Log(max/EC50)
values. It should be noted that the bias is a vector that can be expressed in two
directions. For example, a bias for two agonists A and B showing that agonist A favors
the cAMP system (over-arrestin) by a factor of 5 can also be expressed as agonist A
having a bias away from -arrestin of 0.2. In general, when bias values are reported,
this vector orientation must always be denoted.
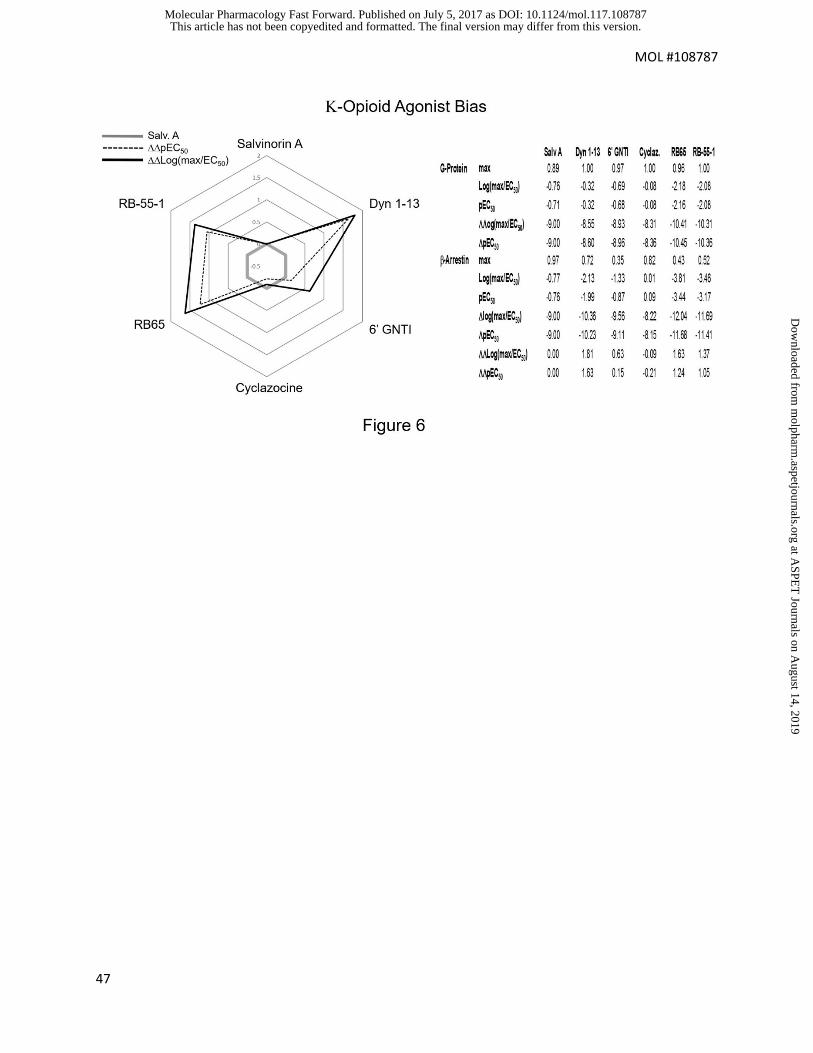
Fig 6 shows the bias of 5 opioid receptor agonists, compared to that of salvinorin
A, for -opioid receptor inhibition of cAMP production and -arrestin signaling pathways
(White et al, 2013). Just as with receptor selectivity, it can be seen that bias estimates
differ when one of the agonists produces partial maximal response and simple EC50
values (in the form of pEC50) vs consideration of maxima (in the form of
Log(max/EC50) estimates are used. In general, bias is under-estimated if only EC50
values are utilized.
This article has not been copyedited and formatted. The final version may differ from this version.Molecular Pharmacology Fast Forward. Published on July 5, 2017 as DOI: 10.1124/mol.117.108787
at ASPE
T Journals on A
ugust 14, 2019m
olpharm.aspetjournals.org
Dow
nloaded from

MOL #108787
14
Assessment of Cell-Type Specificity
A well known observation in pharmacology is the imposition of cell type effects
on receptor selectivity. For example, expression of the same receptor in different host
cell types can produce differences in the relative potency ratios of agonists (i.e.
calcitonin, Christmansson et al, 1994; Watson et al, 2000). While this is incompatible
with a monotonic receptor coupling scheme for agonists in cells, it can occur if agonists
produce biased signaling at the receptor and the difference host cell types emphasize
the heterogenous signals in different ways (Kenakin, 2016); in these cases
Log(max/EC50) values can be used to identify cell type specificity.Specifically, bias
plots, where the response to an agonist in one cell type is expressed as a function of
the response in another cell type, can furnish visual data to indicate where an agonist
produces a unique response in a given cell type over other agonists. For example, Fig 7
shows label free responses to muscarinic agonists in HT-29 and SF268 cells (Deng et
al, 2013). A linear relationship would not necessarily be expected as different cell types
may have differing receptor expression levels and efficiency of receptor coupling but if
the agonists produce a uniform receptor active state, then a concordance (i.e. no
deviations in the relationship for any one agonist) in this bias plot would be expected for
all agonists tested. However, as seen in Fig 7, while most of the agonists followed a
fairly uniform pattern, bethanechol shows a distinctly different bias being uniquely more
active in SF268 cells than HT-29 cells (as compared to the other agonists). This
difference can be quantified and statistically estimated through Log(max/EC50)
values. For example, the data shown in theTable with Fig 7, shows that bethanechol is
7.86-fold biased toward producing responses in SF268 cells vs HT-29 cells. If, in the
This article has not been copyedited and formatted. The final version may differ from this version.Molecular Pharmacology Fast Forward. Published on July 5, 2017 as DOI: 10.1124/mol.117.108787
at ASPE
T Journals on A
ugust 14, 2019m
olpharm.aspetjournals.org
Dow
nloaded from
MOL #108787
15
example shown in Fig 7, the mean cell bias toward response in SF268 cells for
acetylcholine, methacholine, carbachol and Oxo-M is 1.7, bethanechol produces a
7.86/1.7= 4.5-fold selective bias toward SF268 cells compared to these other agonists.
This type of analysis might be applied to the testing of ligands in healthy cells those
from disease models (or tumor vs normal cells) to identify unique cell-based activity for
therapeutic applications.
Assessment of Receptor Mutation
In the study of the effects of receptor mutations on agonist function and
functional signaling, important considerations are differences due to variations in
receptor expression. The application of Log(max/EC50) values negates this problem
through comparison of effects to a common standard for both the wild type and mutated
receptor. Just as with the assessment of signaling bias, the internal comparison of
agonist function to a common reference agonist for both the wild type and mutated
receptor cancels any effective differences in the disposition of the two types of receptor
protein by the cell. Once the relative agonism of two agonists is quantified for each
receptor species (wild type vs mutation), then comparisons between them can be made
that will be corrected for efficiency of transduction and expression with
Log(max/EC50) values. One possible difference from the process used to assess
signaling bias is in the choice of reference agonist. Specifically, when quantifying
signaling bias, usually the test agonist is compared to the natural agonist to yield a
measure of predicted differences in signaling with the synthetic agonist (as opposed to
natural signaling). While natural signaling is sometimes referred to as ‘unbiased
signaling’ this is a misnomer since the natural agonist will be biased according to the
This article has not been copyedited and formatted. The final version may differ from this version.Molecular Pharmacology Fast Forward. Published on July 5, 2017 as DOI: 10.1124/mol.117.108787
at ASPE
T Journals on A
ugust 14, 2019m
olpharm.aspetjournals.org
Dow
nloaded from

MOL #108787
16
physiological needs of the organ; therefore, what is measured as ‘bias’ for the synthetic
ligand is simply a difference from the bias of the natural ligand. In contrast, when
exploring the effects of mutation on receptor function, the aim often is to assess the
effects of the mutation on the natural wild type receptor interacting with the natural
agonist. Under these circumstances, a synthetic ligand is chosen as the reference
agonist (to cancel systems effects) and the induced bias on the natural ligand is thus
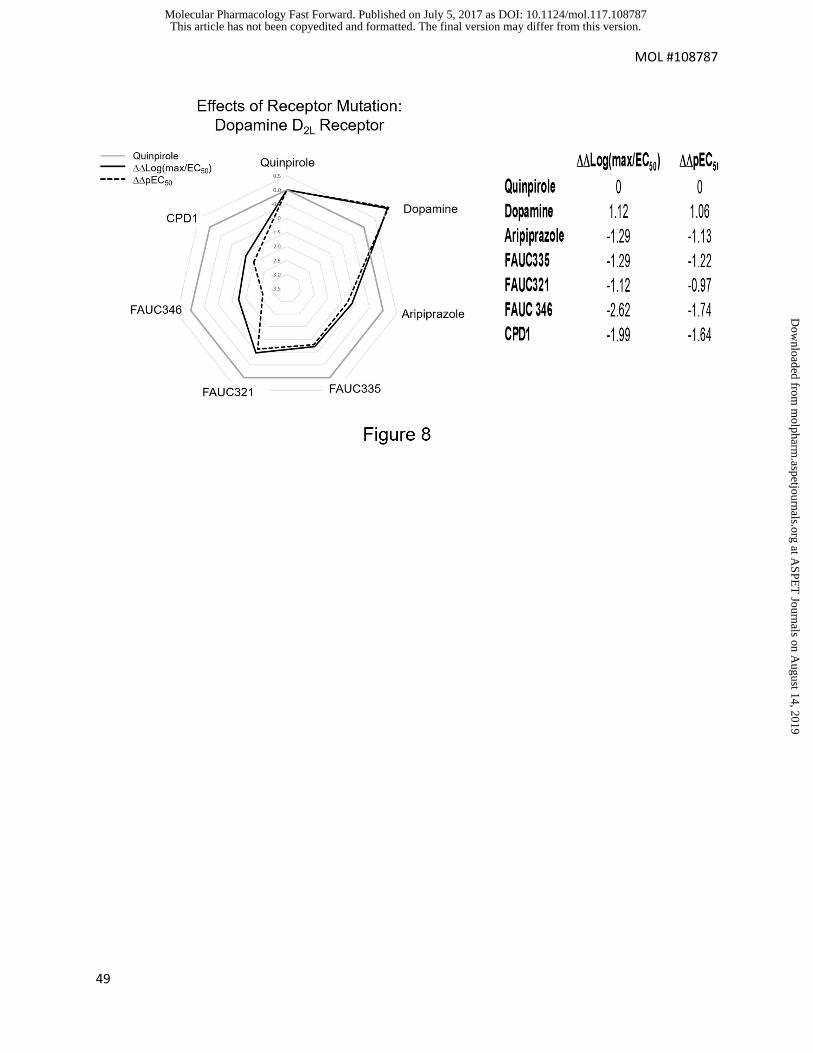
measured as an assessment of the effects of the mutation (Tschammer et al, 2011). Fig
8 shows the comparison of the wild type dopamine D2L receptor with a D2L H3936.35A
receptor mutant through Log(max/EC50) and pEC50 values; it can be seen from
this figure that, as with receptor selectivity and agonist bias, the effects of mutation are
under-estimated if pEC50 values are utilized (as opposed to Log(max/EC50)).
Quantifying PAM Effects
An important distinction between negative allosteric modulators (NAMs) and
positive allosteric modulators (PAMs) is that the effective affinity of the latter species
(PAMs) depends much more on the co-binding ligand than does the former (NAMs).
The reason for this comes from the expression for effective affinity of allosteric ligands
in the Stockton-Ehlert allosteric binding model (Stockton et al, 1983; Ehlert, 1988). This
predicts that the effective observed affinity of the allosteric modulator (expressed as
Kobs) is given by:
…[3]
This article has not been copyedited and formatted. The final version may differ from this version.Molecular Pharmacology Fast Forward. Published on July 5, 2017 as DOI: 10.1124/mol.117.108787
at ASPE
T Journals on A
ugust 14, 2019m
olpharm.aspetjournals.org
Dow
nloaded from
MOL #108787
17
where KB is the equilibrium dissociation constant of the modulator-receptor
complex with no co-binding ligand present and is the effect of the modulator on the
affinity of the co-binding ligand. It can be seen that for NAMs (where <<1), there will be
a negative effect of co-binding ligand commensurate with standard antagonist
experiments (i.e. basically a modified ‘Cheng-Prusoff’ (Cheng and Prusoff, 1973)
relationship between observed and micro- affinity). However, in vivo, ambient agonist
concentrations probably are not high and this modification of NAM potency will not be
extensive. In contrast, for PAMs where >>1, it can be seen that the co-binding ligand
will have a profound effect on the effective affinity of the modulator even for low
concentrations of agonist. For a NAM with =0.01 and assuming a concentration of
agonist = KA, the correction will be a factor of 1.1 whereas for a PAM with =100, the
correction will be a 50-fold increase in observed affinity. This effect means that a useful
estimation of the effective affinity of the PAM cannot be obtained in the absence of the
co-binding ligand, a fact implicitly considered in the standard screening assay for PAMs.
In these assays the PAM is added to an assay already partially activated by the
endogenous agonist. When this is done the resulting potentiation of the endogenous
agonist effect produces a sigmoidal concentration-response curve to the PAM referred
to as an ‘R50’ curve-see Fig 9.
An analysis of the midpoint and maximal asymptote of this curve yields an
interesting parameter of PAM activity. Specifically, it can be seen that the parameter
max/R50 (where R50 is EC50 of the R50 curve) of this curve (see fig 9) furnishes a
parameter of agonist potentiation that, when used as a ratio, provides a system-
independent measure of the power of the PAMs involved to potentiate agonist
This article has not been copyedited and formatted. The final version may differ from this version.Molecular Pharmacology Fast Forward. Published on July 5, 2017 as DOI: 10.1124/mol.117.108787
at ASPE
T Journals on A
ugust 14, 2019m
olpharm.aspetjournals.org
Dow
nloaded from

MOL #108787
18
response- see Appendix 4 for derivation. Specifically, differences between Log(max/R50)
values of R50 curves yield differences between the molecular system-independent
parameters describing PAM, namely and KB:
Log(max/R50) = Log(/KB) …[4]
This has the potential to be an extremely useful parameter since in theory it can
be used to measure the relative effects of PAMs in vivo. This is important since the
effective activity of PAMs is expressed only in the presence of the natural agonist and
the effect of this is relatively unknown in vivo. However, through standard
pharmacological null experimentation, R50 curves obtained in vivo can be used to
compare PAMs in a system independent manner by simply comparing the effects of the
PAMs on natural ambient agonist activity in the in vivo system. Fig 10 shows two
Log(max/R50) curves for in vitro potentiation of muscarinic receptor activity of
acetylcholine by two experimental PAMs (Mistry et al,2016). In this particular case, the
Log(max/R50) values indicate comparable PAM effects; this is confirmed by individual
estimation and calculation of Log(/KB) values measured from separate experiments
fitting data to the functional allosteric model. Specifically, the Log(/KB) estimate for
the compounds shown is 0.05 and the Log(max/R50) shows a comparable value
(Log(max/R50)=0.12). This method is based on the null cancellation of the basal
activity level of the system and the isolation of the effect of a PAM on that basal level of
response.
Conclusions
This article has not been copyedited and formatted. The final version may differ from this version.Molecular Pharmacology Fast Forward. Published on July 5, 2017 as DOI: 10.1124/mol.117.108787
at ASPE
T Journals on A
ugust 14, 2019m
olpharm.aspetjournals.org
Dow
nloaded from

MOL #108787
19
This paper proposes that two descriptive parameters for dose-response curves,
namely the EC50 and maximal response, can be used to furnish system-independent
ratios of agonist activity in a variety of settings. The inclusion of maximal response into
the index for agonism takes into account the heterogeneous effects of varying system
sensitivity on DR curves for partial and full agonists. This, in turn, allows seamless
comparisons to be made between full and partial agonists in functional systems. The
index, Log(max/EC50), embodies agonism into a single number which then lends itself to
statistical analysis and allows null methods to cancel tissue effects such as receptor
number, receptor coupling efficiency and amplification within functional assays between
agonists for any given system. Once this cancellation has been done, Log(max/EC50)
values become system-independent measures of the power of the test agonist(s)
(compared to a reference agonist) to induce response in the defined system. These
indices then can be used to compare different systems; thus, Log(max/EC50) values
can be used to quantify extracellular receptor selectivity, intracellular receptor selectivity
(biased signaling), cell-specific agonism, and the effects of receptor mutation on natural
signaling.
In addition, the same parameters from a different type of dose-response curve,
namely the potentiation of an ambient agonist response by a PAM, can be used to
quantify allosteric modulation both in vitro and in vivo. This may be especially useful for
the in vivo comparison of PAM effects since the affinity and potentiating activity of these
types of molecules are dependent upon the presence of the co-binding ligand (in this
case, the endogenous agonist) and this may be variable in vivo. However, if different
PAMs are compared under similar conditions in an in vivo system, relative measures of
This article has not been copyedited and formatted. The final version may differ from this version.Molecular Pharmacology Fast Forward. Published on July 5, 2017 as DOI: 10.1124/mol.117.108787
at ASPE
T Journals on A
ugust 14, 2019m
olpharm.aspetjournals.org
Dow
nloaded from

MOL #108787
20
PAM activity based on molecular parameters of ligand-receptor interaction, may be
derived.
These approaches are clearly applicable to the advancement of candidate
molecules in drug discovery programs (quantifying selectivity and bias). However, they
also can be used to quantify molecular properties of receptors (differences in receptor
signaling seen with receptor mutation) and even operational effects of different cell
types on receptor signaling. This latter process could be especially useful in the
optimization of cell type (i.e. pathology-related) agonism through medicinal chemistry.
This article has not been copyedited and formatted. The final version may differ from this version.Molecular Pharmacology Fast Forward. Published on July 5, 2017 as DOI: 10.1124/mol.117.108787
at ASPE
T Journals on A
ugust 14, 2019m
olpharm.aspetjournals.org
Dow
nloaded from
MOL #108787
21
Acknowledgements
I wish to thank the Bryan Roth lab group for stimulating and fruitful discussion of these concepts.
This article has not been copyedited and formatted. The final version may differ from this version.Molecular Pharmacology Fast Forward. Published on July 5, 2017 as DOI: 10.1124/mol.117.108787
at ASPE
T Journals on A
ugust 14, 2019m
olpharm.aspetjournals.org
Dow
nloaded from

MOL #108787
22
Authors contributions:
TPK wrote the manuscript
This article has not been copyedited and formatted. The final version may differ from this version.Molecular Pharmacology Fast Forward. Published on July 5, 2017 as DOI: 10.1124/mol.117.108787
at ASPE
T Journals on A
ugust 14, 2019m
olpharm.aspetjournals.org
Dow
nloaded from

MOL #108787
23
References
Black JW and Leff P (1983) Operational models of pharmacological agonism.
Proc R Soc Lond B Biol Sci 220:141–162.
Cheng YC, Prusoff WH. (1973) Relationship between the inhibition constant (Ki)
and the concentration of inhibitor which causes 50 percent inhibition (I50) of an
enzymatic reaction. Biochem Pharmacol 22:3099-3108.
Christmansson L, Westermark P, and Betsholtz C. (1994) Islet amyloid
polypeptide stimulates cyclic AMP accumulation via the porcine calcitonin receptor.
Biochem Biophys Res Commun 205:1226–1235.
Deng. H, Sun, H., Fang, Y. (2013) Label-free cell phenotypic assessment of the
biased agonism and efficacy of agonists at the endogenous muscarinic M3 receptors. J.
Pharmacol. Toxicol. Meth. 68: 323-333.
Ehlert FJ (1988) Estimation of the affinities of allosteric ligands using radioligand
binding and pharmacological null methods. Mol Pharmacol 33:187–194.
Ehlert FJ (2005) Analysis of allosterism in functional assays. J Pharmacol Exp
Ther 315:740–754.
Jarpe MB, Knall C, Mitchell FM, Buhl AM, Duzic E, and Johnson GL (1998) [D-
Arg1, D-Phe5,D-Trp7,9,Leu11]Substance P acts as a biased agonist toward
neuropeptide and chemokine receptors. J Biol Chem 273:3097–3104.
Karlin, A (1967) On the application of “a plausible model” of allosteric proteins to
the receptor for acetylcholine J. Theoret. Biol, 16: Volume 16, 306-320.
This article has not been copyedited and formatted. The final version may differ from this version.Molecular Pharmacology Fast Forward. Published on July 5, 2017 as DOI: 10.1124/mol.117.108787
at ASPE
T Journals on A
ugust 14, 2019m
olpharm.aspetjournals.org
Dow
nloaded from
MOL #108787
24
Kenakin T (1995) Agonist-receptor efficacy. II. Agonist trafficking of receptor
signals.Trends Pharmacol Sci 16:232–238.
Kenakin T (2005) New concepts in drug discovery: collateral efficacy and
permissive antagonism. Nat Rev Drug Discov 4:919–927.
Kenakin, T.P. (2015) The Gaddum Memorial Lecture 2014: Receptors as an
evolving concept: From switches to biased microprocessors. Br. J. Pharmacol. 172:
4238-4253
Kenakin, TP (2016) Synoptic pharmacology: Detecting and assessing the
pharmacological significance of ligands for orphan recetors. Pharmacol. Res. 114: 284-
290.
Kenakin, T. P. & Beek, D. (1982) In vitro studies on the cardiac activity of
prenalterol with reference to use in congestive heart failure. J. Pharmacol. Exp. Ther.
220:77-85.
Kenakin TP and Morgan PH (1989) Theoretical effects of single and multiple
transducer receptor coupling proteins on estimates of the relative potency of agonists.
Mol Pharmacol 35:214–222
Kenakin T & Miller LJ. (2010) Seven transmembrane receptors as shapeshifting
proteins: the impact of allosteric modulation and functional selectivity on new drug
discovery. Pharmacol Rev. 62(2):265-304.
Kenakin T & Christopoulos A. (2013) Signalling bias in new drug discovery:
detection, quantification and therapeutic impact.Nat Rev Drug Discov. 12(3):20516.
This article has not been copyedited and formatted. The final version may differ from this version.Molecular Pharmacology Fast Forward. Published on July 5, 2017 as DOI: 10.1124/mol.117.108787
at ASPE
T Journals on A
ugust 14, 2019m
olpharm.aspetjournals.org
Dow
nloaded from

MOL #108787
25
Kudlacek O, Waldhoer M, Kassack MU, Nickel P, Salmi JI, Freissmuth M, and
Nanoff C (2002) Biased inhibition by a suramin analogue of A1-adenosine receptor/G
protein coupling in fused receptor/G protein tandems: the A1-adenosine receptor is
predominantly coupled to Go-alpha in human brain. Naunyn Schmiedebergs Arch
Pharmacol 365:8–16.
Lawler CP, Prioleau C, Lewis MM, Mak C, Jiang D, Schetz JA, Gonzalez AM,
Sibley DR, and Mailman RB (1999) Interactions of the novel antipsychotic
aripiprazole(OPC-14597) with dopamine and serotonin receptor subtypes.
Neuropsychopharmacology 20:612–627.
Manning DR (2002) Measures of efficacy using G proteins as endpoints:
differential engagement of G proteins through single receptors. Mol Pharmacol 62:451–
452.
Mistry, S.N., Jorg, M, Lim, H, Vinh, NB, Sexton, PM, Capuano, B, et al. (2016) 4-
Phenylpyridin-2-one derivatives: A novel class of positive allosteric modulator of the M1
muscarinic acetylcholine receptor. J. Med. Chem. 59: 388-409.
Price MR, Baillie GL, Thomas A, Stevenson LA, Easson M, Goodwin R, McLean
A, McIntosh L, Goodwin G, Walker G, et al. (2005) Allosteric modulation of the
cannabinoid CB1 receptor. Mol Pharmacol 68:1484–1495.
Ringdahl, B. (1987) Selectivity of partial agonists related to oxotremorine based
on differences in muscarinic receptor reserve between the guinea pig ileum and urinary
bladder. Mol. Pharmacol. 31: 351-356.
This article has not been copyedited and formatted. The final version may differ from this version.Molecular Pharmacology Fast Forward. Published on July 5, 2017 as DOI: 10.1124/mol.117.108787
at ASPE
T Journals on A
ugust 14, 2019m
olpharm.aspetjournals.org
Dow
nloaded from

MOL #108787
26
Stockton JM, Birdsall NJ, Burgen AS, and Hulme EC (1983) Modification of the
binding properties of muscarinic receptors by gallamine. Pharmacol 23:551–557.
Thron, CD. (1973) On the Analysis of Pharmacological Experiments in Terms of
an Allosteric Receptor Model. Mol. Pharmacol. 9:1-9.
Tschammer, N, Bollinger, S, Kenakin, T., Gmeiner, P (2011) Histidine 6.55 is a
major determinant of ligand-biased signaling in dopamine D2L receptor. Mol.
Pharmacol. 79: 575-585.
Watt, M, Schober, DA, Hithcock,S, Liu, B., Chesterfield, AK, McKinzie, D, Felder,
CC. (2011). Pharmacological characterization of LY593093, an M1 muscarinic
acetylcholine receptor-selective partial orthosteric agonist. J. Pharmacol. Exp. Ther.
338: 622-632.
Watson C, Chen G, Irving P, Way J, Chen WJ, and Kenakin T (2000) The use of
stimulus-biased assay systems to detect agonist-specific receptor active states:
implications forthe traffickingof receptorstimulusby agonists.Mol Pharmacol58: 1230–
1238.
Whistler JL and von Zastrow M (1999) Dissociation of functional roles of dynamin
in receptor-mediated endocytosis and mitogenic signal transduction. J Biol Chem
274:24575–24578
White, K.L., Scopton, A.P., Rives, M.-L., Bikbulatov, R.V., Polepally, P.R., Brown,
P.J., Kenakin, T., Javich, J.A., Zjawiony, J.K., Roth, B.L. (2014) Identification of novel
functionally selective kappa opioid receptor scaffolds Mol. Pharmacol. 85: 83-90.
This article has not been copyedited and formatted. The final version may differ from this version.Molecular Pharmacology Fast Forward. Published on July 5, 2017 as DOI: 10.1124/mol.117.108787
at ASPE
T Journals on A
ugust 14, 2019m
olpharm.aspetjournals.org
Dow
nloaded from

MOL #108787
27
Legends for Figures
Fig 1. Effect of changing receptor density (and/or tissue sensitivity) on
concentration response to a high efficacy agonist (Agonist1) and low Efficacy Agonist
(Agonist2). A. Concentration response curves to Agonist1 (Solid line curves) and
Agonist2 (dotted line curves) with increasing sensitivity of tissue. Note how less sinistral
displacement of EC50 values for Agonist2 are observed vs that for Agonist1. B.
Log(max/EC50) values (solid line) and pEC50 values (dotted line) with changing tissue
sensitivity for Agonists 1 and 2. Note how pEC50 values vary with tissue sensitivity
whereas Log(max/EC50) values remain stable
Fig 2. Ratios of Log(max/EC50) values for the -adrenoceptor full agonist
isoproterenol and the partial agonist prenalterol (Left ordinate axis; data as open circles)
as a function of the maximal response to prenalterol in range of isolated tissues
(Abscissae). Dotted line shows the ratio of pEC50 values (Right ordinate axis; data in
filled circles). Data from Kenakin and Beek (1982).
Fig 3 Effects of efficacy (range of receptor densities) and slope of the agonist
concentration-response curve (Slope) on differences between indices of agonism as
calculated by Log(/KA) vs Log(max/EC50) values.
Fig 4. Radar plot showing muscarinic receptor selectivity for four agonists
activating M1 vs M4 receptors. Selectivity expressed as Log(max/EC50) values (solid
line) and pEC50 values (dotted line). Data recalculated from Watt et al, 2011.
Fig 5. Radar plot of receptor selectivity, compared to acetylcholine as a reference
agonist, expressed as Log(max/EC50) values (solid line) and pEC50 values (dotted
This article has not been copyedited and formatted. The final version may differ from this version.Molecular Pharmacology Fast Forward. Published on July 5, 2017 as DOI: 10.1124/mol.117.108787
at ASPE
T Journals on A
ugust 14, 2019m
olpharm.aspetjournals.org
Dow
nloaded from
MOL #108787
28
line) for 8 muscarinic agonists for agonism in guinea pig ileum and urinary bladder. Data
from Ringdahl (1987). Column furthest to the right in the table indicates the maxima of
agonists relative to that of acetylcholine- note how LogpEC50 values deviation from
Log(max/EC50) increases with partial agonism.
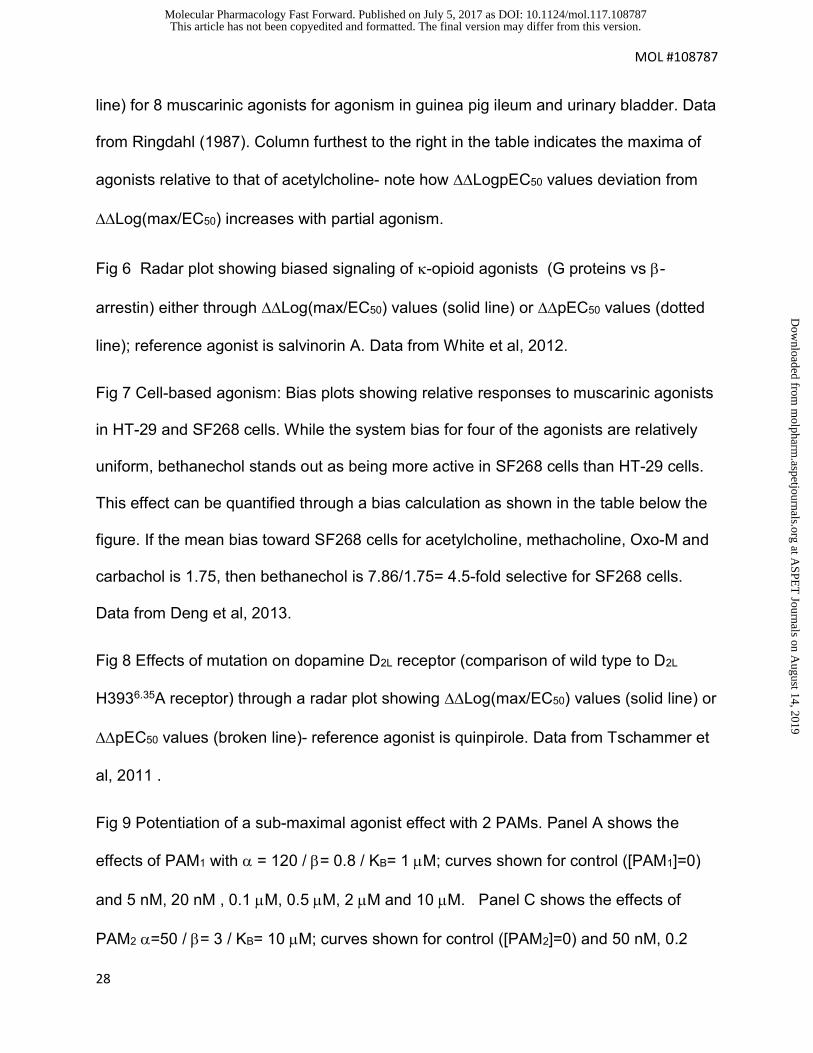
Fig 6 Radar plot showing biased signaling of -opioid agonists (G proteins vs -
arrestin) either through Log(max/EC50) values (solid line) or pEC50 values (dotted
line); reference agonist is salvinorin A. Data from White et al, 2012.
Fig 7 Cell-based agonism: Bias plots showing relative responses to muscarinic agonists
in HT-29 and SF268 cells. While the system bias for four of the agonists are relatively
uniform, bethanechol stands out as being more active in SF268 cells than HT-29 cells.
This effect can be quantified through a bias calculation as shown in the table below the
figure. If the mean bias toward SF268 cells for acetylcholine, methacholine, Oxo-M and
carbachol is 1.75, then bethanechol is 7.86/1.75= 4.5-fold selective for SF268 cells.
Data from Deng et al, 2013.
Fig 8 Effects of mutation on dopamine D2L receptor (comparison of wild type to D2L
H3936.35A receptor) through a radar plot showing Log(max/EC50) values (solid line) or
pEC50 values (broken line)- reference agonist is quinpirole. Data from Tschammer et
al, 2011 .
Fig 9 Potentiation of a sub-maximal agonist effect with 2 PAMs. Panel A shows the
effects of PAM1 with = 120 / = 0.8 / KB= 1 M; curves shown for control ([PAM1]=0)
and 5 nM, 20 nM , 0.1 M, 0.5 M, 2 M and 10 M. Panel C shows the effects of
PAM2 =50 / = 3 / KB= 10 M; curves shown for control ([PAM2]=0) and 50 nM, 0.2
This article has not been copyedited and formatted. The final version may differ from this version.Molecular Pharmacology Fast Forward. Published on July 5, 2017 as DOI: 10.1124/mol.117.108787
at ASPE
T Journals on A
ugust 14, 2019m
olpharm.aspetjournals.org
Dow
nloaded from

MOL #108787
29
M, 1 M, 5 M, 20 M and 100 M. Panel B shows the dose-response curves for the
PAMs (R50 curves) as potentiation of the agonist response. Log(max/EC50) value for
PAM1 = 6.58 and Log(max/EC50) for PAM2 = 5.76 providing a Log(max/EC50) value of
0.82. From separate estimates of , , and KB used to construct the curves the value for
Log(/KB) is 0.81.
Fig 10. R50 curves for 2 PAMs for muscarinic M1 receptors (filled circles = CMPD 10d /
open circles CMPD 1). Table on right shows calculation of Log(max/R50) values (0.12);
Log(/KB) = 0.05 from separate estimation of , and KB (Mistry et al, 2016).
This article has not been copyedited and formatted. The final version may differ from this version.Molecular Pharmacology Fast Forward. Published on July 5, 2017 as DOI: 10.1124/mol.117.108787
at ASPE
T Journals on A
ugust 14, 2019m
olpharm.aspetjournals.org
Dow
nloaded from
MOL #108787
30
Table 1
Practical Application of the Log(max/EC50) Scale to Quantify Selectivity
Procedure Rationale
1. Fit DR date to a function to yield max (maximal response) and EC50
(concentration of agonist producing 50% maximal response to the agonist).This furnishes individual values for Log(max/EC50), a single index of agonism
2. Choose a reference agonist for comparison of all test agonists; use the same reference for all systems (receptors, pathways, cell types)
Ratios to the index for the reference aognist will allow cancellation of receptor denstiy, cell sensitivity, assay sensitivity differences
3. Calculate log(max/EC50) values for each test agonist
( LLog(max/EC50) = Log(max/EC50)ref - Log(max/EC50)test)
This will scale the agonist activity of the test agonist to the reference agonist within a given system (receptor type, signaling pathway, cell type etc)
4. Calculate Log(max/EC50) values across the 2 systems being compared (different receptors, signaling pathways, cell types, receptor protein sequence) (Log(max/EC50) = Log(max/EC50)ref - Log(max/EC50)test)
With the individual differences in sensitivity between the two systems cancelled, Log(max/EC50) values provide a system independent measure of the relative agonism of each test agonist in both systems
This article has not been copyedited and formatted. The final version may differ from this version.Molecular Pharmacology Fast Forward. Published on July 5, 2017 as DOI: 10.1124/mol.117.108787
at ASPE
T Journals on A
ugust 14, 2019m
olpharm.aspetjournals.org
Dow
nloaded from

MOL #108787
31
Table 2
M1/M4 Receptor Selectivity for Agonists
Data from Watt et al, 2011.
max EC50 (nM) Log(max/EC50) pEC50 log(max/EC50) Rel. Ag.1pEC50 Rel Ag.2
Relative Agonism at M1 ReceptorsAch 1 25.7 7.59 7.59 0.00 1.000 0 1.000Sabcomeline 0.389 56.2 6.84 7.25 -0.75 0.178 -0.34 0.457Talsadidine 0.693 812.8 5.93 6.09 -1.66 0.022 -1.5 0.032Xanolamine 0.637 43.7 7.16 7.36 -0.43 0.375 -0.23 0.589
Relative Agonism at M4 ReceptorsAch 0.87 52.5 7.22 7.28 0.00 1.000 0 1.000Sabcomeline 0.2 67.6 6.47 7.17 -0.75 0.178 -0.11 0.776Talsadidine 0.216 794.3 5.43 6.1 -1.79 0.016 -1.18 0.066Xanolamine 0.46 63.1 6.86 7.2 -0.36 0.440 -0.08 0.832
Talsadidine selectivity calculated as Log(max/EC50)
Log(max/EC50)= 0.13 : Talsadidine is 100.13 = 1.38 selective for M1 receptors
Talsadidine selectivity calculated as pEC50
pEC50= -0.32: Talsadidine is 10-0.32= 0.48 selective for M1 receptors (2.1x selective for M4 receptors)1 Relative Agonism based on Log(max/EC50) values2 Relative Agonism based on EC50 values
This article has not been copyedited and formatted. The final version may differ from this version.Molecular Pharmacology Fast Forward. Published on July 5, 2017 as DOI: 10.1124/mol.117.108787
at ASPE
T Journals on A
ugust 14, 2019m
olpharm.aspetjournals.org
Dow
nloaded from

MOL #108787
42
This article has not been copyedited and formatted. The final version may differ from this version.Molecular Pharmacology Fast Forward. Published on July 5, 2017 as DOI: 10.1124/mol.117.108787
at ASPE
T Journals on A
ugust 14, 2019m
olpharm.aspetjournals.org
Dow
nloaded from
MOL #108787
43
This article has not been copyedited and formatted. The final version may differ from this version.Molecular Pharmacology Fast Forward. Published on July 5, 2017 as DOI: 10.1124/mol.117.108787
at ASPE
T Journals on A
ugust 14, 2019m
olpharm.aspetjournals.org
Dow
nloaded from
MOL #108787
44
This article has not been copyedited and formatted. The final version may differ from this version.Molecular Pharmacology Fast Forward. Published on July 5, 2017 as DOI: 10.1124/mol.117.108787
at ASPE
T Journals on A
ugust 14, 2019m
olpharm.aspetjournals.org
Dow
nloaded from
MOL #108787
45
This article has not been copyedited and formatted. The final version may differ from this version.Molecular Pharmacology Fast Forward. Published on July 5, 2017 as DOI: 10.1124/mol.117.108787
at ASPE
T Journals on A
ugust 14, 2019m
olpharm.aspetjournals.org
Dow
nloaded from

MOL #108787
46
This article has not been copyedited and formatted. The final version may differ from this version.Molecular Pharmacology Fast Forward. Published on July 5, 2017 as DOI: 10.1124/mol.117.108787
at ASPE
T Journals on A
ugust 14, 2019m
olpharm.aspetjournals.org
Dow
nloaded from
MOL #108787
47
This article has not been copyedited and formatted. The final version may differ from this version.Molecular Pharmacology Fast Forward. Published on July 5, 2017 as DOI: 10.1124/mol.117.108787
at ASPE
T Journals on A
ugust 14, 2019m
olpharm.aspetjournals.org
Dow
nloaded from

MOL #108787
48
This article has not been copyedited and formatted. The final version may differ from this version.Molecular Pharmacology Fast Forward. Published on July 5, 2017 as DOI: 10.1124/mol.117.108787
at ASPE
T Journals on A
ugust 14, 2019m
olpharm.aspetjournals.org
Dow
nloaded from
MOL #108787
49
This article has not been copyedited and formatted. The final version may differ from this version.Molecular Pharmacology Fast Forward. Published on July 5, 2017 as DOI: 10.1124/mol.117.108787
at ASPE
T Journals on A
ugust 14, 2019m
olpharm.aspetjournals.org
Dow
nloaded from

MOL #108787
50
This article has not been copyedited and formatted. The final version may differ from this version.Molecular Pharmacology Fast Forward. Published on July 5, 2017 as DOI: 10.1124/mol.117.108787
at ASPE
T Journals on A
ugust 14, 2019m
olpharm.aspetjournals.org
Dow
nloaded from

MOL #108787
51
This article has not been copyedited and formatted. The final version may differ from this version.Molecular Pharmacology Fast Forward. Published on July 5, 2017 as DOI: 10.1124/mol.117.108787
at ASPE
T Journals on A
ugust 14, 2019m
olpharm.aspetjournals.org
Dow
nloaded from

MOL #108787
32
Appendix 1. Agonism as a Positive Allosteric Modulation of Receptor-Signaling
Protein Interaction
The functional allosteric model (scheme 1) yields two receptor species that
produce cellular response, namely [RG] and [ARG]. These interact with the cell stimulus
response mechanisms: [RG] with an equilibrium dissociation constant KE to a signaling
species [RGE] and [ARG] producing response with an equilibrium dissociation constant
K’E to a signaling species [ARGE].
From scheme 1 the system defines the following:
[RG] = [ARG]/[A]K’a ……[5]
[AR] = [ARG]/[G]Kg …..[6]
[R] = [ARG]/[A]K’a[G]Kg …..[7]
The receptor conservation equation ([Rtot] = [R] + [AR] + [RG] + [ARG]) can be re-written
using equations 5 to 7 as:
[Rtot] = [G]/KG (1 + [A]/K’A) + [A]/K’A + 1 ….[8]
where KG and K’A are equilibrium dissociation constants (K’A= 1/K’a and KG=
1/Kg). Substituting the term in equation 8 for [Rtot] and defining the fraction of receptors
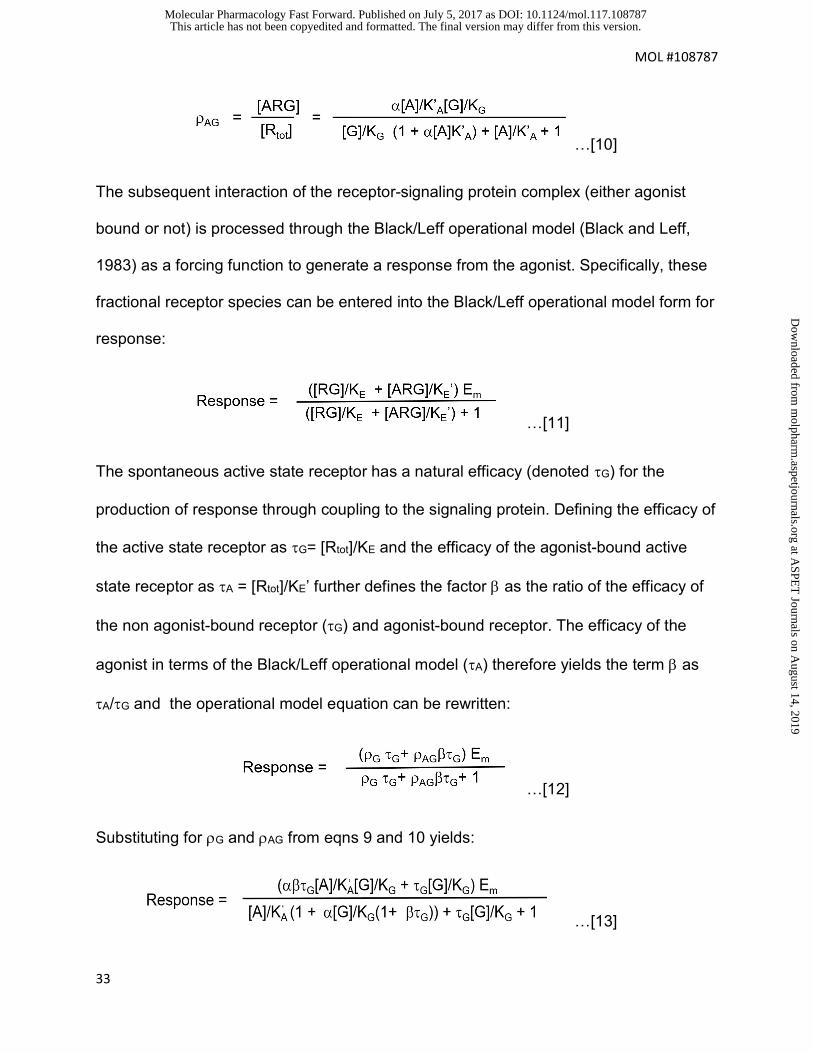
RG as G and ARG as AG respectively yields:
…[9]
This article has not been copyedited and formatted. The final version may differ from this version.Molecular Pharmacology Fast Forward. Published on July 5, 2017 as DOI: 10.1124/mol.117.108787
at ASPE
T Journals on A
ugust 14, 2019m
olpharm.aspetjournals.org
Dow
nloaded from
MOL #108787
33
…[10]
The subsequent interaction of the receptor-signaling protein complex (either agonist
bound or not) is processed through the Black/Leff operational model (Black and Leff,
1983) as a forcing function to generate a response from the agonist. Specifically, these
fractional receptor species can be entered into the Black/Leff operational model form for
response:
…[11]
The spontaneous active state receptor has a natural efficacy (denoted G) for the
production of response through coupling to the signaling protein. Defining the efficacy of
the active state receptor as G= [Rtot]/KE and the efficacy of the agonist-bound active
state receptor as A = [Rtot]/KE’ further defines the factor as the ratio of the efficacy of
the non agonist-bound receptor (G) and agonist-bound receptor. The efficacy of the
agonist in terms of the Black/Leff operational model (A) therefore yields the term as
A/G and the operational model equation can be rewritten:
…[12]
Substituting for G and AG from eqns 9 and 10 yields:
…[13]
This article has not been copyedited and formatted. The final version may differ from this version.Molecular Pharmacology Fast Forward. Published on July 5, 2017 as DOI: 10.1124/mol.117.108787
at ASPE
T Journals on A
ugust 14, 2019m
olpharm.aspetjournals.org
Dow
nloaded from
MOL #108787
34
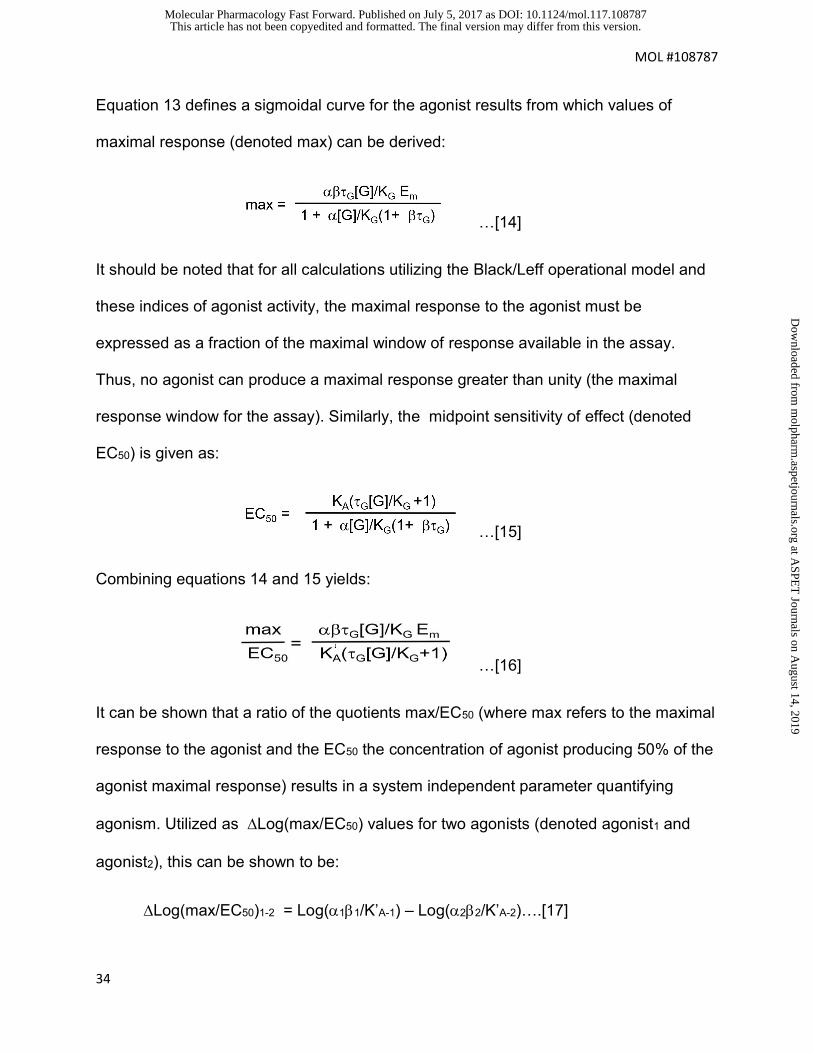
Equation 13 defines a sigmoidal curve for the agonist results from which values of
maximal response (denoted max) can be derived:
…[14]
It should be noted that for all calculations utilizing the Black/Leff operational model and
these indices of agonist activity, the maximal response to the agonist must be
expressed as a fraction of the maximal window of response available in the assay.
Thus, no agonist can produce a maximal response greater than unity (the maximal
response window for the assay). Similarly, the midpoint sensitivity of effect (denoted
EC50) is given as:
…[15]
Combining equations 14 and 15 yields:
…[16]
It can be shown that a ratio of the quotients max/EC50 (where max refers to the maximal
response to the agonist and the EC50 the concentration of agonist producing 50% of the
agonist maximal response) results in a system independent parameter quantifying
agonism. Utilized as Log(max/EC50) values for two agonists (denoted agonist1 and
agonist2), this can be shown to be:
Log(max/EC50)1-2 = Log(11/K’A-1) – Log(22/K’A-2)….[17]
This article has not been copyedited and formatted. The final version may differ from this version.Molecular Pharmacology Fast Forward. Published on July 5, 2017 as DOI: 10.1124/mol.117.108787
at ASPE
T Journals on A
ugust 14, 2019m
olpharm.aspetjournals.org
Dow
nloaded from

MOL #108787
35
Specifically, Equation 17 reveals that Log(max/EC50) is a combination of an assay and
tissue term and a strictly agonist term (specifically /K’A):
…[18]
Therefore, the ratio of max/EC50 values, which subtracts and thus cancels the two
Log((G[G]/KGEm)/(G[G]/KG +1)) terms is independent of the assay and tissue effects
and becomes a unique identifier of for the two agonists; for agonist1 and agonist2
the Log(max/EC50) is Log(/K’A) which is a system independent ratio of agonism.
The value /K’A is comprised of only drug parameters ( is the change in the
affinity of the receptor for the signaling protein produced by the binding of the agonist
and reciprocally the affinity of the agonist when the signaling protein interacts with the
receptor), K’A is the equilibrium dissociation of the receptor agonist complex when the
receptor does not interact with the signaling protein and the change in the efficacy of
the receptor for production of response produced by the agonist.
Appendix 2. Relationship Between Log(max/EC50) and Log(/KA) Through the
Black/Leff Operational Model
Agonist response is modeled by the Black/Leff Operational model for systems
yielding response with a variable Hill coefficient slope as (Black et al, 1985):
…[19]
This article has not been copyedited and formatted. The final version may differ from this version.Molecular Pharmacology Fast Forward. Published on July 5, 2017 as DOI: 10.1124/mol.117.108787
at ASPE
T Journals on A
ugust 14, 2019m
olpharm.aspetjournals.org
Dow
nloaded from

MOL #108787
36
where A is the efficacy of the agonist, n the Hill coefficient of the agonist
concentration-response curve and Em the maximal response window of the functional
assay. It should be noted that the K’A in equation 18 in terms of the Black/Leff model is
the equilibrium dissociation constant of the agonist-response complex for agonism with
the receptor interacting with the signaling protein. Therefore the KA term is the
operational equilibrium dissociation constant of the agonist-receptor complex, i.e.
agonist binding to the receptor as it interacts with the signaling protein. If the agonist is
viewed as a modulator of signaling protein interaction then the operational KA is equal
to/K’A. Black et al (1985) provided expressions for the maximal response (max) as:
…[20]
And for the EC50 for half maximal response as:
…[21]
This leads to an expression for max/EC50 of:
…..[22]
For n=1, max/EC50= Em/KA; ratios of (max/EC50) values cancel the tissue Em
term and yield a strictly agonist-dependent term /KA. Therefore ratios of max/EC50
values (in the form of Log(max/EC50) values for systems where the slope of the
agonist concentration response curves is not significantly different form unity) yield
strictly agonist dependent (and system-independent) values for relative agonism:
This article has not been copyedited and formatted. The final version may differ from this version.Molecular Pharmacology Fast Forward. Published on July 5, 2017 as DOI: 10.1124/mol.117.108787
at ASPE
T Journals on A
ugust 14, 2019m
olpharm.aspetjournals.org
Dow
nloaded from

MOL #108787
37
…[23]
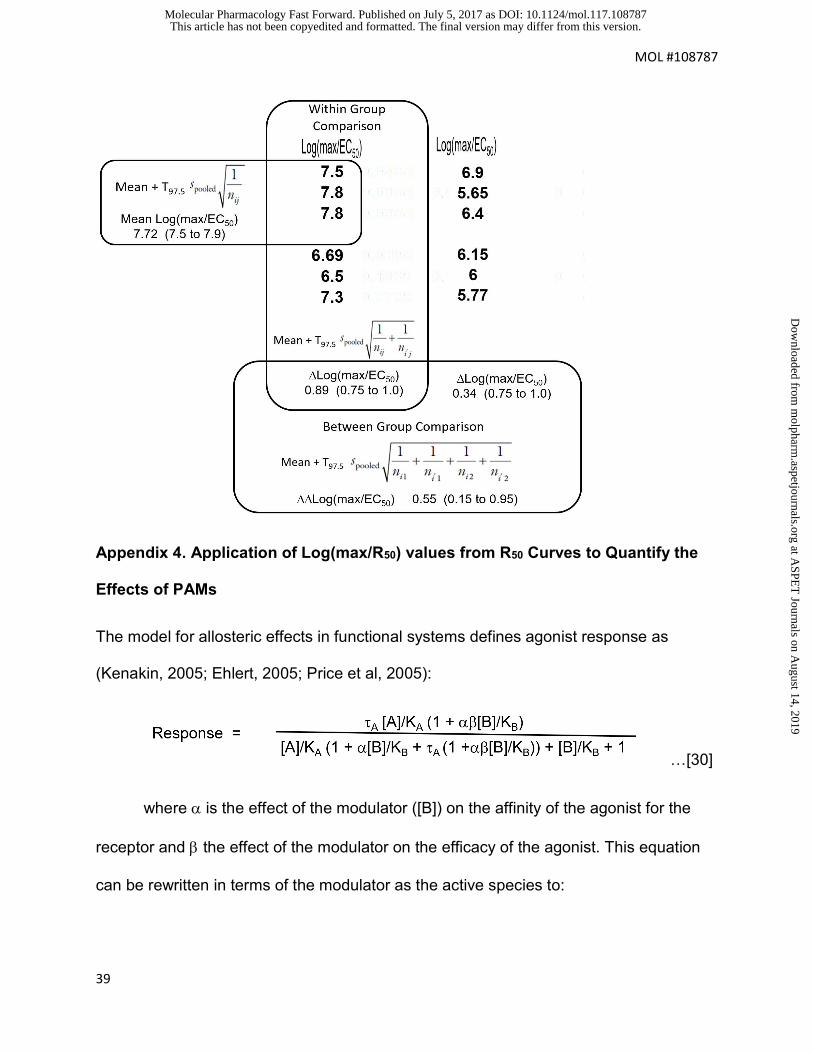
Appendix 3. Statistical Assessment of Difference Using Log(max/EC50) Values
If individual estimates of Log(max/EC50) are available, then a statistical estimate
of mean Log(max/EC50) values, Log(max/EC50) values and Log(max/EC50) values
can be calculated in the form of 95% confidence limits of the estimated values. For a
set of k to n values for agonist y activating signaling system j, sij2 is defined as:
[24]
Values for sij2 are calculated for sets of K agonists and all signaling pathways to
yield a pooled variance defined by:
…[25]
Where dferror is given as:
….[26]
From these values, a 95% confidence limit with two-tailed T values (T97.5) can be
calculated. For a mean Log(max/EC50) estimate:
…[27]
This article has not been copyedited and formatted. The final version may differ from this version.Molecular Pharmacology Fast Forward. Published on July 5, 2017 as DOI: 10.1124/mol.117.108787
at ASPE
T Journals on A
ugust 14, 2019m
olpharm.aspetjournals.org
Dow
nloaded from

MOL #108787
38
Within any one assay, agonist comparison to a standard yields a ratio of Log(max/EC50)
values denoted as Log(max/EC50). The 95% c.l. of this ratio is defined as:
…[28]
Once values have been normalized to a reference standard agonist within each group
(receptor type, signaling pathway, cell type), then a 95% c.l. can be calculated for
selectivity or bias for the Log(max/EC50) value as:
….[29]
The application of these formulae are depicted in the figure below.
This article has not been copyedited and formatted. The final version may differ from this version.Molecular Pharmacology Fast Forward. Published on July 5, 2017 as DOI: 10.1124/mol.117.108787
at ASPE
T Journals on A
ugust 14, 2019m
olpharm.aspetjournals.org
Dow
nloaded from
MOL #108787
39
Appendix 4. Application of Log(max/R50) values from R50 Curves to Quantify the
Effects of PAMs
The model for allosteric effects in functional systems defines agonist response as
(Kenakin, 2005; Ehlert, 2005; Price et al, 2005):
…[30]
where is the effect of the modulator ([B]) on the affinity of the agonist for the
receptor and the effect of the modulator on the efficacy of the agonist. This equation
can be rewritten in terms of the modulator as the active species to:
This article has not been copyedited and formatted. The final version may differ from this version.Molecular Pharmacology Fast Forward. Published on July 5, 2017 as DOI: 10.1124/mol.117.108787
at ASPE
T Journals on A
ugust 14, 2019m
olpharm.aspetjournals.org
Dow
nloaded from

MOL #108787
40
…[31]
This defines the R50 curve for a potentiating modulator (PAM) increasing the
effect of an ambient agonist response due to a presence of agonist acting on the
receptor (in the form of [A]/KA).
The maximal response of the R50 curve is thus given as:
…[32]
And the half maximal effect of the R50 curve (defined as the R50) is given as:
…[33]
This leads to the ratio of max/R50 as:
…[34]
It can be seen that this expression is a mixture of tissue specific and agonist specific
factors:
…[35]
Therefore ratios of max/R50 values can provide system independent estimates of the
relative activity of PAMs in potentiating agonist response:
This article has not been copyedited and formatted. The final version may differ from this version.Molecular Pharmacology Fast Forward. Published on July 5, 2017 as DOI: 10.1124/mol.117.108787
at ASPE
T Journals on A
ugust 14, 2019m
olpharm.aspetjournals.org
Dow
nloaded from
MOL #108787
41
Log(max/R50)A-B = Log(/KB)A – Log(/KB)B …[36]
This article has not been copyedited and formatted. The final version may differ from this version.Molecular Pharmacology Fast Forward. Published on July 5, 2017 as DOI: 10.1124/mol.117.108787
at ASPE
T Journals on A
ugust 14, 2019m
olpharm.aspetjournals.org
Dow
nloaded from


![(70% insulin aspart [rDNA origin] protamine suspension and ...NDA 21-172/S-001 Final revision (FDA revision #3, Novo’s submission date: 3/15/02) Page 2 38 onset compared to Novolin](https://img.pdfslide.us/doc/110x75/608fc3e7d19d0c4c2e1e527d/70-insulin-aspart-rdna-origin-protamine-suspension-and-nda-21-172s-001.jpg)