Embed Size (px)
DESCRIPTION
Sample
Citation preview

6/17/2010 MS Project Example 1
MS Project Example
Project Management Unit

6/17/2010 MS Project Example 2
New Project Screen• On starting Project a blank template will appear.

6/17/2010 MS Project Example 3
Basic Project Information• From the “Project” menu select “Project Information” and
enter the anticipated project start date.

6/17/2010 MS Project Example 4
Enter the major tasks• Type in the major tasks (WBS level 1) in the “Task Name” box.• Each row is a separate task• Do not worry about the rest of the columns for now
6/17/2010 MS Project Example 5
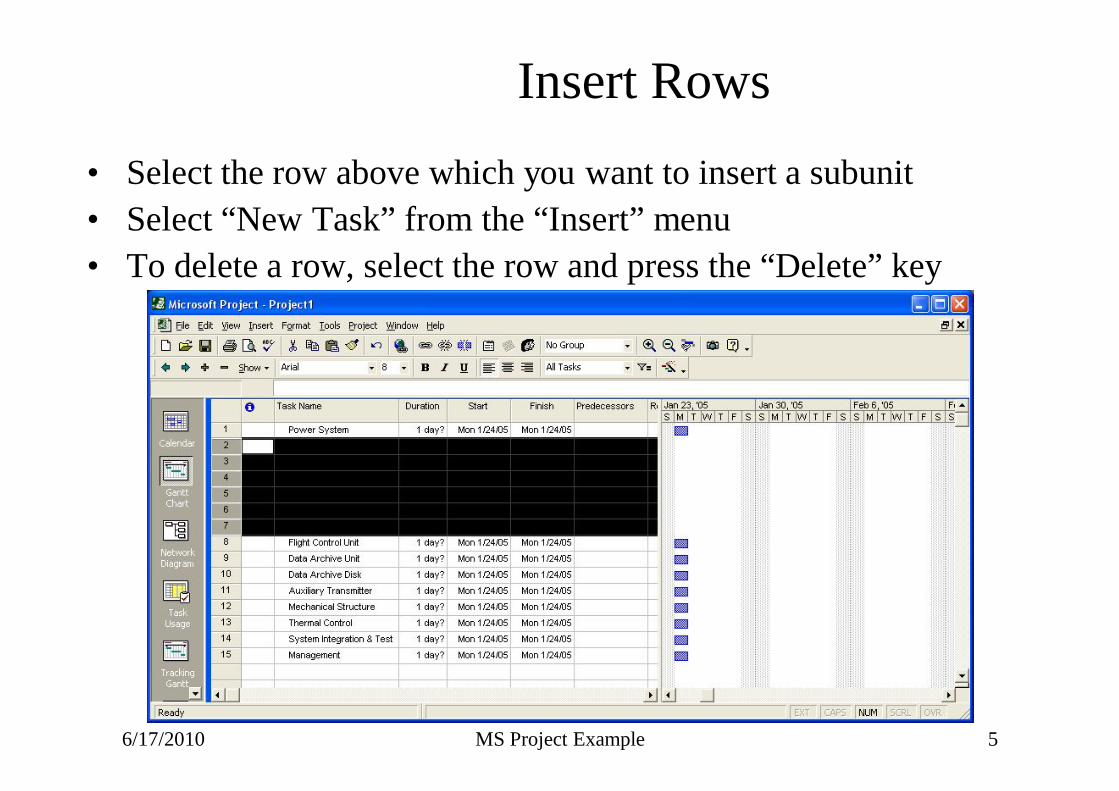
Insert Rows• Select the row above which you want to insert a subunit• Select “New Task” from the “Insert” menu• To delete a row, select the row and press the “Delete” key

6/17/2010 MS Project Example 6
Enter the subunit task names• Type in the name of the subunit task in the “Task Name” field• Subunits are “indented” with the right arrow on the task bar• When subunits are so “indented” the major unit will become
bold and the Gantt chart bar will change shape

6/17/2010 MS Project Example 7
Complete entering WBS• Process of inserting rows, typing in the task name and indenting
the subunit continues until all tasks in the WBS are entered

6/17/2010 MS Project Example 8
Display the WBS code• Select the “Information” column, right click and choose “Hide
Column”.• Next select the “Task Name” column and from the “Insert”
menu select “Column”. The following pop-up will appear.• Choose “WBS” as the “Field name”

6/17/2010 MS Project Example 9
Showing the WBS code• The correct WBS code number will now be displayed for all
tasks
6/17/2010 MS Project Example 10
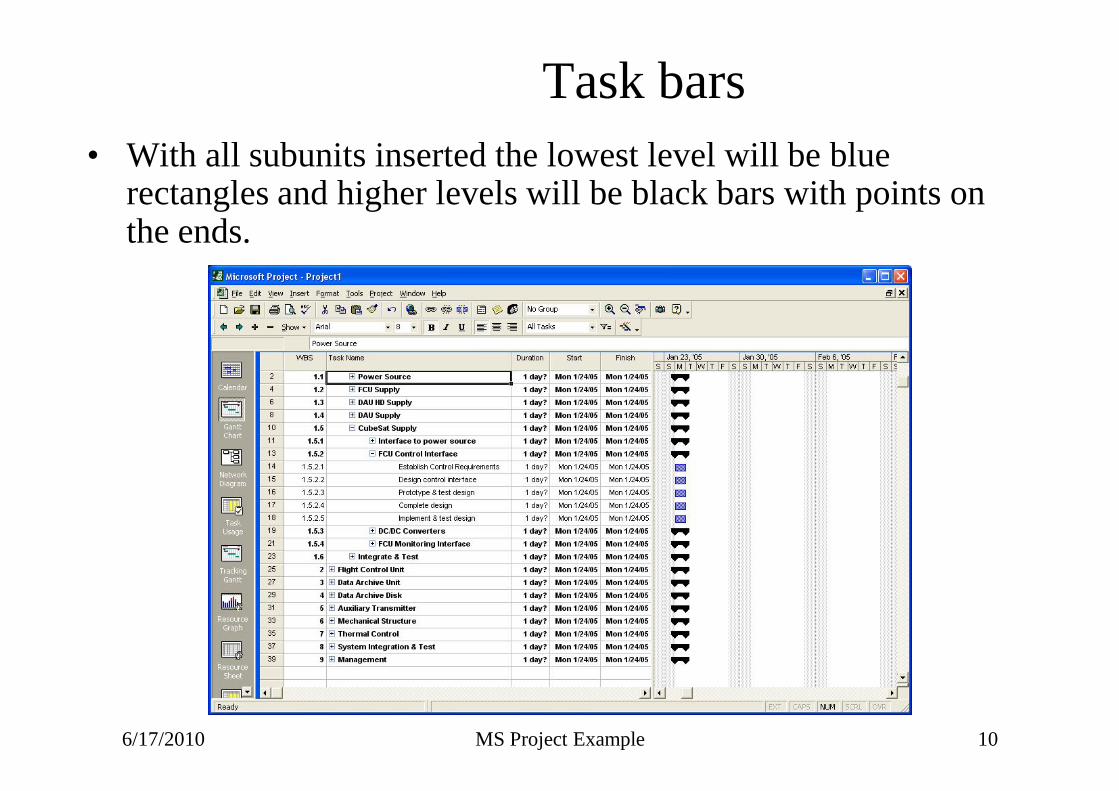
Task bars• With all subunits inserted the lowest level will be blue
rectangles and higher levels will be black bars with points on the ends.

6/17/2010 MS Project Example 11
Distinguishing different levels• You can change the color of the task bar to distinguish between
the different levels in your WBS• Select the task bar to change (in the Gantt chart area), right click
and select “Format Bar”.• Change the color of the “Start”, “Middle” and “End”

6/17/2010 MS Project Example 12
Results after task bar change• The results of changing the task bar color are shown below

6/17/2010 MS Project Example 13
Set the task durations• Now enter the time associated with each task in the “Duration”
field. See the MS Project Help for choices on units.• Set durations for the lowest level tasks and the total time will be
summarized or rolled-up to the next highest level.

6/17/2010 MS Project Example 14
Set the task predecessors• Enter the task dependence (i.e. which tasks must be complete
prior to starting the next task) in the “Predecessors” field.• You need to use the row number, not the WBS code.

6/17/2010 MS Project Example 15
Enter all predecessors• Here all the task predecessors are determined and entered, but
the Gantt chart now needs room to display fully

6/17/2010 MS Project Example 16
Set the timescale of the chart• From the “Format” menu select “Timescale”• Set the Major Scale to Months• Set the Minor Scale to Weeks

6/17/2010 MS Project Example 17
After timescale change• Now the full Gantt chart from project start to end can be
displayed

6/17/2010 MS Project Example 18
Make an image for documents• To make a GIF image that can be inserted into documents, first
arrange the chart and task info boundaries to display just what you want.
• From the “Edit” menu select “Copy Picture”• Select “To GIF image file:” and enter a filename for the image
• Select what to copy: Rows on screen or Selected Rows
• Select the timescale as either what is shown on the screen or for specific dates
• Click OK and the image will be generated.
6/17/2010 MS Project Example 19
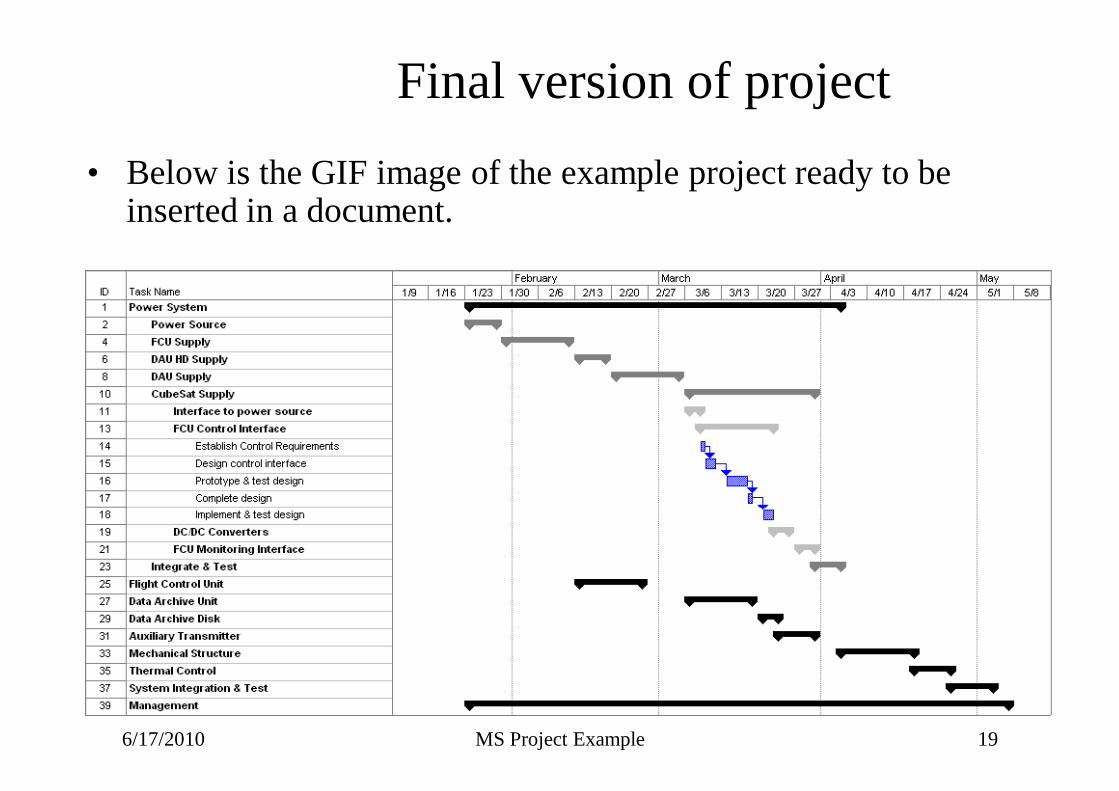
Final version of project• Below is the GIF image of the example project ready to be
inserted in a document.


![Game Based Carrom Tutor - CSE, IIT Bombaysri/students/mrinal-slides.pdf · IntroductionCarrom Tutor 1.0Carrom Tutor 2.0User Experiments Game Based Carrom Tutor Mayur Katke [123050069]](https://img.pdfslide.us/doc/110x75/5abb96027f8b9a567c8ccbad/game-based-carrom-tutor-cse-iit-bombay-sristudentsmrinal-tutor-10carrom-tutor.jpg)