Embed Size (px)
Citation preview

Ms. Mili Majumdar
Managing Director, GBCI, New Delhi
THIS PRESENTATION WAS SHARED BY
FOR THE SESSION:
Policy Framework for Energy Efficiency in Buildings (Rating and
Labelling System)”
DURING ANGAN 2019
Mili Majumdar Managing Director , GBCI, India
Sr. Vice President , U.S. Green Building Council
Revisiting Rating System Narrative: Connect Performance and people
Angan 2019, September 10,New Delhi
U.S. GREEN BUILDING COUNCIL
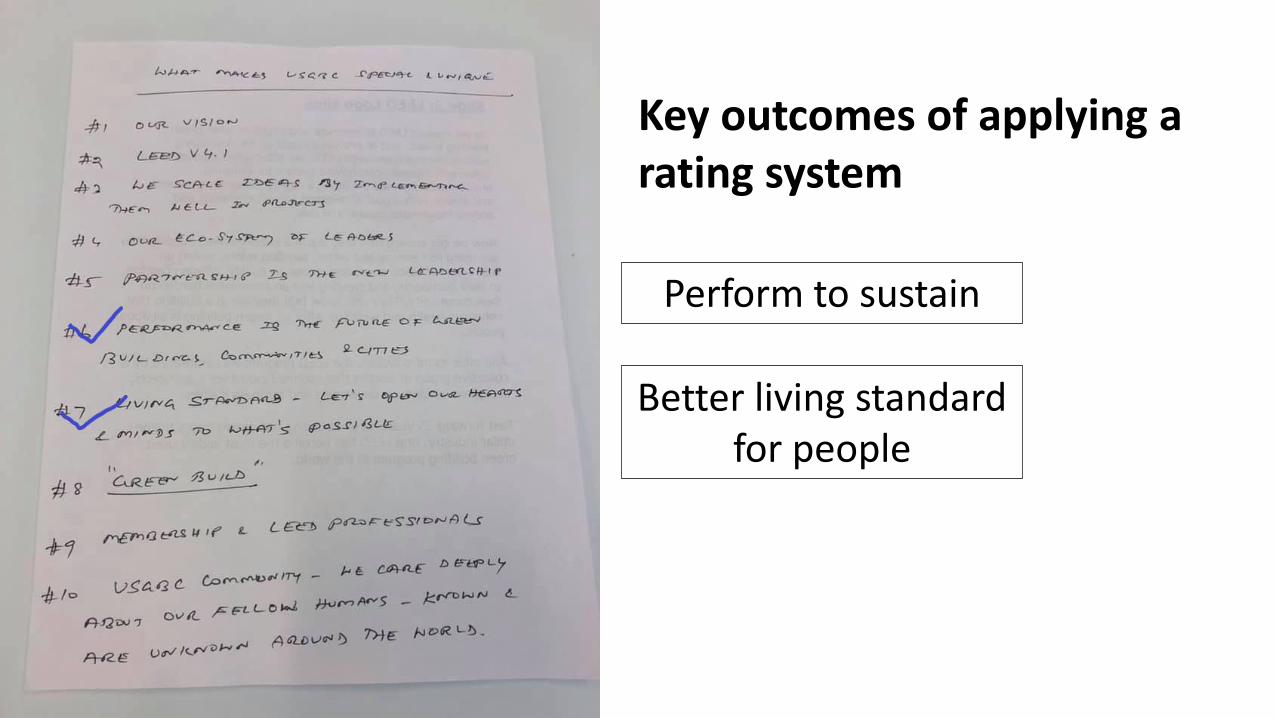
Perform to sustain
Better living standard for people
Key outcomes of applying a rating system

LEED v4.1 for Operations & Maintenance: Existing Buildings Scorecard
Y ? N
0 0 0 Location and Transportation 14
Prereq Transportation Performance 14
0 0 0 Sustainable Sites 4
Credit Rainwater Management 1
Credit Heat Island Reduction 1
Credit Light Pollution Reduction 1
Credit Site Management 1
0 0 0 Water Efficiency 15
Prereq Water Performance 15
0 0 0 Energy and Atmosphere 35
Y Prereq Energy Efficiency Best Management Practices Required
Y Prereq Fundamental Refrigerant Management Required
Prereq Energy Performance 33
Credit Enhanced Refrigerant Management 1
Credit Grid Harmonization 1
0 0 0 Indoor Environmental Quality 22
Y Prereq Minimum Indoor Air Quality Required
Y Prereq Environmental Tobacco Smoke Control Required
Y Prereq Green Cleaning Policy Required
Prereq Indoor Environmental Quality Performance 20
Credit Green Cleaning 1
Credit Integrated Pest Management 1
0 0 0 Innovation 1
Credit Innovation 1
0 0 0 TOTALS Possible Points: 100
Certified: 40-49 points, Silver: 50-59 points, Gold: 60-79 points, Platinum: 80+ points
0 0 0 Materials and Resources 9
Y Prereq Ongoing Purchasing and Waste
Policy Required
Y Prereq Facility Maintenance and
Renovations Policy Required
Prereq Waste Performance 8
Credit Purchasing- Ongoing 1

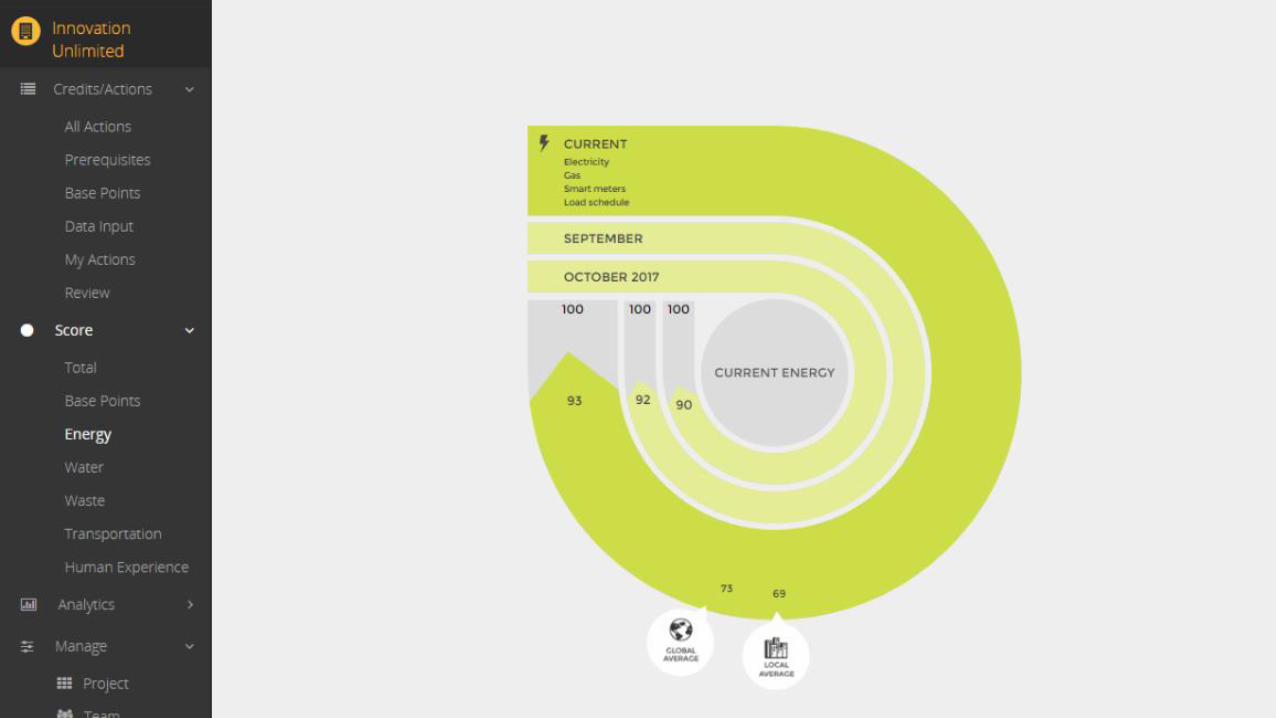
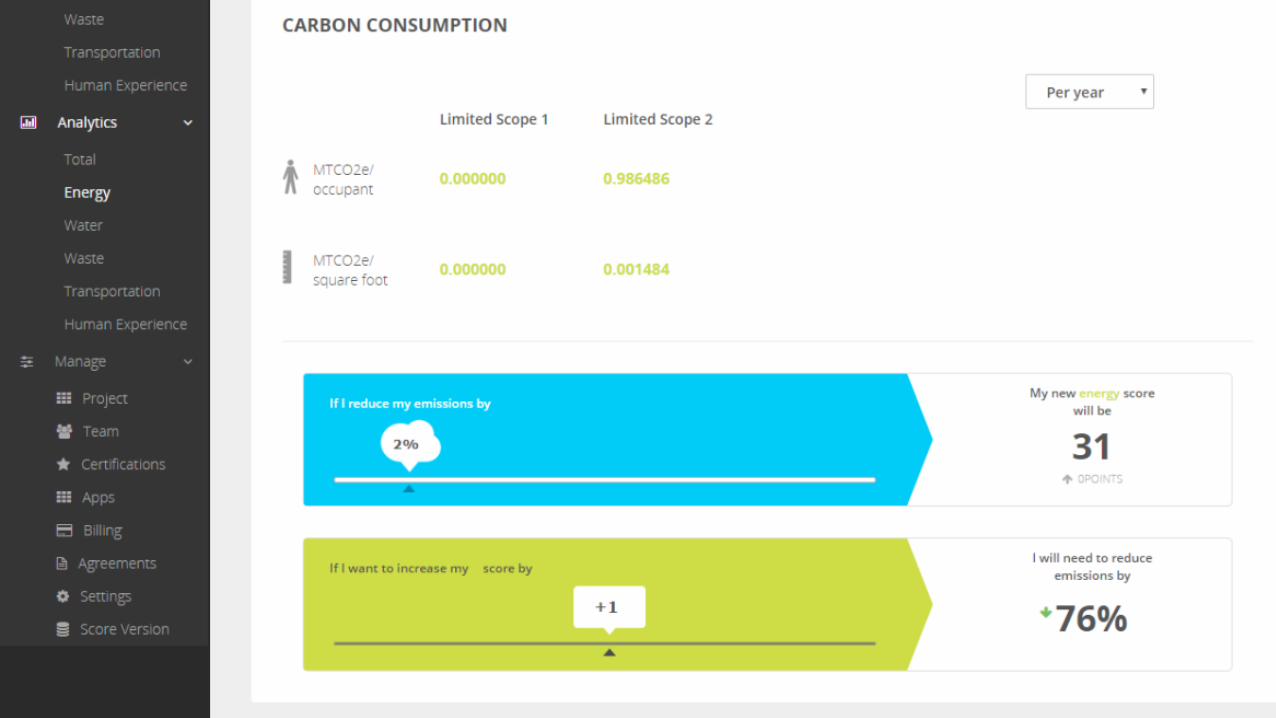
LEED v4.1 Energy Performance
LEED v4 Minimum Energy Performance
Optimize Energy Performance
Renewable Energy Production
Green Power and Carbon Offset
Energy metering
Credit evaluated through performance
score
© U.S. Green Building Council 2018
c


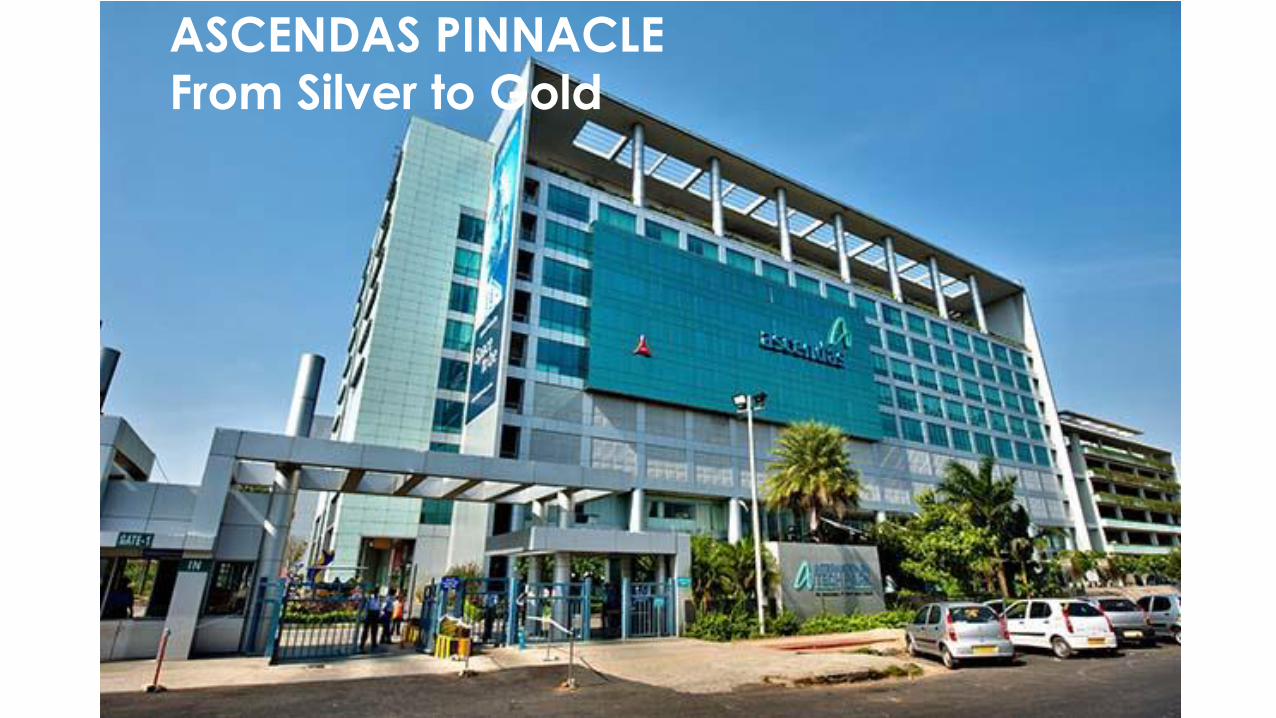
ASCENDAS PINNACLE
From Silver to Gold


LEED FOR CITIES AND COMMUNITIES INCORPORATES OUR EXPERIENCES WITH 160+ GLOBAL CITIES AND COMMUNITIES
Copyright © U.S. Green Building Council 2019

LEED for Cities and Communities is Aligned with Global Goals
Copyright © U.S. Green Building Council 2019
7
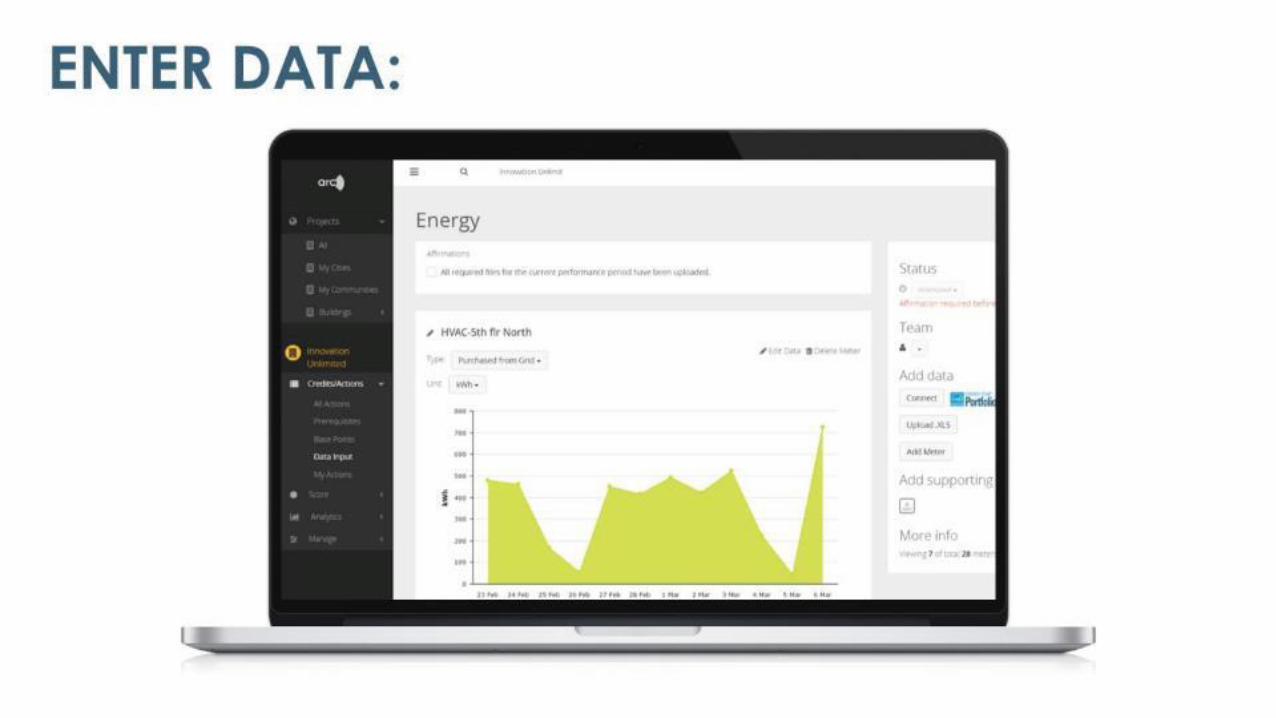
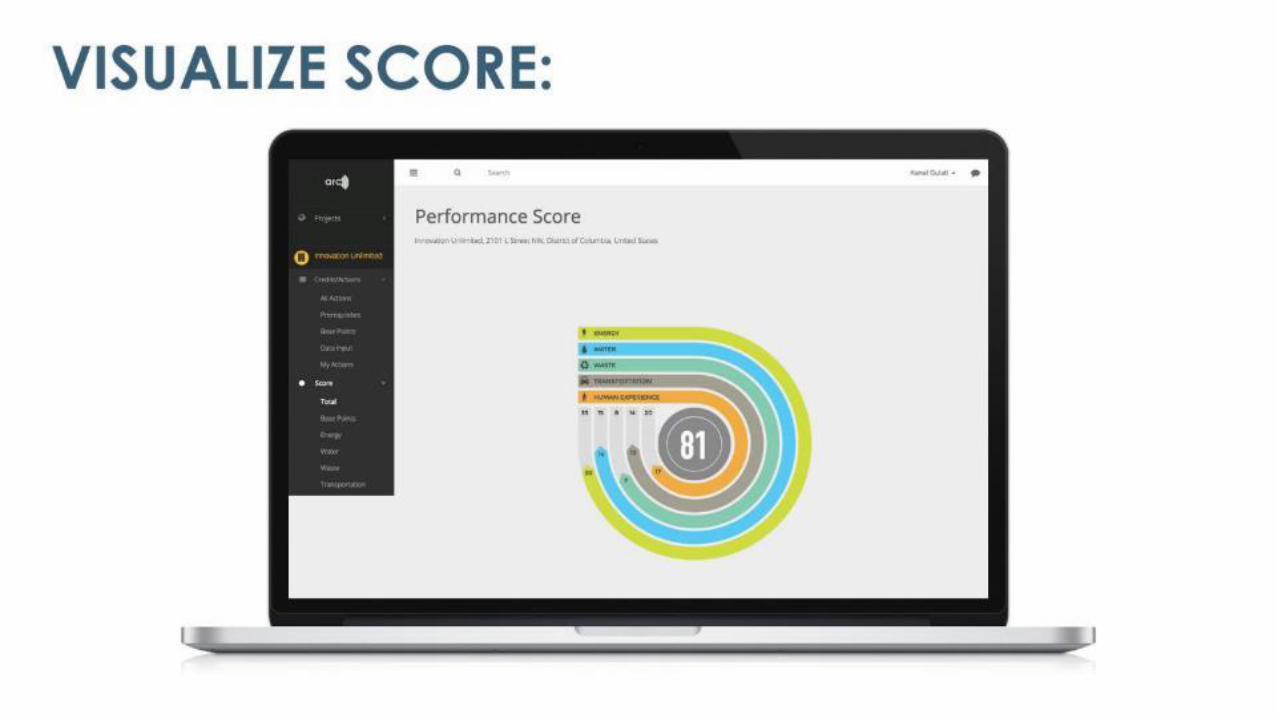
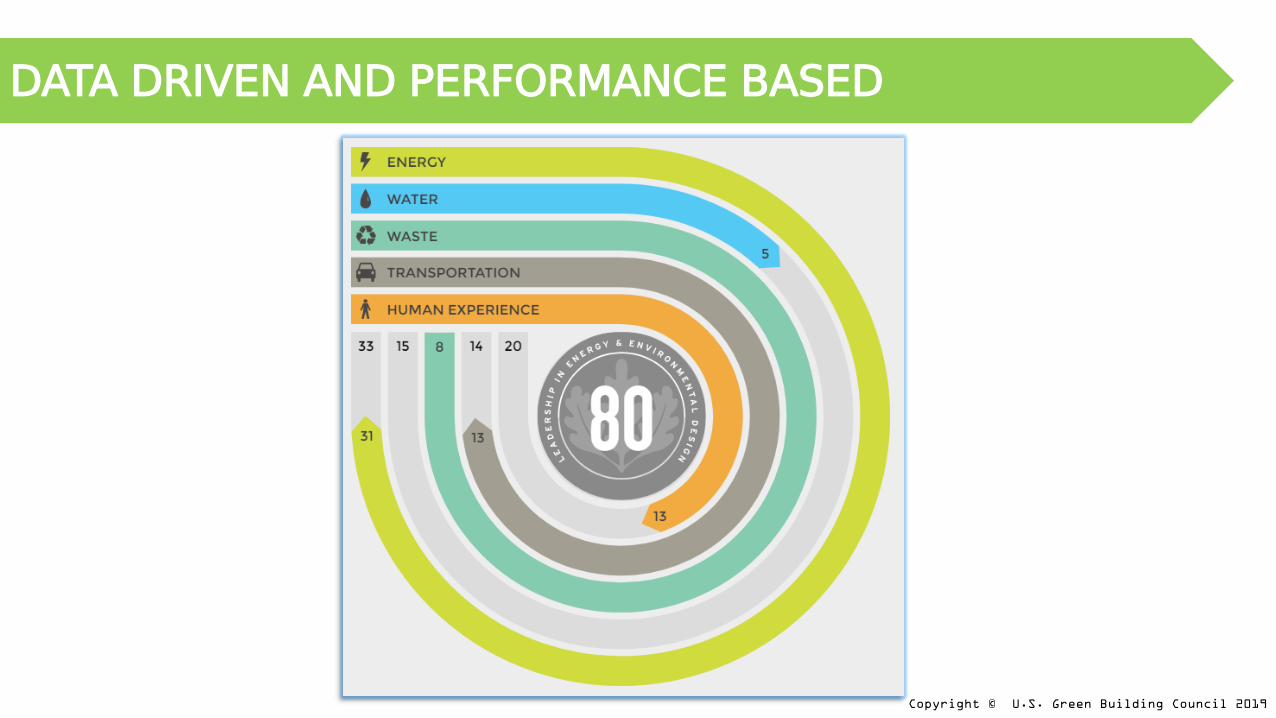
DATA DRIVEN AND PERFORMANCE BASED
Copyright © U.S. Green Building Council 2019
7
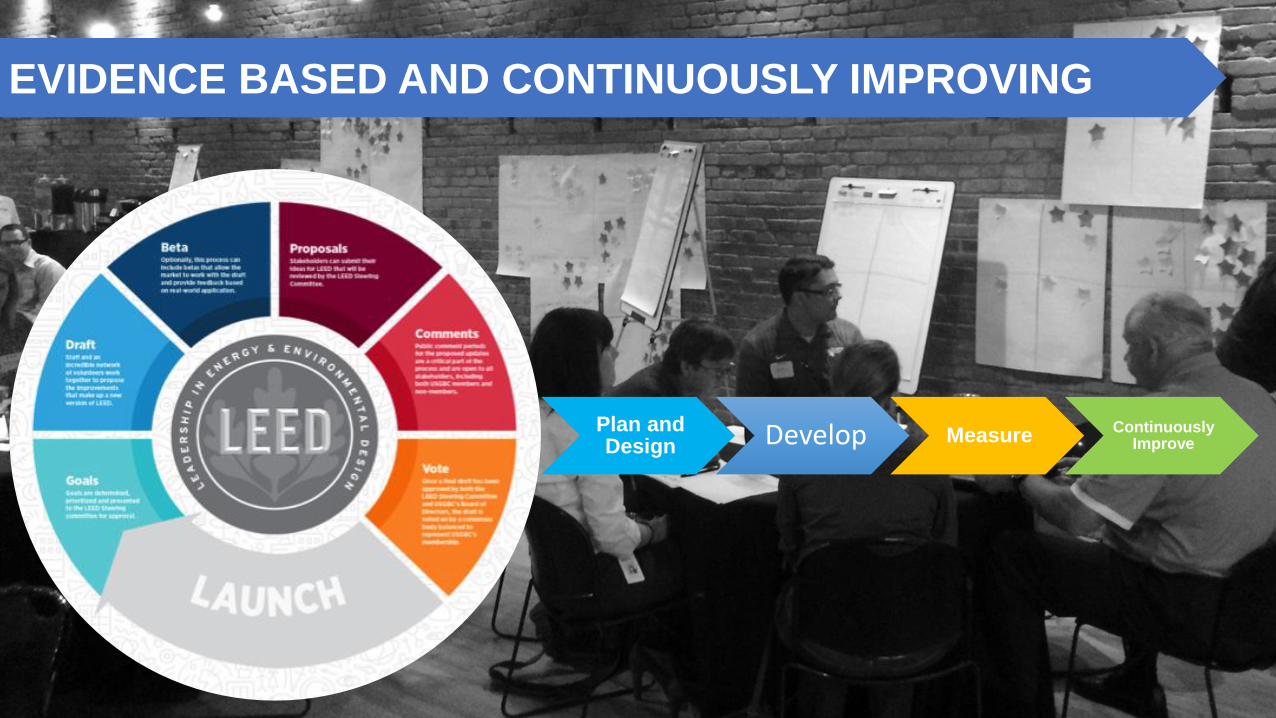
Plan and Design Develop Measure Continuously
Improve
EVIDENCE BASED AND CONTINUOUSLY IMPROVING
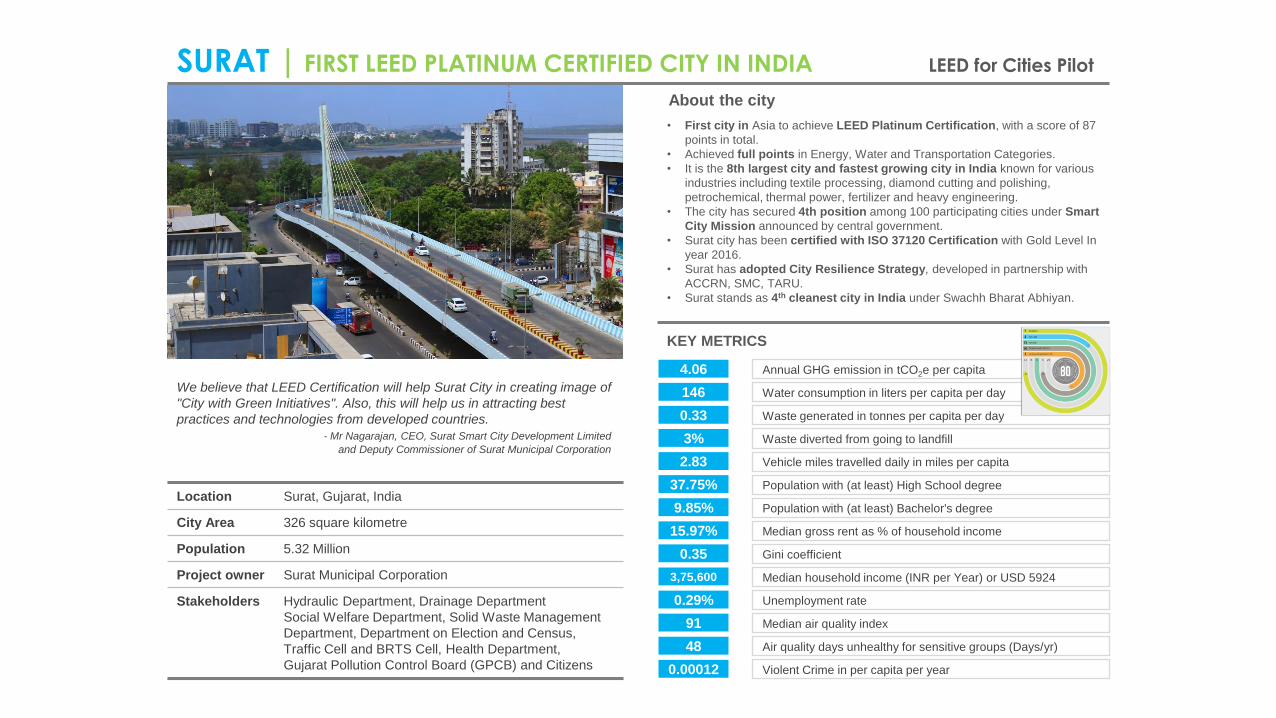
Location Surat, Gujarat, India
City Area 326 square kilometre
Population 5.32 Million
Project owner Surat Municipal Corporation
Stakeholders Hydraulic Department, Drainage Department
Social Welfare Department, Solid Waste Management
Department, Department on Election and Census,
Traffic Cell and BRTS Cell, Health Department,
Gujarat Pollution Control Board (GPCB) and Citizens
SURAT | FIRST LEED PLATINUM CERTIFIED CITY IN INDIA LEED for Cities Pilot
• First city in Asia to achieve LEED Platinum Certification, with a score of 87
points in total.
• Achieved full points in Energy, Water and Transportation Categories.
• It is the 8th largest city and fastest growing city in India known for various
industries including textile processing, diamond cutting and polishing,
petrochemical, thermal power, fertilizer and heavy engineering.
• The city has secured 4th position among 100 participating cities under Smart
City Mission announced by central government.
• Surat city has been certified with ISO 37120 Certification with Gold Level In
year 2016.
• Surat has adopted City Resilience Strategy, developed in partnership with
ACCRN, SMC, TARU.
• Surat stands as 4th cleanest city in India under Swachh Bharat Abhiyan.
We believe that LEED Certification will help Surat City in creating image of
"City with Green Initiatives". Also, this will help us in attracting best
practices and technologies from developed countries.
- Mr Nagarajan, CEO, Surat Smart City Development Limited
and Deputy Commissioner of Surat Municipal Corporation
KEY METRICS
4.06 Annual GHG emission in tCO2e per capita
146 Water consumption in liters per capita per day
0.33 Waste generated in tonnes per capita per day
3% Waste diverted from going to landfill
2.83 Vehicle miles travelled daily in miles per capita
Population with (at least) High School degree
9.85% Population with (at least) Bachelor's degree
15.97% Median gross rent as % of household income
0.35 Gini coefficient
0.29%
Median household income (INR per Year) or USD 5924 3,75,600
Unemployment rate
37.75%
91 Median air quality index
48 Air quality days unhealthy for sensitive groups (Days/yr)
0.00012 Violent Crime in per capita per year
About the city
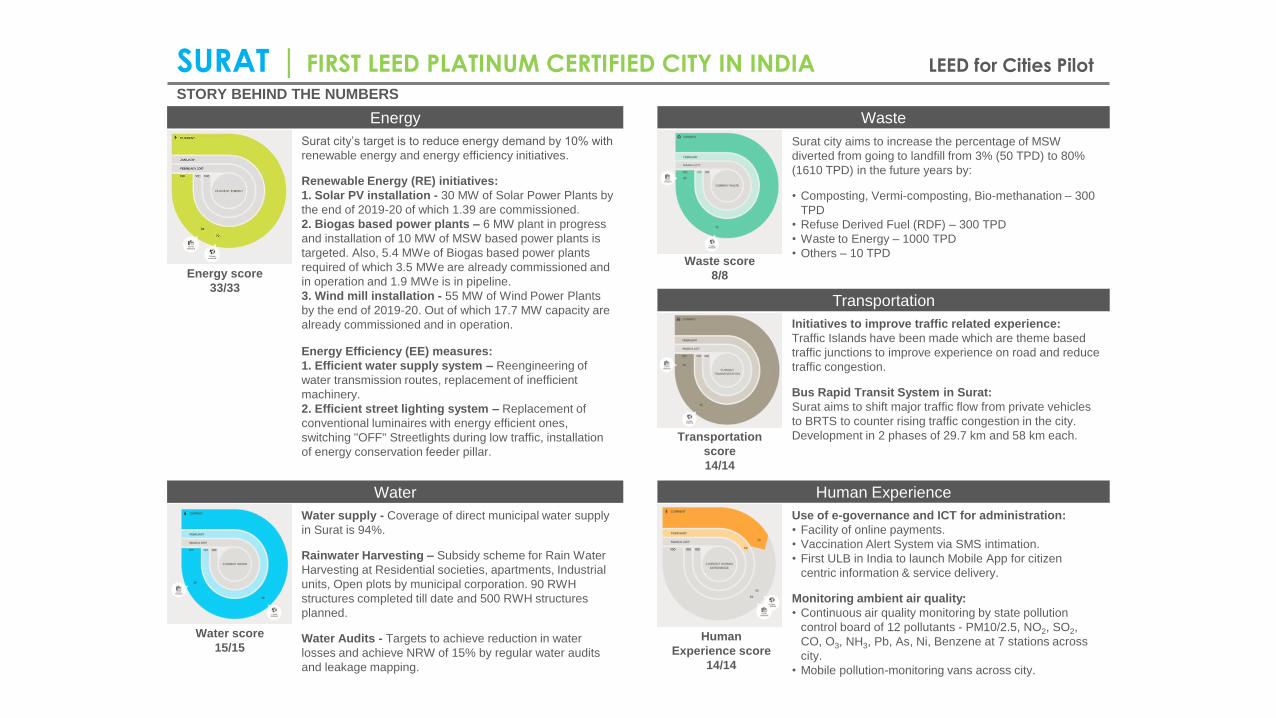
STORY BEHIND THE NUMBERS
SURAT | FIRST LEED PLATINUM CERTIFIED CITY IN INDIA LEED for Cities Pilot
Energy
Transportation
Surat city’s target is to reduce energy demand by 10% with
renewable energy and energy efficiency initiatives.
Renewable Energy (RE) initiatives:
1. Solar PV installation - 30 MW of Solar Power Plants by
the end of 2019-20 of which 1.39 are commissioned.
2. Biogas based power plants – 6 MW plant in progress
and installation of 10 MW of MSW based power plants is
targeted. Also, 5.4 MWe of Biogas based power plants
required of which 3.5 MWe are already commissioned and
in operation and 1.9 MWe is in pipeline.
3. Wind mill installation - 55 MW of Wind Power Plants
by the end of 2019-20. Out of which 17.7 MW capacity are
already commissioned and in operation.
Energy Efficiency (EE) measures:
1. Efficient water supply system – Reengineering of
water transmission routes, replacement of inefficient
machinery.
2. Efficient street lighting system – Replacement of
conventional luminaires with energy efficient ones,
switching "OFF" Streetlights during low traffic, installation
of energy conservation feeder pillar.
Water Human Experience
Waste
Water supply - Coverage of direct municipal water supply
in Surat is 94%.
Rainwater Harvesting – Subsidy scheme for Rain Water
Harvesting at Residential societies, apartments, Industrial
units, Open plots by municipal corporation. 90 RWH
structures completed till date and 500 RWH structures
planned.
Water Audits - Targets to achieve reduction in water
losses and achieve NRW of 15% by regular water audits
and leakage mapping.
Energy score
33/33
Water score
15/15
Waste score
8/8
Transportation
score
14/14
Human
Experience score
14/14
Surat city aims to increase the percentage of MSW
diverted from going to landfill from 3% (50 TPD) to 80%
(1610 TPD) in the future years by:
• Composting, Vermi-composting, Bio-methanation – 300
TPD
• Refuse Derived Fuel (RDF) – 300 TPD
• Waste to Energy – 1000 TPD
• Others – 10 TPD
Initiatives to improve traffic related experience:
Traffic Islands have been made which are theme based
traffic junctions to improve experience on road and reduce
traffic congestion.
Bus Rapid Transit System in Surat:
Surat aims to shift major traffic flow from private vehicles
to BRTS to counter rising traffic congestion in the city.
Development in 2 phases of 29.7 km and 58 km each.
Use of e-governance and ICT for administration:
• Facility of online payments.
• Vaccination Alert System via SMS intimation.
• First ULB in India to launch Mobile App for citizen
centric information & service delivery.
Monitoring ambient air quality:
• Continuous air quality monitoring by state pollution
control board of 12 pollutants - PM10/2.5, NO2, SO2,
CO, O3, NH3, Pb, As, Ni, Benzene at 7 stations across
city.
• Mobile pollution-monitoring vans across city.

Perform to sustain
Better living standard for people
Key outcomes of applying a rating system
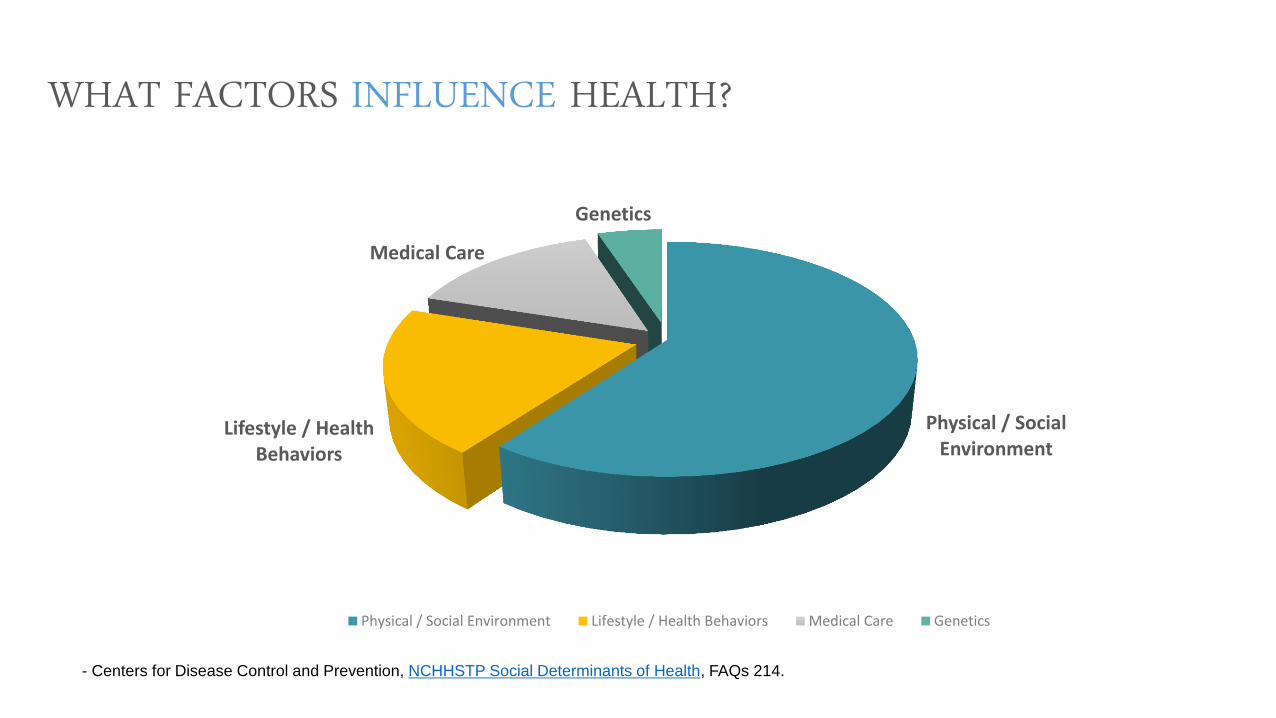
WHAT FACTORS INFLUENCE HEALTH?
- Centers for Disease Control and Prevention, NCHHSTP Social Determinants of Health, FAQs 214.
Physical / Social Environment
Lifestyle / Health Behaviors
Medical Care
Genetics
Physical / Social Environment Lifestyle / Health Behaviors Medical Care Genetics
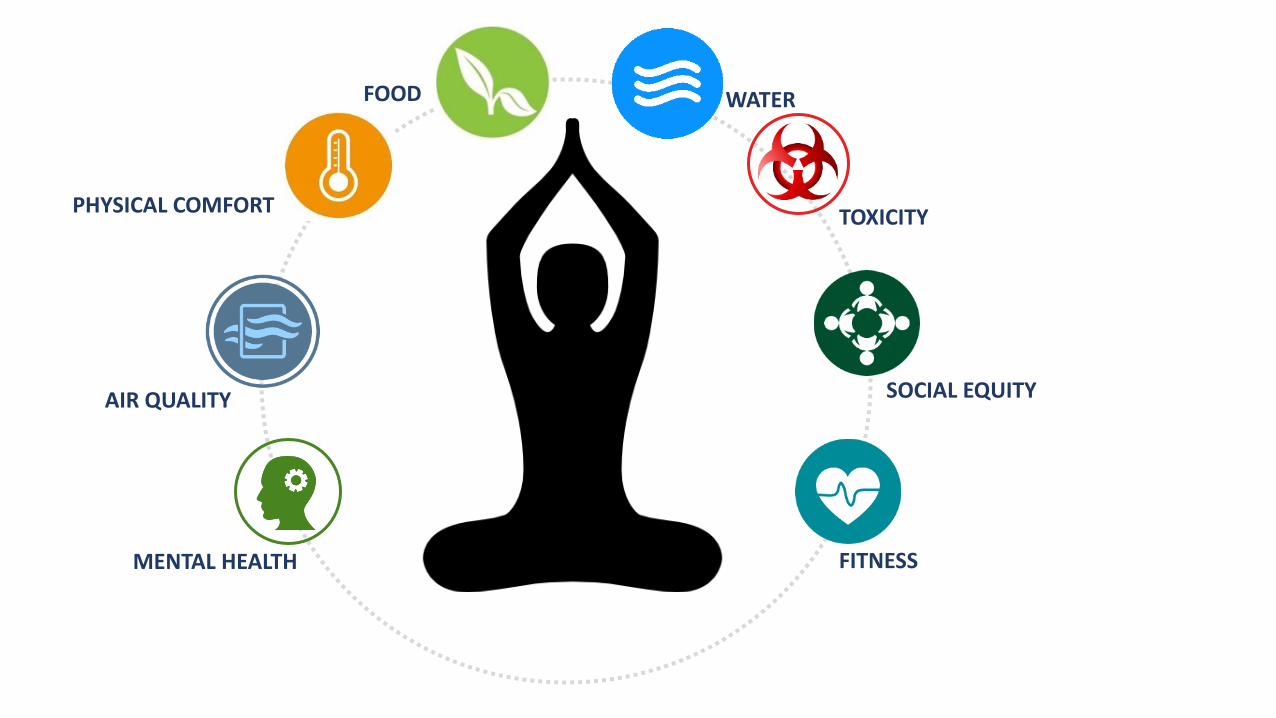
AIR QUALITY
PHYSICAL COMFORT
MENTAL HEALTH FITNESS
TOXICITY
WATER FOOD
SOCIAL EQUITY
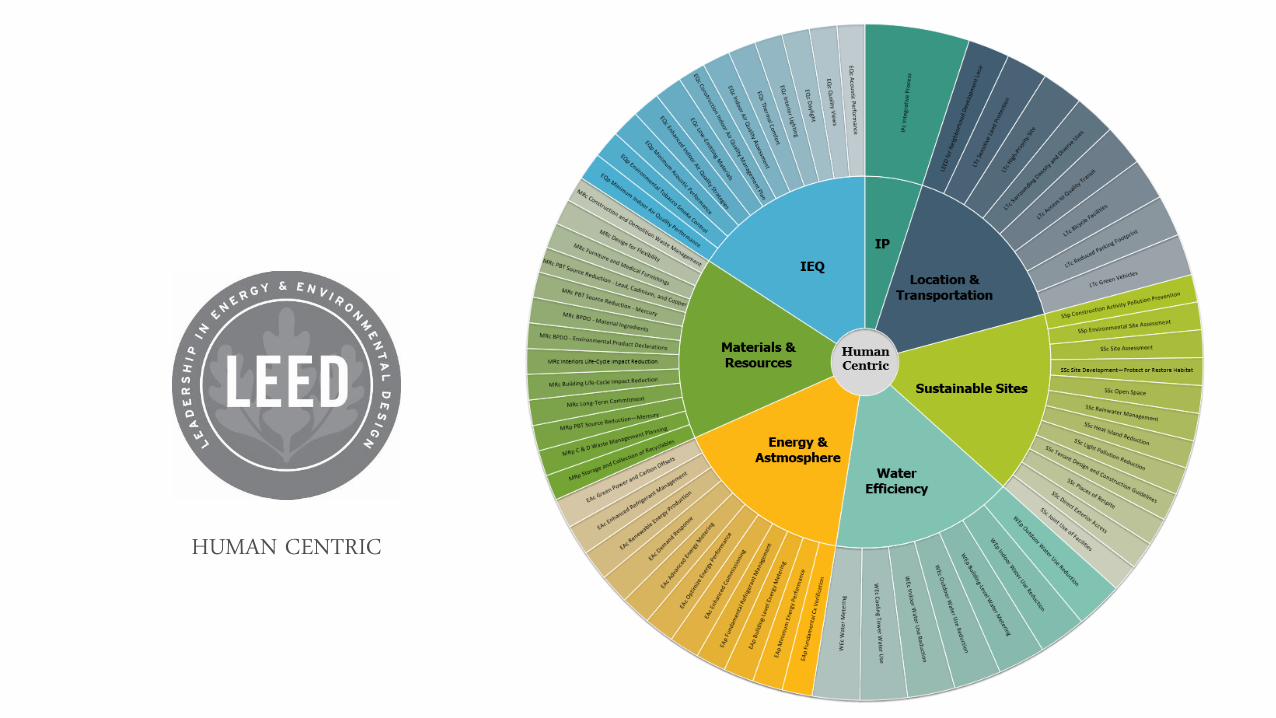
HUMAN CENTRIC
12
10
5
2
13
2
1
3
18
4
1
4
2
4
2
2
Air Quality
Physical Comfort
Mental Health
Fitness
Toxicity
Water
Food
Social Equity
0 5 10 15 20 25 30 35
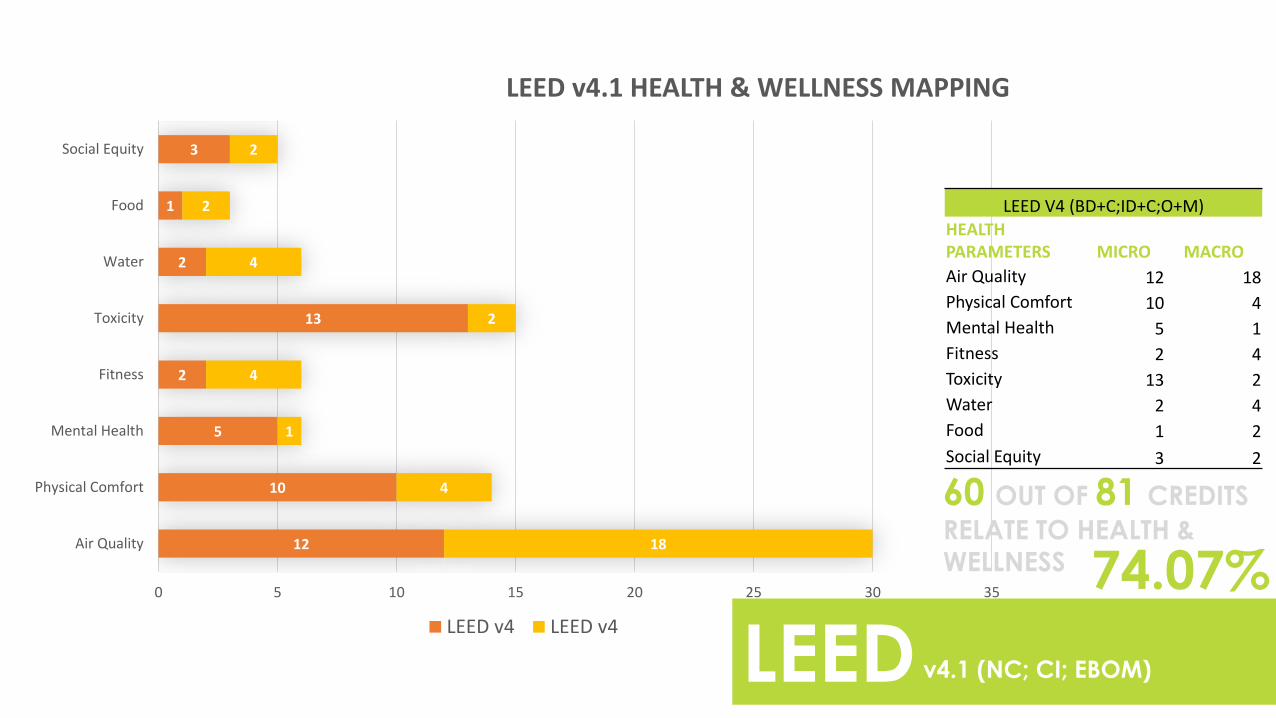
LEED v4.1 HEALTH & WELLNESS MAPPING
LEED v4 LEED v4
LEED
60 OUT OF 81 CREDITS
RELATE TO HEALTH &
WELLNESS 74.07%
LEED V4 (BD+C;ID+C;O+M) HEALTH PARAMETERS MICRO MACRO
Air Quality 12 18
Physical Comfort 10 4
Mental Health 5 1
Fitness 2 4
Toxicity 13 2
Water 2 4
Food 1 2
Social Equity 3 2
v4.1 (NC; CI; EBOM)

Air Quality
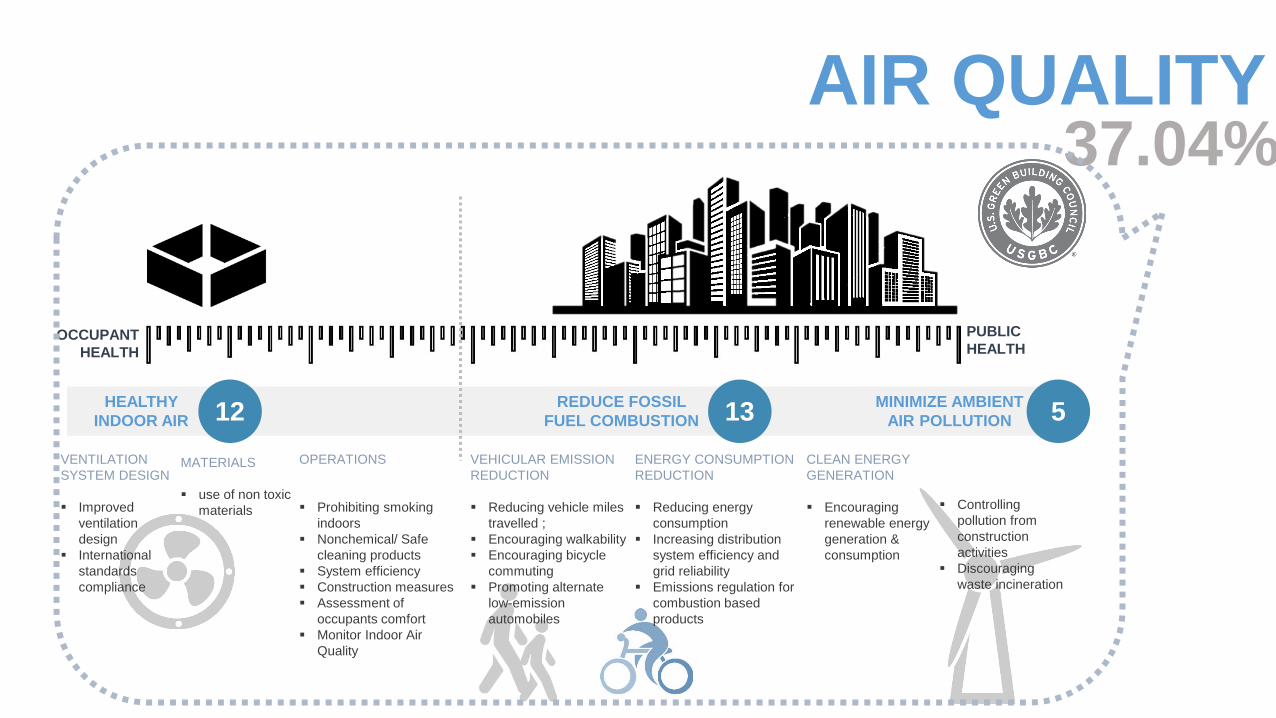
37.04% AIR QUALITY
OCCUPANT
HEALTH
PUBLIC
HEALTH
HEALTHY
INDOOR AIR
REDUCE FOSSIL
FUEL COMBUSTION
MINIMIZE AMBIENT
AIR POLLUTION 12 13 5
VENTILATION
SYSTEM DESIGN
Improved
ventilation
design
International
standards
compliance
MATERIALS
use of non toxic
materials
OPERATIONS
Prohibiting smoking
indoors
Nonchemical/ Safe
cleaning products
System efficiency
Construction measures
Assessment of
occupants comfort
Monitor Indoor Air
Quality
VEHICULAR EMISSION
REDUCTION
Reducing vehicle miles
travelled ;
Encouraging walkability
Encouraging bicycle
commuting
Promoting alternate
low-emission
automobiles
ENERGY CONSUMPTION
REDUCTION
Reducing energy
consumption
Increasing distribution
system efficiency and
grid reliability
Emissions regulation for
combustion based
products
Controlling
pollution from
construction
activities
Discouraging
waste incineration
CLEAN ENERGY
GENERATION
Encouraging
renewable energy
generation &
consumption
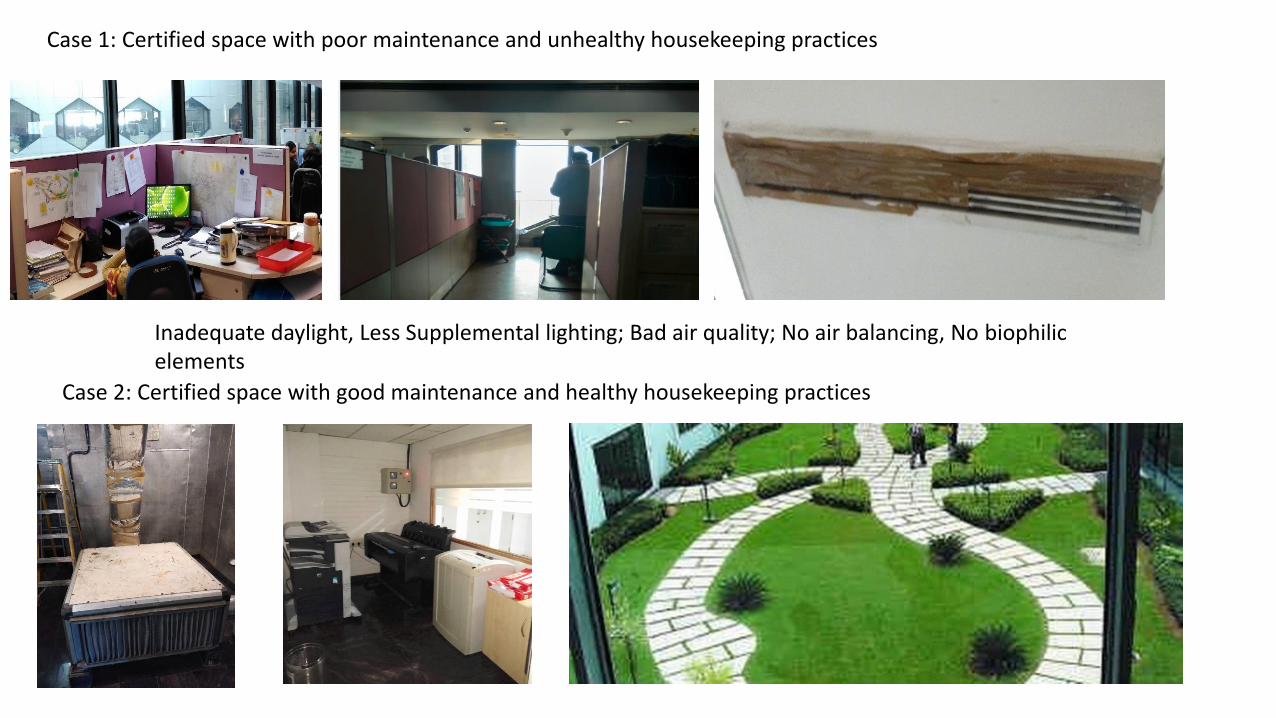
Case 1: Certified space with poor maintenance and unhealthy housekeeping practices
Inadequate daylight, Less Supplemental lighting; Bad air quality; No air balancing, No biophilic elements
Case 2: Certified space with good maintenance and healthy housekeeping practices
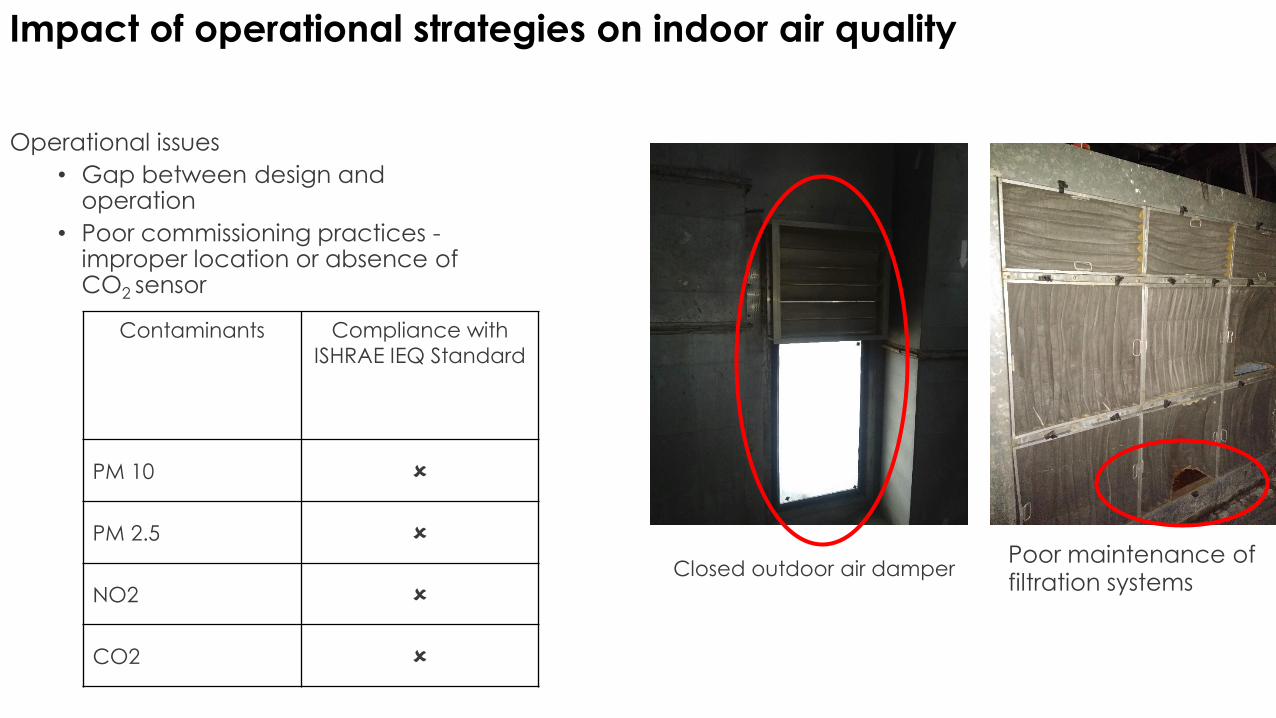
Operational issues
• Gap between design and operation
• Poor commissioning practices - improper location or absence of CO2 sensor
Contaminants Compliance with
ISHRAE IEQ Standard
PM 10
PM 2.5
NO2
CO2
Impact of operational strategies on indoor air quality
Closed outdoor air damper Poor maintenance of filtration systems

Air Compliance with standard
Case-1 Case-2
CH2O
TVOC
PM 10
PM 2.5
O3
NO2
CO
CO2
88.24%
1.96% 6.86% 1.96% 1.96% 3.92%
96.67%
0.00% 0.00% 0.00% 3.33% 0.00% 0%
10%
20%
30%
40%
50%
60%
70%
80%
90%
100%
Satisfactory Strong fragrance Unpleasant odour Dusty air Humid air Stale air
Case 1 Case 2
16% 7% 0% 12% 22%
4% 3% 3% 1% 4%
28%
0%
76%
8% 0% 8% 4% 0% 0% 0% 0% 4% 0% 0% 0%
10%
20%
30%
40%
50%
60%
70%
80%
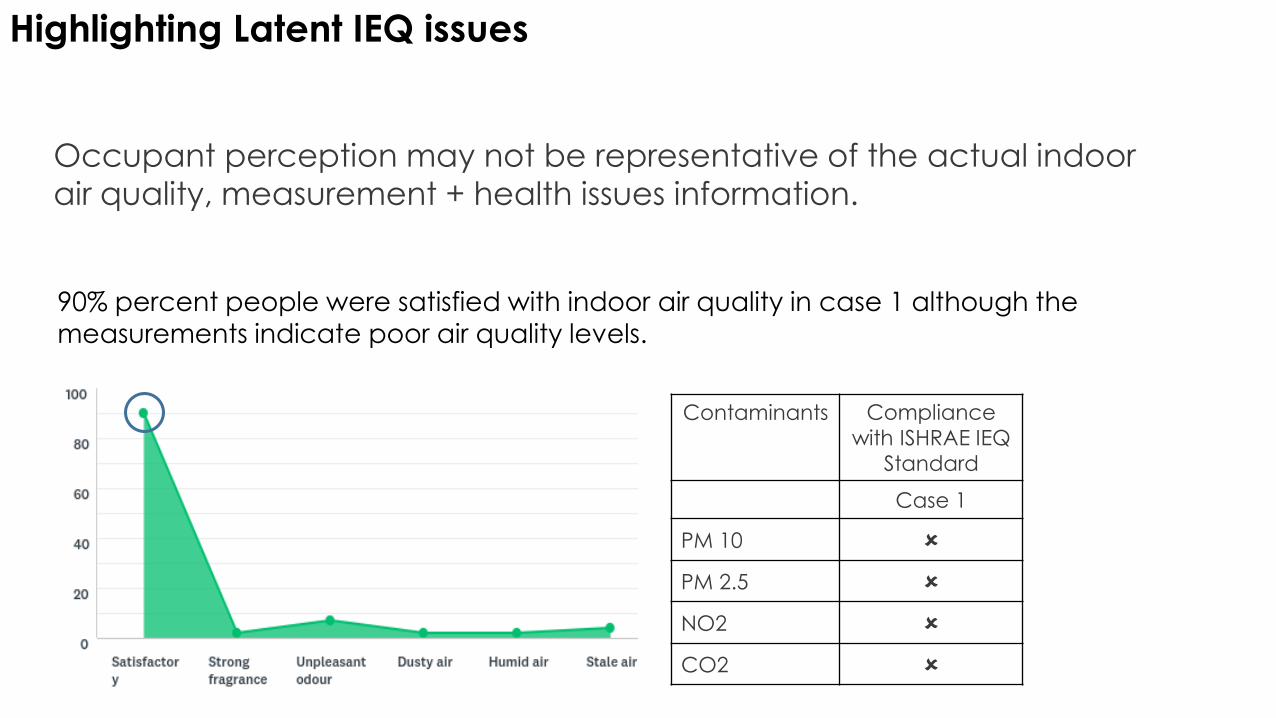
Contaminants Compliance
with ISHRAE IEQ
Standard
Case 1
PM 10
PM 2.5
NO2
CO2
Highlighting Latent IEQ issues
90% percent people were satisfied with indoor air quality in case 1 although the measurements indicate poor air quality levels.
Occupant perception may not be representative of the actual indoor air quality, measurement + health issues information.
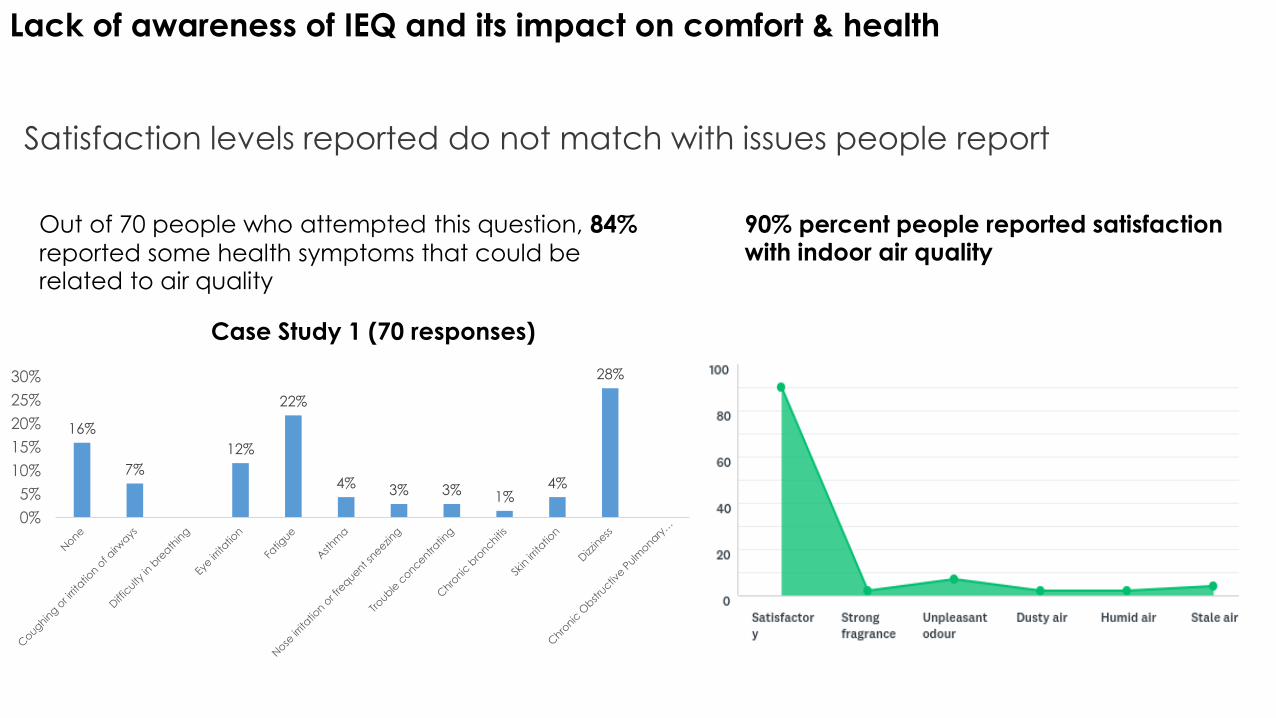
Satisfaction levels reported do not match with issues people report
Lack of awareness of IEQ and its impact on comfort & health
90% percent people reported satisfaction with indoor air quality
Out of 70 people who attempted this question, 84%
reported some health symptoms that could be related to air quality
Case Study 1 (70 responses)
16%
7%
12%
22%
4% 3% 3% 1% 4%
28%
0%
5%
10%
15%
20%
25%
30%
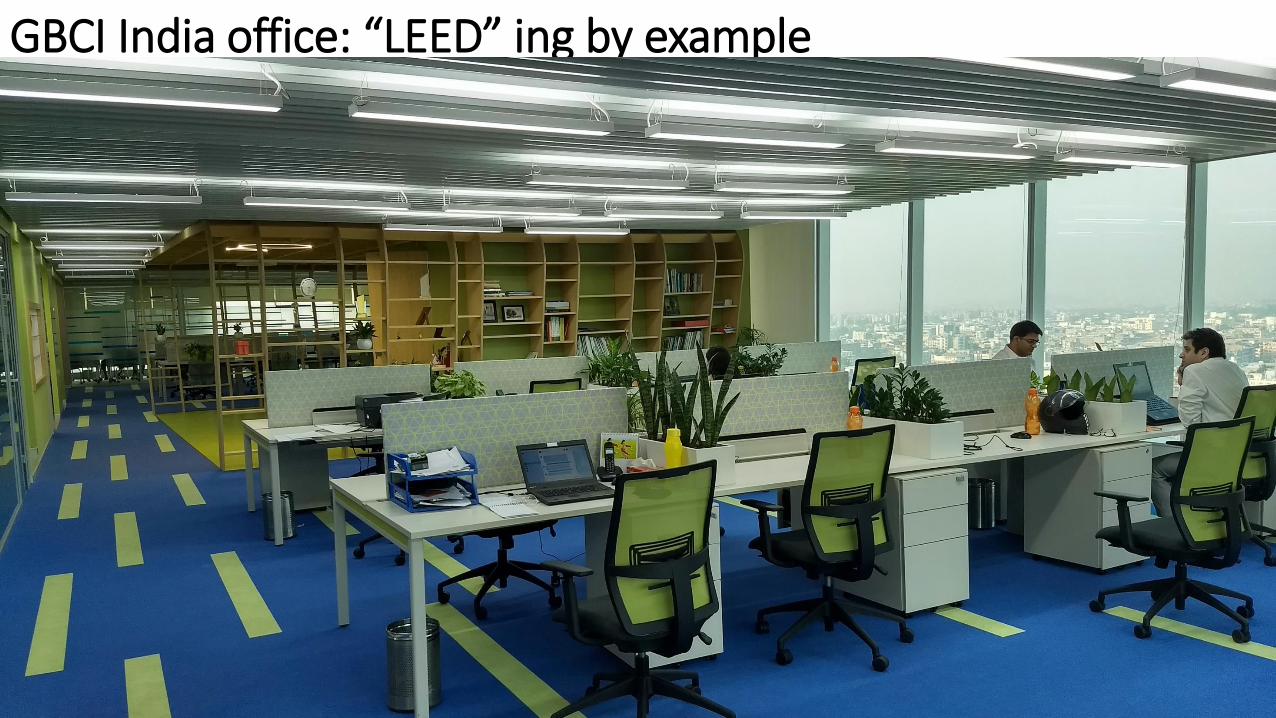
GBCI India office: “LEED” ing by example
9/20/2019 35
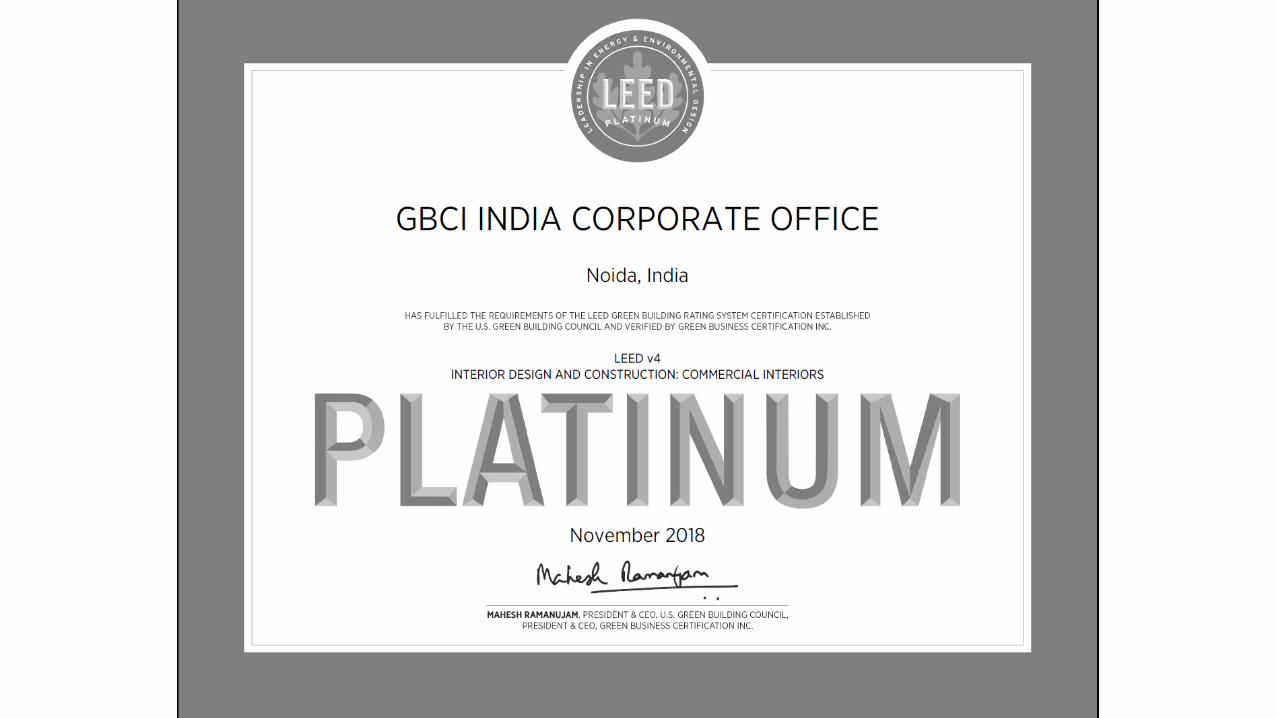
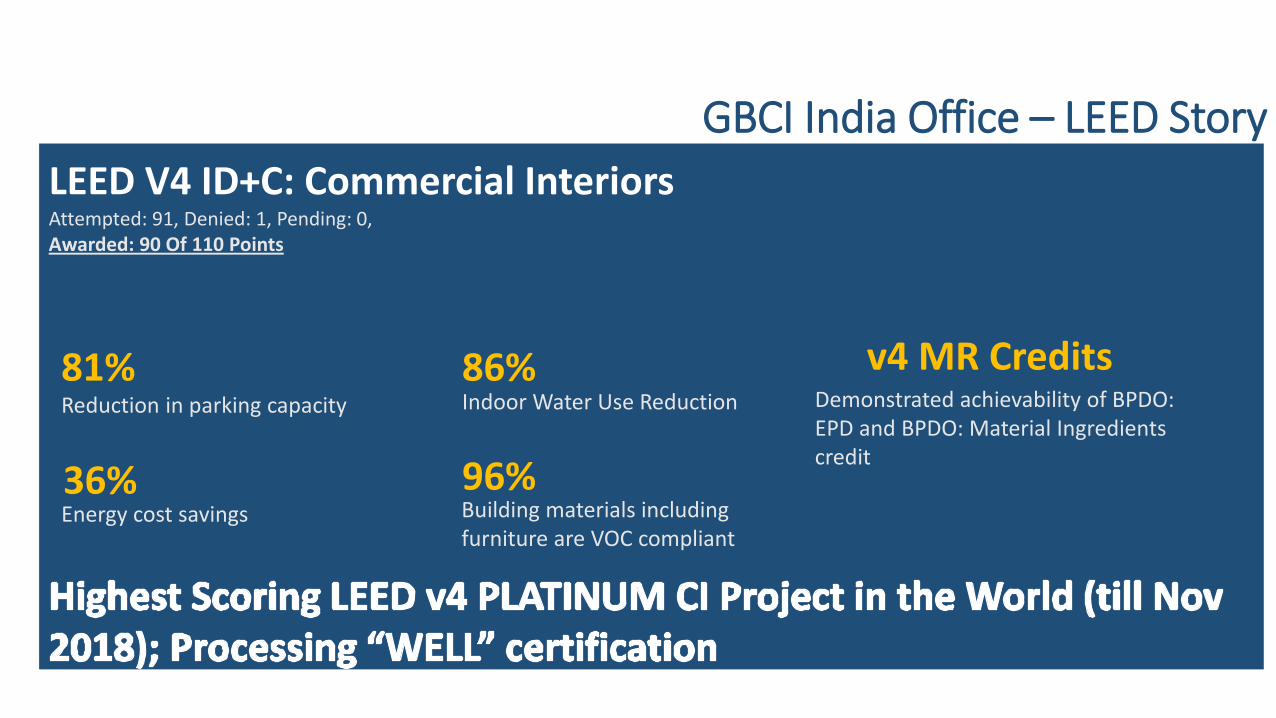
GBCI India Office – LEED Story
LEED V4 ID+C: Commercial Interiors Attempted: 91, Denied: 1, Pending: 0, Awarded: 90 Of 110 Points
81% Reduction in parking capacity
86% Indoor Water Use Reduction
36% Energy cost savings
v4 MR Credits Demonstrated achievability of BPDO: EPD and BPDO: Material Ingredients credit
96% Building materials including furniture are VOC compliant
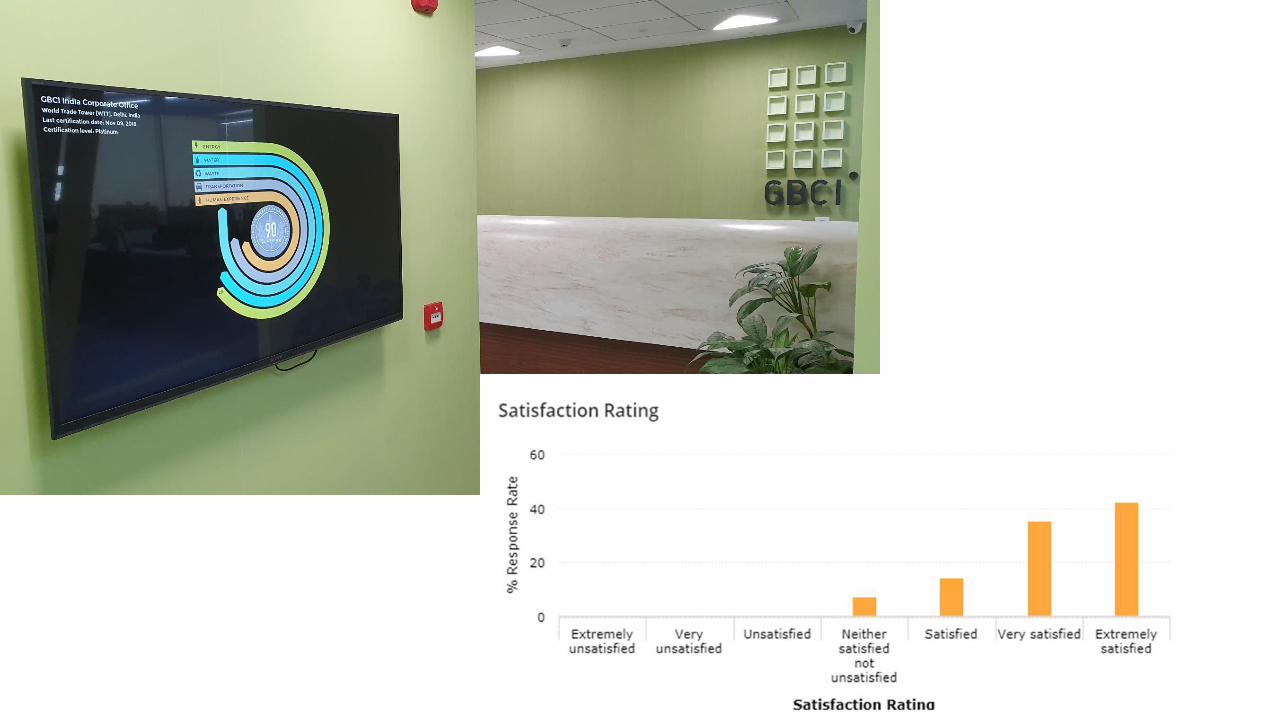
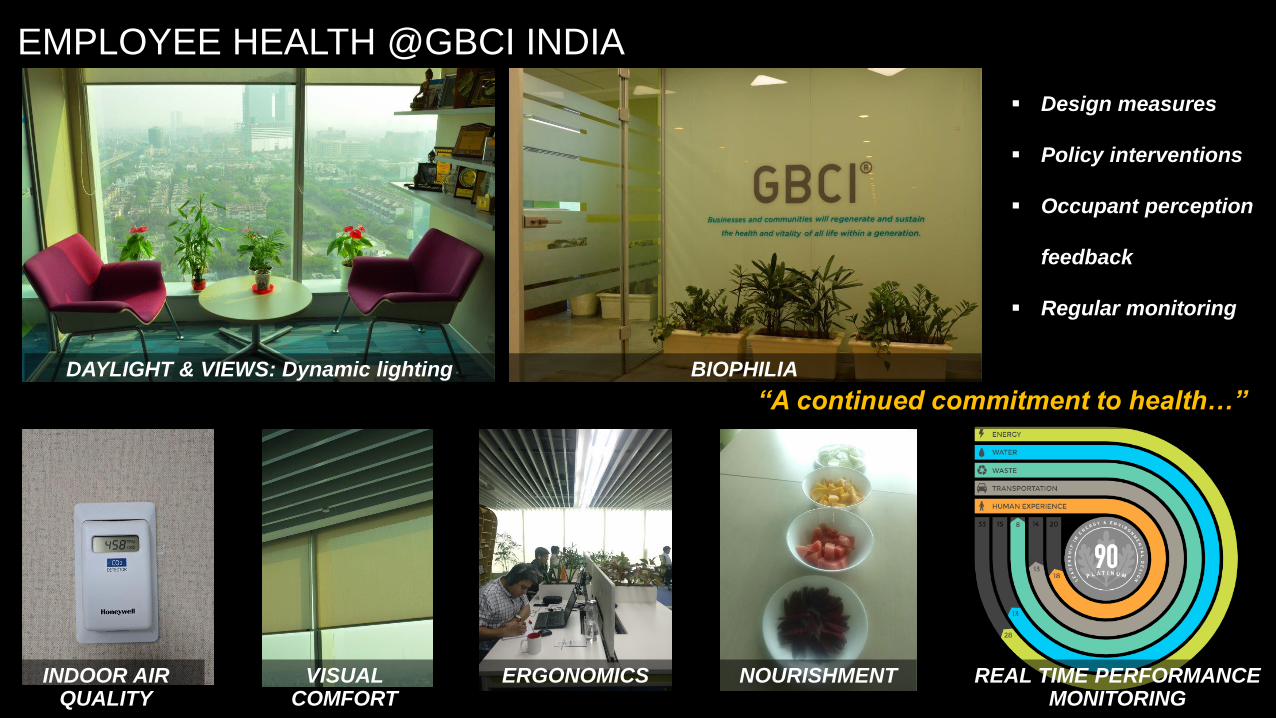
REAL TIME PERFORMANCE MONITORING
EMPLOYEE HEALTH @GBCI INDIA
NOURISHMENT ERGONOMICS VISUAL COMFORT
INDOOR AIR QUALITY
DAYLIGHT & VIEWS: Dynamic lighting BIOPHILIA
Design measures
Policy interventions
Occupant perception
feedback
Regular monitoring
“A continued commitment to health…”
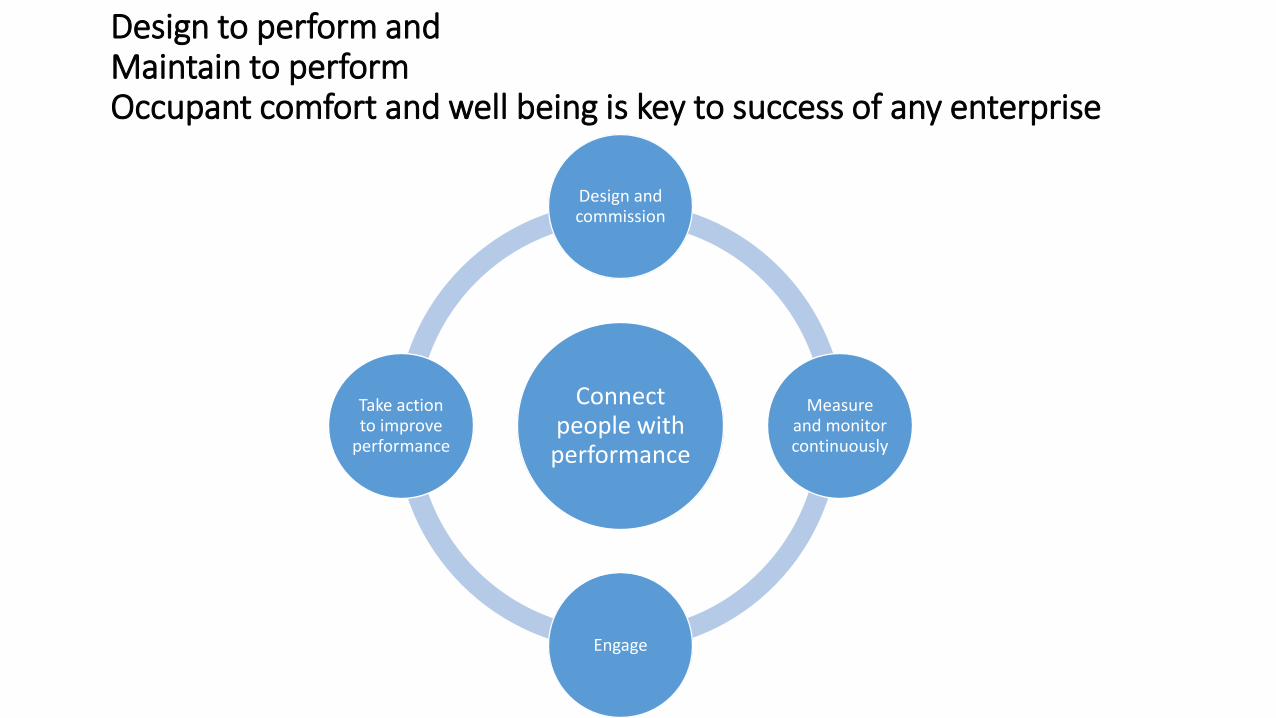
Design to perform and Maintain to perform Occupant comfort and well being is key to success of any enterprise
Connect people with performance
Design and commission
Measure and monitor continuously
Engage
Take action to improve
performance