Embed Size (px)
Citation preview
MS ACCESS – FORMS AND REPORTS
Naman Kohli
October 31, 2013
1
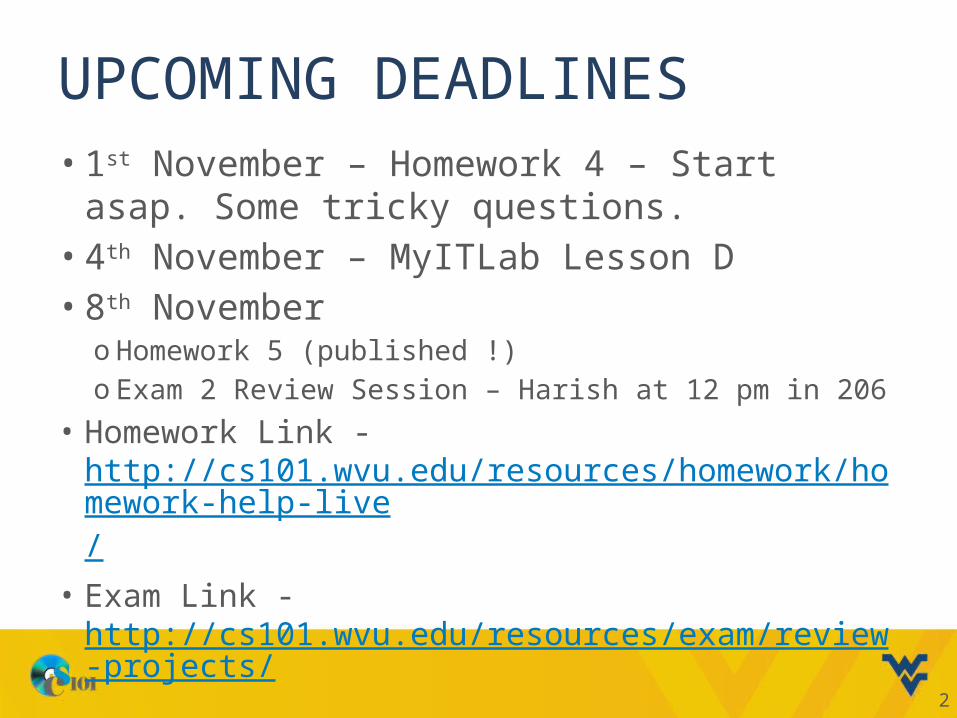
UPCOMING DEADLINES• 1st November – Homework 4 – Start asap.
Some tricky questions.• 4th November – MyITLab Lesson D• 8th November
o Homework 5 (published !)o Exam 2 Review Session – Harish at 12 pm in 206
• Homework Link - http://cs101.wvu.edu/resources/homework/homework-help-live/
• Exam Link - http://cs101.wvu.edu/resources/exam/review-projects/ 2
EMAIL PROBLEMS AND GRADING
• 1st November – ACCESS HOMEWORK 1• Due to migration there will be email
problems – server issues, emails lost• Try to do your homework before it !!
• MyITLab A and B grading done. Check it and let me know if you have any problems.
3
FORMS EXERCISE
• Open Baseball Statistics File that you have downloaded
• We wish to create a form with a subform using the FORM WIZARD. – Create a form named League Results with a subform
named League – The main form should display the name of each league and
division in the Divisions table. – The subform should display the individual team names, the
percent of games won, and whether they participated in a playoff game.
– Select Datasheet layout and a design style of your choice.
4
5
REPORTS EXERCISE
• Download the following file onto your computer: climate.accdb
• Open the climate.accdb database in Microsoft Access.
CREATE A REPORT USING THE REPORT WIZARD
• Using the Report Wizard, create a report to show the results of GlobalWarmingData query.
• Display all fields from the query. • View by date; change the grouping interval
for the date field to year. • Use a stepped layout, portrait page
orientation, and a design style of your choice. • Name the report GlobalWarmingData .
6
CREATE SUMMARY STATISTICS
• Create a report to show the results of 2003Data query. Display all fields from the query.
• View by year. Display minimum and maximum values of all fields as summary statistics.
• Use the block layout, portrait page orientation, and the Opulent design style. Name the report 2003Data .
7
FILTER REPORT
• Open the 2003Data report in Report View. • Right-click the first latitude value (31.5) in
the report. • Select EQUALS 31.5 from the shortcut
menu to view data collected for only the selected latitude.
8
SUBJECT – FORM_REPORT
• Email both files with above subject.
9
FUNDAMENTALS OF SQL
• Structured Query Language (SQL)– Industry standard language for defining,
manipulating, and retrieving the data in a database
– Used to create and modify tables– Microsoft’s own version of SQL for
Microsoft Access
Copyright © 2011 Pearson Education, Inc. Publishing as Prentice Hall.
10
INTERPRET AN SQL SELECT STATEMENT • SQL Select Statement – is used to
retrieve data from the tables in a database
• SQL Keyword – defines the purpose and the structure of an SQL Statement
Copyright © 2011 Pearson Education, Inc. Publishing as Prentice Hall.
11
INTERPRET AN SQL SELECT STATEMENT (CONTINUED)
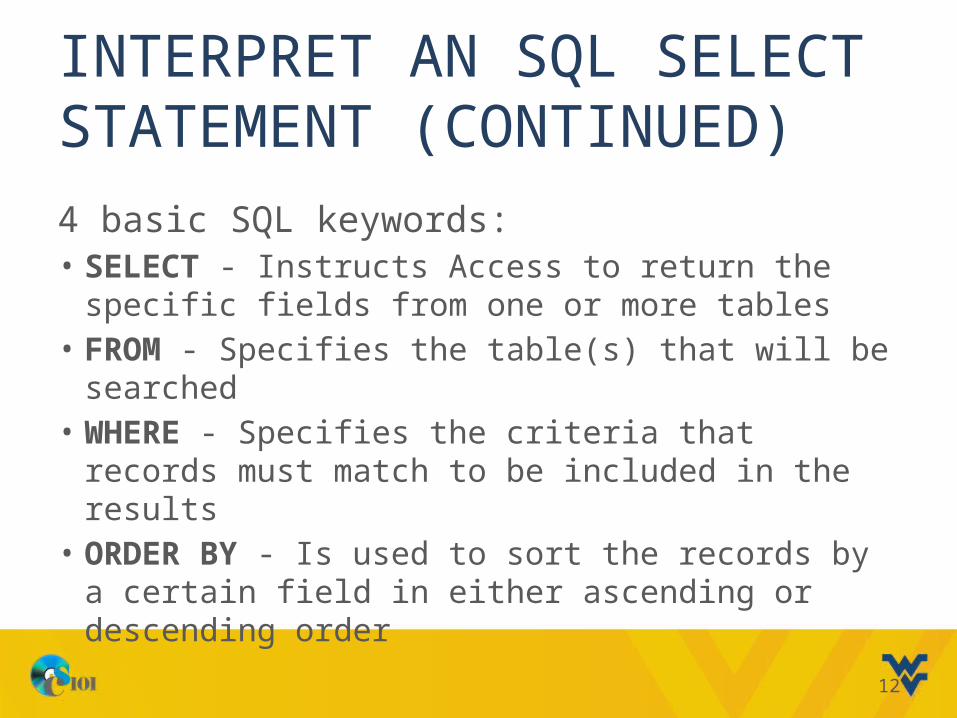
4 basic SQL keywords:• SELECT - Instructs Access to return the specific
fields from one or more tables• FROM - Specifies the table(s) that will be
searched• WHERE - Specifies the criteria that records must
match to be included in the results• ORDER BY - Is used to sort the records by a
certain field in either ascending or descending order
12
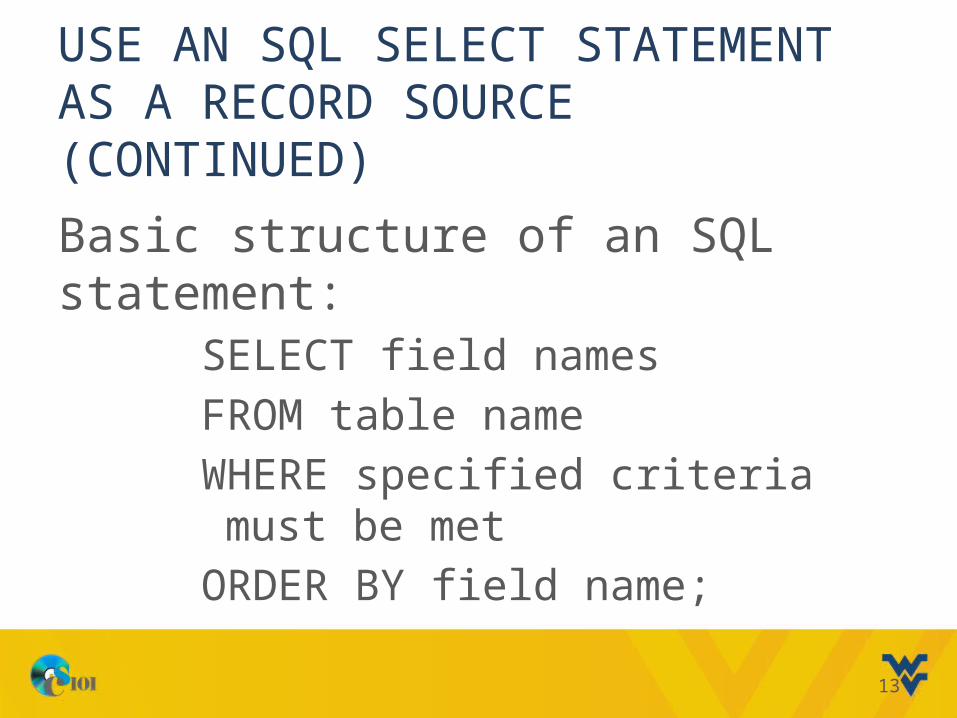
USE AN SQL SELECT STATEMENT AS A RECORD SOURCE (CONTINUED)
Basic structure of an SQL statement:SELECT field names
FROM table name
WHERE specified criteria must be met
ORDER BY field name;
13
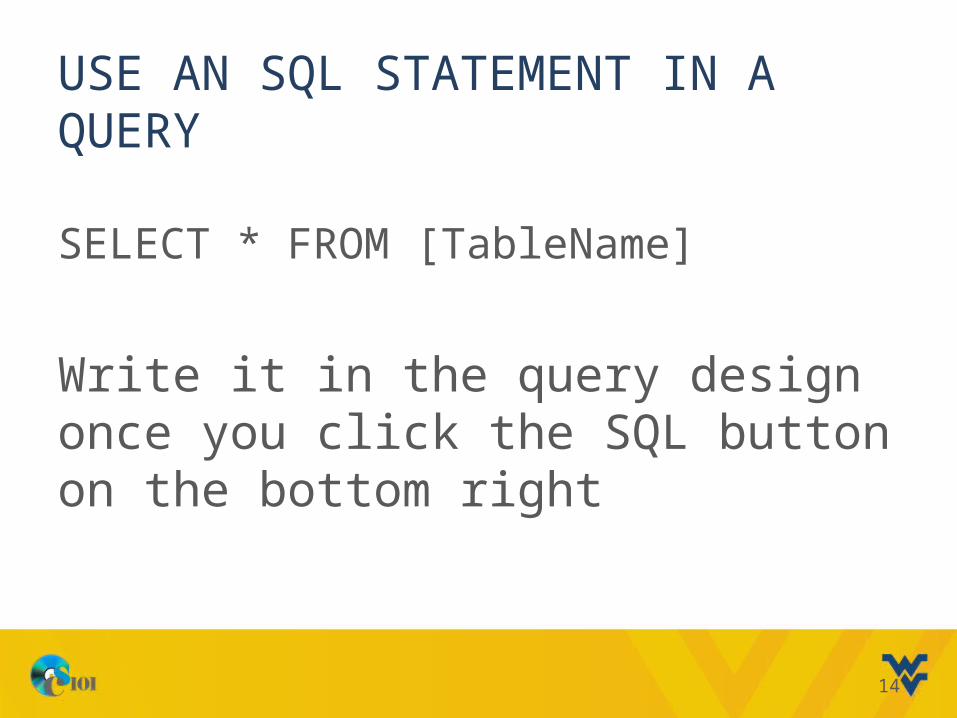
USE AN SQL STATEMENT IN A QUERY
SELECT * FROM [TableName]
Write it in the query design once you click the SQL button on the bottom right
14