Embed Size (px)
Citation preview

Bulletin of the Seismological Society of America, VoL 86, No.3, pp. 761-787, June 1996
Surface Faulting of the 1954 Fairview Peak: (Ms 7.2) and Dixie Valley
(Ms 6.8) Earthquakes, Central Nevada
by S. J. Caskey, S. G. Wesnousky, P. Zhang, and D. B. Slemmons
Abstract The 1954 Fairview Peak earthquake was followed 4 min and 20 sec later by the Dixie Valley earthquake. Surface ruptures were distributed among six different faults that define a complex north-trending zone 100-km long and over 15-km wide. The rupture sequence progressed from south to north. The initial event produced a 32 km rupture of right-oblique slip along the east-dipping Fairview fault where the components of right-lateral offset and vertical separation reached 2.9 and 3.8 m, respectively. The northernmost ruptures occurred during the subsequent event along a 46-km portion of the east-dipping Dixie Valley fault where the sense of slip was normal and reached a maximum vertical separation of 2.8 m. Average surface offset for both events is about 1.2 m. The west-dipping West Gate, Louderback Mountains, and Gold King faults also ruptured during the earthquake sequence. These faults form a complex structural linkage within a 15-km left-step that separates the surface traces of the Fairview and Dixie Valley faults. The west-dipping faults likely played an important role in the redistribution of static stress from the Fairview Peak earthquake and subsequent triggering of the Dixie Valley earthquake. Rightlateral offsets of more than a meter occurred along both the West Gate and Louderback Mountains faults. Slip was limited to normal motion of 1 m or less along the Gold King fault. The change from right-oblique motion along the Fairview fault to pure normal motion on the Dixie Valley fault may reflect the transition from principally northwest extension in the south to more westerly extension in the north. Alternatively, slip at the latitude of the Dixie Valley fault may be partitioned between pure normal slip along the Dixie Valley fault and strike-slip motion on faults immediately to the west. Observations of fault dip provide insight to the complex threedimensional geometry of the rupture sequence. Of particular note, a significant section of the Dixie Valley fault appears to be characterized by dip angles as low as 25° at the surface. Slip variation or earthquake endpoints do not generally appear to have been influenced by changes in bedrock type. We do not observe systematic relations between slip variation and aspects of fault-trace geometry, such as salients and reentrants. Yet, the relative competence of footwall bedrock appears to have influenced the long-term development of large salients and reentrants along both the Dixie Valley and the Fairview faults, as well as the style of rupture along the southern portion of the Dixie Valley fault.
Introduction
The Ms 7.2 Fairview Peak earthquake occurred on 16 December 1954 in central Nevada about 50 kIn east of Fallon. The event was followed 4 min and 20 sec later by the nearby Ms 6.8 Dixie Valley earthquake. The two earthquakes combined to produce a zone of normal and normalright-oblique surface ruptures that extend for about 100 kIn in a northerly direction (Plate 1 and Fig. 1). Slemmons (1957) was the first to study the geological characteristics of the earthquakes. He provided an overview of the general
761
characteristics of surface faulting, reported about two dozen measurements of fault offset, and published a 1 :250,000 scale map showing the distribution of fault traces. Bell (1984) compiled the distribution of ruptures on a 1 :250,000 scale map of the Reno 1 ° X 2° quadrangle. Bell and Katzer (1987, 1990) further studied the surficial geology and history of late Quaternary faulting along the Dixie Valley fault within the IXL Canyon 7.5-min quadrangle. Active faulting in the Dixie Valley area has been the subject of numerous
762
N
t
S. J. Caskey, S. G. Wesnousky, P. Zhang, and D. B. Slemmons
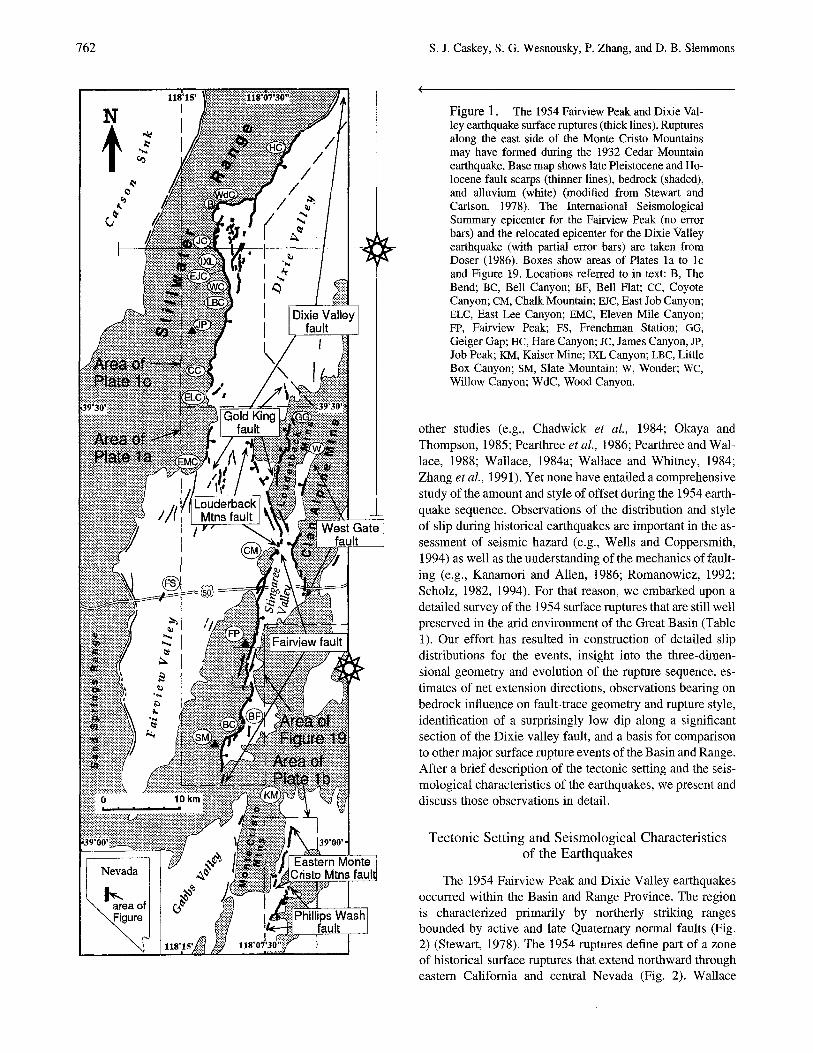
Figure 1. The 1954 Fairview Peak and Dixie Valley earthquake surface ruptures (thick lines). Ruptures along the east side of the Monte Cristo Mountains may have formed during the 1932 Cedar Mountain earthquake. Base map shows late Pleistocene and Holocene fault scarps (thinner lines), bedrock (shaded), and alluvium (white) (modified from Stewart and Carlson, 1978). The International Seismological Summary epicenter for the Fairview Peak (no error bars) and the relocated epicenter for the Dixie Valley earthquake (with partial error bars) are taken from Doser (1986). Boxes show areas of Plates la to lc and Figure 19. Locations referred to in text: B, The Bend; BC, Bell Canyon; BF, Bell Flat; CC, Coyote Canyon; CM, Chalk Mountain; EJC, East Job Canyon; ELC, East Lee Canyon; EMC, Eleven Mile Canyon; FP, Fairview Peak; FS, Frenchman Station; GG, Geiger Gap; HC, Hare Canyon; JC, James Canyon, JP, Job Peak; KM, Kaiser Mine; IXL Canyon; LBC, Little Box Canyon; SM, Slate Mountain; W, Wonder; WC, Willow Canyon; WdC, Wood Canyon.
other studies (e.g., Chadwick et ai., 1984; Okaya and Thompson, 1985; Pearthree et al., 1986; Pearthree and Wallace, 1988; Wallace, 1984a; Wallace and Whitney, 1984; Zhang et ai., 1991). Yet none have entailed a comprehensive study of the amount and style of offset during the 1954 earthquake sequence. Observations of the distribution and style of slip during historical earthquakes are important in the assessment of seismic hazard (e.g., Wells and Coppersmith, 1994) as well as the understanding of the mechanics offaulting (e.g., Kanamori and Allen, 1986; Romanowicz, 1992; Scholz, 1982, 1994). For that reason, we embarked upon a detailed survey of the 1954 surface ruptures that are still well preserved in the arid environment of the Great Basin (Table 1). Our effort has resulted in construction of detailed slip distributions for the events, insight into the three-dimensional geometry and evolution of the rupture sequence, estimates of net extension directions, observations bearing on bedrock influence on fault-trace geometry and rupture style, identification of a surprisingly low dip along a significant section of the Dixie valley fault, and a basis for comparison to other major surface rupture events of the Basin and Range. After a brief description of the tectonic setting and the seismological characteristics of the earthquakes, we present and discuss those observations in detail.
Tectonic Setting and Seismological Characteristics of the Earthquakes
The 1954 Fairview Peak and Dixie Valley earthquakes occurred within the Basin and Range Province. The region is characterized primarily by northerly striking ranges bounded by active and late Quaternary normal faults (Fig. 2) (Stewart, 1978). The 1954 ruptures define part of a zone of historical surface ruptures that extend northward through eastern California and central Nevada (Fig. 2). Wallace

Surface Faulting a/the 1954 Fairview Peak (Ms 7.2) and Dixie Valley (Ms 6.8) Earthquakes, Central Nevada 763
Table 1 Summary of Surface Rupture Characteristics for Faults Activated during the 1954 Fairview Peak and Dixie Valley Earthquakes
Rupture A¥,(max) A¥,(avg)
length Average VSmax VSavg SSm" SSavg u~ Uavg (X 1026 (X 10"
Fault (km) Strike Dip (m) (m) (m) (m) (m) (m) dyne em) dyne em)
Dixie Valley fault 42.0 017° 30°_50° E 2.80 0.90 3.66 1.17 9.04 2.89 7.27 6.94 Fairview fault zone 31.6 015° 50°_70° E 3.80 1.20 2.90 1.00 5.26 1.71 8.63 2.80
(3.80) Gold King fault 8.5 005° 50°_70° W 1.00 0.45 1.15 0.52 0.51 0.23 Louderback 14.0 345° 60°_80° W 0.80 0.20 1.70 0.50 1.86 0.54 1.25 0.36
Mtns fault (0.70) Phillips Wash fault 6.2 027° 50°_70° E 0.48 0.25 0.80 0.60 0.87 0.67 0.28 0.22
(0.30) West Gate fault 10.0 003° 50°_70° W 1.15 0.40 1.20 0.60 1.41 0.76 0.73 0.39
(0.65) Fairview Peak 11.40 4.00 7.34 7.03
event totals
Abbreviations: VSrn •x (maximum vertical separation of the ground surface) is taken to approximate maximum vertical displacement (throw) (numbers in parentheses represent vertical separation measured at location of maximum strike-slip offset, and these values are used to determine dip-slip component for Um• x calculations); SSm.x (maximum lateral offset); VS.vg [average vertical separation (approximates average throw)] and SS.vg (average lateral offset) calculated using generalized linear point-to-point functions that define slip distribution curves (Fig. 5). Areas beneath the slip distribution curves (Fig. 5) were determined, and these areas were then divided by rupture length to determine average values. SS.vg for Phillips Wash fault was determined by assuming a constant proportion of strike slip to dip slip along the entire rupture length as at the location of the single strike-slip measurement (Fig. 5f). U m• x (maximum surface displacement) is determined at a single location along the fault (e.g., Wells and Coppersmith, 1994) and is equal to the vector sum of the dip-slip and strike-slip components. Along the Fairview fault, VS rn• x and SSm.x were measured within 100 m of each other, so in this case, these measurements are used to calculate Urn•x' Dip slip (DS) is determined from the relation DS = VS/sin 8, where 8 is the fault dip angle. The average fault dip from the range of dip values shown in the table were used to calculate dip slip, except for the Dixie Valley fault where a 50° fault dip was used because this dip angle is well constrained for the fault in areas north of The Bend (Okaya and Thompson, 1985). As well, it is not known if the low angle of dip at the surface along parts of the fault south of The Bend (discussed in text) projects down to seismogenic depths. Ranges for dip values shown in the table are based generally on field observation (Plates la to lc) where available. Otherwise, ranges for dip values are assumed. u.vg (average slip resolved) is calculated from the vector sum of DS.vg (= VS.visin 8) and SS.vg; M~(max) and M~(avg) (maximum and average geologic moments) for each fault ruptured were calculated from the relationship M~ = JlwLu (Aki and Richards, 1980) where U is the shear modulus (3 X 10¹¹ dyne/cm2), w is fault width (assuming the same fault dips used for dip-slip calculations and a fault depth of 15 km, which is consistent with microearthquake studies in the Fairview Peak area (Ryall and Malone, 1971; Stauder and Ryall, 1967), L is fault surface rupture length, and U is net displacement. Maximum and average geologic moments were calculated using Urn•x and u.vg , respectively; Mw(max) and Mw(avg) (maximum and average moment magnitudes) were calculated from the relation Mw =
2/3Log M~ - 10.7 (Hanks and Kanamori, 1979) for maximum and average geologic moments. Moments and moment magnitudes for the Fairview Peak event totals assume that the Fairview, Gold King, Louderback Mountains, Phillips Wash, and West Gate fault all ruptured during this earthquake. Because the west-dipping Gold King, Louderback Mountains, and West Gate faults may not extend down to 15 km depth (i.e., they may be antithetic to and therefore terminate at the Fairview and Dixie Valley faults at a shallower depth), both M~(max) and ~(avg) and corresponding moment magnitudes are considered maximum values for these estimates.
(1984a) defined the zone of ruptures as the central Nevada seismic belt. In addition to the 1954 Dixie Valley and Fairview Peak events, it is marked by ruptures of the 1872 Owens Valley (Mw = 7.6) (Beanland and Clark, 1995), 1915 Pleasant Valley (Ms = 7.7) (Abe, 1981), 1932 Cedar Mountain (Ms = 7.2) (Abe, 1981), and the 1954 Rainbow Mountain and Stillwater (Ms = 6.3 and Ms = 7.0) earthquakes (Lienkaemper, 1984). The 1992 Landers earthquake (Mw = 7.3) (Sieh et aI., 1993) may be a southern continuation of the seismic belt. The Fairview Peak, Rainbow Mountain, and Stillwater earthquakes produced rightoblique motion on dipping faults (Doser, 1986). With respect to the seismic belt, these earthquakes took place in a zone of transition between the dominantly right-lateral Owens Valley and Cedar Mountain events to the south, which occurred within the northwest-trending Walker Lane belt (Fig. 2) (Stewart, 1988), and the dominantly dip-slip Dixie Valley and Pleasant Valley earthquakes to the north,
where the Basin and Range is characterized by a consistent north to northeast structural grain.
Doser (1986) reanalyzed the body waveforms of the 1954 earthquake sequence and relocated the epicenter for the Dixie Valley event. Because the Dixie Valley event occurred only 4 min after the Fairview Peak earthquake, details of the Dixie Valley waveforms are obscured by the waveforms of the Fairview Peak earthquake. Hence, estimates of the epicenter of the Dixie Valley event have been problematic, and first-motion data are not available. The International Seismological Summary (ISS) epicenter of the Fairview Peak event is located at 39.20° Nand 118.00° W (Fig. 1). Doser's (1986) relocation for the Dixie Valley epicenter is associated with large error bars and lies about 50 km to the north at 39.67° Nand 118.00° W (Fig. 1). No eyewitness reports exist to confirm which faults broke during the individual earthquakes. However, from the epicenters of the two events and the large left-step between the Dixie Valley fault

764
120'W 11TW
Figure 2. Map showing surface ruptures (bold lines) and focal mechanisms reported for major historic earthquakes in Nevada and eastern California. Other Quaternary faults in the Great Basin are shown as thinner lines. Landers earthquake magnitude from the National Earthquake Information Center (Sieh et aI., 1993). References for other earthquake magnitudes are cited in text. Compressional quadrants of focal mechanisms are black.
ruptures and those to the south, it has generally been interpreted that the faults east of Fairview Peak and on the east side of Dixie Valley ruptured during the Fairview Peak event, and those on the west side of Dixie Valley (i.e., on the Dixie Valley fault) ruptured in the Dixie Valley event (Fig. 1). The focal mechanism of the Fairview Peak earthquake (Doser, 1986; Romney, 1957) shows right-oblique motion on an eastward-dipping plane (Fig. 2). Doser (1986) attained a best fit for the contaminated Dixie Valley event waveforms for pure dip-slip motion and a fault strike of 3500
, although waveform shapes were not altered by variations of ± 200 in rake.
Methods
A set of 1:10,000 to 1:12,000 scale vertical, low-sunangle air photographs taken in 1968 and 1970 (e.g., Fig. 3) was used in the field to map the 1954 surface ruptures and prehistoric fault scarps. The mapped traces were then compiled on 1:24,000 scale topographic base maps and reduced to 1:48,000 scale (Plate 1). A total of about 600 measurements of both vertical and lateral components of offset were measured in the field during the summers of 1992 and 1993.
S. 1. Caskey, S. G. Wesnousky, P. Zhang, and D. B. Slemmons
Measurements of vertical separation of the ground surface were made at intervals of about 300 m along the strike of each fault trace and compensate or account for near-scarp warping of the ground surface and multiple fault traces and graben structures commonly associated with the fault ruptures (Fig. 4). Attention was given to taking measurements where vertical separation changed appreciably along strike. Vertical separations were measured primarily on gently sloping ground surfaces « 1 00
) so that these measurements generally approximate the amount of vertical displacement (i.e., throw) (Caskey, 1995). Where possible, lateral offsets of channels, debris flow levees, and small ridge lines (i.e., piercing points) were measured. The locations and amounts of offset are shown on Plate 1 and summarized in slip distribution diagrams shown for each fault in Figure 5. These data form the basis for discussion of the characteristics of offset along each fault.
Surface Rupture Characteristics
Distribution and Patterns of Faulting
Surface ruptures attributed to the Fairview Peak earthquake are mainly distributed along five faults: (1) Fairview, (2) Louderback Mountains, (3) West Gate, (4) Gold King, and (5) Phillips Wash (Fig. I, Plates la and Ib). In contrast, ruptures attributed to the subsequent Dixie Valley earthquake are limited to the Dixie Valley fault that also includes a complex zone of faulting in the piedmont area within a region known as The Bend (Fig. I, Plate Ic).
The surface ruptures along the Fairview fault form a complex north-northeast-striking, east-dipping zone offaulting that, in part, bounds the eastern escarpment of Fairview Peak. The fault extends 32 km from near Slate Mountain (on the south) to Chalk Mountain (on the north). Large salients (i.e., convex forms) and reentrants (i.e., concave forms or embayments) in the rupture pattern are observed in the vicinity of Bell Flat. The trace is relatively linear farther to the north. The rupture trace is also discontinuous at several 10-cations. The trace has a distinct left step at the north end of Bell Flat and gaps in the trace at the apex of the salient in the central Bell Flat area and along the east side of Chalk Mountain. The width of the zone of ground breakage along the Fairview fault ranges from a single fault strand (less than 1 m) to broadly distributed zones that are several kilometers wide. Between U.S. Highway 50 and Chalk Mountain, a zone of ruptures I-km wide forms a left-stepping echelon pattern in alluvium and along the base of low-lying hills that mark the west side of the Stingaree Valley graben. Several small, north-trending surface breaks formed across a zone at least 4-km wide in the central part of Bell Flat (Fig. 1). These scarps were identified by reconnaissance mapping of Vincent Gianella (in Slemmons, 1957; University of Nevada Library Archives, unpublished data), but they were not observed in the field or on aerial photos during this study. At the range-front salient in the Bell Canyon area, surface rup-

Suiface Faulting of the 1954 Fairview Peak (Ms 7.2) and Dixie Valley (Ms 6.8) Earthquakes, Central Nevada 765
a
b
c
d
e
Figure 3. Aeriallow-sun-angle photograph of the Coyote Canyon area showing the locally corrugated (e.g., nonplanar) geometry of the Dixie Valley fault. Scale is approximately 1:12,000. North is approximately toward top of photo. Photo taken on early morning of 20 June 1970.
vs= vertical separation of the ground surface
smL
o 10m
smL
o 10m
smL
o 10m
VS-O.O-O.6 m
VS-O.O-O.5 m ,mL o Sm
west east
Figure 4. Scarp profiles across 1954 surface ruptures (refer to Plate 1a and lcforlocations). (a) Simple scarp -2.0 kIn south of Fairview Peak; location of maximum vertical separation along the Fairview fault zone. (b) Compound scarp at the north end of Bell Flat (Fig. 1) in late-Pleistocene alluvium showing about 3.0 m of 1954 vertical separation (VS) of the ground surface and 6.5 m net vertical separation. The net vertical separation is considered a minimum because the surface on the down-thrown side is buried by an unknown amount of alluvium. (c) through (e) Prominent faulttrace grabens showing little net vertical separation of the ground surface in the general vicinity of Little Box Canyon. The geometry of these profiles indicates that fault displacement is associated with greater heave (horizontal fault-normal extension) than throw (vertical displacement). This structural relationship indicates a subsurface fault dip of less than 45°.

766
-1
b
3
I~ § . .g 1.5 ta fr en
] .-e 0.5
> o
S.1. Caskey, S. G. Wesnousky, P. Zhang, and D. B. Slemmons
o 4 8
• range front trace
D piedmont fault zone
~-
12 16 20
Distance along (015°) strike (kms)
I
f I ~ : t
24 28
rupture trace of the Dixie VaBey fault
--L-------~-----l~---t---------~~ 8 16 24 32 40
Distance along (017°) strike (lans)
Figure 5. Measurements of vertical separation (solid dots and open squares) and lateral offset (open circles) versus distance along a line of average strike for (a) the Fairview fault, (b) the Dixie Valley fault (c) West Gate fault, (d) the Louderback Mountains fault, (e) the Gold King fault, (t) and the Phillips Wash fault surface ruptures. The mapped rupture traces are registered with the horizontal axis for each plot; ball and stick shown on down-thrown side of the faults; paired arrows indicate direction of lateral motion. Negative vertical separation values in (a) and (b) represent net down-to-the-west separations; those in (d) represent net down-to-the-east separations. The negative right lateral value in (a) represents a measurement of net left-lateral offset (see text, Plate la). In (a), strike-slip offset is projected to zero at the south end of Fairview fault trace to reflect previous observations of right slip outboard of the range-front fault in Bell Flat (Slemmons, 1957). Measurement error bars are shown as thin vertical lines through data points. Where rupture strands overlap at map scale, measurements that fallon (or very close to) a given line perpendicular to the average strike line of the fault are combined for net lateral offsets and net vertical separations. Measurements of lateral offset in areas of multiple fault strands are generally considered minimum net values because lateral displacement is seldom well expressed or preserved on all overlapping ruptures. Where rupture strands overlap, error estimates on all strands are assumed to be additive and are therefore generally greater than error estimates where only a single fault strand exists. Thin dashed lines represent generalized slip distribution "curves" from which average displacements were determined (Table 1).
32

Surface Faulting of the 1954 Fairview Peak (Ms 7.2) and Dixie Valley (Ms 6.8) Earthquakes, Central Nevada
c
• 0
d
f
• 0
o 2 4 6 8 10 12 14 Distance along (003') strike (kms)
.--:- -=--~ ~ ~ ~~ -~ r--=-. -----, -"
2 ..,..", _ -=:: 7 ~ rupture trace of the j
!1~ nl ~MW_ I I t I ' A 1 i~ <L\ I '4>----- )\
.... f\: ,+'l' "', ! \:: -. .... -t 1\ j f il \ ?'i\ 1:', Tt ---- ?--..... ---4 ---
",K', " \ 4' '1 \1 / \:t-" r"- ....... ---. \ _~_~~~ __ L~~~ __ ~ ___ ~~--~ I , I '. / ..
2
2
~~ ,
4 6 8 ill Distance along (345') strike (kms)
4 6 8 ill Distance along (005') strike (kms)
2 3 4 Distance along (027') strike (kms)
5
12 14
12
6
767

768
tures bifurcate and form a left-stepping echelon pattern 0.7 km across on the north side of the salient and a right-stepping pattern 1.0 km across on the south side of the salient.
The West Gate fault bounds the western escarpment of the Clan Alpine Mountains. The west-dipping fault is marked by a sinuous north-striking trace that defines salients and reentrants in the range front with a wavelength of about 8 km. Surface ruptures in 1954 were limited to two sections of the fault. The southernmost breaks form a discontinuous trace that extends from just south of U.S. Highway 50 northward for about 8 km along a range-front salient and bounds the east side of the Stingaree Valley graben. A shorter 2-km rupture is located farther to the north, also along a rangefront salient about 4 km south of Wonder, Nevada. The northern part of the fault bounds the eastern side of the southern part of the Louderback Mountains structural block, which appears to be tilted eastward and down-faulted against the Clan Alpine Mountains in half-graben fashion. Between U.S. Highway 50 and the range-front salient 4 km to the north, the fault trace forms a distinct left-stepping echelon pattern with scarps formed well within bedrock of the mountain range. Although 1954 offsets of U.S. Highway 50 are well documented (Slemmons, 1957), ruptures in the vicinity of the highway are no longer visible.
The Louderback Mountains fault trace extends for a distance of 14 km along the west side of the Louderback Mountains, on a strike of about 3450 from the north end of Chalk Mountain. A right step of about 100 m separates the southern end of the fault trace from the northernmost extension of the Fairview fault. The trace forms a generally linear but discontinuous zone of mostly west-facing surface breaks that average between 0.5 and 2.0 km in length. The southern 3 km of the rupture trace exhibits a clear left-stepping echelon pattern of scarps averaging several hundred meters in length.
The Gold King fault ruptures strike north-northeasterly through the Tertiary volcanic bedrock of the Louderback Mountains. The 1954 earthquake produced an 8.5-km-Iong zone of discontinuous west-dipping surface ruptures that overlap with and strike obliquely to the adjacent Louderback Mountains fault. The Gold King fault closely parallels the northern part of the West Gate fault 3 to 4 km to the east. Individual breaks range between 1.5 and 2.0 km in length. The southern end of the rupture trace extends to within 1.5 km of the Louderback Mountains fault trace. The original work of Slemmons (1957) did not distinguish between the Louderback Mountains and the Gold King faults, although our observations clearly indicate the presence of two separate faults with distinctly different styles of slip.
At the south end of the 1954 Fairview Peak rupture zone and in the northern part of Gabbs Valley, we define a 6.2-km-Iong and 0.8-km-wide, northeast-striking zone of ruptures along the east side of Phillips Wash as the Phillips Wash fault (Plate 1 b). The zone of ruptures consists of short (0.1 to 1.0 kIn) scarps arranged clearly in a right-stepping echelon fashion, evident at both map and outcrop scales. These ruptures were not identified by Slemmons (1957).
S. J. Caskey, S. G. Wesnousky, P. Zhang, and D. B. Slemmons
However, a secondhand historical account provided by Craig dePolo (Nevada Bureau of Mines and Geology, personal comm., 1994) from an unidentified man who lived at the hot springs 8 km west of the fault trace indicates that the road crossing the central part of the rupture zone was faulted immediately following the 16 December earthquakes (see Plate 1 b). More convincingly, these scarps are not visible on aerial photos taken in August 1954 (Nevada Bureau of Mines and Geology photo collection), and hence, the Phillips Wash fault broke during the 16 December 1954 event. Ekren and Byers (1986) also identified two short surface breaks as 1954 ruptures in this area.
The Phillips Wash fault lies to the south and is separated by a 2-km step from an 8-km-Iong section of recent fault scarps along the northeast-striking Eastern Monte Cristo Mountains fault (Plate 1b). Young scarps along this fault were originally suspected of forming in 1954. However, many of these ruptures are visible on aerial photos taken in July and August of 1954, prior to the 16 December 1954 events (Nevada Bureau of Mines and Geology photo collection). In addition, the recent scarps along the Eastern Monte Cristo Mountains fault exhibit a subtly greater degree of degradation than the 1954 scarps. We suspect that the scarps along the Eastern Monte Cristo Mountains fault formed during the 1932 Cedar Mountain earthquake, although Gianella and Callaghan (1934) did not recognize these scarps in their study of the 1932 ruptures. Their traverse map shows they did not explore the piedmont area along the eastern side of the Monte Cristo Mountains. If the Eastern Monte Cristo Mountains fault ruptures formed in 1932, then previous estimates of total rupture length for 1932 Cedar Mountain earthquakes should be extended by about 15 km to a total length of 75 kIn. Furthermore, it implies that the 1932 and 1954 ruptures overlap by about 13.5 km.
The Dixie Valley fault bounds the eastern escarpment of the Stillwater Range (Fig. 1). The 1954 earthquake produced a 46-km-Iong zone of surface breaks along the Dixie Valley fault, extending northward from 2 km north of Eleven Mile Canyon to about 3.5 km northeast of Hare Canyon (Fig. 1, Plates la and 1c). With the exception of a 4 km gap south of East Lee Canyon (Fig. 1), the range-front surface breaks are generally continuous. The southern limit of the rangefront trace is separated from the Louderback Mountains fault trace to the east by about 6 km. The range-front trace is locally very sinuous, particularly in the vicinity of Coyote Canyon (Fig. 3) and along the north side of The Bend (Fig. 1, Plate 1c), which appears to reflect a highly corrugated fault plane geometry. The main drainages of the Stillwater Range directly correspond to reentrants in this area (Plate 1c), indicating that the corrugations are probably long-established features of fault geometry. South of The Bend the fault defines range-front salients and reentrants with a wavelength of 2 to 3 kIn. The salient at Little Box Canyon (Fig. 1) marks a fundamental change in the strike of the Dixie Valley fault from about 0200 south of the salient to about 3450 to the north of the salient. In addition to the range front

Surface Faulting of the 1954 Fairview Peak (Ms 7.2) and Dixie Valley (Ms 6.8) Earthquakes, Central Nevada 769
ruptures, a broad discontinuous zone of ruptures formed on the piedmont in The Bend area. The north to northeast-striking zone of piedmont ruptures is about 12 km long, nearly 4-km wide, and is composed of mostly east-facing (normal fault) scarps. The piedmont fault zone appears to connect northeast-striking sections of the range front fault lying north and south of The Bend. Very small surface breaks also formed in the piedmont area east of Eleven Mile Canyon but are no longer recognizable in the field.
Finally, there are a number of minor surface breaks originally reported and mapped by Slemmons (1957), most of which were not recognizable in the field or on available aerial photos during this study and are not included in Plate 1. A 2-km-Iong, north-striking break was mapped across U.S. Highway 50 near Frenchman's Station (Fig. 1) on a southward projection of the Dixie Valley fault. A rupture of similar extent and orientation and characterized by vertical offsets less than 0.1 m was also reported about 4 km north of U.S. Highway 50 along the east side of the Clan Alpine Mountains. A 4-km-Iong, northeast-striking break was shown within bedrock at the north end of Fairview Peak. A small scarp showing less than 0.2 m of vertical and less than 0.1 m right-lateral offset was mapped on the northwest side of Chalk Mountain. Slemmons (1957) also noted several possible surface breaks within and along the west side of the Monte Cristo Mountains (Fig. 1). One of these ruptures is well expressed on aerial photos and is located about 5 km southeast of the southernmost rupture trace of the Fairview fault (Fig. 1). The west-facing break is less than l-km long, northeast-striking, and of small (probably less than 0.3 m) vertical displacement. Other minor fault breaks were reported by workers near the Kaiser Mine in the northern part of the Monte Cristo Mountains (Slemmons, 1957) (Fig. 1).
Style and Amount of Offset
There are fundamental differences in the style of offset when viewing the 1954 fault traces as a whole. First, while all of the ruptures show normal fault motion, only the Fairview, West Gate, and Louderback Mountains faults, which comprise most of the southern half of the 1954 ruptures, show clear evidence of a right-lateral component of slip. The Dixie Valley fault shows primarily dip-slip displacements, although indicators of both right- and left-lateral shear sense are present along much of the rupture trace. Surprisingly, the Phillips Wash fault trace appears to be associated with a leftlateral component of motion. Slip distributions showing measurements of the amount of vertical separation and lateral offset as a function of distance along fault strike are provided in Figure 5 and form the basis here for a detailed description of the style and amount of offset along each of the individual faults. For reference, fault traces are scaled to and shown above each of the slip distributions.
A maximum of 3.8-m vertical separation (Fig. 4a and 6) and 2.9 m of lateral offset (Fig. 7) for the 1954 earthquakes were measured along the Fairview fault in the vicinity of Fairview Peak (Fig. Sa). However, both the amount
and style of offset along this trace vary significantly along strike. For example, the largest offsets are limited to the southern half of the fault between Slate Mountain and Fairview Peak (about the 4 and 18 km marks on the slip distribution curve) (Fig. Sa). To the north, vertical separation decreases abruptly to less than 0.5 m along a 3-km section of the fault where evidence for lateral offset disappears (see comments, Plate la). North of the 22 km mark, vertical separation and right-lateral offset, again, abruptly increase and maintain values of 0.8 to 1.4 m and 1.0 to 2.0 m, respectively, to the northern end of the fault trace. Along the southern half of the fault, there exists a local minimum in vertical separation at about the 8 km mark, corresponding to a major salient in the range front. The slip distribution shows a linear decrease to zero offset along the southernmost 4 km. In detail, there is considerable scatter to the data along most reaches of the rupture trace. The scatter may reflect that fault slip at depth is not everywhere completely manifested at the surface.
Measurable components of a right-lateral offset along the Fairview fault are limited to two sections of the fault north of Bell Flat. Lateral offsets of greater than 2 m are manifested by displaced geomorphic features (and one tree root) at a half dozen points along the fault between the 12 and 16 km marks (Fig. Sa, Plate 1a). An offset ridge line used to determine the maximum lateral offset of 2.9 m (and a vertical separation of about 2.0 m) at 16 km is illustrated in Figure 7. At the 12 km mark, at the north end of Bell Flat, a stream channel is deflected 2.5 to 2.9 m right-laterally across two subparallel fault strands. Gianella (personal comm., in Slemmons, 1957) reported "as much as" 4.3 m of right slip in this general area. However, the exact location was not reported, and a reexamination of Gianella's field notes (University of Nevada, Reno, Library Archives) provides no confirmation of the measurement. Hence, we cannot confirm Gianella's observation. In the vicinity of U.S. Highway 50, the right component of slip is manifested by a distinct left-stepping echelon pattern in the fault trace. In this area, we consider our relatively lesser values of lateral offset to reflect minimum values because our measurements account for slip across less than the entire width of the zone of surface ruptures. Slemmons (1957) documented 1.9 m of right-lateral offset of the U.S. Highway 50 centerline. This measurement constrains the amount of net lateral displacement locally and is included in Figure Sa.
Variations in the amount of lateral slip along the Fairview fault may in part be due to a lack of preservation of features during the 40 years subsequent to the earthquake. However, certain observations indicate that some of the variation is a first order feature of faulting at the surface. For example, east of Fairview Peak (at the 17 km mark in Fig. Sa), a tree root is offset in a left-lateral sense by about 0.5 and 1.5 m vertically across a local rupture strike of 0550 and constrains the direction of relative motion to 3050 across the fault locally. This direction of motion imposed on the average strike of 0150 for this reach of the fault allows for only

770 S. J. Caskey, S. G. Wesnousky, P. Zhang, and D. B. Slemmons
Figure 6. Photograph of 1954 scarp along the Fairview fault in the area of maximum surface displacement (Fig. 4a). In the background is the ridge line shown in Figure 7. Surveying instrument and tripod are about 1.7-m high. Photo taken 10 May 1994.
-2.0 m throw 7
a small component of right slip along this reach. Along this same section of the fault, channel features at two locations have remained virtually unmodified since the earthquake and exhibit no measurable right-lateral offset (Plate la). When combining these observations with the consistently small measures of vertical separation along the fault trace, we interpret that the right-lateral slip deficit between 18 km and 22 km is real rather than due to a lack of preservation of offset features. Similarly, in the Bell Flat area (south of the 12 km mark on the slip distribution), the greater sinuosity of the fault trace and general lack of a left-stepping character in areas of complex scarps are consistent with a lack of strike slip along this section of the fault. Additionally, the presence of particularly well-developed grabens along a portion of the fault trace lying 1 to 3 km north of the salient at Bell Canyon is consistent with dominantly fault-normal extension in this area. Hence, the general absence of right-lateral offset along the fault in Bell Flat also appears to be a first-order feature of slip at the surface. Slemmons (1957, Fig. 11) reported a right-lateral offset of approximately 0.5 m along a purely strike-slip break in the central part of Bell Flat that is no longer visible today. It is possible that some of the strikeslip motion that is well expressed farther north along the Fairview fault may be accounted for by ruptures lying outboard of the range-front trace in Bell Flat, which are no longer preserved. Our observations, combined with those reported by Slemmons (1957), indicate that slip was locally partitioned between the range-front fault (dip slip) and faulting in Bell Flat (strike slip).
b
Figure 7. (a) Along-strike and (b) across-strike profiles of a faulted ridge line along the Fairview fault zone about (3.5 cm on map, 1.8 km on ground) south of Fairview Peak (Plate la). View in (a) is at an azimuth of 2600 and parallel to the ridge axis. Alongstrike scarp line profiles on the footwall (upper surface) and hanging wall (lower surface) show that the ridge line is offset in right-lateral sense by 2.9 m and in a vertical sense by about 2.0 m. The view in (b) is along fault strike (355°). The profile was surveyed along the ridge axis and also shows approximately 2.0 m of vertical separation of the ground surface. Evidence for right-oblique slip is well preserved along
Surface Faulting of the 1954 Fairview Peak (Ms 7.2) and Dixie Valley (Ms 6.8) Earthquakes, Central Nevada 771
portions of the West Gate fault (Fig. 5c). Eight measurements of laterally offset landforms were obtained along the fault in the vicinity and north of U.S. Highway 50. Lateral offsets consistently range between 0.75 and 1.2 m immediately north of U.S. Highway 50 (between the 8 Ian and 14 Ian marks on the slip distribution). Offset of two stream channels at about the 8 and 10 Ian marks show lateral slip of 1.2 m (Fig. 5c, Plate la). The measures are slightly larger than the 0.9-m offset of the U.S. Highway 50 centerline reported by Slemmons (1957), which is also included on the slip distribution (Fig. 5c). Vertical separation in the same area is typically less than the lateral component of offset, reaching a maximum of 1.1 m near the apex of the large range-front salient. The short scarp line to the north revealed no evidence of lateral slip.
Along the Louderback Mountains fault, the most westerly striking fault of the 1954 ruptures, right-lateral offsets of small ephemeral stream channels and ridge lines are very well preserved. The largest offsets along this fault were principally strike slip (Figs. 5d and 8). Preservation of lateral offsets is concentrated along two sections of the fault, adjacent to the 4 Ian and 8 Ian marks of the slip distribution, where the largest lateral offsets range between 1.5 and 1.7 m. Although we could not confidently measure lateral slip along the northern two breaks of the fault, a few features suggested up to 0.5 m of right slip locally. The largest ver .. tical separations of 0.6 to 0.8 m were measured in the areas of the largest lateral offset. The sense of vertical separation reverses along two sections of the fault (e.g., negative values in Fig. 5d), again suggesting primarily strike-slip motion.
Surface breaks along the Gold King fault exhibit only dip-slip displacement. A maximum vertical separation of 1.0 m was measured near the southern end of the surface trace at about the 10 Ian mark (Fig. 5e). Average vertical separation along the fault is less than 0.5 m. It is not known whether the small breaks that formed in alluvium north of the Louderback Mountains (Plate 1a) (between the 0 and 2 Ian marks) broke along with the Gold King fault. However, for simplicity, they are included with the slip distribution (Fig. 5e).
Vertical separation along the Phillips Wash fault is a maximum of 0.5 m but generally ranges between 0.2 and 0.3 m along most of the fault trace (Fig. 5f). The sense of net vertical separation across the zone of faulting consistently shows the east side moving down. Ekren and Byers (1986) mapped two fault strands within the 1954 rupture zone and indicated right-lateral motion. Our observations do not confirm the presence of right slip. In contrast, the distinct right-stepping echelon pattern to the Phillips Wash fault is more consistent with the presence of significant left-lateral displacement. Direct evidence for the amount of left-lateral displacement is limited to only one observation. A stream channel near the 4 Ian mark of the slip distribution is offset left laterally by 0.8 m (Fig. 5f, Plate 1b). Though Ekren and Byers (1986) showed right-lateral motion on the 1954 breaks in this area, they indicated a left-lateral sense of shear on other (pre-1954) mapped strands of the Phillips Wash fault. Their interpretation of net left-lateral offset along the Phillips Wash fault is therefore consistent with the suggestion of left-lateral offset on the 1954 breaks.
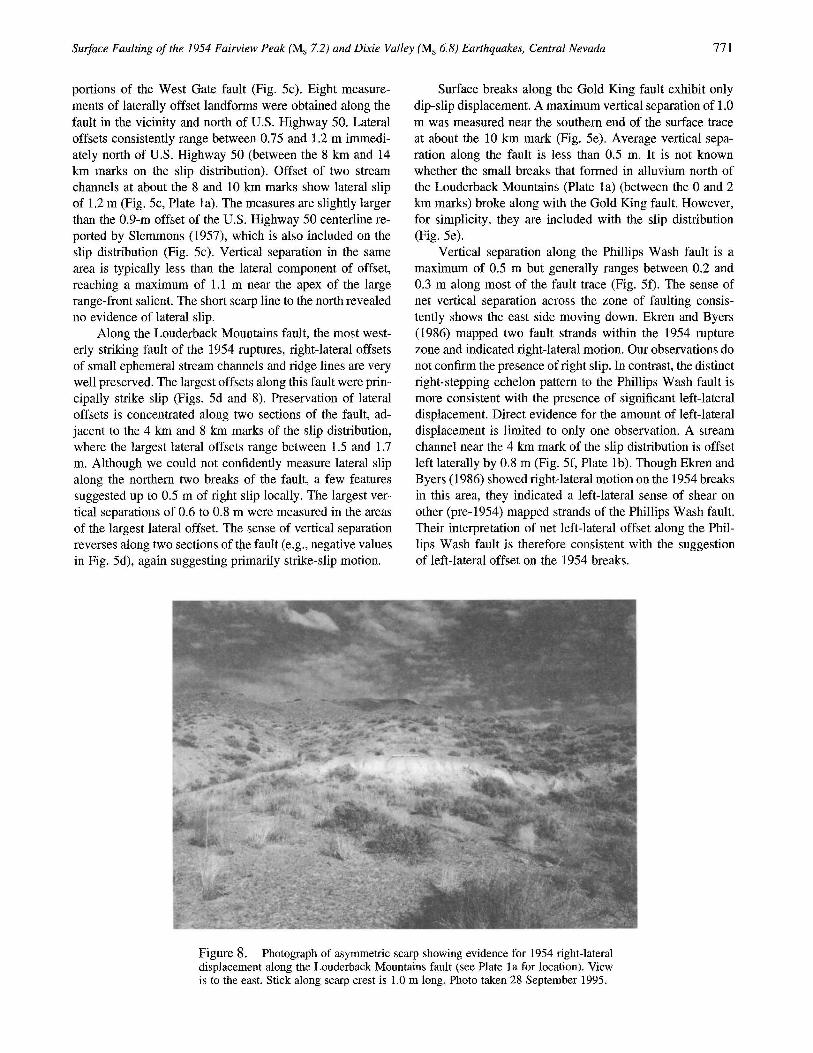
Figure 8. Photograph of asymmetric scarp showing evidence for 1954 right-lateral displacement along the Louderback Mountains fault (see Plate la for location). View is to the east. Stick along scarp crest is 1.0 m long. Photo taken 28 September 1995.

772
Young scarps of the Eastern Monte Cristo Mountains fault show evidence for right-oblique slip in contrast to the suggestion of left-oblique slip along the Phillips Wash fault, though curiously, these faults have about the same strike. T4e slip distribution for these 1932(?) breaks is not included herciQ. However, field measurements made along these scarps are shown on Plate lb. Vertical separations are generally less than 0.3 m with a maximum of 0.4 m measured at two locations at the north end of the rupture. Right-lateral stream channel offsets between 0.8 and O.S m were measured at three locations along the trace. The suggestion of rightoblique slip along these ruptures is consistent with their formation during the 1932 Cedar Mountain earthquake (as previously discussed), which was dominantly right lateral (Gianella and Callaghan, 1933, 1934; Doser, 1988).
The Dixie Valley fault produced mainly dip-slip movement in 1954 (Fig. Sb). Maximum vertical separations of2.8 and 2.S m were measured at sites near Coyote Canyon and IXL Canyon, respectively. The two maximums fall along pronounced peaks on the slip distribution plot. The areas of maximum vertical separation are separated by a distinct slip low centered on the prominent salient along the Stillwater Range front at Little Box Canyon (Figs. 1 and 5b) where vertical separation decreases to less than 0.5 m. The slip low observed at the salient is in contrast with observations along the West Gate fault that showed the largest offsets along a prominent range front salient. Vertical separations greater than 1 m are limited to a 23 km portion of the Dixie Valley fault between about Coyote Canyon and The Bend. North of The Bend, vertical separations are relatively small and decrease almost linearly from 0.7 m to zero at the north end of the rupture trace. The slip distribution also shows an approximately linear displacement gradient between IXL Canyon (2.5 m) and about Little Box Canyon (less than 0.5 m). Measurements of vertical separation along the piedmont scarps in The Bend area are shown separately (squares) from those along the range front in Figure Sb. Separations generally range from 0.2 to 0.5 m with a maximum of about 0.7 m at the 28 km mark in the slip distribution (Fig. 5b). A net down-to-the-west sense of motion across the piedmont scarps is shown at several locations between the 29 and 31 km marks.
Nineteen observations that indicate a mixture of rightand left-lateral shear were made along a 22-km-Iong rangefront portion of the Dixie Valley fault south of The Bend and north of Coyote Canyon (see annotations, Plate 1a). However, all 19 observations of shear sense can be explained by changes in fault strike with respect to an extension direction of 274 ± 15° (Fig. 9), which is approximately perpendicular to the average strike of the fault south of The Bend. Shear sense is mostly shown by right- and left-stepping echelon normal fault scarps that formed obliquely to the main fault trace and that indicate components of left- and rightlateral shear, respectively (e.g., Withjack and Jamison, 1986), although there are two observations of actual lateral offset in the Coyote Canyon area, and these are noted on
S. J. Caskey, S. G. Wesnousky, P. Zhang, and D. B. Slemmons
showing component of right-lateral shear
N
t NE fault strikes
showing component of left-lateral shear
Figure 9. Diagram showing the inferred extension direction (slip azimuth) for the Dixie Valley fault ruptures south of The Bend. Thick lines represent the strikes of different fault reaches that show evidence for right-lateral shear on northwest-striking reaches (shaded lines) and left-lateral shear on northeast-striking reaches (solid lines). Strike lines labeled "2" represent observations of right-lateral shear sense on two different fault reaches with the same strike. The direction of extension is inferred to lie between the two families of dashed lines drawn perpendicular to the thicker strike lines. The extension direction of 2740
± 150 satisfies all of the observations of both rightand left-lateral shear along the Dixie Valley fault ruptures south of The Bend.
Plate 1c. Without exception, evidence for right-lateral shear exists on northwest-striking portions of the fault, and leftlateral shear occurs on northeast-striking portions. For example, at Little Box Canyon, the fault changes from a northwest to a northeast strike. To the north, the fault shows a clear left-stepping pattern, and to the south, a clear rightstepping pattern (Fig. 10). Thus, the observations of both right- and left-lateral shear indicate that the general sense of slip for the Dixie Valley fault ruptures south of The Bend is primarily dip slip and in an east-west direction.
Liquefaction Features Associated with the Dixie Valley Earthquake
Liquefaction-related features produced by the Dixie Valley earthquake are still visible today in low-lying areas east of the northern part of the piedmont ruptures and also east of the range-front fault north of The Bend. In these

Suiface Faulting of the 1954 Fairview Peak (Ms 7.2) and Dixie Valley (Ms 6.8) Earthquakes, Central Nevada 773
Figure 10. Aerial low-sun-angle photograph of the Dixie Valley fault in the Little Box Canyon area. Fault scarps (highlighted by sunlight) north of the canyon mouth show a pronounced left-stepping echelon pattern indicating a component of right-lateral shear. West-facing scarps south of the canyon (in shadow) show a pronounced right-stepping pattern indicating a component of left-lateral shear. Note the well-developed and nearly continuous nature of faulttrace grabens. Scale is approximately 1:12,000. North is approximately toward top of photo. Photo taken on early morning of 20 June 1970.
areas, numerous solitary scarps and grabens less than I-Ian long are interpreted as lateral spreads caused by liquefaction (Plate 1 c). In the northern part of Dixie Meadows (Plate 1 c), at the latitude of the north end of the 1954 surface ruptures, scarps that are each I-Ian long or less formed over a zone approximately O.5-Ian wide. Liquefaction-related scarps that formed about 3 Ian southwest of Dixie Meadows disrupted and closed the Dixie Valley Road (Plate Ic). Fissures and sinkholes presumably related to subsurface piping are common along the lateral spread features. In all cases, the presence of phreatophytes indicates that lateral spreads formed where ground water is shallow. Nearly all of the scarps related to lateral spreading are parallel to the range-front fault or the piedmont rupture trace in The Bend area. Other liquefaction-related features associated with the Dixie Valley earthquake include numerous mud and silt volcanoes that formed in alluvium along the margin of the Humboldt Salt Marsh (Plate lc) (Slemmons, 1957).
North of The Bend, extensive Holocene scarps bound the west side of Dixie Meadows marsh (Plate lc). Scarp traces are commonly scallop-shaped, and the scarps formed in low-lying areas that now border the spring-fed wetlands. We interpret these paleo scarps as lateral spreads related to paleoliquefaction effects. Scarps in this area are commonly as high as 5 m (Plate lc) and are developed on young deposits that locally contain volcanic ash (Plate lc). A petrographic examination of the ash showed that the refractive index and morphology of glass shards are consistent with those of the Mazama ash (6850 yr B.P.) (Davis, 1978; SarnaWojcicki and Davis, 1991). Bell and Katzer (1987, 1990) showed that Holocene fault scarps in the piedmont area of The Bend and along much of the range front north of The Bend also post-date deposition of Mazama ash. It is therefore likely that the Holocene fault scarps and the paleo scarps related to lateral spreading on the west side of Dixie Meadows (and in other low-lying areas shown on Plate Ic) formed during the same seismic event.
Observations of Fault Dip: Evidence for Low-Angle Normal Faulting in the Southern Part of Dixie Valley
Observations of fault dip for the 1954 ruptures are few due to 40 years of scarp degradation. Nonetheless, there exist several sites where the fault dip is exposed either in alluvium or at the contact between bedrock and alluvium. Our measurements of fault dip (Plate I), combined with observations of Slemmons (1957), indicate that fault dips are generally steep, ranging from 500 to 700
, except for a large section of the Dixie Valley fault that shows evidence for a surprisingly low dip angle south of The Bend. For example, a fault line survey 0.5 km southeast of James Canyon (Fig. lIb, Plate lc) and three-point constructions suggest a low fault dip where the main fault trace is deflected across a bedrock ridge composed of Mesozoic phyllite. Here, the fault dip angle appears to range between 200 and 300 E within 65 m of the surface (i.e., the total elevation difference within the survey

774
13.6 13.3 12.0
map trace of the Dixie Valley fault at Little Box Canyon
N
map trace of the Dixie Valley fault -0.5 km south of James Canyon
10# , '8.6 i 7.'2 ,
16•0 1 5.0 1 , 1 1 1 , : a.o 1 0./6
:3.1·~ ",.1
419 4'9
5: 6.6' 7.5 8.6 9.1 9. L' --,--,----,--,-' ~,
~ .. ~ 0 25m
a
1 '
{
\ \ \
I I I!
5.7 5.5
o 50m
b
Figure 11. Fault line surveys along the Dixie Valley fault at (a) Little Box Canyon and (b) about 0.5 km southeast of James Canyon (Fig. 1, Plate lc). Survey points are shown with their respective relative elevations in meters. The fault line at Little Box Canyon (a) lies entirely within alluvium. Structural relations suggest that fault dip is about 32° E between relative elevations of 8.6 and 0.5 m. The fault line near James Canyon (b) cuts across a bedrock ridge composed of Mesozoic phyllitic rocks. Fault line elevation relations here suggest a fault dip angle between 20° and 30° E within 65 m of the surface. In both cases (a and b), the fault appears to become steeper ( ~400) at the higher elevations of the fault line (see text for discussion).
3.8
3.2 0.0
area). Structural relations similar to those near James Canyon exist along the range front between James and Brush canyons and also about 1 kIn west of Wood Canyon at the comer of The Bend (Fig. 1). In these areas, the main rupture trace also appears to have propagated into the Stillwater Range bedrock at low dip angles similar to those calculated south of James Canyon, although the fault line was not surveyed in detail at these locations. An uncertainty in this approach for estimating fault dip is that the deflections may represent abrupt corrugations on the fault, such as those in the Coyote Canyon area (meaning that three-point solutions would be invalid). However, the scarp lines noted here are deflected uphill along topographic ridges (e.g., consistent with planarlike fault geometry) while the fault trace near Coyote Canyon is deflected uphill at drainages, apparently requiring a corrugated fault geometry. The fault trace deflections in The Bend area might also be interpreted as landslide scarps, although in each case, the deflected rupture traces are continuous with and therefore appear to represent the main fault trace.
S. J. Caskey, S. G. Wesnousky, P. Zhang, and D. B. Slemmons
At East Job Canyon (Fig. 1), the range-facing and valley-facing strands of a 16-m-wide graben are well exposed in a recently down cut channel. The valley-facing strand dips 45° to 50° E in the exposure, but this fault is required to dip at a shallower angle in the subsurface to account for the development of a prominent (2-m deep, 14-m wide) graben. The range-facing fault dips 70° W. Surface constraints and subsurface modeling of the graben may be used to suggest that fault dip beneath the graben may be as low as 25° to 30°. For example, when erosion or deposition in the zone of deformation has not been excessive, the cross-sectional area of the graben trough (Fig. 12a) approximates the cross-sectional area of the space voided behind the hanging-wall block (prior to hanging-wall collapse) as it moves down-dip along a fault plane that shallows beneath the graben (Figs. 12c and 12d). Although this principle ("the graben rule") was originally put forth by Hansen (1965) to estimate the depth of failure for translatory landslides when horizontal displacement (i.e., heave) across the graben is known, it is equally viable for modeling the subsurface geometry of tectonic fault-trace grabens associated with dipping faults. Figures 12c and 12d show hypothetical subsurface geometries for different assumptions of fault-dip change (AB) at depth. Although there is no unique geometric solution, Figure 12 illustrates that, for a particular graben geometry, the depth at which the dip angle changes is inversely related to the magnitude of the change in dip. If one assumes that the width of the graben reflects the depth at which the dip angle changes, then a fault dip that shallows by 20° to 25° (Figs. 12c and 12d) is geometrically most reasonable, and such changes correspond to subsurface fault dips of 25° to 30° E. A fault-dip change (AB) of only 15° (Fig. 12e) corresponds to a subsurface dip of 35° E and is less satisfying geometrically because the graben does not appear to have formed across a broad enough zone. The fact that a subsurface fault dip of 30° or less is geometrically plausible at East Job Canyon lends support to other observations of low fault-dip angles along the Dixie Valley fault south of The Bend. Furthermore, well-developed fault-trace grabens are nearly continuous along a 15-kIn stretch of the Dixie Valley fault south of The Bend (where granite comprises the footwall) (Plate Ic). This implies that similar structural conditions, ideally suited for graben development, exist along the entire reach.
Scarp profiles along several sections of the fault north and south of Little Box Canyon (Plate Ic, Figs. 4c through 4e) exhibit very little vertical separation across prominent fault-trace grabens. Such structural relations imply that more horizontal extension (heave) than vertical displacement resulted across these ruptures. Near-surface fault dips in these areas are not known, and thus we cannot confidently model subsurface fault geometry. However, we interpret these profiles to indicate that fault-dip angle along this portion of the range front is less than 45° because slip along a fault dipping greater than 45° would result in greater vertical displacement than heave. These profiles therefore lend support to other evidence for low dip angles along this part of the fault.

Surface Faulting of the 1954 Fairview Peak (Ms 7.2) and Dixie Valley (Ms 6.8) Earthquakes, Central Nevada 775
west vertical separation east
a
b
c
d
e
-1.0 m ----_t
V' ~~
~ " '7
" 7
10mL ~ V·
o 10m
It? I
7
I I
I I
7
graben trough
foJ
~e=25°
A fault-line survey at Little Box Canyon (Figs. 10, lla, and 13), where the fault rupture projects through a thickness of about 14 m of alluvium, indicates a fault orientation of 000° 32° E between relative elevations of 8.6 and 0.5 m. The low dip angle parallels a prominent fracture set in hydrothermally altered granitic footwall rocks exposed about 25 m west of the surface rupture. At Little Box Canyon, the fracture set dips between 25° and 30° E. Elsewhere, the fractures also dip at low angles and parallel the entire portion of the sinuous range-front trace from north of Coyote Canyon northward to just south of James Canyon (Fig. 14). The lowangle fractures appear to post-date much of the alteration and earlier fractures that have been locally radiometrically dated as early Miocene (Parry et aI., 1991). However, the older alteration zone has been shown to be associated with the formation of cataclasites and forms a narrow band along
Figure 12. Geometric model for approximating the change in subsurface fault dip (,1,.8) beneath grabens along the Dixie Valley fault at East Job Canyon using the concept of the "graben rule" (Hansen, 1965). Near-surface fault dips of 50° E and 70° W were measured in the field for the east-facing and west-facing faults that define the graben, respectively. (a) Scarp profile across graben at East Job Canyon. Hachured area in (a) is the graben trough, which is defined as the area within the graben and beneath the ground-surface projection of the hanging wall from beyond the zone of deformation. (b) Prerupture geometry. Models of subsurface fault-dip change (,1,.8) of (c) 25° (d) 20° and (e) 15°. Subsurface geometries are constructed so hachured areas in (c) through (e) equal the graben trough area in (a). The hachured areas in (c) through (e) represent the space (hypothetically) voided behind the hanging-wall block (prior to hanging-wall collapse) as it moves down-dip along a shallower fault plane beneath the graben. Vertical separation across the graben is held fixed for all geometries. For simplicity, fault-dip changes are shown as angular. Curved fault models would have the effect of requiring slightly shallower subsurface fault dips (and slightly more dip slip) for a given depth to net faultdip change. The models show that subsurface faultdip changes of 20° to 25° are not unreasonable to account for the graben geometry at East Job Canyon. A fault-dip change of only 15° (e) is less satisfying geometrically because hanging-wall collapse (i.e., graben formation) appears to occur across an area that is too narrow. The suggestion of subsurface fault dips of 25° to 35° in the East Job Canyon area supports other observations of shallow fault-dip angles along the southern part of the Dixie Valley fault.
the present-day fault trace (Bruhn et aI., 1994; Parry et aI., 1991). These relations imply that the orientation of the active trace may be partly inherited from earlier deformation (Parry et ai., 1991).
Individually, the different lines of evidence for low-angle faulting in southern Dixie Valley may not be compelling. However, the collective set of observations lends strong support for the low-angle hypothesis. It is not known if the low dip along the Dixie Valley fault projects down to seismogenic depths. If so, the observations are significant since they place the southern part of the Dixie Valley fault in a select group of examples of possible active low-angle normal faults. Other possible active low-angle normal faults include the Sevier Desert "detachment" (McDonald, 1976), which has been recently refuted (Anders and Christie-Blick, 1994); the Panamint Valley fault in California (Burchfiel et aI., 1987; MIT 1985 Field Geophysics Course and Biehler, 1987); and the Santa Rita fault in Arizona (Johnson and Loy, 1992).
It is conceivable that low dips at the surface represent geometric anomalies along a generally steeper fault at depth (R. Bruhn, University of Utah, personal comm., 1994). The

776 S. J. Caskey, S. G. Wesnousky, P. Zhang, and D. B. Slemmons
Figure 13. Photograph of the 1954 Dixie Valley fault trace (see arrows) at Little Box Canyon showing the low-angle dip projection of the fault in alluvium. View is to the north. Survey of the fault trace (Fig. lla) indicates that fault dip is about 32° E. Photo taken 27 September 1995.
evidence presented for low fault dip is generally restricted to the large range-front reentrant between Little Box Canyon and The Bend, an area that is also overlapped by the piedmont fault zone. Because the piedmont fault zone merges along strike with the range-front fault both north and south of the reentrant, it is likely that the two fault zones merge at depth as well. Two possible subsurface geometries in The Bend area are then (1) the piedmont zone merges at depth with the range-front fault that maintains a shallow dip, possibly to seismogenic depths (Fig. 15a), and (2) the range front fault in the area of the reentrant has an anti-listric geometry and merges with a steeper piedmont fault at depth (Fig. l5b). In this scenario, numerous surface breaks lying between the range-front fault and the main part of the piedmont fault zone may represent "bending moment faults" resulting from slip along a convex fault at depth (Fig. l5b). From geophysical considerations, seismic refraction data in the vicinity of Little Box Canyon were previously interpreted to indicate the existence of multiple, steeply dipping (55° to 70°) fault planes (Herring, 1967; Meister, 1967). However, the data also permit an interpretation of a single fault plane with a dip that is consistent with geologic observations (25° to 30°). Detailed gravity data and depth to bedrock calculations in this area (Schaefer, 1983) are also consistent with a moderate «35°) fault dip for much of the southern part of the Dixie Valley fault if the bedrock-alluvium contact interpreted at depth coincides with the Dixie Valley fault.
Fault dip on the Dixie Valley fault appears to be relatively steep north of The Bend (Plate lc). Approximately 2.5 km from the north end of the 1954 ruptures, an exhumed and highly striated bedrock fault surface is well exposed at the contact with alluvium (Plate lc). At the contact, the fault dips about 40° E but becomes steeper to about 50° 5 to 10 m above the contact. Small fissures in alluvium were mapped several meters from this contact, suggesting that the fault surface, in part, represents the active trace of the fault. About 200 m to the south, the 1954 fault trace is well exposed in an exploratory trench, where the fault is oriented 025° 55° E in alluvium (Plate lc). Farther north in Dixie Valley, subsurface fault dip is constrained at about 50° E from geophysical data (Okaya and Thompson, 1985).
Figure 16 shows a schematic three-dimensional model of the Fairview Peak and Dixie Valley rupture system. Although the exact details of subsurface fault geometry are uncertain, the model illustrates the gross configuration of the fault system and underscores the importance of the westdipping faults (i.e., the West Gate, Gold King, and Louderback Mountains faults) as a structural and probable mechanicallink between the more dominant east-dipping Fairview and Dixie Valley faults. The west-dipping faults must intersect with the east-dipping structures in the uppermost 5 to 10 km of the crust. Right-lateral shear is traceable at the surface as far north as the Louderback Mountains fault, and it appears to have been transferred northward from the Fairview Peak area along this intersecting system of dipping faults.

Surface Faulting of the 1954 Fairview Peak (Ms 7.2) and Dixie Valley (Ms 6.8) Earthquakes, Central Nevada 777
Job Peak
Figure 14. Oblique photo of the Stillwater Range and Dixie Valley fault scarps in the general area south of The Bend. View is toward the south. The prominent salient is Little Box Canyon. The photo illustrates the generally laid-back geometry of the range-front escarpment that supports the hypothesis of a low-angle fault geometry along this reach. The slope of the escarpment is locally parallel to a prominent low-angle fracture set that parallels the range front where granitic rocks comprise the footwall block. On the photo, this is visible in the area of the salient at Little Box Canyon. 1954 surface breaks are visible along the base of compound paleoscarps in the piedmont area. (Photo from John Bell, Nevada Bureau of Mines and Geology; photo taken in May 1981.)
Net Extension Directions
We determined co-seismic slip azimuths at 19 sites or reaches along the 1954 ruptures (Table 2). In special instances, severed tree roots across the fault are still preserved and provide a direct measure of co-seismic slip vectors. Other ideal indicators of extension direction such as slickensides and fault grooves are no longer preserved on scarp faces. We therefore estimate slip azimuths by resolving the ratio of horizontal-to-vertical slip (H:V) on the faults, using the observed fault strike and an assumed reasonable range of fault dip angles. In the case of the southern part of the Dixie Valley fault, the direction of extension was inferred from combining all observations of both right- and left-lateral shear (previously discussed) (Fig. 9).
Our estimates of slip azimuth for the entire 1954 rupture trace (summarized in Table 2 and in Fig. 17) indicate that extension directions across the 1954 ruptures trend predominantly northwest to west-northwest. The more westerly
trends correspond to fault reaches where field evidence for significant lateral offset is lacking. Three slip azimuths determined within 3.5 km south of Fairview Peak (330°, 323°, and 335°) are all in close agreement (± 6°) even though fault strike varies by 50° at these locations, which fall in the general area of maximum slip. In contrast, extension directions in the Stingaree Valley area show as much as 80° of variation. This reflects strong right-lateral components of slip on both northwest and northeast-striking reaches of the Fairview and West Gate faults. The large variations in extension direction may reflect a complex displacement field where the Fairview, Louderback Mountains, and West Gate faults converge.
The inferred slip azimuth along the Dixie Valley fault north of The Bend (304°) is consistent with a 305° direction of extension determined for the longer-term history of this part of the fault from fault exposures showing grooves and striations (Thompson and Burke, 1973). The 274° ± 15°

778
Dixie Valley range front "Bending moment"
faults(?) fault ~
~ ~ j;J Piedmont
fault
Figure 15. Schematic cross sections across the Dixie Valley fault in The Bend area show two-possible subsurface structural relations between the rangefront fault that appears to dip at a shallow angle near the surface and the piedmont fault: (a) the piedmont zone merges at depth with the range-front fault that maintains a shallow dip, possibly to seismogenic depths; (b) the range-front fault (shown with an antilistric geometry) merges with a steeper piedmont fault at depth. In the latter scenario, the complex pattern of scarps mapped between the range-front fault and the main part of the piedmont fault could represent "bending moment" faults reflecting hanging-wail strain as the block moves over a concave fault at depth.
extension direction determined south of The Bend (Figs. 9 and 17) is significantly more westerly than that north of The Bend. It is possible that the more westerly slip azimuth for the southern part of the Dixie Valley fault may be explained by regional strain partitioning (Fig. 18). The 1954 Rainbow Mountain and Stillwater earthquakes show right-oblique, northwest-directed motion (Doser, 1986; Caskey, unpublished data), and surface ruptures from these events overlap with the southern part of the Dixie Valley fault ruptures. Hence, when combined with the 1954 Dixie Valley offsets, the net extension direction across the entire zone may be more similar to that north of The Bend. The overall change from northwest extension along the Fairview Peak ruptures
S. J. Caskey, S. G. Wesnousky, P. Zhang, and D. B. Slemmons
Gold King fault
II Louderback Mtns fault
II WestGate
fault
Figure 16. Schematic block diagram of the geometry of the December 1954 fault rupture system (with the exception of the Phillips Wash fault trace). Bold lines represent surface rupture traces. Bold arrows indicate the general direction of motion of hanging-wall blocks. Strike and dip symbols are shown for reference.
to west-northwest extension north of The Bend may reflect a transition from principally northwest-oriented strike-slip displacement in the Walker Lane (to the south) to northeaststriking fault normal extension within the interior of the Basin and Range.
Bedrock Influence on Fault-Trace Geometry, Rupture Style, and Rupture Termination
Observations along both the Fairview and Dixie Valley faults indicate that the major lithologic changes in footwall bedrock mark the boundaries of large salients and reentrants. Two clear examples of this exist along the range-front salient in the Bell Canyon area of the Fairview fault and in The

Surface Faulting of the 1954 Fairview Peak (Ms 7.2) and Dixie Valley (Ms 6.8) Earthquakes, Central Nevada 779
Table 2 Slip Azimuths for the 1954 Fairview Peak and Dixie Valley Earthquake Ruptures
Location
Fairview fault Bell Flat range-front trace Bell Flat 3.5 km south of Fairview Peak 2.8 km south of Fairview Peak 1.8 km south of Fairview Peak 1.0 km ESE of Fairview Peak From ~ 1.0 to 2.0 km south of U.S. Highway 50 Vicinity of Highway 50 East side of Chalk Mountain Northeast side of Chalk Mountain
Louderback Mountains fault
Gold King fault
West Gate fault Vicinity of Highway 50 From 2.5 to 4.0 km north of U.S. Highway 50 From 4.5 to 7.0 km north of U.S. Highway 50 ~5 km south of Wonder
Phillips Wash fault
Dixie Valley fault (south of the Bend)
(north of the Bend)
Slip azimuth
~297°
326°_346° 330° 323° 335° 305°
310°_330° 345°_005° 025°-035° 324°_336°
324°-335°
~283°
353°_003° 298°-316° 003°-016° ~286°
027"-039°
274° ± 15°
Bend area of the Dixie Valley fault. Additionally, those changes in footwall bedrock along the Dixie Valley fault also correspond to differences in surface rupture style. We do not observe systematic relations between slip variation and aspects of fault -trace geometry, such as salients or reentrants. Likewise, slip variation or earthquake endpoints do not generally appear to have been influenced by changes in bedrock type. One exception to this exists at the south end of the Dixie Valley rupture trace. Here, the Dixie Valley surface ruptures terminate to the south within a few kilometers of a geometric segment boundary of the Dixie Valley fault (Zhang et aI., 1991). The segment boundary is represented by a 6-km right step-over south of Eleven Mile Canyon (Fig. 1). The step-over corresponds to a change in footwall bedrock from Tertiary volcanic rocks of the Stillwater caldera complex on the north to Mesozoic metamorphic and intrusive rocks, Miocene basalts, and younger sedimentary rocks on the south (John, 1995; Page, 1965; Wilden and Speed, 1974).
The northern extent of the fault-trace salient in the Bell Canyon area corresponds to the eastward projection of a west-northwest-striking bedrock fault (Plate la) (Wilden and Speed, 1974). Recent mapping by Christopher Henry (Nevada Bureau of Mines and Geology, work in progress) indicates that this fault formed during resurgence of a Miocene caldera and separates thick intracaldera ash-flow tuff, up-
Criterion Used (average fault strike = 0; fault
dip = A; horizontal-to-vertical slip ratio = H:V)
orthogonal to average fault strike (8 = 027"), (H: V ~ 0) orthogonal to strike of prominent fissures (8 = 057°-076°) severed Juniper tree root (8 = 342°) severed Juniper tree root (8 = 032°) 8 = 005°, .i = 50° E, H:V ~3:2 severed Juniper tree root (8 = 055°) 8 = 350°,.i = 50°_70° E, H:V = 1 (minimum) 8 = 025°,.i = 50°-70° E, H:V = 1 (minimum) 8 = 055°,.i = 60°-70° E, H:V = 1 8 = 346°, .i = 50°_70° E, H:V = 2
8 = 340°,.i = 60°-80° W, H:V = 2:1 (minimum)
orthogonal to average fault strike (8 = 013°), (H: V ~O)
8 = 010°, .i = 50°-70° W, H:V = 3:1 8 = 337°, .i = 50°_70° W, H:V = 6:5 (minimum) 8 = 026°, .i = 50°_70° W, H:V = 2:1 orthogonal to average fault strike (8 = 016°), H:V ~O
8 = 027°, .i = 60°_90°, H:V = 8:3
direction consistent with all observations of both right- and left-lateral sense of shear (see Fig. 9) orthogonal to average fault strike (8 = 034°), H:V ~O
lifted on the north, from thinner tuff and breccia on the south. The caldera essentially constitutes the Fairview Peak structural block that has been tilted westward. The southern edge of the salient at Bell Canyon corresponds to the topographic wall of the Miocene caldera that separates the Tertiary volcanic rocks from less-competent Mesozoic schists and phyllites to the south (Wilden and Speed, 1974). The salient is therefore bound by distinct lithologic changes or structural breaks that show, in at least one case, a significant competency contrast.
Along the Dixie Valley fault south of The Bend, two distinct rock types comprise the footwall block. Tertiary granitic rocks are exposed in the footwall for a distance of nearly 15 km, from Coyote Canyon to just south of James Canyon (Plate lc) (Page, 1965; Wilden and Speed, 1974). To the north, Mesozoic pelitic rocks constitute the footwall in the area of The Bend. These pelitic rocks are less competent than granitic rocks to the south or Tertiary volcanic rocks exposed in the footwall north of The Bend. Where the footwall is composed of the granitic rocks, the rupture trace is characterized by a sinuous but generally smooth trace accompanied by nearly continuous and well-developed grabens (e.g., Fig. 10) (Plate lc). The grabens average 6 to 18-m wide and 2- to 4-m deep. Where the pelitic rocks comprise the footwall in The Bend area, grabens are only localized features. Instead, the fault trace exhibits complex patterns of

780
o
N
~ t' ~, ,
10km
Figure 17. Slip azimuths determined along the Fairview Peak and Dixie Valley earthquake ruptures. See Table 2 and text for discussion. DVF, Dixie Valley fault; FF, Fairview fault; GKF, Gold King fault; LMF, Louderback Mountains fault; PWF, Phillips Wash fault zone (Gabbs Valley); WGF, West Gate fault.
"T1 "T1
bifurcating and overlapping scarps very uncharacteristic of those elsewhere along the fault trace. Hence, rupture style appears to be influenced by footwall rock type. In addition, the rupture trace climbs well into the range at three locations in The Bend area. At two of these locations, Mesozoic strata can be correlated across the surface breaks demonstrating that new fault strands formed in bedrock in 1954 (Plate lc). The large embayment in the range-front trace directly corresponds to where the less-competent pelitic rocks make up the footwall block. From these observations, it appears that the fault shows a tendency to propagate (or refract) into the relatively weak bedrock in The Bend area. Perhaps the faulttrace reentrant defined by The Bend is, in part, the result of many such repeated refractions as successive fault ruptures have carved out pieces of the footwall. A similar though less dramatic range-front reentrant, along the east side of the Clan Alpine Range, 40 km to the east, is also restricted to the mapped location of the same Mesozoic map unit (Stewart and Carlson, 1978), suggesting similar lithologic influence on fault-trace geometry.
S. J. Caskey, S. G. Wesnousky, P. Zhang, and D. B. Slemmons
Right-oblique slip
J1
0 I 0
~ ~ ~ .~
~
N
I 10 km ,
10 mi
Fault-normal extension
Rightoblique slip
Figure 18. Schematic surface rupture map for the 1954 Rainbow Mountain, Stillwater, Fairview Peak, and Dixie Valley earthquakes shows that east-west extension along the southern part of the Dixie Valley fault may by partitioned regionally between pure dipslip on the Dixie Valley fault and right-oblique slip on the Rainbow Mountain fault. Rainbow Mountain fault ruptures modified after Bell (1984).
Reactivation of Preexisting Faults
We observe that the 1954 surface ruptures generally follow preexisting faults. At least two exceptions exist along the Dixie Valley fault (Plate lc) and were briefly noted in the previous section. Prehistoric fault scarps on alluvium are shown on Plate 1. Many of these fault scarps were reactivated in 1954, and in such cases, these surface ruptures are marked on Plate 1 as compound scarps.
Scarps on Alluvium
The 1954 surface breaks formed along preexisting Holocene scarps only along portions of the Dixie Valley fault. Scarps of mid- to late-Holocene age (Bell and Katzer, 1990; Pearthree et aI., 1986; Pearthree and Wallace, 1988) are discontinuous for a distance of about 40 km along the rangefront portion of the fault north of The Bend and in the pied-

Surface Faulting of the 1954 Fairview Peak (Ms 7.2) and Dixie Valley (Ms 6.8) Earthquakes, Central Nevada 781
mont area of The Bend (Bell and Katzer, 1987; Wallace and Whitney, 1984). Nearly all of the southernmost 20 km of these scarps were reactivated during the 1954 earthquake, although 1954 vertical displacements along these scarps were much smaller (generally less than 0.5 m) than the Holocene vertical displacements that average between 1 and 2 m. The preexisting Holocene scarps, where observed along the 1954 trace, appear to represent a single, faulting event, although large multiple-event scarps (showing both Holocene and late-Pleistocene displacements) are preserved locally in the piedmont area of The Bend (Plate 1c). Wallace and Whitney (1984) also interpreted Holocene scarps in the piedmont area near East Lee Canyon, and some of these scarps are also associated with small 1954 breaks (Plate 1c). Late Pleistocene scarps are visible at several locations along the range-front ruptures south of The Bend. There is no evidence for preexisting Holocene faulting along this reach (Plate 1c). Surface ruptures along preexisting scarps on late Pleistocene alluvium are also well expressed in the piedmont area between the Dixie Valley and Louderback Mountains faults near Eleven Mile Wash and along portions of the Fairview and Louderback Mountains faults, and these are noted on Plate 1.
Scarps on Bedrock
Surface ruptures commonly broke into bedrock along preexisting faults that juxtapose different rock types. The West Gate fault ruptured along faults in bedrock for a distance of 2 km just north of U.S. Highway 50. The northern part of the Fairview fault ruptures climbs nearly 200 m to near the crest of Chalk Mountain where the fault juxtaposes Tertiary intrusive rocks on the west and Mesozoic carbonates on the east (Wilden and Speed, 1974). East of Fairview Peak, the rupture trace climbs over 50 m onto the steep bedrock escarpment at several locations. Although there are no obvious preexisting faults in these areas, some of these breaks may be secondary (i.e., surficial) features. The Gold King fault ruptures lie almost entirely along preexisting bedrock faults. Much of Gold King fault is suspected of also breaking during the 1903(?) Wonder, Nevada, earthquake (Slemmons et ai., 1959). Although no compelling evidence for recent pre-1954 surface breaks along the Gold King fault was observed in the field during this study, a number of fresh pre-1954 scarps were previously observed in the Geiger Gap area near the north end of the 1954 Gold King ruptures (Fig. 1 and Plate la) (Slemmons, unpublished data). The Phillips Wash ruptures disrupt rolling and dissected erosional surfaces developed on weakly resistant and folded Miocene lacustrine deposits (Ekren and Byers, 1986). With the exception of a l-km section of the trace near the middle part of the rupture zone (Plate Ib), the Phillips Wash ruptures did not form along obvious preexisting fault lines. However, previous surface breaks may not be well preserved in these easily eroded deposits.
Long-Term Style of Faulting along the Fairview Fault
With regard to the longer-term style of faulting, new detailed bedrock mapping in the Fairview Peak area (Christopher Henry, Nevada Bureau of Mines and Geology, work in progress) has identified a series of three petrographically distinct, east-west-striking, subvertical dikes of early Miocene age that can be correlated across the Fairview fault several kilometers south of Fairview Peak and in the vicinity of Bell Mountain (Plate 1c, Fig. 19). Correlation of the projections of the dikes require that there has been little net right-lateral offset across the Fairview fault, though uncertainties in the exact projections permit a modest amount of lateral offset (up to several hundred meters). Vertical displacement across the fault is likely about 1 km or more (C. Henry, personal comm.). Hence, the large component of right slip observed for the 1954 earthquake does not appear to mimic the longer-term slip history of the fault. It is possible that the large 1954 strike-slip component along the Fairview fault may reflect a relatively recent change in the style of slip from principally normal to normal-right oblique.
Discussion
Comparisons of Geologic, Seismological, and Geodetic Data
Fault parameters determined from studies of geodetic and seismic data (Table 3) for faults ruptured during the Fairview Peak and Dixie Valley earthquakes are generally in good agreement with the geologic data (Table 1). Geologic, seismologic, and geodetic observations all reflect normal-rightoblique displacements on faults ruptured during the Fairview Peak earthquake and dominantly dip-slip motion on the Dixie Valley fault. Similarly, net displacements and moments from the geodetic models fall between the maximum and average geologic values. Slip azimuths for the Fairview fault from both dislocation (Savage and Hastie, 1969) and body-wave models (Doser, 1986) are very similar to three independent geologic slip azimuths determined in the area within 3.5 km south of Fairview Peak (323° to 335°) in the general area of maximum surface displacement. Horizontal movements along the Dixie Valley fault are geodetic ally constrained only along the southernmost portion of the rupture trace (Whitten, 1957). Here the geodetic slip azimuth of 264° falls within the range inferred geologically for the fault south of The Bend (274° ± 15°). Similarly, vertical displacement across the Dixie Valley fault is constrained only in the area ofIXL Canyon where surveyed benchmarks lie on both sides of the fault (Whitten, 1957). Here, vertical displacement from dislocation modeling (2.4 m) is essentially identical to field measurements of vertical separations of 2.5 m (Fig. 5b). Fault dip angle along the Dixie Valley fault determined from dislocation models (60° E) is poorly constrained from the sparse leveling data and therefore does not provide an adequate test for the hypothesis of a low dip along the southern part of the fault. Finally, the range of moments and moment magnitudes

782
<
'" ..). v '" . "' . < V"7 -< V - <\~;;t'\< ... '7
V<", ~.: V<", :N! v<"' ~.: ! ~.: v<"'
vt"~v'{ \/,"..\v74. -l@~ -l,.. ~j\
< .... "7 < I < V"7 < v~ v "..). v '{ \I '"..).
..), " -l f', -l
< .. 7
V ~-l
° iii iiiiiiiiiiiiiiiiiiiiiiiiiiiiiiiiiiiOc·5=====:::=:j1, Mile
O~iiiiiiiiiiiiiiiiilOe.5===j1 Kilometer
Figure 19. Geologic map showing subvertical east-west-striking felsic dikes in the vicinity of Bell Mountain south of Fairview Peak and the 1954 rupture trace along the Fairview fault (see Fig. 1 for location). The three mineralogically distinct dikes that correlate across alluvium and the Fairview fault and allow for little net right-lateral offset along the fault (Christopher Henry, Nevada Bureau of Mines and Geology, work in progress). Net vertical displacement along the Fairview fault is on the order of 1 km. The relations indicate that the large right-lateral component of offset observed along the 1954 rupture trace does not mimic the long-term slip history along the Fairview fault. Qa recent alluvium; Qf, Quaternary alluvial fan deposits; Qls, Quaternary landslide deposit; Tifqb, early Miocene (~18 Ma) felsic dike intrusions with quartz and biotite phenocrysts; Tifbh, early Miocene (18.8 Ma) felsic dike intrusions with biotite and hornblende phenocrysts; Tv, undifferentiated early Miocene (19.2 Ma) volcanic and volcanic clastic rocks. Heavy dashed lines are roads. Map modified after and rock ages from Christopher Henry (Nevada Bureau of Mines and Geology, work in progress).
detennined geologically for the Fairview Peak (Mw = 7.0 to 7.3) and Dixie Valley (M w = 6.9 to 7.3) earthquakes (Table 1) are consistent with those commonly reported for these events from seismological data [e.g., Mw = 7.2 and 6.9 (Wells and Coppersmith, 1994)], respectively, and are also consistent with our assessment of which fault ruptures are associated with each of the two earthquakes.
S. J. Caskey, S. G. Wesnousky, P. Zhang, and D. B. Slemmons
The complex nature of the Fairview Peak and Dixie Valley earthquakes is manifested not only by the complicated distribution of surface scarps and displacements but also by seismological and geodetic analyses. For example, teleseismic body-wave modeling (Doser, 1986) shows these 1954 events to be characterized by multiple source-time functions and bilateral rupturing. Additionally, focal mechanisms (Doser, 1986; Romney, 1957) indicate a preferred first-motion nodal plane striking 350° for the Fairview Peak event that is significantly oblique to the average surface strike of the Fairview fault (015°). Only the surface strike of the Louderback Mountains fault (345°) and a portion of the southern part of the West Gate fault are close to the strike of the preferred nodal plane, although these faults dip west. Interestingly, the nearby 1954 Rainbow Mountain and 1932 Cedar Mountain earthquakes also produced surface rupture patterns that differ in strike from first-motion nodal planes (Doser, 1986, 1988; Gianella and Callaghan, 1933; Tocher, 1956). Body waves from these events have also been modeled as multiple source-time functions (Doser, 1986, 1988).
Microearthquake studies in the Fairview Peak area (Ryall and Malone, 1971; Stauder and Ryall, 1967) show that most earthquake foci between about Fairview Peak and Slate Mountain fallon a plane striking 349° and dipping 62° E, which agrees well with the first-motion data. Most of the microearthquake focal depths are between 10 and 15 km. These observations together with the discrepancy between the surface strike and the nodal plane strike (mentioned above) allow the possibility that either the Fairview fault changes orientation at depth or a separate, concealed, northwest-striking fault exists at depth in the vicinity of Fairview Peak.
Dislocation modeling (Savage and Hastie, 1969) of geodetic data (Whitten, 1957) in the Fairview Peak area suggests a fault geometry that agrees with the surface expression of the Fairview fault. Snay et al. (1985) reanalyzed the geodetic data to estimate fault parameters associated with the entire 1954 earthquake sequence. Although the Snay et al. (1985) models did not adequately resolve the displacement field in the Rainbow Mountain area, their models suggest that some displacement east of the Fairview Peak area occurred on a concealed 347° to 359° striking plane at depths between 2 and 20 km, which is consistent with both firstmotion and microearthquake studies. The mismatch between geodetic displacements and dislocation models in the Rainbow Mountain area led Snay et al. (1985) to suggest that coseismic magma movements might be invoked to explain the apparent discrepancies. Doser (1986) also suggested that the multiple source-time functions that best describe the largest events of the 1954 sequence might be explained by co-seismic magma movements. Alternatively, the multiple sourcetime model for the Fairview Peak event may reflect moment release on disparate fault structures because several different faults ruptured during this event. The distinct double-peaked slip distribution for the Dixie Valley surface ruptures (Fig. 5b) may be the result of two distinct slip subevents on the

Surface Faulting of the 1954 Fairview Peak (Ms 7.2) and Dixie Valley (Ms 6.8) Earthquakes, Central Nevada 783
Table 3 Fault Characteristics from Geodetic and Seismic Information
Fault
Geodetic DVF (1)
FF (2) FF (1)
(shallow) FF (1) (deep) GKF-
LMF
WGF (1) FP event
totals (1)
Seismic DV event (3) FP event (4)
Rupture Length
(kms)
42 50 34
58
23
18 (36) 36 (72)
Strike
006° 009° 012°
34T
OOT
350° 350°
Dip
60° E 57° E 63° E
59° E
700W
50° E 60° E
Depth (km)
15 8 5
2-20
5
12 ± 3 15 ± 3
VD (m)
2.4 2.3 2.3
1.6
0.5
SS u (m) (m)
-0.3 2.8 2.9 3.9 3.6 4.4
0.8 2.0
l.3 1.4
Slip Rake Azimuth
-84° 264° -l37° 342° -144° 354°
-1l3° 297°
-158° 359°
- 90° ± 20° 260° ± 29° - 160° ± 5° 340° ± 3°
M, (X lO26
dyne em)
5.3 4.7 2.2
6.3
0.5
9.0
2.9 6.4
7.1
7.3
6.9 7.2
Abbreviations: VD (vertical displacement); SS (strike-slip displacement); u (slip resolved on dipping fault; see Table 1); Mo (moment) is calculated from the relationship of Aki and Richards (1980) (see Table 1); Mw (moment magnitude) from the relationship of Hanks and Kanamori (1979) (see Table 1); DVF, Dixie Valley fault; FF, Fairview fault; GKF, Gold King fault; LMF, Louderback Mountains fault; WGF, West Gate fault; FP, Fairview Peak; DV, Dixie Valley. FP event totals assume that FF, GKF, LMF, and WGF all ruptured during the FP event. Rupture lengths in parentheses indicate lengths for bilateral ruptures. Depths from geodetic data are given as fault widths. Negative rake angles are measured clockwise from horizontal as viewed from the hangingwall block; References (in parentheses): (1) dislocation models of Snay et al. (1985) indicating both deep and shallow models for the FF; (2) dislocation model of Savage and Hastie (1969); (3) parameters based on two-subevent model (Doser, 1986); (4) parameters based on the subevent model (Doser, 1986). Seismic moments and moment magnitudes for seismic data are from Wells and Coppersmith (1994).
Dixie Valley fault, as suggested by the source-time model of Doser (1986).
Comparisons to Other Historical Basin and Range Normal Fault Surface Ruptures
A comparison of slip distributions for other well-studied historical normal fault surface ruptures (Fig. 20a) shows features generally similar to all of the fault traces. All of the slip distributions show large along-strike variability to the measured surface offset with distinct slip maxima at one or two central locations. The Hebgen Lake event shows an additional area of high slip near one end of the rupture. Average and maximum surface displacements for the Basin and Range earthquakes range between 1.1 and 3.3 m and 3.5 and 6.7 m, respectively (Table 4). In general, maximum surface displacement increases with rupture length for the historical events (Fig. 20b). However, the Hebgen Lake event appears to show surprisingly large average and maximum surface offsets for its relatively short length. The relation between maximum slip and rupture length for the historical events is consistent with previous such observations made from larger data sets based generally on average offsets (Scholtz, 1982; Scholtz et ai., 1993). We also note that for the largest events (Ms > 7), moments derived geologically from maximum surface displacements compare well with those determined seismologically. Average displacements are not available for all earthquakes listed in Table 4. For the largest events (Ms > 7), geologic moments and corresponding magnitudes derived from average displacements tend to be considerably
smaller than those from seismological data. For the Dixie Valley event (Ms = 6.8), they are consistent. The generally closer agreement between moments and magnitudes derived from maximum offsets and those determined seismologically is consistent with observations of Thatcher and Bonilla (1989) who showed that even the maximum observed surface slip on a fault is usually less than slip estimated geodetically. This is because slip along a fault at the surface is seldom fully representative of slip at seismogenic depths, which is probably more closely estimated from geodetic data.
Conclusions
Forty years after formation, remarkable preservation of the Fairview Peak and Dixie Valley surface ruptures has allowed us to examine the style of offsets and to construct detailed slip distributions and maps for the 1954 earthquake sequence. Our observations document principally normalright-oblique movements on faults associated with the Fairview Peak event and fault-normal displacements on the Dixie Valley fault to the north. Likewise, net slip vector trends show a change from generally northwest along the Fairview Peak ruptures to west and west-northwest on the Dixie Valley fault. The change reflects a transition from dominantly northwest-oriented dextral shear in the Walker Lane (to the south) to northeast-striking normal faulting in the interior of the Basin and Range. A more westerly slip vector trend determined for the southern part of the Dixie

784
A
S.1. Caskey, S. G. Wesnousky, P. Zhang, and D. B. Slemmons
6 B 4
HL. ip'/ FP.
2 17 August 1959 Hebgen Lake (Ms=7.5)
o ------------------------------------- : BP. . DV
o 10 15 20 25 30
RM FS
10 20 30 40 50 60
o 10 15 20 25 30 35 Surface rupture length (Ian)
3 ~6 December 1954 2 Dixie Valley (Ms=6.8)
~ ~----- -----------------iii
o 5 10 15 20 25 30 35 40 45 50
6 03 October 1915 Pleasant
4 Valley (Ms=7.7)
---------~ 0
4
3
0
10 20 30 40 50
",~ Strike slip /'--... Vertical separation
---------~
10 20 30 40 50
Distance along strike (kilometers)
Figure 20. (a) Slip distributions for historical normal and normal-oblique surface ruptures in the Basin and Range Province showing measurements of vertical separation and lateral offset versus distance along line of average strike. Plots are shown at the same vertical and horizontal scale for comparison. Borah Peak and Pleasant Valley plots are modified from Crone et ai. (1987) and Wallace (1984b), respectively. Data for Hebgen Lake plot are from Witkind (1964). Data for the Fairview Peak event are projected onto the line of average strike for the Fairview fault (Fig. 4a). Right-lateral slip function for the Fairview Peak event is shown dashed and shaded beneath curve. Note that although surface offset for Hebgen Lake, Borah Peak, and Pleasant Valley are reported as being vertical displacements, they are generally measurements of vertical separations. (b) Plot of maximum surface offset versus surface rupture length for historical normal and normal-oblique surface ruptures in the Basin and Range Province (see Table 4 for data and references). For the Hebgen Lake earthquake, an 8-km overlap of the major rupture strands is included in the length (34 km). BP, Borah Peak; DV, Dixie Valley; FP, Fairview Peak; FS, Fort Sage; HL, Hebgen Lake; PV, Pleasant Valley; RM, Rainbow Mountain; SN, Sonora earthquakes.
60
60
,SN
; ... __ ......... -,:
-
70 80
70
Valley fault may be explained by regional strain partitioning, whereby slip on the southern reach combined with northwest-directed slip on the 1954 Rainbow Mountain fault ruptures results in an extension direction more similar to that on the Fairview fault to the south or the Dixie Valley fault north of The Bend. Correlation of three subvertical igneous dikes across the Fairview fault in the Fairview Peak area requires that there has been little net lateral offset across the
fault and indicates that the large component of right slip observed for the 1954 Fairview fault ruptures does not mimic the long-term slip history of the fault.
Surface ruptures occurred on six different faults during these two large events and therefore provide a historic example of multiple triggered fault ruptures. Three of the faults, the west-dipping West Gate, Louderback Mountains, and Gold King faults, overlap along strike with, and appear

Surface Faulting of the 1954 Fairview Peak (Ms 7.2) and Dixie Valley (Ms 6.8) Earthquakes, Central Nevada 785
Table 4 Selected Fault Parameters for Historical Normal and Normal-Oblique Surface Rupturing Earthquakes of the Basin and Range Province
Surface Rupture Mg (avg) Mg (max) ~ Length Slip u avg u_, X 1026 X 1026 X 1026
Event (kms) Type (m) (m) dyn-cm dyn-cm Mf, (avg) Mf, (max) dyn-cm M~ Ms
1887 Sonora 75 N 1.9(2.2) 5.1(5.9) 8.6 23.0 7.3 7.5 na 7.4 1915 Pleasant Valley 61(54) N 1.9(2.2) 5.8(6.7) 6.2 18.8 7.2 7.5 na 7.7 1954 Rainbow Mtn 18 RL-N na 1.0 0.9 6.6 0.2 6.2 6.3 1954 Fairview Peak 64 RL-N (1.1)* (5.3) 4.0t l1.4t 7.0 7.3 6.4 7.2 7.2 1954 Dixie Valley 46(42) N (1.2) (3.7) 2.9 9.0 6.9 7.3 2.9 6.9 6.8 1956 Fort Sage 10 N na 0.6 0.3 6.3 na 5.6 1959 Hebgen Lake 26(34) N 2.9(3.3) 5.5(6.4) 5.8 11.3 7.1 7.3 10.3 7.3 7.5 1983 Borab Peak 34 LL-N 0.9(1.2) 2.7(3.5) 2.4 7.0 6.9 7.2 3.5 7.0 7.3
Abbreviations: Slip type-N (normal slip), RL-N (normal-right-oblique slip); LL-N (normal-left-oblique slip); u.vg (average surface offsets) are determined from measuring the area under the slip curves (Fig. 20a) and dividing by the fault length; Urn• x (maximum surface offsets). Surface offsets not in parentheses are vertical offsets. Those in parentheses are resolved on dipping planes (see Table I), and these resolved offsets are used in moment calculations. Fault dips of 600 are assumed, except for the Dixie Valley [500 dip, the maximum estimate (Table I)], the Rainbow Mountain [700 dip, (Doser, 1986)], and Borab Peak events [500 dip (Doser and Smith, 1985)].
Geologic moments [M,; (avg) and M~ (max)] calculated using the relation of Aki and Richards (1980) (see Table I) for average and maximum surface offsets, respectively, and are calculated assuming 15-km depths (except for the Borab Peak event [16-km depth (Doser and Smith, 1985)] and the same fault dips used for the resolved offsets. Moment magnitudes from geologic data [M~ (avg) and ~ (max)] are calculated from the relation of Hanks and Kanamori (1979) (see Table I). Seismic moments (M~), corresponding moment magnitudes (M~), and surface-wave magnitudes (Ms) taken from Abe (1981); Bonilla et al. (1984), Lienkaemper (1984), Tanimoto and Kanamori (1986), and Wells and Coppersmith (1994).
* Average resolved slip for all faults ruptured during the Fairview Peak event. tBecause individual faults overlap along strike, moments were calculated for each fault individually and then summed (see Table I). Surface rupture
lengths are given as end-to-end rupture lengths. Length values in parentheses take into account 7- and 4-km gaps in the rupture traces of the Pleasant Valley and Dixie Valley earthquakes, respectively, and an 8-km overlap of the main rupture strands for the Hebgen Lake earthquake; average and maximum geologic moments for these events were calculated using these values. Na indicates that data is not available. References for surface faulting characteristics: (Crone et aI., 1987; Gianella and Callaghan, 1934; Herd and McMasters, 1982; Tocher, 1959; Wallace, 1984; Witkind, 1964; and (for Rainbow Mountain fault slip data) Caskey (unpublished data)).
to form a structural linkage between, the more dominant east-dipping ruptures along the Fairview and Dixie Valley faults. Although the Fairview and Dixie Valley fault ruptures account for most of the moment release from the two earthquakes, the west-dipping faults likely played an important role in the transfer of stress and triggering of the Dixie Valley event 4 min and 20 sec after the FairView Peak earthquake. Curiously, distinct right-stepping scarp patterns along the Phillips Wash fault in the northern part of Gabbs Valley suggest a component of left-lateral offset, even though this fault is subparallel to right-oblique ruptures to the north. The observation is consistent with a previous interpretation of longer-term left-lateral offset along the Phillips Wash fault (Ekren and Byers, 1986). In this same area, previously unrecognized, yet recent scarps along the east side of the Monte Cristo Mountains also parallel the Phillips Wash fault and show right-oblique motion, but these scarps predate the 1954 sequence. It is possible that these scarps are related to the right-lateral 1932 Cedar Mountain earthquake. If so, then this extends the previous estimates of total rupture length for 1932 Cedar Mountain earthquake by about 15 kID (to a total length of75 kID) and implies that the 1932 and 1954 ruptures overlap spatially by about 13.5 kID.
The resulting slip distributions for the Fairview and Dixie Valley faults show multiple areas of local slip maxima and minima, which appear to reflect first-order along-strike
variations in surface offset. The complicated distribution of slip and the simultaneous rupture of mUltiple faults during the Fairview Peak event is consistent with prior seismological interpretations (Doser, 1986) that the waveforms of the two events may each be explained by the sequential rupture of distinct subevents. No consistent correlation between local maxima and minima on the slip distributions and fault geometry appears to exist. For example, local slip minima exist along major range-front salients on the Fairview and Dixie Valley faults, whereas local slip maxima correspond to salients on the Fairview and West Gate faults.
The character of footwall bedrock has influenced the long-term structural development of large salients and reentrants along the Fairview and Dixie Valley faults as well as rupture style along the southern part of the Dixie Valley fault. Well-developed and nearly continuous fault-trace grabens formed along the Dixie Valley fault where the footwall is composed of Tertiary granitic rocks. Major reentrants on both faults have formed where the footwall is composed of weak Mesozoic pelitic rocks. In The Bend area of the Dixie Valley fault, new faults were generated in at least two locations where surface ruptures appear to have refracted from the range front into the pelitic bedrock. These relations may offer clues as to the structural evolution of certain rangefront reentrants.
Fault exposures, relations between fault traces and to-

786
pography, and structural relations across graben profiles are consistent with a fault dip angle as low as 25° along at least a 14-km section of the fault from The Bend south to Little Box Canyon. We have no direct observations of fault dip south of Little Box Canyon. However, the low-angle character of the range-front escarpment and low-angle fractures in the footwall granitic rocks continue southward for another 8 km to just north of Coyote Canyon. North of The Bend, the fault appears to dip more steeply, between 40° and 50° E. It is not known whether the low fault dip observed in The Bend area projects to seismogenic depths or if the fault becomes steeper at depth. Geophysical studies may hold the key to understanding the subsurface fault geometry and, hence, whether or not this section of the Dixie Valley fault provides a true example of an active low-angle normal fault.
Acknowledgments
We thank Ted Worthington, Maria Ducey, Mark Stirling, David Aglietti, and Ken Adams for field assistance and thoughtful discussions. A special thanks goes out to Craig dePolo for his field assistance in Gabbs Valley, helpful ideas and conversations, and encouragement. We also thank Alan Ramelli and John Bell for assistance at various times during the course of this study and also for thought-provoking conversations. Discussions with Tom Rockwell, Fred Niles, Ron Bruhn, and Jerry Miller are greatly appreciated. Gratitude is also extended to Chris Henry for supplying his bedrock maps and interpretations in the Fairview Peak area. This manuscript benefited greatly by many constructive suggestions and thorough BSSA reviews by Michael Machette, Rus Wheeler, and an anonymous reviewer. Thanks to Mark Stirling for reviews of earlier versions of the manuscript. Thanks to Jerry and the boys for inspiration. This work was supported by the U.S. Geological Survey Department of the Interior, under USGS Award 1434-92-G-2183. The views and conclusions contained in this document are those of the author and should not be interpreted as necessarily representing the official policies, either expressed or implied, of the U.S. government. Center for Neotectonics Studies contribution number 18.
References
Abe, K. (1981). Magnitudes oflarge shallow earthquakes from 1904-1980, Phys. Earth Planet. Interiors 27, 72-92.
Aki, K. and P. G. Richards (1980). Quantitative Seismology: Theory and Methods, W. H. Freeman, New York, 932 pp.
Anders, M. H. and N. Christie-Blick (1994). Is the Sevier Desert reflection of west-central Utah a normal fault?, Geology 22, 771-774.
Beanland, S. and M. M. Clark (1995). The Owens Valley fault zone, eastern California, and surface faulting associated with the 1872 earthquake, U.S. Geol. Surv. Bull. 1982, 29 pp.
Bell, J. W. (1984). Quaternary fault map of Nevada, Reno Sheet, Nevada Bureau of Mines and Geology Map 79, Reno.
Bell, 1. and T. Katzer (1990). Timing of late Quaternary faulting in the 1954 Dixie Valley earthquake area, central Nevada, Geology 18, 622-625.
Bell, J. W. and T. Katzer (1987). Surficial geology, hydrology, and late Quaternary tectonics of the IXL Canyon area, Nevada, as related to the 1954 Dixie Valley earthquake, Nevada Bureau of Mines and Geol.
Bull. 102,52 pp. Bonilla, M. G., R. K. Mark, and J. J. Lienkaemper (1984). Statistical re
lations among earthquake magnitude, surface rupture length, and surface displacement, Bull. Seism. Soc. Am. 74,2379-2411.
Bruhn, R. L., W. T. Parry, W. A. Yonkee, and T. Thompson (1994). Fracturing and hydrothermal alteration in nonnal fault zones, Pure Appl. Geophys. 142, 609-644.
S. J. Caskey, S. G. Wesnousky, P. Zhang, and D. B. Slemmons
Burchfiel, B. C., K. V. Hodges, and L. H. Royden (1987). Geology of Panamint Valley-Saline Valley pull-apart system, California: palinspastic evidence for low-angle geometry of a Neogene range-bounding fault, 1. Geophys. Res. 92, 10422-10426.
Caskey, S. J. (1995). Geometric relations of dip slip to a faulted ground surface: new nomograms for estimating components of fault displacement,l. Struct. Geol. 17, ll97-1202.
Chadwick, O. A., S. Hecker, and J. Fonesca (1984). A soils chronosequence at Terrace Creek: studies oflate Quaternary tectonism in Dixie Valley, Nevada, U.S. Geol. Surv. Open-File Rept. 84-90, 35 pp.
Crone, A. 1., M. N. Machette, M. G. Bonilla, 1. 1. Lienkaemper, K. L. Pierce, W. E. Scott, and R. C. Bucknam (1987). Surface faulting accompanying the Borah Peak earthquake and segmentation of the Lost River fault, central Idaho, Bull. Seism. Soc. Am. 77,739-770.
Davis, J. O. (1978). Quaternary tephrochronology of the Lake Lahonton area, Nevada and California, Nevada Archeological Survey Research
Paper No.7, 137 pp. Doser, D. (1986). Earthquake processes in the Rainbow Mountain-Fairview
Peak-Dixie Valley, Nevada region 1954-1959,1. Geophys. Res. 91, 12572-12586.
Doser, D. (1988). Source parameters of earthquakes in the Nevada seismic zone, 1915-1943,1. Geophys. Res. 93, 15001-15015.
Doser, D. 1. and R. B. Smith (1985). Source parameters of the 28 October 1983 Borah Peak, Idaho, earthquake from body wave analysis, Bull.
Seism. Soc. Am. 75, 1041-1051. Ekren, E. B. and F. M. Byers (1986). Geologic map of the Mount Annie
NE, Mount Annie, Ramsey Spring, and Mount Annie SE Quadrangles, Mineral and Nye Counties, Nevada, U.S. Geol. Surv. Misc. In
vest. Series Map, 1-1579.
Gianella, V. P. and E. Callaghan (1933). The earthquake of December 20, 1932, at Cedar Mountain, Nevada and its bearing on the genesis of Basin and Range structure, 1. Geol. 42, 1-22.
Gianella, V. P. and E. Callaghan (1934). The Cedar Mountain, Nevada, earthquake of December 20, 1932, Bull. Seism. Soc. Am. 24, 345-377.
Hanks, T. C. and H. Kanamori (1979). A moment magnitude scale, 1. Geo
phys. Res. 84, 2348-2350. Hansen, W. R. (1965). Effects of the earthquake of March 27, 1964 at
Anchorage, Alaska, U.S. Geol. Surv. Profess. Pap. 542-A, 1-68. Herd, D. G. and C. R. McMasters (1982). Surface faulting in the Sonora,
Mexico, earthquake of 1887 (abstracts with programs), Geol. Soc. Am.
14, 172. Herring, A. T. (1967). Seismic refraction study of a fault zone in Dixie
Valley, Nevada, in Thompson et aI., Geophysical study of BasinRange structure, Dixie Valley region, Nevada: Part VI, Air Force Cambridge Research Laboratories Rept. AFCRL-66-848, 27 pp.
John, D. A. (1995). Tilted middle Tertiary ash-flow calderas and subjacent granitic plutons, southern Stillwater Range, Nevada: cross sections of an Oligocene igneous center, Geol. Soc. Am. 107, 180-200.
Johnson, R. A. and K. L. Loy (1992). Seismic reflection evidence for seismogenic low-angle faulting in southeastern Arizona, Geology 20, 597-600.
Kanamori, H. and C. R. Allen (1986). Earthquake repeat time and average stress drop, Geophys. Monograph 37, 227-235.
Larson, E. R. (1957). Minor features of the Fairview fault, Nevada, Bull.
Seism. Soc. Am. 47,377-386. Lienkaemper, J. 1. (1984). Comparison of two surface-wave magnitude
scales: M of Gutenberg and Richter (1954) and Ms of "preliminary determination of epicenters", Bull. Seism. Soc. Am. 74,2357-2378.
MIT 1985 Geophysics Field Course and S. Biehler (1987). A geophysical investigation of the northern Panamint Valley, Inyo County, California: evidence for possible low-angle normal faulting at shallow depth in the crust, 1. Geophys. Res. 92, 10427-10441.
McDonald, R. E. (1976). Tertiary tectonics and sedimentary rocks along the transition: Basin and Range province to plateau and thrust belt province, Utah, in Symposium on Geology of the Cordilleran Hinge-

Surface Faulting afthe 1954 Fairview Peak (Ms 7.2) and Dixie Valley (Ms 6.8) Earthquakes, Central Nevada 787
line, J. G. Hill (Editor), Rocky Mountain Association of Geologists,
Denver, pp. 281-317. Meister, L. G. (1967). Seismic refraction study of a fault zone in Dixie
Valley, Nevada, in Thompson et al., Geophysical study of BasinRange structure, Dixie Valley region, Nevada: Part VI, Air Force Cambridge Research Laboratories Rept. AFCRL-66-848, 72 pp.
Okaya, D. A. and G. A. Thompson (1985). Geometry of Cenozoic extensional faulting: Dixie Valley, Nevada, Tectonics 4, 107-125.
Page, B. M. (1965). Preliminary geologic map of a part of the Stillwater Range, Churchill County, Nevada, Nevada Bureau of Mines Map 28.
Parry, W. T., D. Hedderly-Smith, and R. L. Bruhn (1991). F1uid inclusions and hydrothermal alteration on the Dixie Valley fault, Nevada, 1.
Geophys. Res. 96, 19733-19748. Pearthree, P., J. Fonesca, and S. Hecker (1986). Patterns of Holocene and
Quaternary faulting in the central Nevada seismic belt: implications for fault behavior in the northern Great Basin, Geol. Soc. Am. Abstracts with Programs 18, 170.
Pearthree, P. A. and T. C. Wallace (1988). Evidence for temporal clustering of large earthquakes in central Nevada, Seism. Res. Lett. 59, 17.
Romanowicz, B. (1992). Strike-slip earthquakes on quasi-vertical transcurrent faults: inferences for general scaling relations, Geophys. Res. Lett. 19,481-484.
Romney, C. (1957). Seismic waves from the Dixie Valley-Fairview Peak earthquakes, Bull. Seism. Soc. Am. 47,301-319.
Ryall, A. and S. D. Malone (1971). Earthquake distribution and mechanism of faulting in the Rainbow Mountain-Dixie Valley-Fairview Peak area, central Nevada, 1. Geophys. Res. 76,7241-7248.
Sarna-Wojcicki, A. M. and J. O. Davis (1991). Quaternary tephrochronology, in Quaternary Nonglacial Geology; Conterminous U.S., R. B. Morrison (Editor), Boulder, CO., Geol. Soc. Am., The Geology of
North America, K-2, 93-116. Savage, J. C. and L. M. Hastie (1969). A dislocation model for the Fairview
Peak, Nevada, earthquake, Bull. Seism. Soc. Am. 59, 1937-1948. Schaefer, D. H. (1983). Gravity survey of Dixie Valley, west-central Ne
vada, U.S. Geol. Surv. Open-File Rept. 82-111, 17 pp. Scholz, C. (1982). Scaling laws for large earthquakes: consequences for
physical models, Bull. Seism. Soc. Am. 72, 1-14. Scholz, C. H. (1994). A reappraisal oflarge earthquake scaling, Bull. Seism.
Soc. Am. 84, 215-218. Scholz, C. H., N. H. Dawers, J. Z. Yu, and M. H. Anders (1993). Fault
growth and fault scaling laws: preliminary results, 1. Geophys. Res. 98,21951-21961.
Sieh, K., L. Jones, E. Hauksson, K. Hudnut, D. Eberhart-Phillips, T. Heaton, S. Hough, K. Hutton, H. Kanamori, A. Lilje, S. Lindvall, S. F. McGill, J. Mori, C. Rubin, J. A. Spotila, J. Stock, H. K. Thio, J. Treiman, B. Wernicke, and J. Zachariasen (1993). Near-field investigations of the Landers earthquake sequence, April to July 1992,
Science 260, 171-176. Slemmons, D. B. (1957). Geological effects of the Dixie Valley-Fairview
Peak, Nevada, earthquakes of December 16, 1954, Bull. Seism. Soc. Am. 47,353-375.
Slemmons, D. B., K. V. Steinbrugge, D. Tocher, G. B. Oakeshott, and V. P. Gianella (1959). Wonder, Nevada, earthquakes of 1903. Bull. Seism. Soc. Am. 49,251-265.
Snay, R. A., M. W. Cline, andE. L. Timmerman (1985). Dislocation models for the 1954 earthquake sequence in Nevada, U.S. Geol. Surv. OpenFile Rept. 85-290, 531-555.
Stauder, W. and A. Ryall (1967). Spacial distribution and source mecha-
nism of microearthquakes in central Nevada, Bull. Seism. Soc. Am. 57,1317-1345.
Stewart, J. H. (1978). Basin-Range structure in western North America: a review, in Cenozoic Tectonics and Regional Geophysics of the Western Cordillera, R. B. Smith and E. P. Eaton (Editors), 1-32.
Stewart, J. H. (1988). Tectonics of the Walker Lane belt, western Great Basin: Mesozoic and Cenozoic deformation in a zone of shear, in Metamorphism and Crustal Evolution of the Western United States, W. G. Ernst (Editor), Prentice Hall, Englewood Cliffs, New Jersey, 683-713.
Stewart, J. H. and J. E. Carlson (1978). Geologic Map of Nevada, U.S. Geol. Surv. in cooperation with Nevada Bureau of Mines and Geology.
Tanimoto, T. and H. Kanamori (1986). Linear programming approach to moment tensor inversion of earthquake sources and some tests on the three-dimensional structure of the upper mantle, Geophys. 1. R. Astr. Soc., 413-430.
Thatcher, W. and M. G. Bonilla (1989). Earthquake fault slip estimation from geologic, geodetic and seismologic observations: implications for earthquake mechanics and fault segmentation, U.S. Geol. Surv. Open-File Rept. 89-315, 386-399.
Thompson, G. A. and D. B. Burke (1973). Rate and direction of spreading in Dixie Valley, Basin and Range Province, Nevada, Geol. Soc. Am. Bull. 84, 627-632.
Tocher, D. (1956). Movement on the Rainbow Mountain fault, Bull. Seism. Soc. Am. 84, 627-632.
Wallace, R. E. (1984a). Patterns and timing of late Quaternary faulting in the Great Basin province and relation to some regional tectonic features,l. Geophys. Res. 89,5763-5769.
Wallace, R. E. (1984b). Fault scarps formed during the earthquakes of October 2, 1915, in Pleasant Valley, Nevada, and some tectonic implications, U.S. Ceol. Surv. Profess. Pap. 1274-A, 1-33.
Wallace, R. E. and R. A. Whitney (1984). Late Quaternary history of the Stillwater seismic gap, Nevada, Bull. Seism. Soc. Am. 74,301-314.
Wells, D. L. and K. J. Coppersmith (1994). New empirical relationships among magnitude, rupture length, rupture width, rupture area, and surface displacement, Bull. Seism. Soc. Am. 84,974-1002.
Whitten, C. A. (1957). Geodedic measurements in the Dixie Valley area, Bull. Seism. Soc. Am. 47,321-325.
Wilden, R. and R. C. Speed (1974). Geology and Mineral Deposits of Churchill County, Nevada Bureau of Mines and Geology Bull. 83,52 pp.
Withjack, M. O. and W. R. Jamison (1986). Deformation produced by oblique rifting, Tectonophysics 126, 99-124.
Witkind, I. J. (1964). Reactivated faults north of Hegben Lake, U.S. Geol. Surv. Profess. Pap. 435-G, 37-50.
Zhang, P., D. B. Slemmons, and F. Mao (1991). Geometric pattern, rupture termination, and fault segmentation of the Dixie Valley-Pleasant Valley active normal fault system, Nevada, U.S.A. 1. Struct. Geol. 13, 165--176.
Center for Neotectonic Studies University of Nevada Reno NY 89557
(SJ.C., S.G.W., D.B.S.) Institute of Geology, State Seismological Bureau Beijing, China
(P.Z.)
Manuscript received 9 May 1995.

\ ,'; 1
39'15'
"
minlmlRTl net RL offset of cbanneJ features across OVerlapping fault strands, 1.6±0.4 m
- RL ,""et of ,hem"" 1.3+0.5·0.3 m
~a4 Turupah Rat ash, exposed In chan~el alluVium
" , ~" .
EXPLANATION (see Plate 1 C)

EXPLANATION
Fault scarp formed in 1954
Bar and ball on downthrown side. Numbers jndicate vertical separation of the ground surface in meters. Dashed lines indicate inferred 1954 traces. Dotted lines indicate surface breaks visible on aerial photos but not in the field. "CS" indicates compound scarps with 1954 offset. "G" indicates presence offault trace graben. Rupture trace between bold "G's" on Dixie Valley fault characterized by essentially continuous fault trace grabens. Hachured lines indicate liquefaction related scarps. Hachures on down-thrown side.
/ (
Pre-1954 fault scarp formed on alluvium
Bar and ball on downthrown side. Dashed lines indicate inferred traces. Numbers on recent pre-1954 scarps in the northern part of Gabbs Valley indicate vertical separation of the ground suiface in meters. Hachured lines indicate scarps interpreted to be related to paleoliquefaction. Hachures on down- thrown side.
APPROXIMATE MEAN DECLINATION
SCALE 1: 48,000
CONTOUR INTERVAL40 FEET (foTBellCanyoll,DWeHotSprings, FOIIlfawayConyon, IXLCanyoJI,Jo/JPe<i<, WestGate, andWOlId<!r
MlZUltainquodrangles) CONTOUR INTERVAL 20 FEET (for BrokenHllls, DrummSummif. DJXU! ValleySE,MOIIIltAlll'lieNE,Pirt1UelleMOIIIltain.andSlaIeMOUIItainquodrongles)
CONTOUR INTERVAL 1 0 FEET (fOT DWeVa/J.eyquodrangle)
MAP OF FAULT SCARPS FORMED DURING THE DECEMBER 16, 1954 FAIRVIEW PEAK
AND DIXIE V ALLEY EARTHQUAKES, CENTRAL NEVADA
By
S. John Caskey. Steve G. Wesnonsky, Peizhen Zhang, and D. Burton Slernmons
(\996)
NEVADA
MAP AREAS FOR PLATES IA-C